Embed Size (px)
Citation preview
ADRRI JOURNAL OF ARTS AND SOCIAL SCIENCES
pISSN: 2343-6891 ISSN-L: 2343-6891
VOL. 11, No.11 (1), February, 2015
Published by Africa Development and Resources Research Institute
1
ADRRI JOURNAL OF ARTS AND SOCIAL SCIENCES
ADRRI JOURNALS (www.adrri.org)
pISSN: 2343-6891 ISSN-L: 2343-6891 VOL. 11, No.11 (1), February, 2015
A Causality Test of the Revenue-Expenditure Nexus in Ghana.
Samuel Kwabena Obeng
Graduate Studies, Department of Economics, Kwame Nkrumah University of
Science and Technology. Email: [email protected] Tel: +233246219421
Received: 24th January, 2015 Revised: 25th February, 2015 Published Online: 28th February, 2015
URL: http://www.journals.adrri.org/ http://www.journals.adrri.com
[Cite as: Obeng, S. K. (2015). A Causality Test of the Revenue-Expenditure Nexus in Ghana. ADRRI Journal
of Arts and Social Sciences, Ghana: Vol. 11, No. 11(1), Pp. 1-19, ISSN: 2343-6891, 28th February, 2015.]
Abstract
The paper investigates the revenue-expenditure nexus for Ghana. The study covers the period 1980-
2013. It examines whether increases in government revenue cause increases in government
expenditure or increases in government expenditure cause increases in government revenue. It also
examines if changes in government expenditure and revenue have feedback effects on each other. The
stationarity test indicates that both variables are stationary at the levels when the test is done with a
constant and a trend, and are first difference stationary when the test is done with a constant but no
trend. The paper analyses the long-run relationship between government expenditure and
government revenue using the Ordinary Least Squares (OLS) method. The short-run relationships
between the two variables are tested in a Vector Autoregressive (VAR) framework. The results show a
very strong long-and short-run relationship between the variables. The second period lag of the
revenue variable shows a negative relationship between government revenue and government
expenditure. This indicates the possibility of the absence of Fiscal illusion in every two years of
increased government expenditure. Granger causality test is done to determine the direction of the
causal relationship between government expenditure and government revenue. The test gives a
unidirectional causality running from revenue to expenditure. This implies government revenue
causes government expenditure. Therefore, evidence of Tax-spend hypothesis is found. The
implication is that, government must improve its revenue generation efforts in order for it to fund its
ever increasing expenditure and to control the frequent fiscal slippages.
Keywords: government revenue, government expenditure, OLS, VAR, Granger-causality

ADRRI JOURNAL OF ARTS AND SOCIAL SCIENCES
pISSN: 2343-6891 ISSN-L: 2343-6891
VOL. 11, No.11 (1), February, 2015
Published by Africa Development and Resources Research Institute
2
INTRODUCTION
Government revenue and expenditure issues are fiscal policy issues. For example,
government expenditure reflects the policy choice of government. That is, a
government’s decision to construct a road (which is a policy choice) is reflected by
the amount spent to make the decision “real”. This expenditure can only be done
when there is revenue. Fiscal policies mainly encompass the use of revenue and
expenditure decisions to affect macroeconomic variables and to stimulate growth.
Governments in most developing countries rely on tariffs, trade receipts and direct
taxes as their major sources of revenue. However, such sources of revenue
generation are hugely inconsistent (except direct taxes) and are affected by such
factors as terms of trade volatility. The inconsistency in revenue generation has the
potential to cause lingering fiscal deficits. Fiscal deficits arise from two main sources;
revenue shortages and excess expenditure. Fiscal deficits in developing countries
(with Ghana not an exception) are caused by expenditures exceeding revenue
receipts. Fiscal deficits have the potential to cause mounting inflation and interest
rates. The increase in interest rates raises the costs of doing business within the
private sector and this may discourage investment. If fiscal deficits are caused by
growing government spending, it leads to exchange rate depreciation, trade deficits
and eventually slows economic growth.
Fiscal deficits have been “normal” for Ghana (at least for over 15 fiscal years) and it
has been caused by expenditures exceeding revenues generated. The low levels of
revenue generated compared to the levels of expenditure may be attributed to the
narrow tax base which leaves a large proportion of the informal sector untaxed.
Moreover, revenue mobilization efforts are inefficient. Besides, the major source of
government domestic revenue in Ghana is direct taxes (ISSER, 2013), which
unfortunately, can potentially be a disincentive to work and may also result in tax
evasion where the tax administration is weak. Potentially, increases in revenues may
also be causing expenditure increases which create the lingering fiscal deficits Ghana
is battling with. For example, both foreign and domestic borrowing receipts
augment local revenues and therefore incite increased government expenditure
(Barua, 2005). Moreover, other sources of government revenue such as aid has the
potential to increase government expenditure as they shore up the amount of
revenue available to fund government expenditure (see Heller, 1975; McGillivray
and Morissey, 2000; Remmer, 2004; Osei et al. 2005; Sakyi, 2013).
Fiscal deficits may however not be necessarily negative since they can be used to
stimulate growth in important areas of the economy. For instance, a fiscal deficit of
less than or equal to 1.5 percent of GDP enhances growth but a fiscal deficit greater
than 1.5 percent of GDP inhibits growth (Adam and Bevan, 2005). The worrying
trend however is that Ghana’s government expenditure patterns currently favour

ADRRI JOURNAL OF ARTS AND SOCIAL SCIENCES
pISSN: 2343-6891 ISSN-L: 2343-6891
VOL. 11, No.11 (1), February, 2015
Published by Africa Development and Resources Research Institute
3
recurrent expenditure as against capital expenditure (ISSER, 2013). This is
particularly a “negative” trend as such expenditure is not growth enhancing.
Fiscal deficits can be addressed from either expenditure or revenue angles or both. In
other words, expenditures may be reduced or revenues increased or both may be
done concurrently to address fiscal deficits. Which of these approaches will be
appropriate and effective in Ghana’s case needs to be investigated. Hence, an
empirical investigation of the revenue-expenditure nexus will be necessary to inform
policy choice.
Eita and Mbazimba (2008) indicate that the causal relationship between government
expenditure and government revenue has been unclear. The results even conflict in
some cases. Therefore, policy recommendations differ depending on the direction of
causality obtained (Mehrara et. al, 2011). This paper investigates whether
government revenues generated from both domestic and foreign sources stimulate
government expenditure. Furthermore, it determines if government expenditure
decisions cause increases in revenue generation. Government revenue and
expenditure; what causes what? Is the causality unidirectional, bidirectional or no
causality exists at all?
The rest of the paper is organized as follows: Section two discusses the theoretical
and empirical literature on the revenue-expenditure nexus. Section three presents
the methodology used in this study. The empirical results are stated and discussed
in Section four while Section five concludes and makes policy recommendations
based on the findings.
LITERATURE REVIEW
Theoretical Literature
Four main hypotheses explain the government revenue and expenditure nexus.
These are the Tax and Spend, Spend-and-Tax, Fiscal Synchronization and Fiscal
Neutrality hypotheses.
Friedman (1978) states the Tax-and-Spend hypothesis. The argument follows that,
changes in government revenue cause changes in government expenditure. Stated
differently, raising taxes leads to more expenditure (Narayan, 2005). This is because,
governments desire to spend and they will spend whatever becomes available
(Young, 2009). Moreover, tax cuts reduce revenue levels and therefore result in
higher deficits. This must cause governments to be sensitive to how much they
spend (Moalusi, 2004). Buchanan and Wagner (1978) however argue contrarily. They
state that, taxes have a rather negative effect on government spending. This is
because, the citizenry tend to believe the cost of government services has reduced
when taxes are cut. They will therefore “vote for” higher government expenditure.
ADRRI JOURNAL OF ARTS AND SOCIAL SCIENCES
pISSN: 2343-6891 ISSN-L: 2343-6891
VOL. 11, No.11 (1), February, 2015
Published by Africa Development and Resources Research Institute
4
Revenues fall and expenditures rise, resulting in fiscal deficits. Hence, taxes must
rather increase in order to solve fiscal deficits (Moulasi, 2004).
Spend-and-Tax hypothesis argues that expenditure causes revenue. In other words,
increases in expenditure necessitate increases in revenue. Peacock and Wiseman
(1961) posit that a tolerable level of taxation exist which sets a constraint on
government expenditure. They state further that, government expenditure increases
with GNP as an economy grows. This is because, income levels rise, leading to
increases in tax revenues collected from taxes which have constant tax rates.
Therefore, public expenditure trends upwards in normal times. The trend would
however be disturbed during periods of social upheavals such as war, famine and
large-scale social disaster that require a rapid increase in public expenditure.
Taxation levels would therefore have to rise in order to finance such increased levels
of government expenditure. The high taxation levels will be regarded as acceptable
by the citizens during such crisis periods. This is what Peacock and Wiseman
referred to as the “Displacement Effect”. Stated differently, public expenditure is
displaced upwards and for the crisis period displaces private expenditure for public
expenditure. Public expenditure does not fall to the original levels even after the
crisis. Moreover, the citizenry become aware of the social problems during the
period of the crisis. An “inspection effect” may therefore arise, making higher
government expenditure possible in order to solve the social problems. This is
possible because the levels of taxation tolerated by the citizenry do not return to
former levels. Hence, the increases in taxes as a result of the crisis will now become
permanent tax policies (Narayan, 2005).
According to the Fiscal synchronization hypothesis (Musgrave, 1966; Meltzer and
Richard, 1981), there exists a bidirectional causal relationship (see Chang, 2009)
between government expenditure and government revenue. That is government
expenditure causes government revenue which in-turn causes government
expenditure. Stated differently, government expenditure causes government
revenue with a feedback effect. This is so because expenditure and revenue decisions
are made concurrently. The result is that, changes in them occur simultaneously.
Policy makers decide on the revenue and expenditure levels by comparing the
marginal costs and marginal benefits of government activities (Narayan, 2005). This
view is supported by the tax smoothing model (see Barro, 1979) which is based on
the Ricardian Equivalence argument. Fiscal surplus or deficit may still occur under
this circumstance because governments mostly have different economic policy
targets, even though expenditure and revenue decisions move together.
The final hypothesis is the Fiscal neutrality hypothesis stated by Baghestani and
McNown (1994). The argument follows that, revenue and expenditure decisions are
made independent of each other. Therefore, no causal relationship exists between

ADRRI JOURNAL OF ARTS AND SOCIAL SCIENCES
pISSN: 2343-6891 ISSN-L: 2343-6891
VOL. 11, No.11 (1), February, 2015
Published by Africa Development and Resources Research Institute
5
government expenditure and government revenue. Expenditures are determined by
the requirement of the citizenry and revenue will depend on the maximum amount
of tax the citizenry can support. Hence, it is only by a matter of coincidence that
fiscal equilibrium can be achieved. This is possible because, economic growth
ensures that in the long-run, institutions become more separate and independent.
This therefore makes it possible for expenditure and revenue decisions to be made
separately.
Empirical Literature
We begin by analysing empirical literature from individual country studies. The
section concludes with an analysis of empirical panel data results.
Li (2001), finds evidence of Tax-spend hypothesis in China. The paper covers the
period 1950-1997. The error correction method was employed to test the direction of
causality between government revenue and expenditure. The results give evidence
to a unidirectional causality running from revenue to expenditure, implying the Tax-
spend hypothesis. Eita and Mbazima (2008) test the revenue expenditure nexus for
Namibia. Their results validate the Tax-spend hypothesis for Namibia for the period
1977-2007. They adopt Vector Autoregression (VAR), Johansen cointegration test and
a Granger causality test. Amoah and Loloh (2008) employ the Engel Granger
bivariate cointegration and an error correction model to examine the revenue-
expenditure nexus in Ghana for the period 1983-2007. Evidence for the Tax-spend
hypothesis is found in the short-run. In a Granger causality test of US federal data
for the period 1953:3 to 2007:4 under an error correction model framework, Young
(2009) finds evidence for Tax-spend hypothesis. The paper further shows that fiscal
illusion is largely absent over the period considered by the study. Obioma and
Ozughalu (2010) uses Engel-Granger two-step cointegration technique, the Johansen
cointegration method and the Granger causality test within the error correction
model framework to investigate the nexus in Nigeria for the period 1970-2007.
Causality is seen to run unidirectional from revenue to expenditure, providing
evidence for the Tax-spend hypothesis. Nanthakumar et al. (2011) find support for
Tax-spend hypothesis in Malaysia over the period 1970-2009. The Autoregressive
Distributed Lag (ARDL) method and Toda-Yamamoto MWALD Granger causality
tests are employed to determine the direction of causality, which turns out to be
unidirectional, running from revenue to expenditure. Under Engel-Granger
cointegration and Granger causality tests, Al-Khulaifi (2012) finds support for the
Tax-spend hypothesis in Qatar for the period 1980-2011.
Carneiro et al. (2005) investigates the nexus for Guinea-Bissau over the period 1981-
2002 and find evidence for Spend-tax hypothesis. The study is done using a Granger
causality test in an error correction model (ECM) framework. Amoah and Loloh
(2008) gives evidence for the validity of the Spend-tax hypothesis in Ghana in the

ADRRI JOURNAL OF ARTS AND SOCIAL SCIENCES
pISSN: 2343-6891 ISSN-L: 2343-6891
VOL. 11, No.11 (1), February, 2015
Published by Africa Development and Resources Research Institute
6
long-run. Dogan (2013) employs Johansen cointegration and Granger causality test
in a vector error correction model (VECM) framework to test the nexus for Turkey
for the period 1924-2011. The paper finds a unidirectional causality running from
government expenditure to government revenue, implying the validity of the
Spend-tax hypothesis. Evidence for the Spend-tax hypothesis is also found for
Greece for the period 1833-2009, by Richter and Dimitrios (2013). The paper uses the
Johansen cointegration approach and the Granger causality test.
For the period 1977-1999 in China, Chang and Ho (2002) find evidence for Fiscal
synchronization. GDP is used as a control variable. The research is done in a
Multivariate error correction model (MVECM) framework and using a Granger
causality test. The Johansen cointegration approach is also adopted. Al-Zeaud (2012)
undertakes a Granger causality test in a VECM framework to investigate the nexus
in Jordan for the period 1990-2011, and finds evidence for the Fiscal synchronization
hypothesis. Elyasi and Rahimi (2012) find similar results for Iran over the period
1963-2007, using the Autoregressive Distributed Lag (ARDL) approach and a
Granger causality test. Doh-Nani and Awunyo-Vitor (2012) finds bidirectional
causality between revenue and expenditure for Ghana for the period 1960-2007. The
paper uses the Granger causality test. Aregbeyen and Insah (2013) find similar
results for Ghana and Nigeria for 1980-2010. They use the Dynamic Ordinary Least
Squares (DOLS) method, the Johansen cointegration approach and a Granger
causality test in an ECM framework.
Nyamongo et al. (2004) provides evidence for Fiscal neutrality in the short-run and
Tax-spend hypothesis in the long-run, in South Africa. The paper uses monthly data
for the period October 1994 to June 2004. The methods employed are Seasonal unit
root tests, Johansen cointegration and VECM causality tests. Ndoricimpa (2013)
adopts Threshold cointegration test with Asymmetric ECM and finds support for the
Fiscal neutrality hypothesis for Burundi using monthly data from 1997:1-2013:5.
The results for multi-country studies are also mixed. Cashin et al. (1999) find
evidence for tax-smoothing for Pakistan over the period 1956 to 1995. This lends
support to the Fiscal synchronization hypothesis. However, in the same study, there
is no such evidence for Sri Lanka for 1964-1997. Fasano and Wang (2002) support
Tax-spend hypothesis in 6 Gulf Cooperation Council (GCC) countries. They use the
Johansen cointegration approach and causality is examined in an ECM framework.
AbuAI-Foul and Baghestani (2004) employing VAR and an ECM approach find
support for Tax-spend hypothesis in Egypt (1977-1998) and evidence for Fiscal
synchronization in Jordan (1975-2001). Narayan (2005) examines the nexus for 9
Asian countries. The paper uses the ARDL bounds testing approach and a VECM to
test the direction of causality. The results support Tax-spend hypothesis in
Singapore, Indonesia, Sri Lanka in the short-run and for Nepal both in the long-and
ADRRI JOURNAL OF ARTS AND SOCIAL SCIENCES
pISSN: 2343-6891 ISSN-L: 2343-6891
VOL. 11, No.11 (1), February, 2015
Published by Africa Development and Resources Research Institute
7
short-run. Evidence of Spend-tax hypothesis is found for Indonesia and Sri Lanka.
The findings provide evidence for Fiscal neutrality for India, Malaysia, Pakistan,
Philippines, Thailand and Singapore. Narayan and Narayan (2006) investigates the
relationship for 12 developing countries, adopting the Toda and Yamamoto non-
causality test. Fiscal neutrality is found for Ecuador, Guatemala, Guyana, Peru,
South Africa and Uruguay. The results for Haiti indicates Fiscal synchronization
hypothesis, while Tax-spend hypothesis is evident for Chile, El Salvador, Mauritius,
Paraguay and Venezuela. Wolde-Rufael (2008) employs the same Toda and
Yamamoto causality test for 13 African countries. The results give evidence for the
Tax-spend hypothesis for Ghana, Ethiopia, Kenya, Nigeria, Mali and Zambia.
Support for the Spend-Tax hypothesis is found for Burkina Faso, Fiscal
synchronization hypothesis is found for Mauritius, Swaziland and Zimbabwe, while
Fiscal neutrality exists for Botswana, Burundi and Rwanda. Afonso and Rault (2009)
adopt Bootstrap Panel Analysis for 25 European countries. Tax-spend hypothesis is
supported for Germany, Belgium, Austria, Finland, UK and many new European
Union (EU) member states. Evidence for Spend-tax hypothesis is found for Italy,
France, Spain, Greece and Portugal. Vamvoukas (2011) employs two-variable and
three-variable panel model estimations, using the Two-Stage Least Squares (TSLS)
and the Generalized Moments Method (GMM) techniques and a Granger causality
test to determine the relationship for 15 EU countries. The results provide support
for the Fiscal synchronization hypothesis. Magazzino (2012) finds a weak long-run
relationship between government expenditure and government revenue in WAMZ
countries. The paper investigates the relationship for 15 ECOWAS countries. Tax-
spend hypothesis is supported by the results from Gambia, Liberia, Nigeria and
Sierra Leone; support for Fiscal synchronization is found for Mali; Spend-tax
hypothesis is evident Burkina Faso, Senegal. Togo, Cape Verde and Guinea; and
Fiscal neutrality is evident in Benin, Cote d’Ivoire, Guinea Bissau and Ghana. The
study is done in a Panel data analysis framework and using a Panel cointegration
test. Finally, Hamdi and Sbia (2013) undertakes a Panel data analysis of 6 GCC
countries. They use GDP as a control variable. The paper employs Toda and
Yamamoto procedure and a modified standard VAR method for the period 1990-
2010. Evidence is found for Spend-tax hypothesis in Qatar and United Arab Emirates
(UAE) while Tax-spend is valid for Saudi Arabia.
METHODOLOGY
A bivariate regression equation is used to investigate the relationship between
government expenditure and government revenue. The relationship is determined
in both ways. Therefore, the equations are given as:
0 1ln lnt t tE R (1)
0 1ln lnt t tR E (2)

ADRRI JOURNAL OF ARTS AND SOCIAL SCIENCES
pISSN: 2343-6891 ISSN-L: 2343-6891
VOL. 11, No.11 (1), February, 2015
Published by Africa Development and Resources Research Institute
8
Where tE and tR represent real government expenditure and government revenue
respectively. 1 and 1 are the coefficients of government revenue and government
expenditure respectively in their respective equations. ln is the logarithm operator.
The use of logarithms allows the coefficients to be interpreted as elasticities. t and
t are the error terms in their respective equations.
The researcher’s source of data is the International Monetary Fund (IMF)
International Financial Statistics (IFS, 2014). Government expenditure and revenue
are given in real terms. They are deflated using the Consumer Price Index (CPI).
Data used covers the period 1980-2013.
Estimation strategy
We test for stationarity in the series. The null hypothesis of the existence of a unit-
root and hence, non-stationarity is tested against the alternative hypothesis of
stationarity and hence, no unit root. If the mean, variance and covariance of a time
series are invariance with respect to time, then the series is integrated of order zero,
I(0). If stationarity occurs only after first differencing, then the series is integrated of
order one, I(1). The test is done using the Augmented Dickey-Fuller (ADF) and the
Phillips-Perron (PP) tests for unit root. The test is done for both the levels and the
first differences of the series. We consider a unit root test with a constant and a
constant and a trend. The Akaike Information Criterion (AIC) is employed to
determine the maximum lag length. The maximum lag length is two (2).
In the face of I(0) series, the existence and validity of a long-run relationship will be
tested by employing the Ordinary Least Squares (OLS) method. Given this, a vector
autoregressive (VAR) model will be used to determine the short-run properties of
the model. If the coefficients of the variables in the VAR model are jointly significant,
then they imply the possible existence of a causal relationship between the variables.
Finally, a Granger causality test will be done within the VAR framework, to
determine the causal relationship between the variables in the model. We test the
null hypothesis of no Granger causality against the alternative hypothesis of the
presence of Granger causality. The rejection of the null hypothesis implies the
existence of Granger causality.
RESULTS AND DISCUSSIONS
The empirical results and findings are presented and discussed here. We begin with
the discussion of the unit root results. We then move on to discuss the long-run and
short-run results estimated by the OLS and VAR approaches respectively. We
conclude by discussing the Granger causality test results.
ADRRI JOURNAL OF ARTS AND SOCIAL SCIENCES
pISSN: 2343-6891 ISSN-L: 2343-6891
VOL. 11, No.11 (1), February, 2015
Published by Africa Development and Resources Research Institute
9
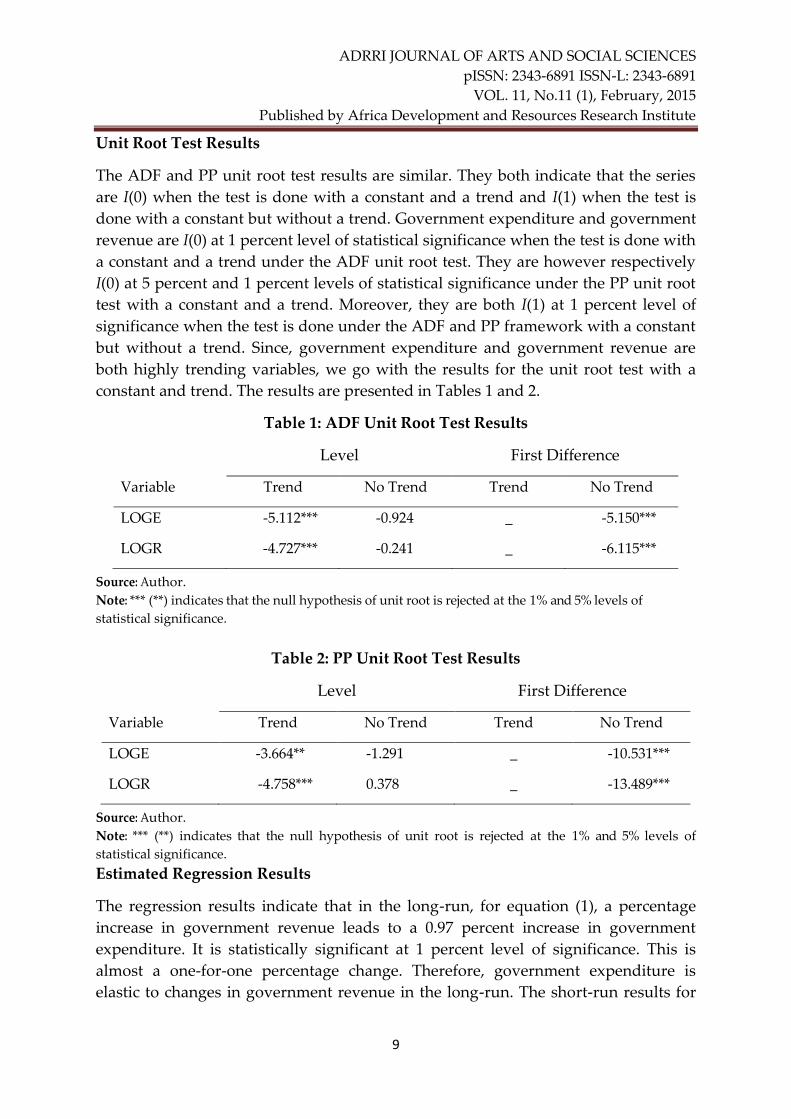
Unit Root Test Results
The ADF and PP unit root test results are similar. They both indicate that the series
are I(0) when the test is done with a constant and a trend and I(1) when the test is
done with a constant but without a trend. Government expenditure and government
revenue are I(0) at 1 percent level of statistical significance when the test is done with
a constant and a trend under the ADF unit root test. They are however respectively
I(0) at 5 percent and 1 percent levels of statistical significance under the PP unit root
test with a constant and a trend. Moreover, they are both I(1) at 1 percent level of
significance when the test is done under the ADF and PP framework with a constant
but without a trend. Since, government expenditure and government revenue are
both highly trending variables, we go with the results for the unit root test with a
constant and trend. The results are presented in Tables 1 and 2.
Table 1: ADF Unit Root Test Results
Level First Difference
Variable Trend No Trend Trend No Trend
LOGE -5.112*** -0.924 _ -5.150***
LOGR -4.727*** -0.241 _ -6.115***
Source: Author.
Note: *** (**) indicates that the null hypothesis of unit root is rejected at the 1% and 5% levels of
statistical significance.
Table 2: PP Unit Root Test Results
Level First Difference
Variable Trend No Trend Trend No Trend
LOGE -3.664** -1.291 _ -10.531***
LOGR -4.758*** 0.378 _ -13.489***
Source: Author.
Note: *** (**) indicates that the null hypothesis of unit root is rejected at the 1% and 5% levels of
statistical significance.
Estimated Regression Results
The regression results indicate that in the long-run, for equation (1), a percentage
increase in government revenue leads to a 0.97 percent increase in government
expenditure. It is statistically significant at 1 percent level of significance. This is
almost a one-for-one percentage change. Therefore, government expenditure is
elastic to changes in government revenue in the long-run. The short-run results for
ADRRI JOURNAL OF ARTS AND SOCIAL SCIENCES
pISSN: 2343-6891 ISSN-L: 2343-6891
VOL. 11, No.11 (1), February, 2015
Published by Africa Development and Resources Research Institute
10
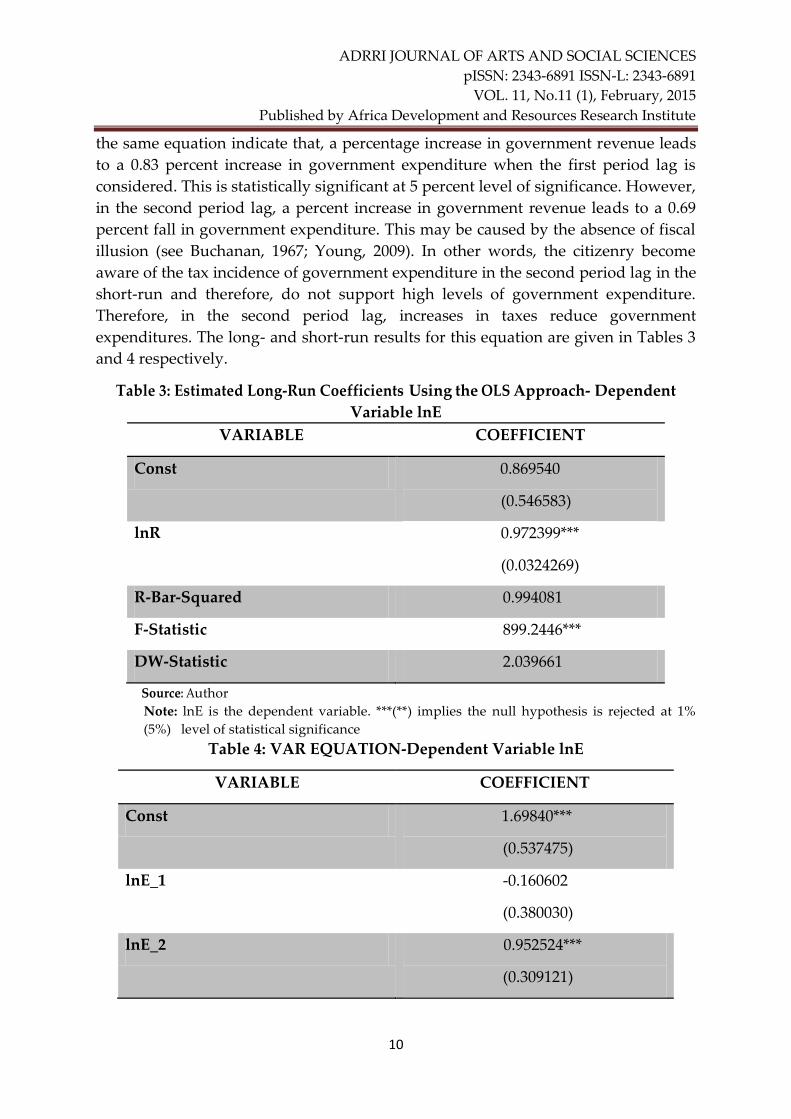
the same equation indicate that, a percentage increase in government revenue leads
to a 0.83 percent increase in government expenditure when the first period lag is
considered. This is statistically significant at 5 percent level of significance. However,
in the second period lag, a percent increase in government revenue leads to a 0.69
percent fall in government expenditure. This may be caused by the absence of fiscal
illusion (see Buchanan, 1967; Young, 2009). In other words, the citizenry become
aware of the tax incidence of government expenditure in the second period lag in the
short-run and therefore, do not support high levels of government expenditure.
Therefore, in the second period lag, increases in taxes reduce government
expenditures. The long- and short-run results for this equation are given in Tables 3
and 4 respectively.
Table 3: Estimated Long-Run Coefficients Using the OLS Approach- Dependent
Variable lnE
VARIABLE COEFFICIENT
Const 0.869540
(0.546583)
lnR 0.972399***
(0.0324269)
R-Bar-Squared 0.994081
F-Statistic 899.2446***
DW-Statistic 2.039661
Source: Author
Note: lnE is the dependent variable. ***(**) implies the null hypothesis is rejected at 1%
(5%) level of statistical significance
Table 4: VAR EQUATION-Dependent Variable lnE
VARIABLE COEFFICIENT
Const 1.69840***
(0.537475)
lnE_1 -0.160602
(0.380030)
lnE_2 0.952524***
(0.309121)

ADRRI JOURNAL OF ARTS AND SOCIAL SCIENCES
pISSN: 2343-6891 ISSN-L: 2343-6891
VOL. 11, No.11 (1), February, 2015
Published by Africa Development and Resources Research Institute
11
lnR_1 0.832629**
(0.385574)
lnR_2 -0.693882**
(0.294871)
R-Bar-Squared 0.970639
F-Statistic 257.2098***
DW-Statistic 1.618998
Source: Author
Note: lnE is the dependent variable. ***(**) implies the null hypothesis is rejected at 1%
(5%) level of statistical significance
For equation (2), the long-run results in Table 5 show that, a percentage increase in
government expenditure leads to a 0.99 percentage increase in government revenue.
The result is statistically significant at 1 percent level of significance. The implication
is that, an elastic relationship exists between government revenue and government
expenditure over the period. The effect of expenditure increases on revenue
generation efforts is approximately one-for-one. The short-run results in Table 6
indicate that, a percentage increase in government expenditure increases
government revenue by 1.16 percent in the second period lag. This is fairly highly
elastic and it is statistically significant at 1 percent level of significance. The long-
and short-run results confirm similar results obtained by Aregbeyen and Insah
(2013) for Ghana. Interestingly, a percentage increase in revenue in the first period
lag increases current government revenue by 1.24 percent while a percentage
increase in government revenue in the second period lag reduces current revenue by
0.9 percent.

ADRRI JOURNAL OF ARTS AND SOCIAL SCIENCES
pISSN: 2343-6891 ISSN-L: 2343-6891
VOL. 11, No.11 (1), February, 2015
Published by Africa Development and Resources Research Institute
12
Table 5: Estimated Long-Run Coefficients Using the OLS Approach-Dependent
Variable lnR
VARIABLE COEFFICIENT
Const -0.200716
(0.510026)
lnE 0.988424***
(0.0297486)
R-Bar-Squared 0.993540
F-Statistic 1103.961***
DW-Statistic 1.933343
Source: Author
Note: lnR is the dependent variable. ***(**) implies the null hypothesis is rejected at 1%
(5%) level of statistical significance
Table 6: VAR EQUATION-Dependent Variable lnR
VARIABLE COEFFICIENT
Const 1.47627**
(0.547391)
lnE_1 -0.593759
(0.387041)
lnE_2 1.16380***
(0.314824)
lnR_1 1.23757***
(0.392688)
lnR_2 -0.880552***
(0.300311)
R-Bar-Squared 0.969331
F-Statistic 245.9500***
DW-Statistic 1.621456
ADRRI JOURNAL OF ARTS AND SOCIAL SCIENCES
pISSN: 2343-6891 ISSN-L: 2343-6891
VOL. 11, No.11 (1), February, 2015
Published by Africa Development and Resources Research Institute
13
Note: lnR is the dependent variable. ***(**) implies the null hypothesis is rejected at 1% (5%) level
of statistical significance
The F-statistic in the various estimated regression results is statistically significant at
1 percent level of significance. It indicates that the coefficients are jointly significant.
Especially for the short-run results, the fact that the F-statistic for each equation is
statistically significant at 1 percent level of significance indicates the possibility of
the validity of a causal relationship.
Granger Causality Test Results
The validity of the long-run and short-run relationships permits a Granger-causality
test to be done. Causality may therefore run in at least one direction (see Engel and
Granger, 1987). Pairwise Granger causality tests are done. We test the null
hypothesis of the absence of Granger causality against the alternative hypothesis of
the presence of Granger causality. In fact, Granger Causality test is actually a
predictability test. That is, it indicates how much of the current government revenue
and government expenditure can be explained by previous levels of government
revenue and government expenditure, and if the explanation can be improved when
lagged values of government revenue and government expenditure are added (see
Al-Zeaud, 2012).
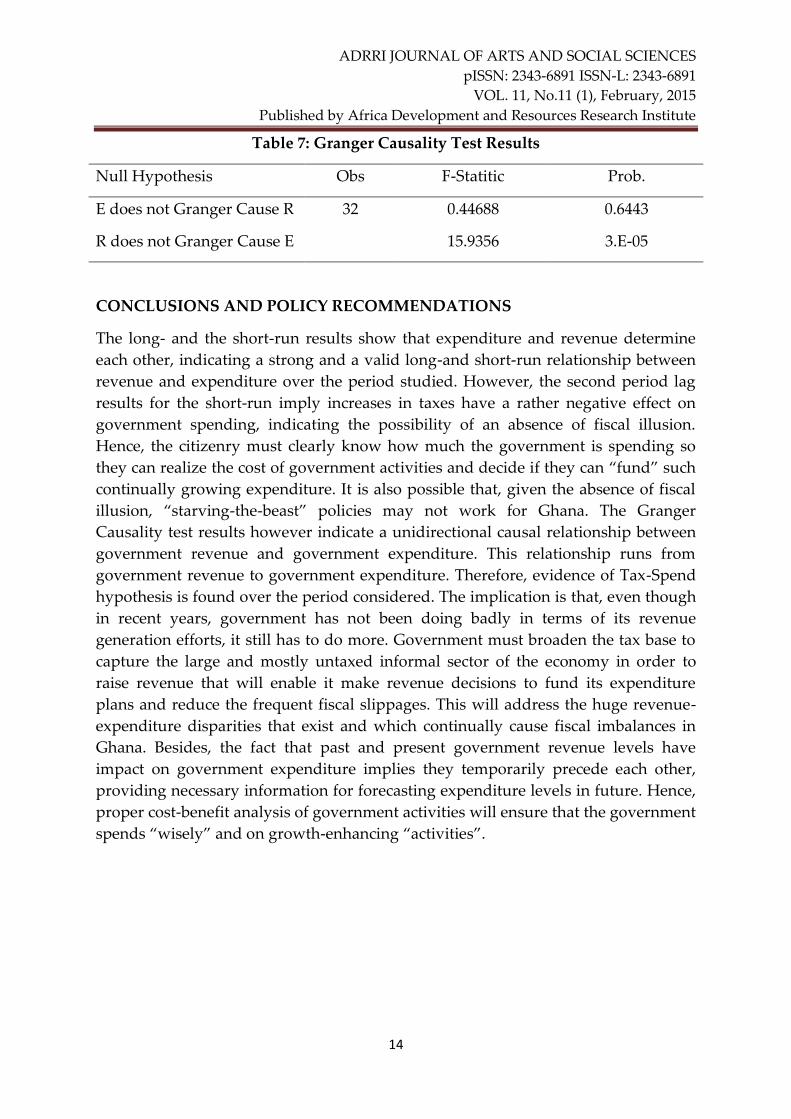
From the Granger causality results in Table 7, there exists a causal relationship
between government expenditure and government revenue. The causality is
unidirectional and very strong. Specifically, government revenue causes government
expenditure. Therefore, we find evidence of Tax-spend hypothesis. In other words,
increases in government revenue lead to increases in government expenditure
without a feedback effect. This is similar to the evidence of a unidirectional revenue-
expenditure nexus running from revenue to expenditure found for Ghana by
previous studies (see Amoah and Loloh, 2008; Wolde-Rufael, 2008). Contrarily, Doh-
Nani and Awunyo-Vitor (2012), and Aregbeyen and Insah (2013) find evidence of
bidirectional causality for Ghana running from revenue to expenditure and from
expenditure to revenue while Magazzino (2012) find evidence of fiscal neutrality for
Ghana. It must however be stated that revenue and expenditure are both influenced
by the level of economic activity. Therefore, the presence of Granger causality does
not necessarily differentiate the direct causality between revenue and expenditure
and the indirect causality effects through GDP (see Narayan and Narayan, 2009;
Chang and Chiang, 2009; Mehrara et. al, 2011). Moreover, a non-linear relationship
may exist between government expenditure and government revenue and other
variables which are not indicated in the model since Granger causality only tests
linear relationships.
ADRRI JOURNAL OF ARTS AND SOCIAL SCIENCES
pISSN: 2343-6891 ISSN-L: 2343-6891
VOL. 11, No.11 (1), February, 2015
Published by Africa Development and Resources Research Institute
14
Table 7: Granger Causality Test Results
Null Hypothesis Obs F-Statitic Prob.
E does not Granger Cause R 32 0.44688 0.6443
R does not Granger Cause E 15.9356 3.E-05
CONCLUSIONS AND POLICY RECOMMENDATIONS
The long- and the short-run results show that expenditure and revenue determine
each other, indicating a strong and a valid long-and short-run relationship between
revenue and expenditure over the period studied. However, the second period lag
results for the short-run imply increases in taxes have a rather negative effect on
government spending, indicating the possibility of an absence of fiscal illusion.
Hence, the citizenry must clearly know how much the government is spending so
they can realize the cost of government activities and decide if they can “fund” such
continually growing expenditure. It is also possible that, given the absence of fiscal
illusion, “starving-the-beast” policies may not work for Ghana. The Granger
Causality test results however indicate a unidirectional causal relationship between
government revenue and government expenditure. This relationship runs from
government revenue to government expenditure. Therefore, evidence of Tax-Spend
hypothesis is found over the period considered. The implication is that, even though
in recent years, government has not been doing badly in terms of its revenue
generation efforts, it still has to do more. Government must broaden the tax base to
capture the large and mostly untaxed informal sector of the economy in order to
raise revenue that will enable it make revenue decisions to fund its expenditure
plans and reduce the frequent fiscal slippages. This will address the huge revenue-
expenditure disparities that exist and which continually cause fiscal imbalances in
Ghana. Besides, the fact that past and present government revenue levels have
impact on government expenditure implies they temporarily precede each other,
providing necessary information for forecasting expenditure levels in future. Hence,
proper cost-benefit analysis of government activities will ensure that the government
spends “wisely” and on growth-enhancing “activities”.
ADRRI JOURNAL OF ARTS AND SOCIAL SCIENCES
pISSN: 2343-6891 ISSN-L: 2343-6891
VOL. 11, No.11 (1), February, 2015
Published by Africa Development and Resources Research Institute
15
REFERENCE
AbuAI-Foul B., and Baghestani H (2004). The Causal Relation between Government
Revenue and Spending: Evidence from Egypt and Jordan. Journal of Economics
and Finance, 28, 260-269.
Adam S.C. and Bevan D. (2005). Fiscal Deficit and Growth in Developing Countries.
Journal of Public Economics, 89, pp. 571-597.
Afonso A., and Rault C. (2009). Bootstrap Panel Granger-Causality between
Government Spending and Revenue in the EU. Economics Bulletin, 29 (4), pp.
2542-2548
Al-Khulaifi A.S. (2012). The Relationship between Government Revenue and
Expenditure in Qatar: A Cointegration and Causality Investigation.
International Journal of Economics and Finance, Vol.4, No. 9.
Al-Zeaud A. H. (2012). Government Revenues and Expenditure: Causality Tests for
Jordan. Interdisciplinary Journal of Contemporary Research in Business, Vol. 4, No.
7.
Amoah B. and Loloh F.W. (2008). Causal Linkages between Government Revenue
and Government Spending: Evidence from Ghana. Bank of Ghana, Working
Paper, WP/BOG-2008/08.
Aregbeyen O. and Insah B. (2013). A Dynamic Analysis of the Link between Public
Expenditure and Public Revenue in Nigeria and Ghana. Journal of Economics
and Sustainable Development, Vol.4, No.4.
Baghestani H and McNown R. (1994). Do Revenues Respond to Budgetary
Disequilibria? Southern Economic Journal, 61, 311-322.
Barro R. (1979). On the Determination of Public Debt. Journal of Political Economy, 87,
940-971.
Barua S. (2005). An Examination of the Revenue Expenditure Causality in
Bangladesh: 1974-2004. Bangladesh Bank of Policy Analysis Unit Working
Paper Series WP 0605.
Buchanan J.M and Wagner R.W. (1978). Dialogues Concerning Fiscal Religion.
Journal of Monetary Economics, 4, 627-636.
Carniero F.G., Faria J.R., and Barry B.S. (2004). Government Revenue and
Expenditures in Guinea-Bissau: Causality and Cointegration. World Bank
Group Africa Region Working Paper Series No. 65.

ADRRI JOURNAL OF ARTS AND SOCIAL SCIENCES
pISSN: 2343-6891 ISSN-L: 2343-6891
VOL. 11, No.11 (1), February, 2015
Published by Africa Development and Resources Research Institute
16
Cashin P., Haque N., Olekalns N. (1999). Spend Now, Pay Later? Tax Smoothening
and Fiscal Sustainability in South Asia. IMF Working Paper WP/99/63.
Chang T. (2009). Revisiting the Revenue-Expenditure Nexus: Evidence from 15
OECD Countries based on the Panel Data Approach. Czech Journal of
Economics and Finance, Vol. 59, No. 2, pp. 165-172.
Chang T., and Ho Y.H. (2002). A Note on Testing Tax-and-Spend, Spend-and-Tax, of
Fiscal Synchronization: The Case of China. Journal of Economic Development,
Vol. 27, No. 1, pp. 151-160.
Dogan E. (2013). Does “Revenue-led Spending” or “Spending-led Revenue”
Hypothesis Exist in Turkey? British Journal of Economics, Finance and
Management Sciences, Vol. 8 (2).
Doh-Nani R. and Awunyo-Vitor D. (2012). The Causal Link between Government
Expenditure and Government Revenue in Ghana. Asian Economic and Financial
Review, Vol 2, No. 2, pp. 382-388.
Eita J.H. and Mbazima D. (2008). The Causal Relationship between Government
Revenue and Expenditue in Namibia. Munich Personal Repec Archive (MPRA)
Paper No. 9154.
Elyasi Y. and Rahimi M. (2012). The Causality between Government Revenue and
Government Expenditure in Iran. International Journal of Economic Sciences and
Applied Research, 5 (1): 129-145.
Fasano U and Wang Q. (2002). Testing the Relationship between Government
Spending and Revenue: Evidence from GCC Countries. IMF Working Paper
WP/02/201.
Friedman M. (1978). The Limitations of Tax Limitation. Policy Review, Vol. 5, No. 78,
pp. 7-14.
Hamdi H. and Sbia R. (2013). Re-Examining Government Revenue, Government
Spending and Economic Growth in GCC Countries. The Journal of Applied
Business Research, Volume 29, Number 3.
Heller P.S. (1975). A Model of Public Fiscal Behaviour in Developing Countries: Aid,
Investment and Taxation. The American Economic Review, 65, 429-45.
International Monetary Fund (2014). International Financial Statistics. Washington,
DC: International Monetary Fund.
ISSER (2013). Policies and Options for Ghana’s Economic Development. Legon:
Institute of Statistical, Social and Economic Research, University of Ghana.

ADRRI JOURNAL OF ARTS AND SOCIAL SCIENCES
pISSN: 2343-6891 ISSN-L: 2343-6891
VOL. 11, No.11 (1), February, 2015
Published by Africa Development and Resources Research Institute
17
Li X. (2001). Government Revenue, Government Expenditure and Temporal
Causality: Evidence from China. Applied Economics, 33, 4, pp. 485-497.
Magazzino C. (2012). Revenue and Expenditure Nexus: A Case Study of ECOWAS.
Economics-EJournal, Discussion Paper, No 2012-57. Also in Economics-
EJournal, Discussion Paper, No 2013-13.
McGilliviary M. and Morrisey O. (2000). Aid Fungibility in Assessing Aid: Red
Herring or True Concern? Journal of International Development, 12, 413-28.
Meltzer A.H, and Richard S.F. (1981). A Rational Theory of the Size of Government.
Journal of Political Economy, 89, 914-927.
Moalusi D. (2004). Causal Link between Government Spending and Revenue: A Case
Study of Botwsana. Fordham Economics Discussion Paper Series, Number,
dp2007-07.
Musgrave R (1966). Principles of Budget Determination. In H. Cameran and W.
Henderson (Eds.), Public Finance: Selected readings (pp 15-27). New York:
Random House.
Nanthakumar L., Kogid M., Sukemi M.N., and Muhamad S. (2011). Tax Revenue and
Fiscal Constraints: Empirical Evidence from Malaysia. China-USA Business
Review. Vol. 10, No. 9, 779-784.
Narayan P.K. (2005). The Government Revenue and Government Expenditure
Nexus: Empirical Evidence from Nine Asian Countries. Journal of Asian
Economics, 15, 1203-1216.
Narayan P.K. and Narayan S. (2006). Government Revenue and Government
Expenditure Nexus: Evidence from Developing Countries. Applied Economics,
38, 285-291.
Ndoricimpa A. (2013). Analysis of Asymmetries in the Tax-Spending Nexus in
Burundi: Evidence from Threshold Modelling, TAR, and M-TAR Models.
Work-In-Progress, Submitted to the African Economic Research Consortium
(AERC).
Nyamongo M., Esman M., and Schoeman N. J. (2007). Government Revenue and
Expenditure Nexus in South Africa. South African Journal of Economics and
Management Studies, 10, 2, pp. 256-268.
Obioma E. and Ozughalu U.M. (2010). An Examination of the Relationship between
Government Revenue and Expenditure in Nigeria: Cointegration and
Causality Approach. Central Bank of Nigeria, Economic and Financial
Review, Volume 48/2.

ADRRI JOURNAL OF ARTS AND SOCIAL SCIENCES
pISSN: 2343-6891 ISSN-L: 2343-6891
VOL. 11, No.11 (1), February, 2015
Published by Africa Development and Resources Research Institute
18
Osei R., Morrisey O., and Lloyd T. (2005). The Fiscal Effects of Aid in Ghana. Journal
of International Development, 17: 1037-1053.
Peacock A. and Wiseman J. (1961). The Growth of Public Expenditures in the United
Kingdom, Princeton NJ: Princeton UP.
Peacock A. and Wiseman J. (1979). Approaches to the Analysis of Government
Expenditure Growth. Public Finance Quarterly, 7, 3-23.
Remmer K.L. (2004). Does Foreign Aid Promote the Expansion of Government?
American Journal of Political Science, 48, 77-92.
Richter C. and Dimitrios P. (2013). Tax and Spend, Spend and Tax, Fiscal
Synchronization or Institutional Separation? Examining the Case of Greece.
Romanian Journal of Fiscal Policy, Volume 4, Issue 2(7), July-December 2013, pp.
1-17.
Sakyi D. (2013). On the Implications of Trade Openness, Foreign Aid and Democracy
for Wagner’s Law in Developing Countries: Panel Data Evidence for West
African Monetary Zone (WAMZ). The Journal of Developing Areas, Volume 47,
Number 2, Fall 2013.
Vamvoukas G. A. (2011). The Tax-Spend Debate with an Application to the EU.
Economic Issues, Vol. 16, Part 1.
Wolde-Rufael Y. (2008). The Revenue-Expenditure Nexus: The Experience of 13
African Countries. African Development Review, 20, 273-283.
Young A.T. (2009). Tax-Spend or Fiscal Illusion? Cato Journal, Vol. 29, No. 3 (Fall
2009).

ADRRI JOURNAL OF ARTS AND SOCIAL SCIENCES
pISSN: 2343-6891 ISSN-L: 2343-6891
VOL. 11, No.11 (1), February, 2015
Published by Africa Development and Resources Research Institute
19
This academic research paper was published by the Africa Development and Resources
Research Institute’s Journal of Arts and Social Sciences. ADRRI JOURNALS are double
blinded, peer reviewed, open access and international journals that aim to inspire Africa
development through quality applied research.
For more information about ADRRI JOURNALS homepage, follow: URL:
http://www.journals.adrri.org/ http://www.journals.adrri.com
CALL FOR PAPERS
ADRRI JOURNALS call on all prospective authors to submit their research papers for
publication. Research papers are accepted all yearly round. You can download the
submission guide on the following page: http://journal.adrri.org/aj/
ADRRI JOURNALS reviewers are working round the clock to get your research paper
published on time and therefore, you are guaranteed of prompt response. All published
papers are available online to all readers world over without any financial or any form of
barriers and readers are advice to acknowledge ADRRI JOURNALS. All authors can apply
for one printed version of the volume on which their manuscript(s) appeared.