Embed Size (px)
Citation preview

Supporting Information
Surface-Engineered Gold Nanorods: Promising DNA Vaccine Adjuvant for
HIV-1 Treatment
Ligeng Xu,† Ye Liu,§ Zhiyun Chen,† Wei Li,¶ Ying Liu,† Liming Wang,†, ¶ Yong Liu,§ Xiaochun
Wu,‡,* Yinglu Ji,‡ Yuliang Zhao,†, ¶ Liying Ma,§ Yiming Shao,§ Chunying Chen,†,*
†CAS Key Laboratory for Biomedical Effects of Nanomaterials and Nanosafety, National Center for
Nanoscience and Technology of China, Beijing, 100190, China
§National Center for AIDS/STD Control and Prevention of China CDC, Beijing, 102206, China
¶CAS Key Laboratory for Biomedical Effects of Nanomaterials and Nanosafety, Institute of High
Energy Physics, Chinese Academy of Sciences (CAS), Beijing, 100049, China
‡CAS Key Laboratory of Standardization and Measurement for Nanotechnology, National Center for
Nanoscience and Technology of China, Beijing, 100190, China
TITLE RUNNING HEAD
Gold Nanorods with Proper Surface Coating show Adjuvant Activity for HIV-1 DNA Vaccine
*Corresponding authors.
Address: CAS Key Laboratory for Biomedical Effects of Nanomaterials and Nanosafety, National
Center for Nanoscience and Technology of China, Beijing, 100190, China. TEL: +86-10-82545560.
FAX: +86-10-62656765.
E-mail: [email protected], [email protected]

Figure S1.The images of cell transfection at 24 h post transfection. Results show that GFP protein
expression began to occur at 24 h post transfection for PDDAC-Au NR-DNA group, PEI-Au
NR-DNA and PEI-DNA. However, there was no protein translation for cells transfected with
CTAB-Au NR-DNA.

Figure S2. Surface chemistry influences the stability within biological environment of Au NRs. (A)
and (B) UV-vis-NIR absorption spectra of Au NR and Au NR-DNA complexes in serum-free
DMEM and deionized water, respectively. Note that 575 nm absorption band for CTAB-Au NRs in
the serum-free DMEM may result from the interaction of the Au NRs with small molecules in media
at close distance. (C) Average sizes and (D) Zeta potential of Au NRs and Au NRs-DNA complexes
in serum-free medium and artificial lysosomal fluid (pH 4.5). (E) Average sizes and(F) Zeta potential
of Au NRs and Au NRs-DNA complexes in water and artificial lysosomal fluid (pH 4.5). Results of
NIR absorption characterization indicated that CTAB-Au NR and PEI-Au NR aggregated apparently

after adsorbing DNA in serum-free medium but not that of PDDAC-Au NR. However, all of Au NRs
did not aggregate apparently after adsorbing DNA in water. These results were also confirmed by the
characterizations of DLS. As a result of the high DNA adsorption capability, Zeta potential of
PDDAC-Au NR changed greatly after the incubation with DNA in serum-free medium or water.
Figure S3. Au NRs-DNA complexes mainly located in lysosome at 2.5 h post transfection after
internalized into cells. (A) CTAB-Au NR-DNA complex, (B) PDDAC-Au NR-DNA complex, (C)
PEI-Au NR-DNA complex, and (D) PEI-DNA complex. Because plasmid DNA and lysosome were
labeled with red fluorescent Cy3-dCTP and green tracker probe, respectively, yellow or orange
points (the arrows) indicate the co-localization of Au NR-DNA and lyosomes. These results were
confirmed at different fields under CLSM.

Figure S4. CTAB-Au NR-DNA complex but not PDDAC- and PEI-Au NR-DNA complexes could
located in mitochondria at different time points post transfection. (A) CTAB-Au NR-DNA-5 h; (B)
CTAB-Au NR-DNA-17 h; (C) CTAB-Au NR- DNA-22 h; (D) PDDAC-Au NR-DNA-5 h; (E)
PDDAC-Au NR-DNA-17 h; (F) PDDAC-Au NR- DNA-22 h; (G) PEI-Au NR-DNA-5 h; (H)
PEI-Au NR-DNA-17 h; (I) PEI-Au NR-DNA-22 h; The arrows indicate the co-localizations of
CTAB-Au NR-DNA and mitochondria. These results were confirmed at different fields under
CLSM.

Figure S5. TEM images for the dynamic localizations of Au NRs-DNA complexes within cells.
(A) CTAB-Au NR-DNA. (B) PDDAC-Au NR-DNA. (C) PEI- Au NR-DNA. Briefly, HEK293 cells
were treated with Au NR-DNA complex for 3 h and rinsed twice with PBS solution (pH 7.4). Then
cells were harvested at different time points, i.e. 2.5, 6, 20 and 48 h. Finally, the ultra-structure was
observed using TEM. Results demonstrated that CTAB-coated Au NR mainly located in lysosome
and some of them could locate within mitochondria (3A). As for PDDAC-Au NR and PEI-Au NR, it
only located in endosome or lysosome (3B and 3C).

Figure S6. CTAB-Au NR could affect the plasmid DNA conformation. Circular dichroism (CD,
J-810, JASCO) was utilized to check the effect of gold nanorod on the plasmid DNA conformation.
Briefly, Gold nanorod solution at 100μg/mL was added to DNA solution at 187 μg/mL of the same
volume and incubated for 30 min at room temperature. Then, DNA solution, gold nanorod solution
and gold nanorod-DNA mixture were characterized with Circular dichroism. It showed that typical
CD spectra (three major peaks: 220 nm-positive peak, 246 nm-negative peak and 275 nm-positive
peak) did not change when plasmid DNA treated with PDDAC-Au NR and PEI-Au NR. It should be
noted that the ratio of A275/A220 decreased slightly when DNA treated with CTAB-Au NR. The
visible aggregates of CTAB-Au NR after adsorbing DNA may lead to the large noise.
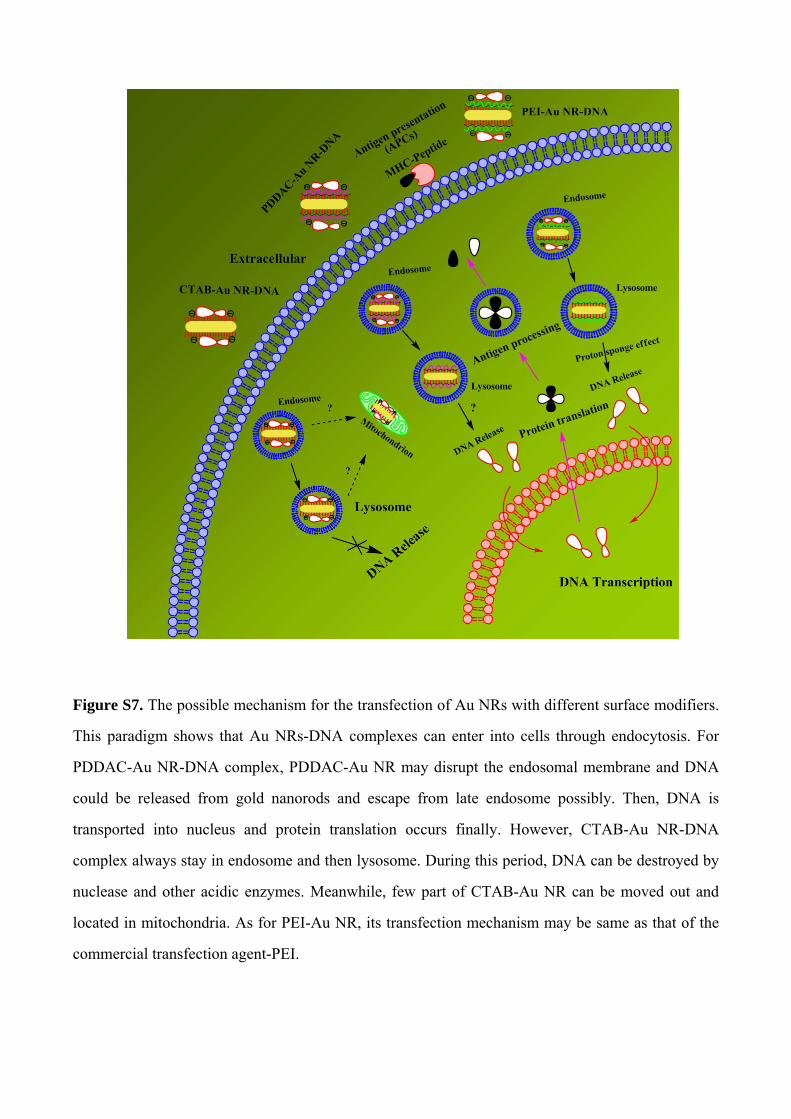
Figure S7. The possible mechanism for the transfection of Au NRs with different surface modifiers.
This paradigm shows that Au NRs-DNA complexes can enter into cells through endocytosis. For
PDDAC-Au NR-DNA complex, PDDAC-Au NR may disrupt the endosomal membrane and DNA
could be released from gold nanorods and escape from late endosome possibly. Then, DNA is
transported into nucleus and protein translation occurs finally. However, CTAB-Au NR-DNA
complex always stay in endosome and then lysosome. During this period, DNA can be destroyed by
nuclease and other acidic enzymes. Meanwhile, few part of CTAB-Au NR can be moved out and
located in mitochondria. As for PEI-Au NR, its transfection mechanism may be same as that of the
commercial transfection agent-PEI.

Figure S8. PDDAC- and PEI-Au NR but CTAB-Au NR could enhance T cells proliferation capabilities. Results showed that the fluorescence intensity of CFSE for Env and CTAB-Au NR-Env groups did not decrease compared to that of the negative control. However, all of the T cells for PDDAC-Au NR-Env and PEI-Au NR-Env groups proliferated for many generations as the intensity of CFSE decreasing near to negative (near to 10). T cells of PEI-Env group also proliferated for several generations.

Experimental section
Methods
Synthesis and Characterization of Gold Nanorods. Sodium borohydride (NaBH4),
cetyltrimethylammonium bromide (CTAB), silver nitrate (AgNO3) and L-ascorbic acid (AA) were
purchased from Alfa Aesar. Poly(styrenesulfate) (PSS, molecular weight: 70,000), poly
(ethyleneimine) (PEI, Mw= 25,000) and poly(diallydimethy ammoniumchloride (PDDAC,
Mw=100,000-200,000, 20 wt% aqueous solution) were from Aldrich. Hydrogen tetrachloroaurate
(III) trihydrate (HAuCl4·3H2O) and sulphuric acid (H2SO4) were bought from Sinopharm Chemical
Reagent Co., Ltd. All chemicals are analytical grades and used as received. Milli-Q water
(18MΩ.cm) was used for all solution preparations.
CTAB-Au NRs. CTAB-Au NRs were synthesized by the seed-mediated growth method30, 31. Firstly,
7.5 mL 0.1 M CTAB was mixed with HAuCl4 (100 μL, 24 mM) and diluted with water to 9.4 mL.
Then, 0.6 mL ice-cold NaBH4 (0.01 M) was added while stirring magnetically. After another 2 min
vigorously stirring, the seed solution was kept at room temperature and used within 2-5 h. Secondly,
the growth solution of the Au NRs was obtained by mixing CTAB (100 mL, 0.1 M), HAuCl4 (2 mL
0.024 M), H2SO4 (2 mL, 0.5 M), AgNO3 (0.5 mL, 10 mM), and ascorbic acid (800 μL, 0.1 M). Then,
240 μL seed solution was added to initiate the growth of the Au NRs. After 12 h, the reaction was
stopped by centrifugation (8000 rpm for 10 min). The precipitate was re-dispersed in deionized
water.
PDDAC- and PEI-Au NRs. PDDAC- or PEI-Au NRs were obtained via a well-developed
layer-by-layer assembly approac32. A PSS layer was first assembled to the original CTAB-Au NRs in

order to obtain negatively charged nanorods. Briefly, 12 mL of CTAB-Au NRs was centrifuged at
12000 rpm for 10 min, and the precipitate was dispersed in 12 mL of 2 mg/mL PSS aqueous solution
(containing 6 mM NaCl) and the solution was stirred magnetically for 3 h. After that, it was
centrifuged at 12,000 rpm for 10 min, and the precipitate was re-dispersed in deionized water. For
further coating with PDDAC or PEI, the similar procedure was applied to PSS-Au NRs.
Au NRs were characterized using transmission electron microscopy (TEM, FEI Tecnai G2T20,
FEI Company, USA).
Cell Transfection. HEK293 cells were cultured in DMEM medium containing 10% fetal bovine
serum (FBS) at 37 in a humidified 5% CO2 incubator. When up to 90% confluence, cells were
harvested and then seeded in 24-well plate at 2.5×10⁴ cells/well for 24 h prior to transfection. The
Au NRs-pEGFP complexes were obtained by mixing Au NRs and plasmid enhanced green
fluorescent protein (pEGFP) for 30 min in the serum free medium. Then, the complexes were diluted
ten times with serum-containing medium and added into wells for 3 h. After this, transfection
solution was removed and cells were rinsed twice with PBS solution (pH 7.4) and then
supplemented with complete DMEM medium containing 10% FBS. The transfection effect was
checked with Olympus inverted fluorescence microscope at 48 h post transfection. The working
concentration of Au NR and plasmid DNA were 10 and 1.6 μg/mL, respectively. PEI served as
positive control (N/P = 4.2).
Comparison of DNA adsorption efficiency of three Au NRs. Au NRs solution at 100 μg/mL was
added to pEGFP solution at 16 μg/mL of the same volume and incubated for 30 min at room
temperature and then the mixture was centrifuged at 10 000 rpm for 15 min. Agarose electrophoresis
was performed for the supernatant and DNA control. Meanwhile, the absorbance at 260 nm of the
supernatant and DNA control were determined through TECAN Infinite M200 microplate reader
(Tecan, Durham, USA). Measurement was repeated in triplicate. The DNA adsorption efficiency is
calculated through the formula:
Adsorption efficiency (E%) = (total DNA –free DNA)×100%/total DNA.
Characterizations of Au NRs and Au NR-DNA complexes with UV-Vis –NIR absorption
spectrometer and Dynamic light scattering (DLS). Au NRs solution at 100 μg/mL was added to
serum-free DMEM medium or DNA solution at 16 μg/mL of the same volume and incubated for 30
min at room temperature. Then Au NRs and the Au NR-DNA complex solutions were scanned using
UV-vis-NIR spectrometer (Cary50, Varian, USA) and characterized with Zetasizer (Nano ZS90,
Malvern Instruments, UK). In addition, the two characterizations were also applied for them in two
other media: artificial lysosomal fluid (ALF, pH 4.5) and deionized water for the purpose of
comaprison.
The determination of internalization quantity of Au NR-DNA. The internalization quantity of Au
NR-DNA complex into cells was determined using inductively coupled plasma mass spectrometry
(ICP-MS, Thermal Elemental X7, Thermal Fisher Scientific Inc, USA). When up to 90% confluence,
HEK293 cells were treated with Au NR-DNA complex for 3 h. The working concentration of the Au
NRs and DNA was 10 μg/mL and 1.6 μg/mL, respectively. Then cells were rinsed twice with PBS
solution (pH 7.4) and then harvested and counted. Finally, cells were soaked in aqua regia overnight
and heated to about 140 to drive off the vapor of hydrogen chloride and nitrogen oxides until the
solution was colorless and clear. After dilution to 3 mL using water solution containing 2% nitric

acid and 1% hydrogen chloride, gold content was analyzed using ICP-MS. Bismuth of 10 ng/mL
was regarded as an internal standard. The concentration of gold elements (or gold atoms) in solution
was then obtained. Measurement was repeated in triplicate.
Dynamic Localization and Delivery Processes of Au NR-DNA complexes in HEK293 cells. To
determine the dynamic localization of DNA and/or Au NR-DNA complexes within HEK293 cells,
cells were observed with confocal laser scanning microscopy (CLSM, PerkinElmer, USA) at
different time points of post transfection. Before use, pEGFP was labeled with Cy3-dCTP
(Amersham, GE) under the manufacturer’s recommendation. Mitochondria, lysosome and nucleus
were stained with Mito-Tracker® green probe, Lyso-Tracker® green probe and Hoechst 33342,
respectively. After transfected for 3 h, cells were washed twice with PBS (pH 7.4) solution and then
supplemented with fresh complete DMEM medium (10% FBS). The dynamic localization of Au
NRs-DNA complexes were determined with CLSM at different time point such as 2.5, 5, 6, 15, 17,
20, 22 and 24 h post transfection. The results were analyzed using Volocity which is the analysis
software of CLSM.
Immunization. Mice were purchased from Laboratory Animal Center of the Academy of Military
Medical Sciences and housed in HEPA-filtered air and a constant climate (room temperature 21 ±
2 and relative humidity 40–70%) with a 12-h light/dark cycle (light on at 08:00 am). Experiment
was approved by the Institutional Animal Care and Use Committee of Peking University Health
Sciences Center. Thirty six female BALB/c mice (6-8 weeks, 18-22 g) were divided into six groups
(n= 6) randomly and immunized with naked Env plasmid DNA (HIV-1 CN54 gp145, kindly
provided by National Center for AIDS/STD Control and Prevention of China CDC), PEI-Env

complex (branched PEI, Mw = 25 kD, N/P=10) and different Au NR-Env complexes including
CTAB-Au NR-Env, PDDAC-Au NR-Env and PEI-Au NR-Env complexes with intradermal
injection (i.d.). The dosage of gold nanorod and Env were 250 and 500 μg/kg, respectively. Mice
were immunized for three times at two weeks intervals and sacrificed at two weeks post final
immunization.
ELISPOT. ELISPOT assays were performed using an ELISPOT set (BD-Biosciences PharMingen,
San Diego, CA), according to the manufacturer’s protocol. Initially, the ELISPOT plates were
coated with anti-IFN-γ at 5 μg/ml and incubated overnight at 4 . The plates were blocked with
RPMI 1640 medium (Gibco) containing 10% FBS for 2 h at room temperature. Then total
splenocytes from immunized mice were added at 5×10⁵/well and cultured in the incubator (37, 5%
CO2) in the presence of HIV-1 Env peptide at 5 μg/ml. PMA and ionomycin were used as positive
control. After 24 h, the detection was done according to the protocol. Finally, the enumeration of
IFN-γ spot forming cells (SFC) was performed using the Immunospot Analyzer ELISPOT reader
with the aid of the Immunospot software version 3.0 (Cellular Technologies Ltd., Shaker Heights,
OH). Data are presented at SFC/106 cells. Results were considered positive if the number of SFC
was above 50. Student’s t-test was performed when comparing two different groups. P-value less
than 0.05 is considered to be statistically significant.
ELISA. A 96-well plate was coated with 20 μg/ml Env peptide antigen at 37 for 2 h and then
blocked with PBS containing 1% BSA at 37 for 2 h. After washing with PBST, 200-fold diluted
mouse serum was added into wells and then diluted doubly such as 400, 800, 1600, 3200, 6400,
12800 fold dilution. The plate was further incubated at 37 for 2 h. After washing, HRP-labeled

anti-mouse IgG (ICN Pharmaceuticals Inc., Costa Mesa, CA) was applied and incubated for another
1 h at 37 . After washing, the antibodies bound to the peptide were detected by adding a substrate
solution (an OPD tablet in 0.1M citric acid (pH 5.6) and 1 μl/ml of 30% H2O2). The substrate
reaction was terminated by adding 1N H2SO4, and the absorbance was determined at 450 nm. The
reference wavelength was 620 nm. Result was considered negative if the intensity was less then
0.12.
T cell proliferation assay
Total splenocytes from all groups were stained with 10 μM carboxyfluorescein diacetate,
succinimidyl ester (CFDA SE) (Invitrogen) for 15 min at 37 . Cells were washed twice with
pre-warmed RPMI 1640 medium containing 10% FBS and then incubated with Env peptides at 2
μg/ml for 66-68 h. Cells treated with Concanavalin A (Sigma) at 5 μg/ml were used as positive
control. Then, cells were stained with antibodies including anti-CD3-PerCP, anti-CD8-PE and
anti-CD4-APC (all from BD Biosciences). Finally, cells were acquired on the Flow cytometry (BD
FACS Calibur) and analyzed with FCS Express software. The experiment was done in triplicate.
The determination for the type of the immune response (Ratio of IgG1/IgG2a)
Th1/Th2 ratio can be calculated as the formula: Th1/Th2 ratio= [IgG2a]/[IgG1]. IgG1 and IgG2a
of all the groups were assayed using mouse IgG1 and IgG2a ELISA Kits (RD, USA), respectively.
The effect of Au NRs with different surface coatings on DC maturation
Bone marrow-derived dendritic cells (BM-DCs) from BALB/c mice were cultured according to
the method of Manfred B. Lutz45. Briefly, bone marrow was obtained by flushing the femur and tibia

with RPMI 1640 medium containing 10% FBS and 50 μM 2-mercaptoethanol (Sigma). After the
lysis of red blood cells, cells were seeded at 1×10⁶ per 60 mm bacteriological petri dishes (Falcon,
Becton Dickinson, Germany) in 3 ml medium containing 20 ng/ml GM-CSF (Peprotech/Tebu,
Germany). At day 3, another 3 ml medium containing 20 ng/ml GM-CSF was added to the plates. At
days 6 and 8, half of the culture supernatant was collected, centrifuged. The cell pellet was
re-suspended in 3 ml fresh medium containing 20 ng/ml GM-CSF and given back into the original
plate. At day 10, BM-DCs were obtained. Then DCs were treated with Env plasmid DNA, Au NRs
with different coatings (CTAB-Au NR, PDDAC-Au NR, PEI-Au NR) and Au NRs-Env complexes
for 48 h. The working concentration of Env and Au NRs were 2 and 10 μg/ml, respectively.
Meanwhile, lipopolysaccharide (LPS, Sigma) at 1 μg/ml served as positive control and the negative
control was the untreated DCs. Then DCs of all the groups were stained with antibodies including
anti-CD11c-FITC, anti-CD86-PE, anti-MHCII- PerCP/Cy5.5 and anti-CD80-APC (Biolegend, USA).
Finally, cells were acquired on the Flow cytometry (BD FACS Calibur) and analyzed with FCS
Express software. The experiment was done in triplicate.


![sro.sussex.ac.uksro.sussex.ac.uk/55255/1/Manuscript nano energy.docx · Web viewand thermoelectric energies [14], however, these rigid devices are difficult to be combined with flexible](https://img.pdfslide.net/doc/110x75/5ab28d487f8b9a00728d42c7/sro-nano-energydocxweb-viewand-thermoelectric-energies-14-however-these-rigid.jpg)