Embed Size (px)
Citation preview
Manuscript Title: Pushover Analysis and Failure Pattern of a Typical
Masonry Residential Building in Bosnia and Herzegovina
Author line: Naida Ademovic1, Mustafa Hrasnica
2, Daniel V. Oliveira
3
Corresponding Author: Naida Ademovic1
Address:
Gradjevinski fakultet Sarajevo (Civil Engineering Faculty in Sarajevo)
Ulica Patriotske lige 30 (Street Patriotske lige 30)
71000 Sarajevo
Bosnia and Herzegovina
tel: 387 33 278 498
fax: +387 33 200 158
2
N. Ademovic1, M. Hrasnica
2, Daniel V. Oliveira
3
1 University of Sarajevo, Gradjevinski fakultet, ulica patriotske lige 30, 71000 Sarajevo, Bosnia and Herzegovina, [email protected]
2 University of Sarajevo, Gradjevinski fakultet, ulica patriotske lige 30, 71000 Sarajevo, Bosnia and Herzegovina, [email protected]
3 University of Minho, Depart. Civil Engineering, ISISE, Portugal, [email protected]
Abstract — The paper discusses the behavior of a typical masonry building in Bosnia and Herzegovina
built in the 50’s without any seismic guidelines. A global numerical model of the building has been built
and masonry material has been simulated as nonlinear. Additionally, calculations done with a "less"
sophisticated model are in a good correlation with the finite element method (FEM) calculations. It was
able to "grasp" the damage pattern; not as detailed as in the FEM calculations, but still quite good. On the
basis of this it may be concluded that in this case calculation with Frame by Macro Elements (FME)
program could be recommended for future analysis of this type of structures, having quite good results
with a less computation time. However, in the need for more precise results FEM should be utilized.
Key-words —: masonry, nonlinear analysis, B&H residential masonry buildings, pushover, finite element
method, equivalent frame method
Pushover Analysis and Failure Pattern of a Typical Masonry Residential
Building in Bosnia and Herzegovina
1 INTRODUCTION
Besides floods, volcano eruptions, and fires, earthquakes are one of the natural processes that can be
defined as frightening and disastrous phenomena.
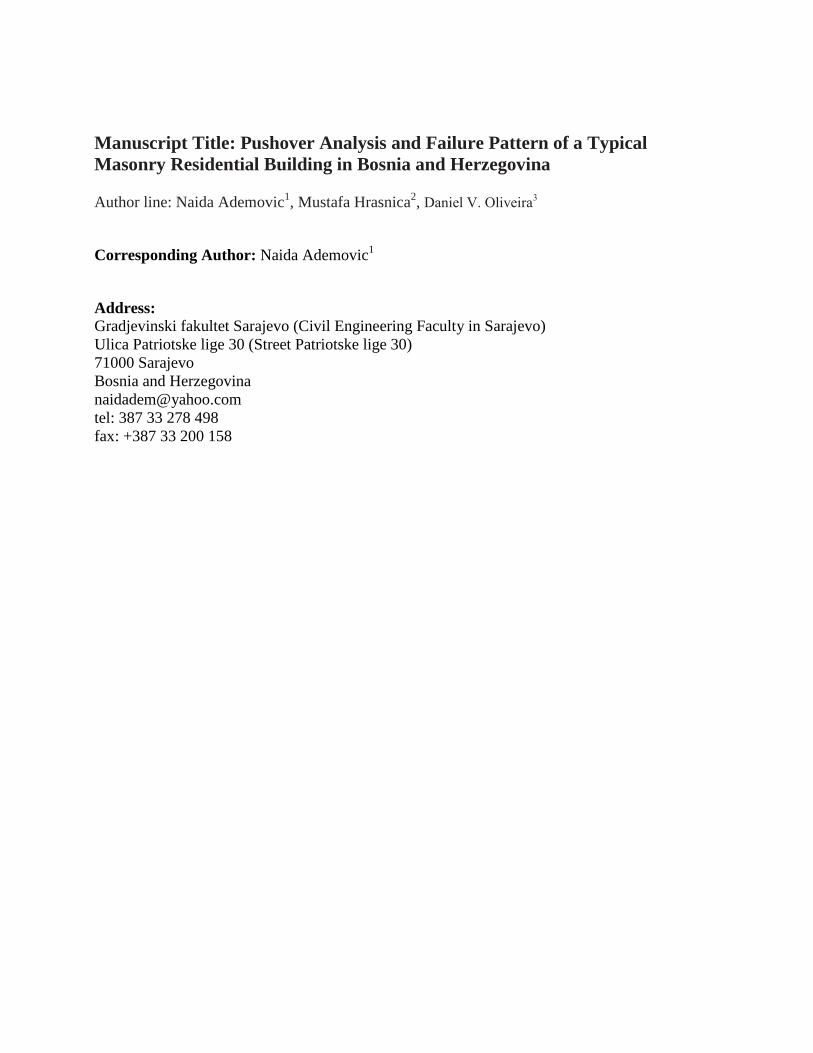
The region of South-East Europe, see Figure 1.1, has one on the most complex tectonics in Europe, as it is
also stated in the newsletter of Gisdevelopment [1].
Figure 1.1 - Balkan Peninsula [2]
3
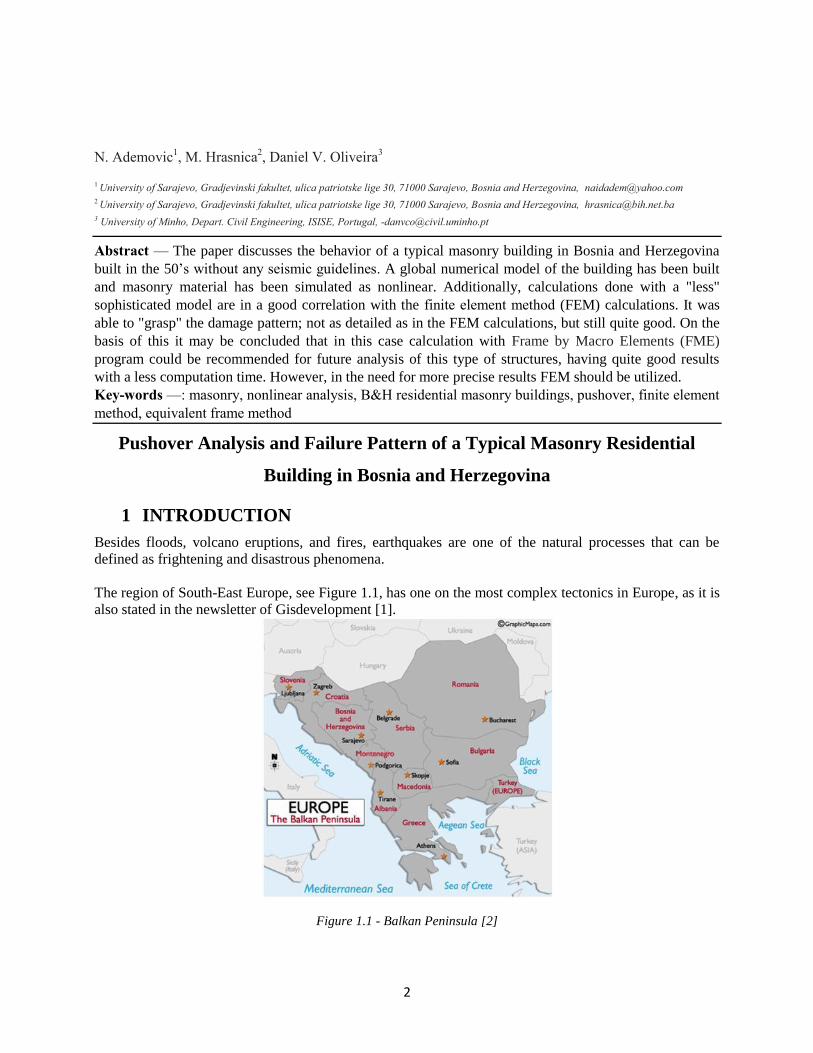
When talking about the Balkans and Bosnia and Herzegovina (B&H) it has to be kept in mind that it is not
affected only by the movement of the Eurasian and African continental-sized tectonic plates, but as well
by the movement of the Arabian and micro Adriatic plate, as indicated in Figure 1.2 [7]. The micro
Adriatic plate is moving northeastwards and in the way sub-ducts under the Eurasian plate. However,
there is no unique accepted hypothesis regarding the creation and kinematic of the Adriatic micro plate as
well as regarding the time of its creation and different hypothesis have been given [3], [4], [5] and [6].
This is just one segment of the complexity of the region affecting the occurrence of earthquakes.
Figure 1.2 - Adriatic Micro Plate [7]
1.1 Seismicity of Bosnia and Herzegovina
Seismic activity in B&H is connected to the existence of deep lateral and reverse faults. The fact that the
second biggest belt (Alpine Belt), going from the Himalayas over Iran, Turkey and Greece, passes through
B&H verifies the tectonic activity of this region.
Until present, the most complete picture of the tectonic structure in B&H was done by [8] who has
identified deep faults passing through B&H as well as 30 tectonic units. This is shown in Figure 1.3.
4
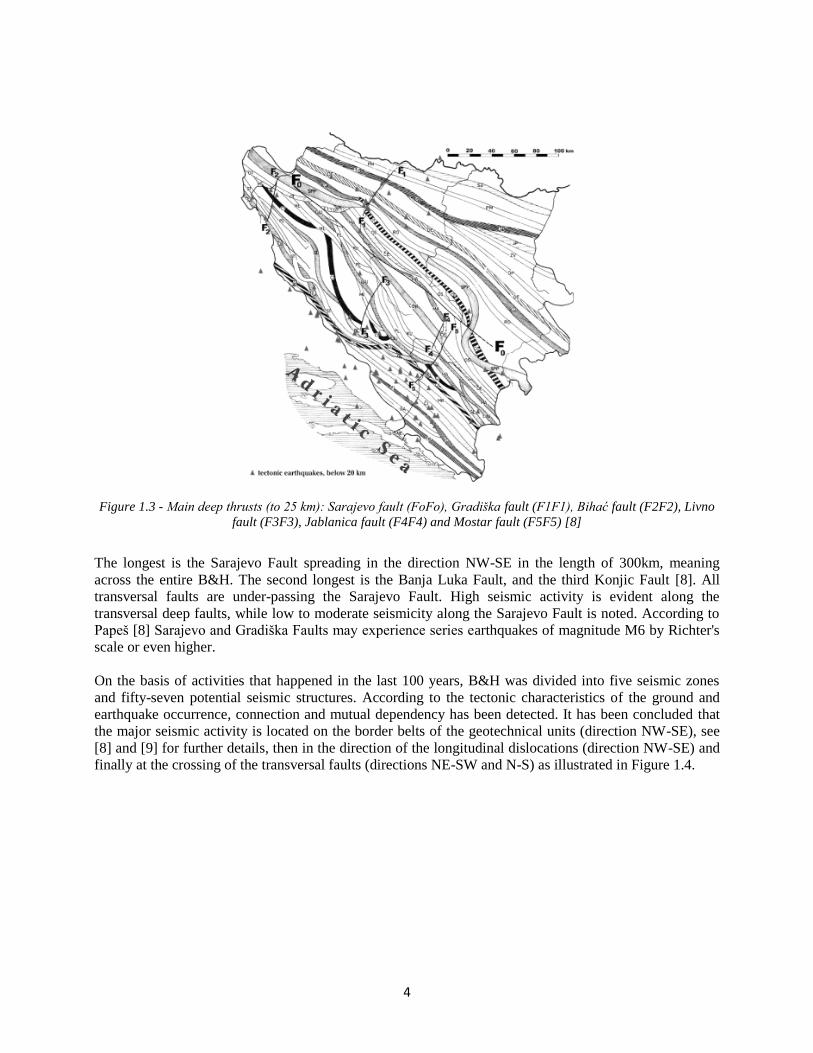
Figure 1.3 - Main deep thrusts (to 25 km): Sarajevo fault (FoFo), Gradiška fault (F1F1), Bihać fault (F2F2), Livno
fault (F3F3), Jablanica fault (F4F4) and Mostar fault (F5F5) [8]
The longest is the Sarajevo Fault spreading in the direction NW-SE in the length of 300km, meaning
across the entire B&H. The second longest is the Banja Luka Fault, and the third Konjic Fault [8]. All
transversal faults are under-passing the Sarajevo Fault. High seismic activity is evident along the
transversal deep faults, while low to moderate seismicity along the Sarajevo Fault is noted. According to
Papeš [8] Sarajevo and Gradiška Faults may experience series earthquakes of magnitude M6 by Richter's
scale or even higher.
On the basis of activities that happened in the last 100 years, B&H was divided into five seismic zones
and fifty-seven potential seismic structures. According to the tectonic characteristics of the ground and
earthquake occurrence, connection and mutual dependency has been detected. It has been concluded that
the major seismic activity is located on the border belts of the geotechnical units (direction NW-SE), see
[8] and [9] for further details, then in the direction of the longitudinal dislocations (direction NW-SE) and
finally at the crossing of the transversal faults (directions NE-SW and N-S) as illustrated in Figure 1.4.
5
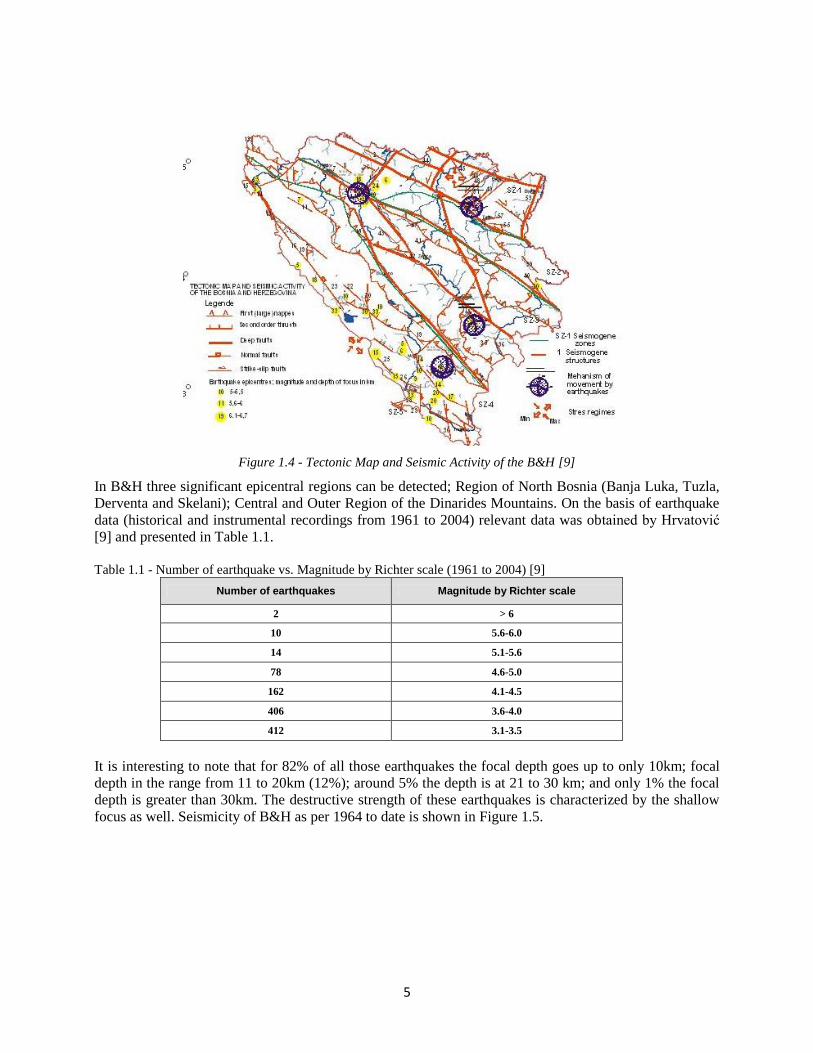
Figure 1.4 - Tectonic Map and Seismic Activity of the B&H [9]
In B&H three significant epicentral regions can be detected; Region of North Bosnia (Banja Luka, Tuzla,
Derventa and Skelani); Central and Outer Region of the Dinarides Mountains. On the basis of earthquake
data (historical and instrumental recordings from 1961 to 2004) relevant data was obtained by Hrvatović
[9] and presented in Table 1.1.
Table 1.1 - Number of earthquake vs. Magnitude by Richter scale (1961 to 2004) [9]
Number of earthquakes Magnitude by Richter scale
2 > 6
10 5.6-6.0
14 5.1-5.6
78 4.6-5.0
162 4.1-4.5
406 3.6-4.0
412 3.1-3.5
It is interesting to note that for 82% of all those earthquakes the focal depth goes up to only 10km; focal
depth in the range from 11 to 20km (12%); around 5% the depth is at 21 to 30 km; and only 1% the focal
depth is greater than 30km. The destructive strength of these earthquakes is characterized by the shallow
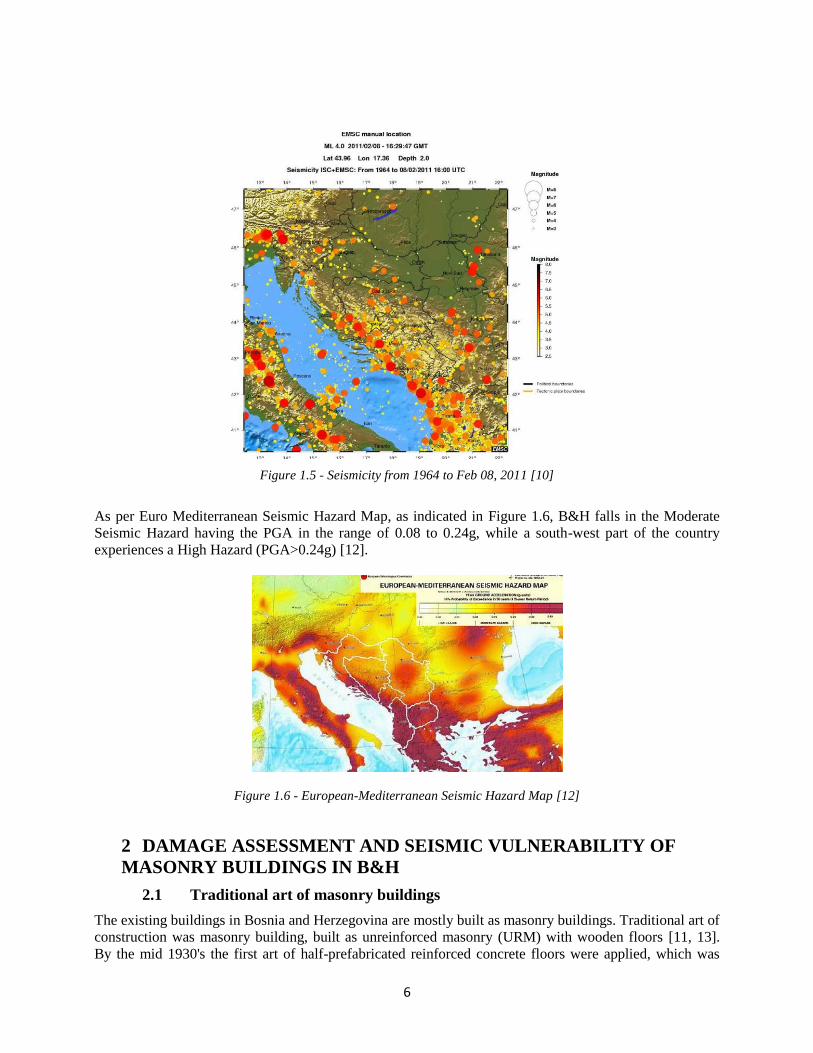
focus as well. Seismicity of B&H as per 1964 to date is shown in Figure 1.5.
6
Figure 1.5 - Seismicity from 1964 to Feb 08, 2011 [10]
As per Euro Mediterranean Seismic Hazard Map, as indicated in Figure 1.6, B&H falls in the Moderate
Seismic Hazard having the PGA in the range of 0.08 to 0.24g, while a south-west part of the country
experiences a High Hazard (PGA>0.24g) [12].
Figure 1.6 - European-Mediterranean Seismic Hazard Map [12]
2 DAMAGE ASSESSMENT AND SEISMIC VULNERABILITY OF
MASONRY BUILDINGS IN B&H
2.1 Traditional art of masonry buildings
The existing buildings in Bosnia and Herzegovina are mostly built as masonry buildings. Traditional art of
construction was masonry building, built as unreinforced masonry (URM) with wooden floors [11, 13].
By the mid 1930's the first art of half-prefabricated reinforced concrete floors were applied, which was
7
continued after the World War II. The most masonry buildings had up to 5 stories, but without vertical
R.C. confining elements. Seismic resistance was provided by structural walls laid in two main orthogonal
directions. Whereby, smaller number of walls in longitudinal direction was caused by functional demands.
Several strong earthquakes that happened in the few last decades underlined the importance of seismic
vulnerability assessment including evaluation of possible strengthening and retrofit measures. After the
earthquake in Skopje in 1963, first seismic codes were published and vertical confining R.C. elements
were introduced in masonry building practice. Presently, confining masonry is the common art of masonry
structures.
2.2 Typical damages of masonry structures
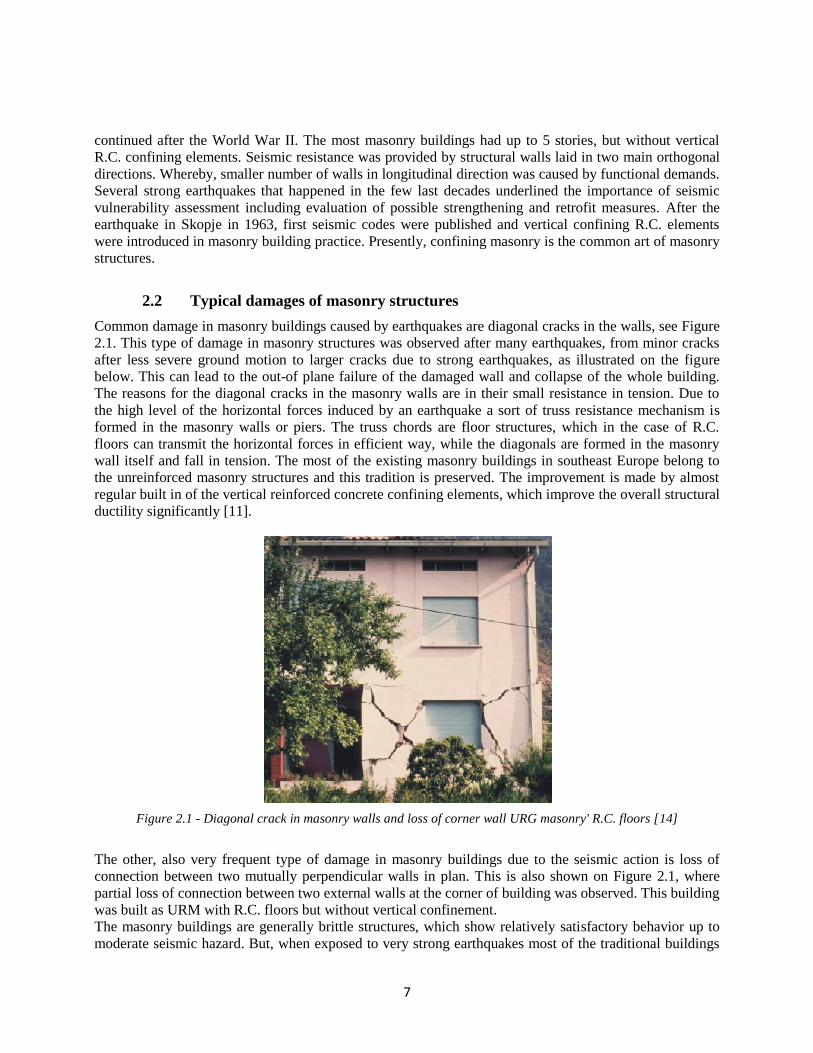
Common damage in masonry buildings caused by earthquakes are diagonal cracks in the walls, see Figure
2.1. This type of damage in masonry structures was observed after many earthquakes, from minor cracks
after less severe ground motion to larger cracks due to strong earthquakes, as illustrated on the figure
below. This can lead to the out-of plane failure of the damaged wall and collapse of the whole building.
The reasons for the diagonal cracks in the masonry walls are in their small resistance in tension. Due to
the high level of the horizontal forces induced by an earthquake a sort of truss resistance mechanism is
formed in the masonry walls or piers. The truss chords are floor structures, which in the case of R.C.
floors can transmit the horizontal forces in efficient way, while the diagonals are formed in the masonry
wall itself and fall in tension. The most of the existing masonry buildings in southeast Europe belong to
the unreinforced masonry structures and this tradition is preserved. The improvement is made by almost
regular built in of the vertical reinforced concrete confining elements, which improve the overall structural
ductility significantly [11].
Figure 2.1 - Diagonal crack in masonry walls and loss of corner wall URG masonry' R.C. floors [14]
The other, also very frequent type of damage in masonry buildings due to the seismic action is loss of
connection between two mutually perpendicular walls in plan. This is also shown on Figure 2.1, where
partial loss of connection between two external walls at the corner of building was observed. This building
was built as URM with R.C. floors but without vertical confinement.
The masonry buildings are generally brittle structures, which show relatively satisfactory behavior up to
moderate seismic hazard. But, when exposed to very strong earthquakes most of the traditional buildings
8
could suffer heavy structural damages, whose reparations are mostly not reasonable. Exceptions are
important historical buildings. The advantage of the existing masonry building is the structural regularity.
Most of them have no large structural horizontal eccentricity, or there is no important stiffness irregularity
along the height of the building, which is not rare in the modern reinforced concrete multi-storey
structures.
2.3 Seismic vulnerability classification of typical masonry buildings
The buildings are classified according to their structural type, seismic intensity, and expected damage
grade [13]. Damage grades from 1 to 5 have been defined in the EMS-98, ideally representing a linear
increase in the strength of shaking. If the structure is defined as having damage of Grade 1 this means that
it has negligible to slight damage of non-structural elements while it has not experienced any structural
damage. Whereas Grade 5 illustrated a very heavy structural damage described as destruction.
Vulnerability scale states differences in the way buildings respond to earthquake actions are expressed.
Vulnerability classes range from A to F and this has enabled the possibility to deal in one scheme with
different kinds of buildings and the variety of their ranges of vulnerability [14]. For more details see EMS-
98 [14]. For masonry structures most of the buildings fit into the range from A to C and in exceptional
cases class D. In the case of earthquake, the most endangered buildings are typically those built before the
introduction of seismic codes, but that depends very much on regularity of their structures.
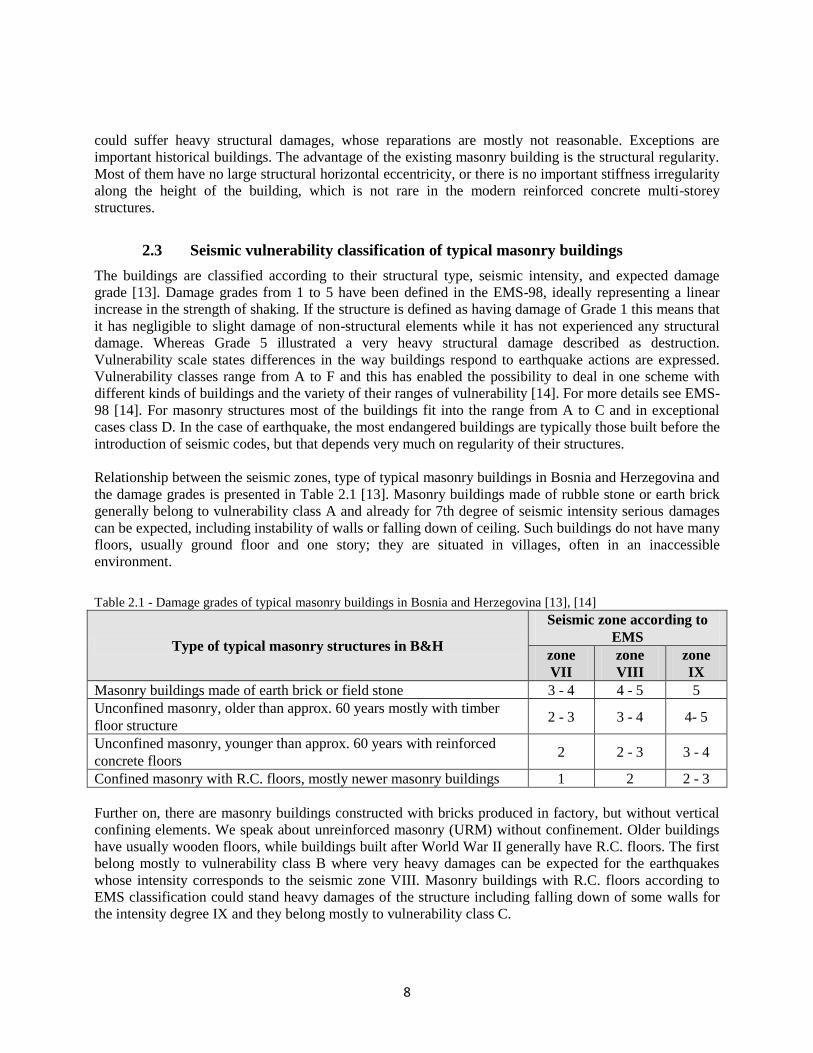
Relationship between the seismic zones, type of typical masonry buildings in Bosnia and Herzegovina and
the damage grades is presented in Table 2.1 [13]. Masonry buildings made of rubble stone or earth brick
generally belong to vulnerability class A and already for 7th degree of seismic intensity serious damages
can be expected, including instability of walls or falling down of ceiling. Such buildings do not have many
floors, usually ground floor and one story; they are situated in villages, often in an inaccessible
environment.
Table 2.1 - Damage grades of typical masonry buildings in Bosnia and Herzegovina [13], [14]
Type of typical masonry structures in B&H
Seismic zone according to
EMS
zone
VII
zone
VIII
zone
IX
Masonry buildings made of earth brick or field stone 3 - 4 4 - 5 5
Unconfined masonry, older than approx. 60 years mostly with timber
floor structure 2 - 3 3 - 4 4- 5
Unconfined masonry, younger than approx. 60 years with reinforced
concrete floors 2 2 - 3 3 - 4
Confined masonry with R.C. floors, mostly newer masonry buildings 1 2 2 - 3
Further on, there are masonry buildings constructed with bricks produced in factory, but without vertical
confining elements. We speak about unreinforced masonry (URM) without confinement. Older buildings
have usually wooden floors, while buildings built after World War II generally have R.C. floors. The first
belong mostly to vulnerability class B where very heavy damages can be expected for the earthquakes
whose intensity corresponds to the seismic zone VIII. Masonry buildings with R.C. floors according to
EMS classification could stand heavy damages of the structure including falling down of some walls for
the intensity degree IX and they belong mostly to vulnerability class C.
9
Masonry buildings with reinforced concrete confining elements, usually called confined masonry, are
generally classified according to EMS in relatively low class of vulnerability, class D. For 9th degree of
seismic intensity significant cracks can appear, roof tiles detach, chimneys can fall down, but there should
not be collapse of entire walls. The advantage of confined masonry is evident. After the new seismic codes
were introduced this became usual type of masonry building in Bosnia and Herzegovina. Yet, most of the
existing buildings belong to unconfined masonry as it is the case for the example building, which is
thoroughly analyzed in the following chapters. This building belongs to the unconfined masonry, younger
than approx. 60 years with reinforced concrete floors. For the 7th degree of seismic intensity
(corresponding to Sarajevo region where the building is located) moderate to heavy damages (grade 3-4)
could be expected.
3 PUSHOVER ANALYSIS
3.1 General information The non-linear static analysis (Pushover) of the building, a performance-based methodology, is based on
an incremental increase of the horizontal force distribution on a structure and constant gravity loads, and
as a result envelope of all the responses derived from the non-linear dynamic analysis represents the
structural behavior. It is assumed that the dynamic response of the building is governed mostly by first
eigen-mode. This reduces the problem to a SDOF (single degree of freedom system). This method enables
to track the yielding sequences as well as the progress of the overall capacity curve of the structure.
Previously elements that have to be defined are the lateral load and its distribution pattern. Once this is
defined the lateral load is applied on the numerical model and the amplitude is increased in a stepwise
fashion. At each step a non-linear static analysis is conducted, until the structure becomes unstable or until
it reaches a specific limit that has been previously stated. Then, a capacity curve is plotted; usually it gives
the dependency of base shear (vertical axis) on the displacement (horizontal axis), mostly displacement of
the top floor. This curve is then combined with the demand (earthquake) curve usually represented in
ADRS (Acceleration-Displacement Response Spectra) for determination of the top displacement under the
design earthquake - the target displacement.
3.2 Short history on development of pushover analysis
The use of inelastic static analysis in earthquake engineering is traced to the work of Gulkan and Sozen
(1974). Here a single degree of freedom system was derived to represent the multi-degree of freedom
structure via an equivalent or ‘substitute’ structure. Initially, pushover analysis was developed for steel
and concrete frame-type structures. It has been studied, developed and upgraded my many authors [15],
[16], [17], [18].One of the most in-depth study of pushover analysis has been done by [19].
Further, this method has also been applied to masonry structures by modeling continuous wall elements
directly or through use of the equivalent frame technique. Tomaževič in 1978 has proposed a simplified
non-linear method for the assessment, repair and strengthening of existing masonry structure. This method
has had several changes and improvements during the years [20]. The method is based on a "storey-
mechanism" approach, where non-linear interstorey displacement analysis is done for each floor
separately. Each masonry pier is idealized by a elastic-perfectly plastic material behavior with limited
ductility. The application of this method has been limited to certain types of structures [21], due to its
simplicity, so improvement has been needed.
10
Pushover analysis is wide spread in most of codes as for example FEMA 356, [22] and Eurodoce 8 [23].
Several authors in their publications gave pros and cons regarding the pushover technique. Lawson [24]
defined the array of applicability and gave an indication to the arisen difficulties. Further Krawinkler and
Seneviratna [25] in their work indicated positive and negative aspects of the pushover analysis. One of the
draw backs of the pushover analysis as seen by Tso [18] is the fixed load pattern used in the analysis.
As it is well known, two basic things define different methods, one being the choice of the load pattern
and the second the procedure utilized for simplification of the pushover curve for design purposes.
Drawback of this procedure is that for masonry structures until now best pattern of loads is not yet
determined. Additionally, it gives a time-independent displacement shape. Some researchers Tanrikulu
[26] believe that at least three modes should be regarded. Advantage of this procedure is that it is able to
locate the most vulnerable parts of the structure. It, as well, provides data that cannot be obtained by
elastic analysis, being strength and ductility of the structure.
3.3 Case study in Bosnia and Herzegovina
In the following chapters a case study is presented regarding the analysis of an existing masonry structure
in Bosnia and Herzegovina. It is the first time that a non-linear material characteristic of masonry
structures in Bosnia and Herzegovina has been conducted. It is proposed to use this analysis for masonry
construction in order to verify their safety. It is emphasized that this is of paramount importance given the
high prevalence of this type of structures not only in Bosnia and Herzegovina but in the entire Balkan
region and even beyond, especially when it comes to seismically active areas.
Clear contribution of this work is reflected in the detailed methodology of seismic evaluation of existing
masonry buildings. For the first time, data were obtained on the seismic behavior of multistory residential
buildings that marked the epoch of mass construction of 50-and 60-ies of XX century in the Western
Balkans. Large stock of these buildings exists in a vast number of large settlements in all major cities.
Therefore, knowledge of their seismic capacity, as well as possible behavioral effects during earthquakes
is valuable in terms of consideration of seismic risk and the need to improve the seismic resistance.
It points to the fact that this type of structure does not possess a global safety during earthquake activity
even in the value of ground acceleration of 0.lg (corresponding to approximately VII seismic zone) and
therefore appropriate measures for possible strengthening were given. The calculations proved that the
most vulnerable location is between the basement of the structure, which is made of reinforced concrete
and the first floor being made of masonry elements. Here, the observed concentration of damage is due to
sudden changes in stiffness. Such defects have been observed in experimental tests which were carried out
in Slovenia on a masonry structure model with axially rigid floor slabs. Similar damages were observed on
an actual structure of similar type after the earthquake that took place in Skopje and caused its significant
damage. This all points to the possibility that connection can be made between the damages obtained by
calculation, experimental studies conducted in laboratories, and finally the actual construction, which was
affected by the severe earthquake in Skopje.
4 CASE STUDY
4.1 Description of the structure
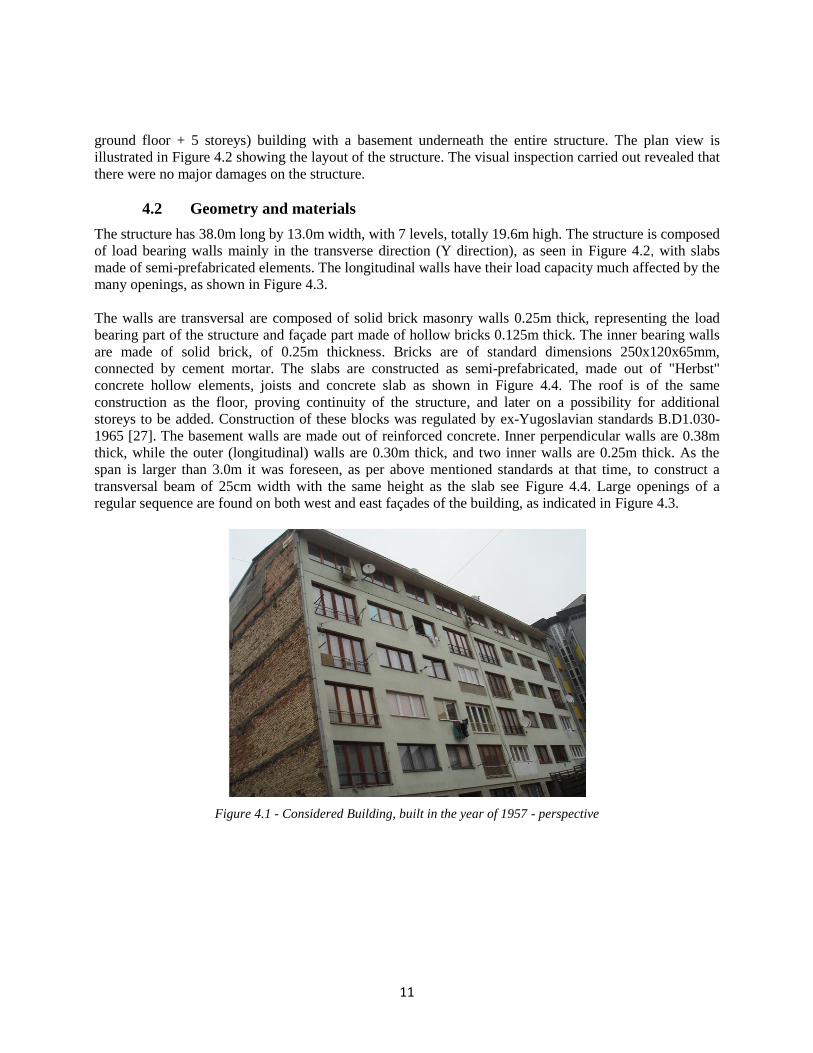
The typical masonry building under analysis is presented in Figure 4.1, located in Sarajevo, in the part of
the city called Grbavica. The structure has been design without any seismic guidelines and built in 1957.
During its life there have been no changes regarding its layout and usage. It is a seven level (basement +
11
ground floor + 5 storeys) building with a basement underneath the entire structure. The plan view is
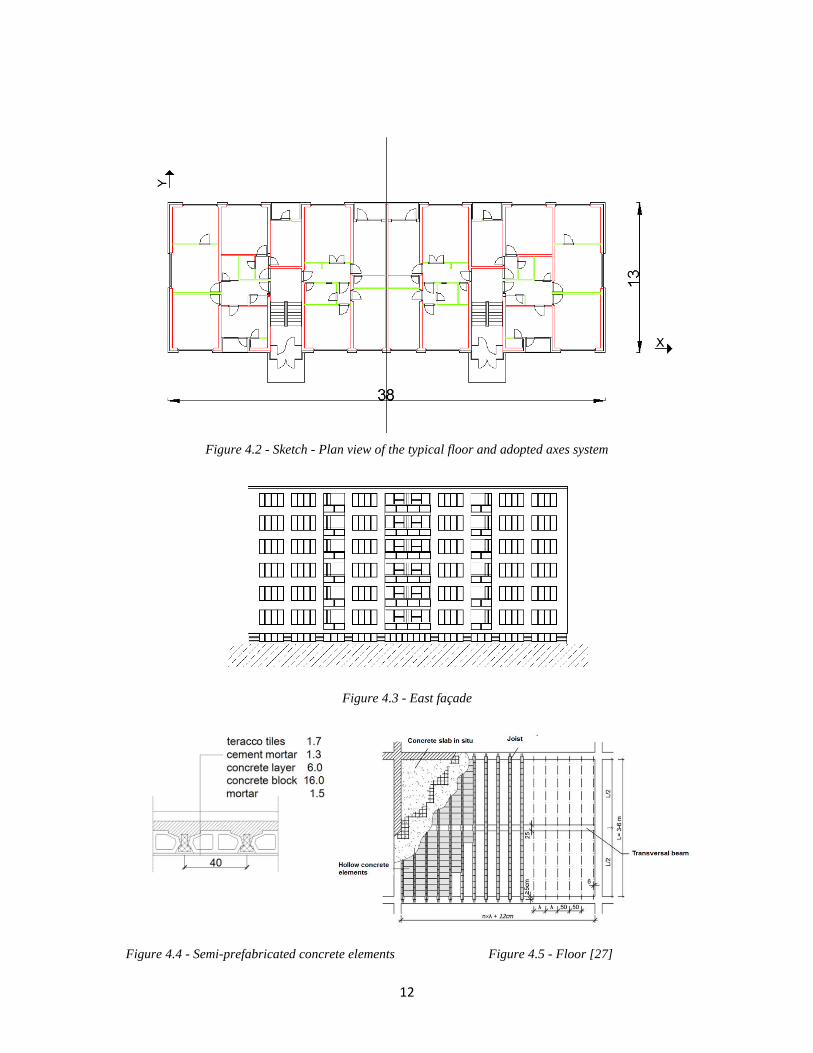
illustrated in Figure 4.2 showing the layout of the structure. The visual inspection carried out revealed that
there were no major damages on the structure.
4.2 Geometry and materials
The structure has 38.0m long by 13.0m width, with 7 levels, totally 19.6m high. The structure is composed
of load bearing walls mainly in the transverse direction (Y direction), as seen in Figure 4.2, with slabs
made of semi-prefabricated elements. The longitudinal walls have their load capacity much affected by the
many openings, as shown in Figure 4.3.
The walls are transversal are composed of solid brick masonry walls 0.25m thick, representing the load
bearing part of the structure and façade part made of hollow bricks 0.125m thick. The inner bearing walls
are made of solid brick, of 0.25m thickness. Bricks are of standard dimensions 250x120x65mm,
connected by cement mortar. The slabs are constructed as semi-prefabricated, made out of "Herbst"
concrete hollow elements, joists and concrete slab as shown in Figure 4.4. The roof is of the same
construction as the floor, proving continuity of the structure, and later on a possibility for additional
storeys to be added. Construction of these blocks was regulated by ex-Yugoslavian standards B.D1.030-
1965 [27]. The basement walls are made out of reinforced concrete. Inner perpendicular walls are 0.38m
thick, while the outer (longitudinal) walls are 0.30m thick, and two inner walls are 0.25m thick. As the
span is larger than 3.0m it was foreseen, as per above mentioned standards at that time, to construct a
transversal beam of 25cm width with the same height as the slab see Figure 4.4. Large openings of a
regular sequence are found on both west and east façades of the building, as indicated in Figure 4.3.
Figure 4.1 - Considered Building, built in the year of 1957 - perspective
12
Figure 4.2 - Sketch - Plan view of the typical floor and adopted axes system
Figure 4.3 - East façade
Figure 4.4 - Semi-prefabricated concrete elements Figure 4.5 - Floor [27]
13
Z
X
5 STRUCTURAL ANALYSIS METHODOLOGY
As it has been seen from numerous examples modeling of masonry structures is not an easy task [28]. In
this particular case, the main difficulties are attributed to the nonlinear behavior of masonry material and
insufficient experimental information regarding mechanical properties of masonry structural elements.
The structure has been modeled resorting two modeling strategies. Using the finite element method
(FEM); precisely DIANA 9.4 [29] software package. In this case an accurate geometrical and material
modeling of the building can be obtained, however the computational time is very long. On the other
hand, simplification regarding geometrical and material characteristics can be done by using the Frame by
Macro Elements approach (FME), namely 3MURI [30], one of the most proficient programs for
calculation of the masonry structures was used.
In order to get all the necessary data regarding the geometry, structural details and state of the structure
preliminary in situ investigations have been conducted. Original design was obtained from the authorities.
Verification of the geometric data was done with laser distancemeters and total stations, on the basis of
which drawings of the building were performed as shown in Figure 4.2 and Figure 4.3. In order to obtain
data regarding the mechanical and physical properties of materials, laboratory experimental tests were
done. Specifically, brick unit’s compressive strength and compressive strength of concrete walls were
determined.
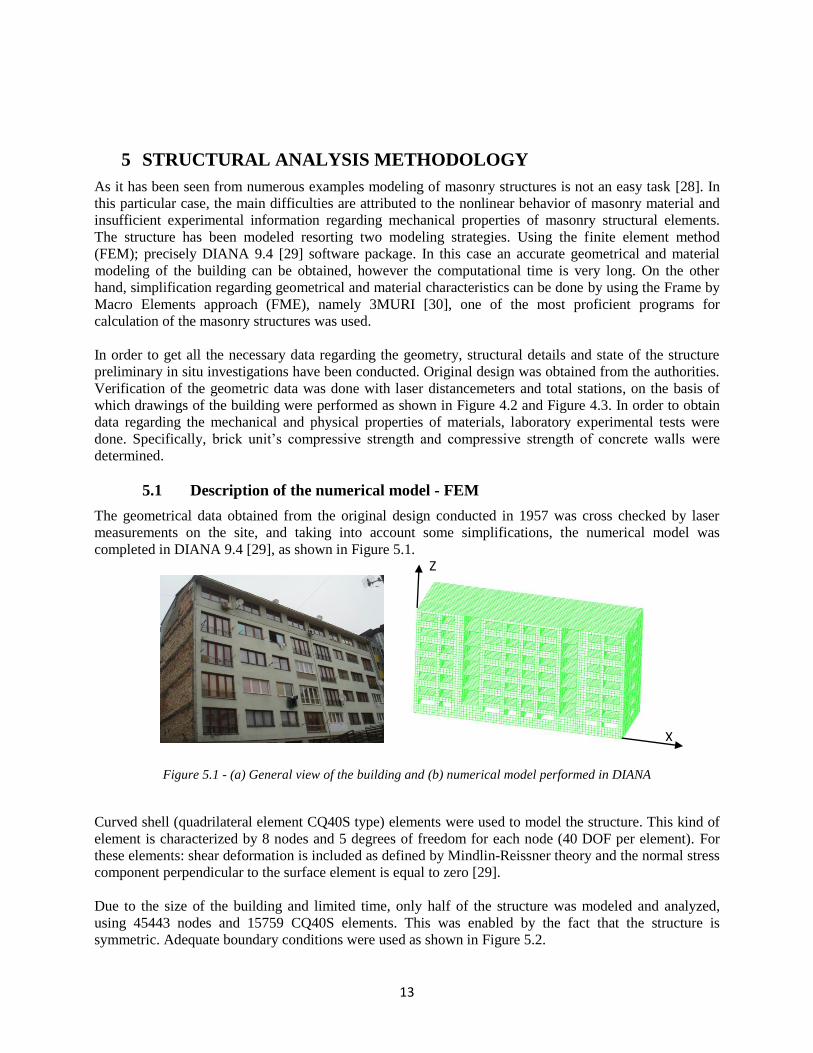
5.1 Description of the numerical model - FEM
The geometrical data obtained from the original design conducted in 1957 was cross checked by laser
measurements on the site, and taking into account some simplifications, the numerical model was
completed in DIANA 9.4 [29], as shown in Figure 5.1.
Figure 5.1 - (a) General view of the building and (b) numerical model performed in DIANA
Curved shell (quadrilateral element CQ40S type) elements were used to model the structure. This kind of
element is characterized by 8 nodes and 5 degrees of freedom for each node (40 DOF per element). For
these elements: shear deformation is included as defined by Mindlin-Reissner theory and the normal stress
component perpendicular to the surface element is equal to zero [29].
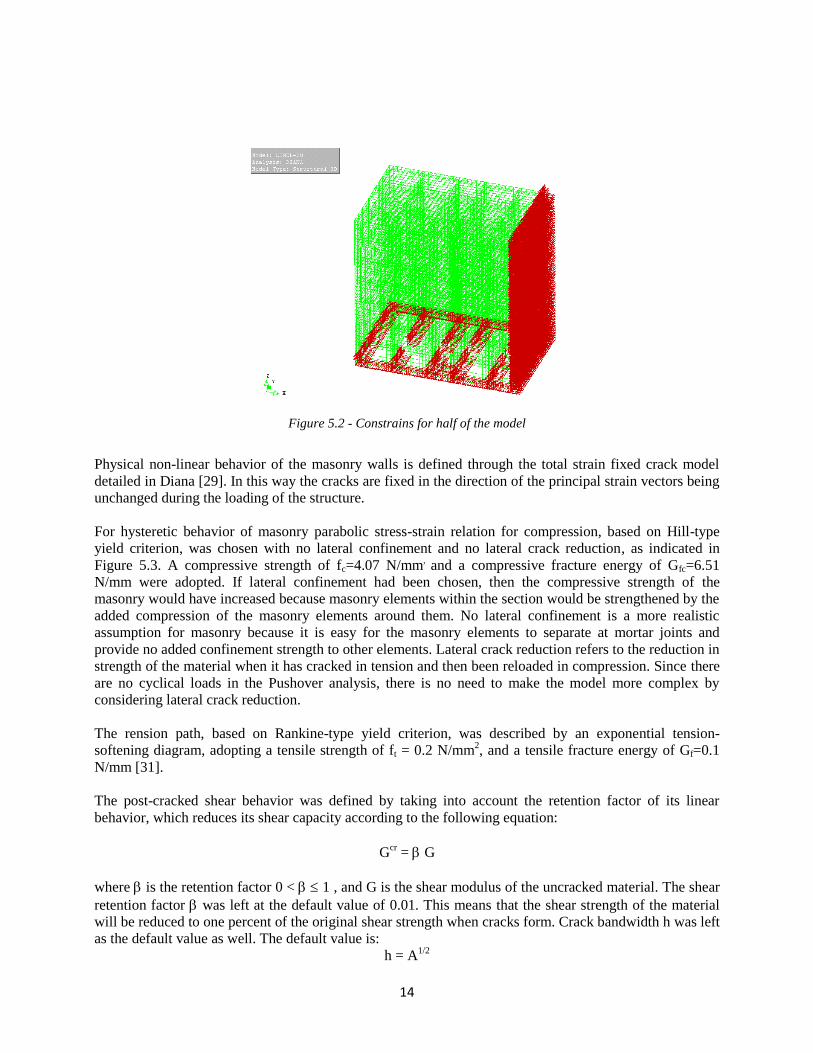
Due to the size of the building and limited time, only half of the structure was modeled and analyzed,
using 45443 nodes and 15759 CQ40S elements. This was enabled by the fact that the structure is
symmetric. Adequate boundary conditions were used as shown in Figure 5.2.
14
Figure 5.2 - Constrains for half of the model
Physical non-linear behavior of the masonry walls is defined through the total strain fixed crack model
detailed in Diana [29]. In this way the cracks are fixed in the direction of the principal strain vectors being
unchanged during the loading of the structure.
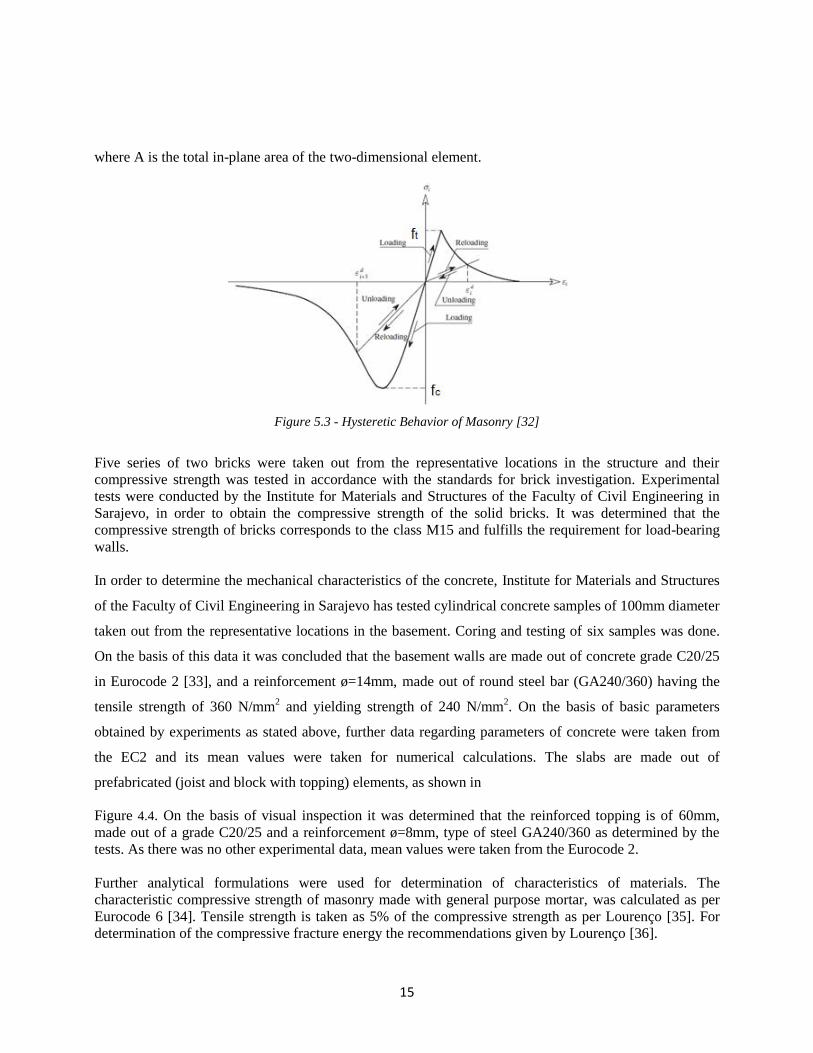
For hysteretic behavior of masonry parabolic stress-strain relation for compression, based on Hill-type
yield criterion, was chosen with no lateral confinement and no lateral crack reduction, as indicated in
Figure 5.3. A compressive strength of fc=4.07 N/mm,
and a compressive fracture energy of Gfc=6.51
N/mm were adopted. If lateral confinement had been chosen, then the compressive strength of the
masonry would have increased because masonry elements within the section would be strengthened by the
added compression of the masonry elements around them. No lateral confinement is a more realistic
assumption for masonry because it is easy for the masonry elements to separate at mortar joints and
provide no added confinement strength to other elements. Lateral crack reduction refers to the reduction in
strength of the material when it has cracked in tension and then been reloaded in compression. Since there
are no cyclical loads in the Pushover analysis, there is no need to make the model more complex by
considering lateral crack reduction.
The rension path, based on Rankine-type yield criterion, was described by an exponential tension-
softening diagram, adopting a tensile strength of ft = 0.2 N/mm2, and a tensile fracture energy of Gf=0.1
N/mm [31].
The post-cracked shear behavior was defined by taking into account the retention factor of its linear
behavior, which reduces its shear capacity according to the following equation:
Gcr = G
where is the retention factor 0 < 1 , and G is the shear modulus of the uncracked material. The shear
retention factor was left at the default value of 0.01. This means that the shear strength of the material
will be reduced to one percent of the original shear strength when cracks form. Crack bandwidth h was left
as the default value as well. The default value is:
h = A1/2
15
where A is the total in-plane area of the two-dimensional element.
Figure 5.3 - Hysteretic Behavior of Masonry [32]
Five series of two bricks were taken out from the representative locations in the structure and their
compressive strength was tested in accordance with the standards for brick investigation. Experimental
tests were conducted by the Institute for Materials and Structures of the Faculty of Civil Engineering in
Sarajevo, in order to obtain the compressive strength of the solid bricks. It was determined that the
compressive strength of bricks corresponds to the class M15 and fulfills the requirement for load-bearing
walls.
In order to determine the mechanical characteristics of the concrete, Institute for Materials and Structures
of the Faculty of Civil Engineering in Sarajevo has tested cylindrical concrete samples of 100mm diameter
taken out from the representative locations in the basement. Coring and testing of six samples was done.
On the basis of this data it was concluded that the basement walls are made out of concrete grade C20/25
in Eurocode 2 [33], and a reinforcement ø=14mm, made out of round steel bar (GA240/360) having the
tensile strength of 360 N/mm2 and yielding strength of 240 N/mm
2. On the basis of basic parameters
obtained by experiments as stated above, further data regarding parameters of concrete were taken from
the EC2 and its mean values were taken for numerical calculations. The slabs are made out of
prefabricated (joist and block with topping) elements, as shown in
Figure 4.4. On the basis of visual inspection it was determined that the reinforced topping is of 60mm,
made out of a grade C20/25 and a reinforcement ø=8mm, type of steel GA240/360 as determined by the
tests. As there was no other experimental data, mean values were taken from the Eurocode 2.
Further analytical formulations were used for determination of characteristics of materials. The
characteristic compressive strength of masonry made with general purpose mortar, was calculated as per
Eurocode 6 [34]. Tensile strength is taken as 5% of the compressive strength as per Lourenço [35]. For
determination of the compressive fracture energy the recommendations given by Lourenço [36].
16
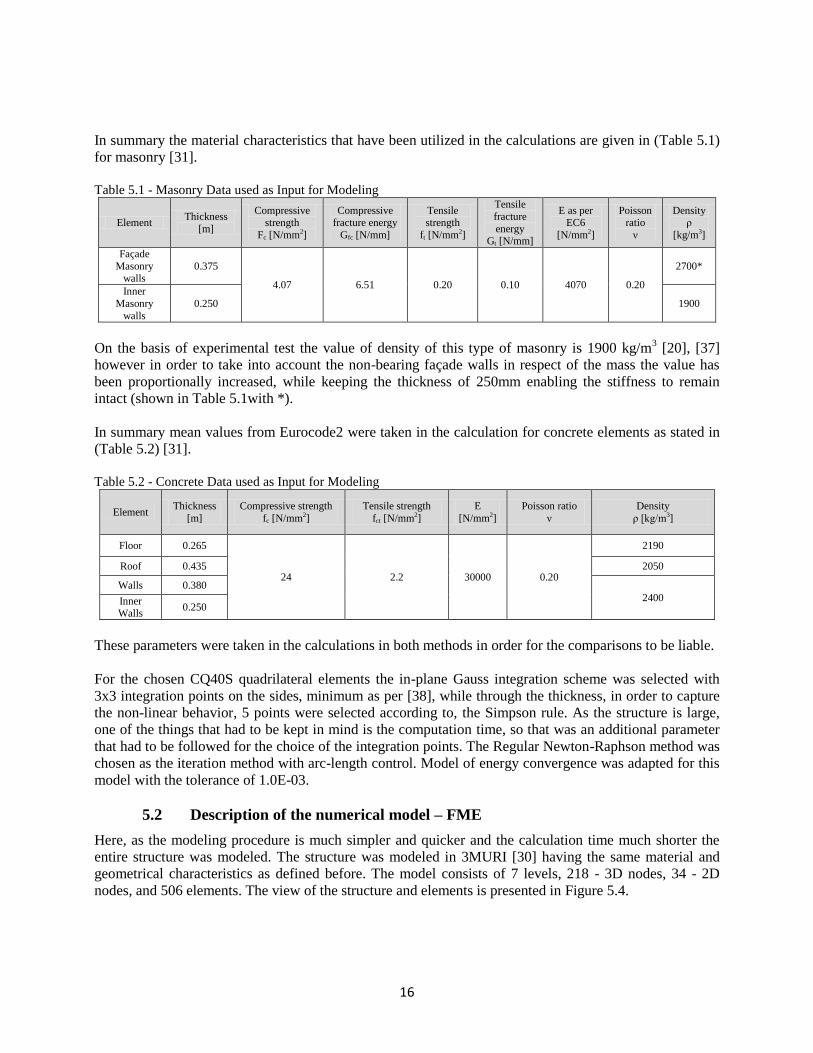
In summary the material characteristics that have been utilized in the calculations are given in (Table 5.1)
for masonry [31].
Table 5.1 - Masonry Data used as Input for Modeling
Element Thickness
[m]
Compressive strength
Fc [N/mm2]
Compressive fracture energy
Gfc [N/mm]
Tensile strength
ft [N/mm2]
Tensile
fracture
energy Gt [N/mm]
E as per EC6
[N/mm2]
Poisson ratio
ν
Density ρ
[kg/m3]
Façade
Masonry walls
0.375
4.07 6.51 0.20 0.10 4070 0.20
2700*
Inner
Masonry
walls
0.250 1900
On the basis of experimental test the value of density of this type of masonry is 1900 kg/m3 [20], [37]
however in order to take into account the non-bearing façade walls in respect of the mass the value has
been proportionally increased, while keeping the thickness of 250mm enabling the stiffness to remain
intact (shown in Table 5.1with *).
In summary mean values from Eurocode2 were taken in the calculation for concrete elements as stated in
(Table 5.2) [31].
Table 5.2 - Concrete Data used as Input for Modeling
Element Thickness
[m]
Compressive strength
fc [N/mm2]
Tensile strength
fct [N/mm2]
E
[N/mm2]
Poisson ratio
ν
Density
ρ [kg/m3]
Floor 0.265
24 2.2 30000 0.20
2190
Roof 0.435 2050
Walls 0.380
2400 Inner Walls
0.250
These parameters were taken in the calculations in both methods in order for the comparisons to be liable.
For the chosen CQ40S quadrilateral elements the in-plane Gauss integration scheme was selected with
3x3 integration points on the sides, minimum as per [38], while through the thickness, in order to capture
the non-linear behavior, 5 points were selected according to, the Simpson rule. As the structure is large,
one of the things that had to be kept in mind is the computation time, so that was an additional parameter
that had to be followed for the choice of the integration points. The Regular Newton-Raphson method was
chosen as the iteration method with arc-length control. Model of energy convergence was adapted for this
model with the tolerance of 1.0E-03.
5.2 Description of the numerical model – FME
Here, as the modeling procedure is much simpler and quicker and the calculation time much shorter the
entire structure was modeled. The structure was modeled in 3MURI [30] having the same material and
geometrical characteristics as defined before. The model consists of 7 levels, 218 - 3D nodes, 34 - 2D
nodes, and 506 elements. The view of the structure and elements is presented in Figure 5.4.
17
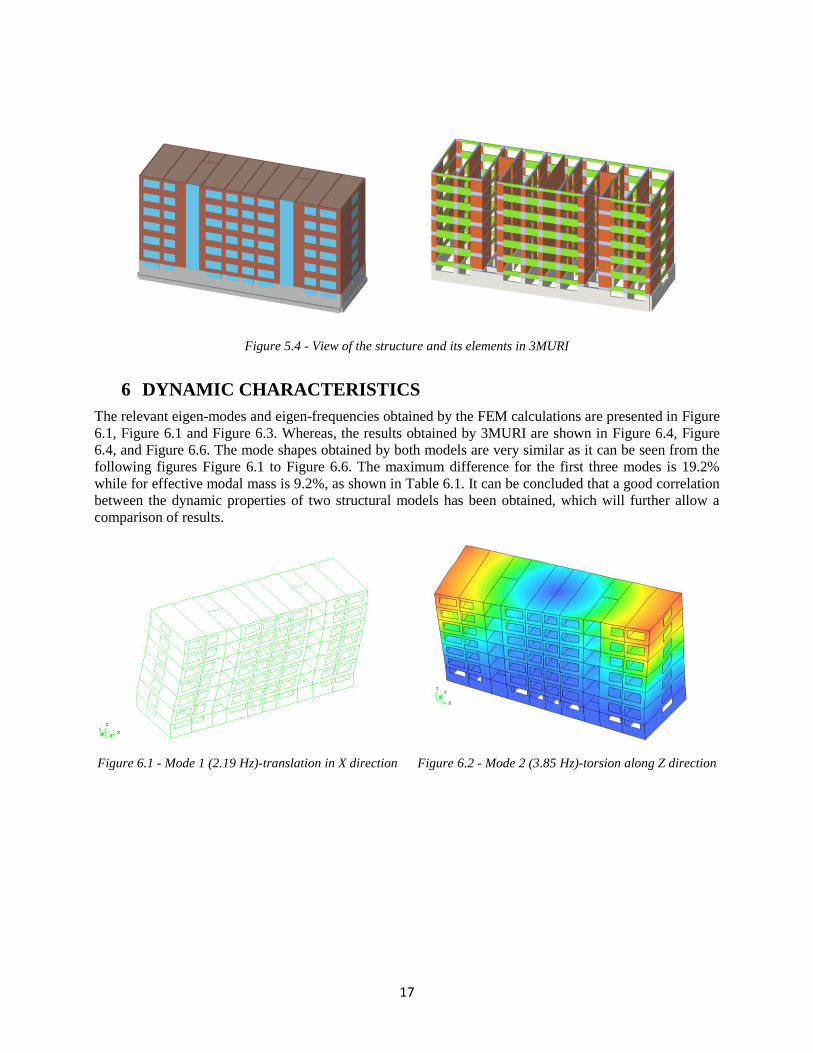
Figure 5.4 - View of the structure and its elements in 3MURI
6 DYNAMIC CHARACTERISTICS
The relevant eigen-modes and eigen-frequencies obtained by the FEM calculations are presented in Figure
6.1, Figure 6.1 and Figure 6.3. Whereas, the results obtained by 3MURI are shown in Figure 6.4, Figure
6.4, and Figure 6.6. The mode shapes obtained by both models are very similar as it can be seen from the
following figures Figure 6.1 to Figure 6.6. The maximum difference for the first three modes is 19.2%
while for effective modal mass is 9.2%, as shown in Table 6.1. It can be concluded that a good correlation
between the dynamic properties of two structural models has been obtained, which will further allow a
comparison of results.
Figure 6.1 - Mode 1 (2.19 Hz)-translation in X direction Figure 6.2 - Mode 2 (3.85 Hz)-torsion along Z direction
18
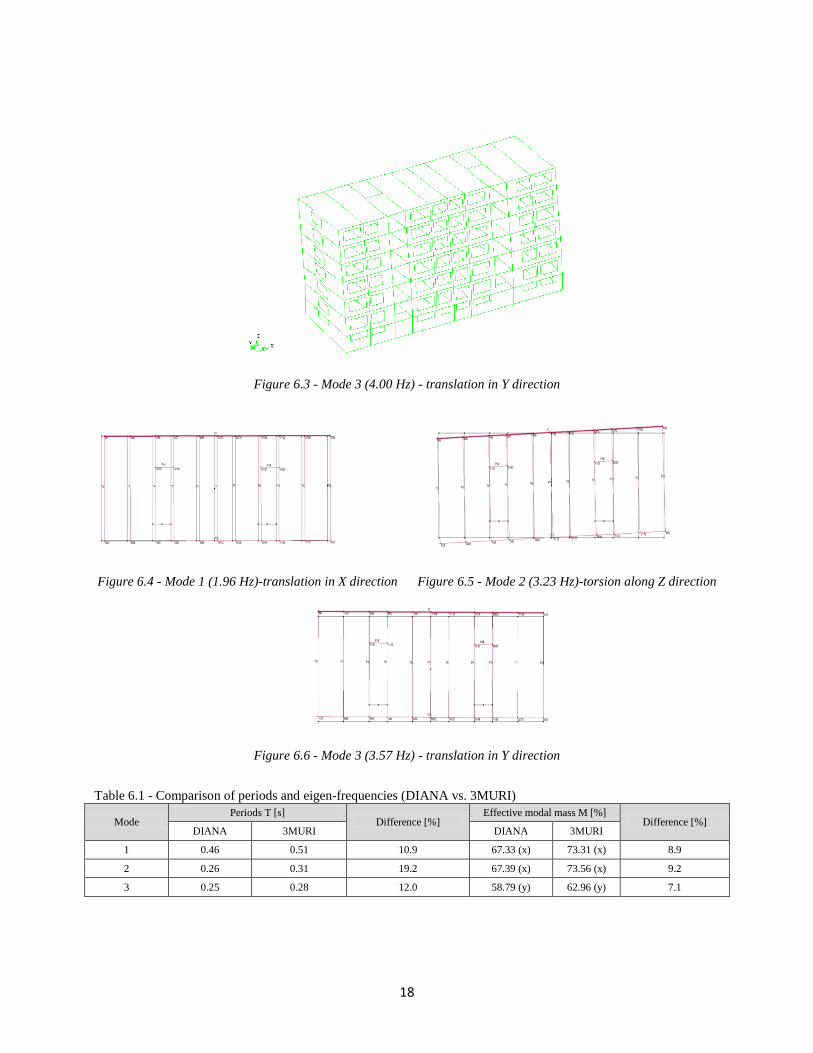
Figure 6.3 - Mode 3 (4.00 Hz) - translation in Y direction
Figure 6.4 - Mode 1 (1.96 Hz)-translation in X direction Figure 6.5 - Mode 2 (3.23 Hz)-torsion along Z direction
Figure 6.6 - Mode 3 (3.57 Hz) - translation in Y direction
Table 6.1 - Comparison of periods and eigen-frequencies (DIANA vs. 3MURI)
Mode Periods T [s]
Difference [%] Effective modal mass M [%]
Difference [%] DIANA 3MURI DIANA 3MURI
1 0.46 0.51 10.9 67.33 (x) 73.31 (x) 8.9
2 0.26 0.31 19.2 67.39 (x) 73.56 (x) 9.2
3 0.25 0.28 12.0 58.79 (y) 62.96 (y) 7.1
19
7 PUSHOVER
7.1 Results obtained in FEM calculations
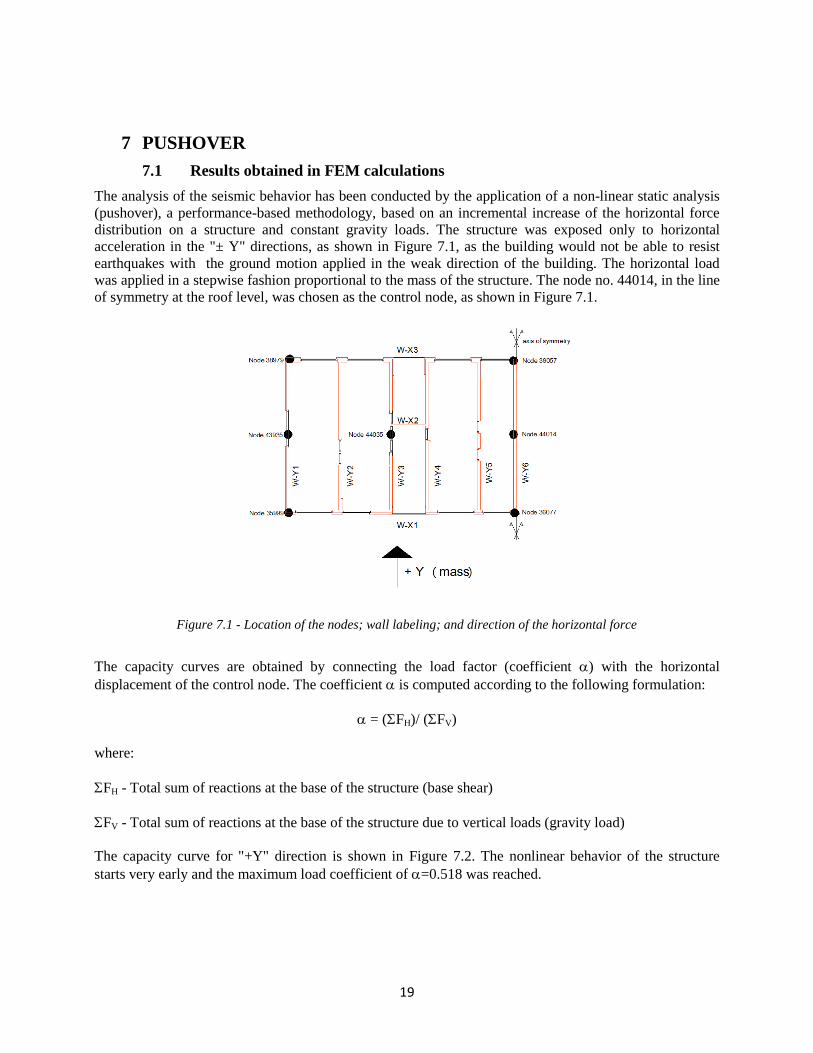
The analysis of the seismic behavior has been conducted by the application of a non-linear static analysis
(pushover), a performance-based methodology, based on an incremental increase of the horizontal force
distribution on a structure and constant gravity loads. The structure was exposed only to horizontal
acceleration in the "± Y" directions, as shown in Figure 7.1, as the building would not be able to resist
earthquakes with the ground motion applied in the weak direction of the building. The horizontal load
was applied in a stepwise fashion proportional to the mass of the structure. The node no. 44014, in the line
of symmetry at the roof level, was chosen as the control node, as shown in Figure 7.1.
Figure 7.1 - Location of the nodes; wall labeling; and direction of the horizontal force
The capacity curves are obtained by connecting the load factor (coefficient ) with the horizontal
displacement of the control node. The coefficient is computed according to the following formulation:
= (FH)/ (FV)
where:
FH - Total sum of reactions at the base of the structure (base shear)
FV - Total sum of reactions at the base of the structure due to vertical loads (gravity load)
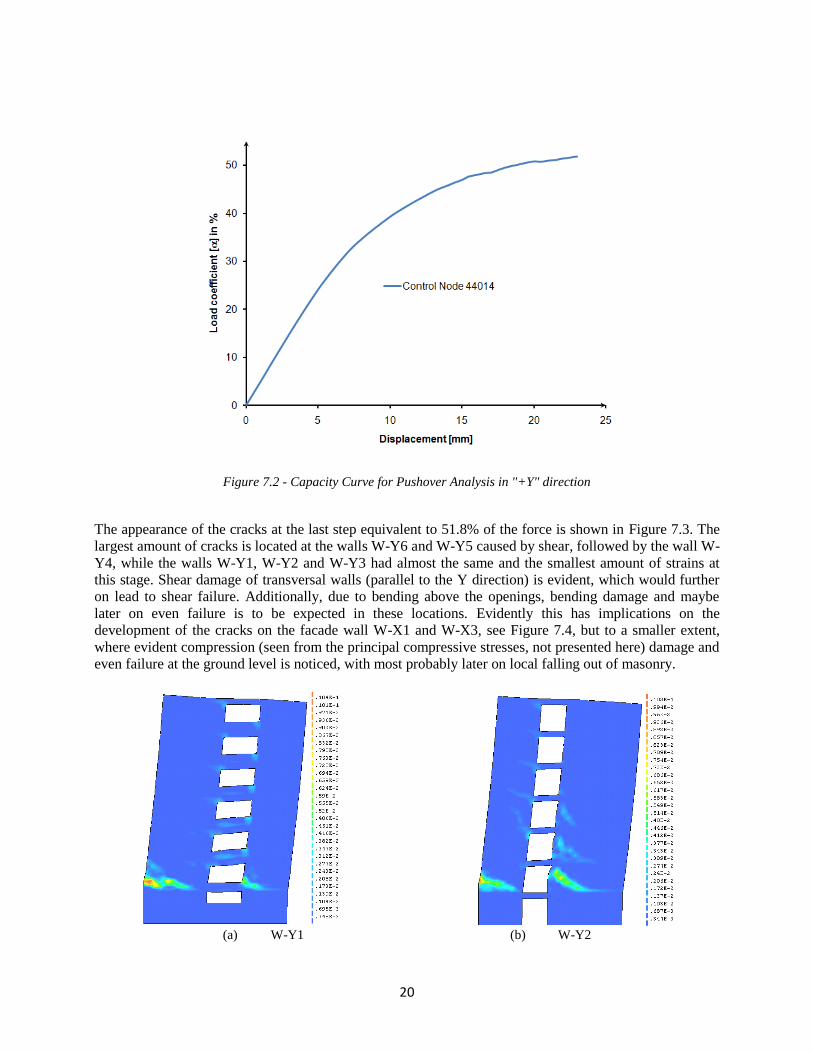
The capacity curve for "+Y" direction is shown in Figure 7.2. The nonlinear behavior of the structure
starts very early and the maximum load coefficient of =0.518 was reached.
20
Figure 7.2 - Capacity Curve for Pushover Analysis in "+Y" direction
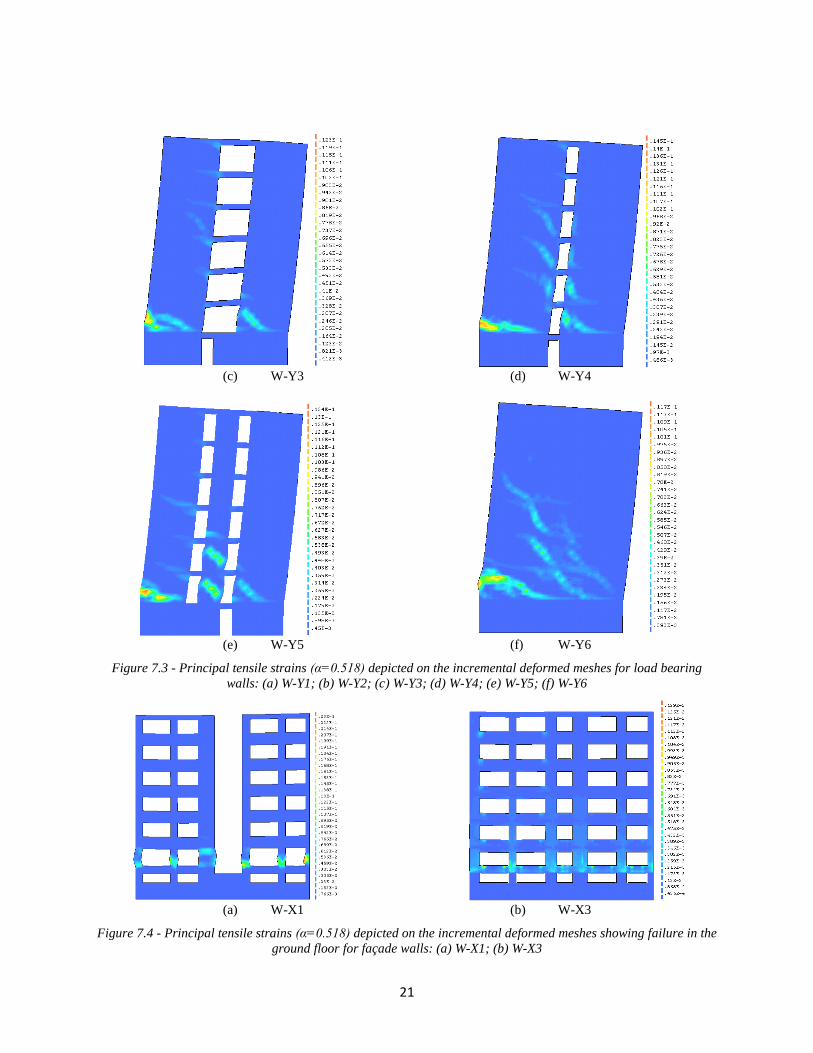
The appearance of the cracks at the last step equivalent to 51.8% of the force is shown in Figure 7.3. The
largest amount of cracks is located at the walls W-Y6 and W-Y5 caused by shear, followed by the wall W-
Y4, while the walls W-Y1, W-Y2 and W-Y3 had almost the same and the smallest amount of strains at
this stage. Shear damage of transversal walls (parallel to the Y direction) is evident, which would further
on lead to shear failure. Additionally, due to bending above the openings, bending damage and maybe
later on even failure is to be expected in these locations. Evidently this has implications on the
development of the cracks on the facade wall W-X1 and W-X3, see Figure 7.4, but to a smaller extent,
where evident compression (seen from the principal compressive stresses, not presented here) damage and
even failure at the ground level is noticed, with most probably later on local falling out of masonry.
(a) W-Y1 (b) W-Y2
21
(c) W-Y3 (d) W-Y4
(e) W-Y5 (f) W-Y6
Figure 7.3 - Principal tensile strains (α=0.518) depicted on the incremental deformed meshes for load bearing
walls: (a) W-Y1; (b) W-Y2; (c) W-Y3; (d) W-Y4; (e) W-Y5; (f) W-Y6
(a) W-X1 (b) W-X3
Figure 7.4 - Principal tensile strains (α=0.518) depicted on the incremental deformed meshes showing failure in the
ground floor for façade walls: (a) W-X1; (b) W-X3
22
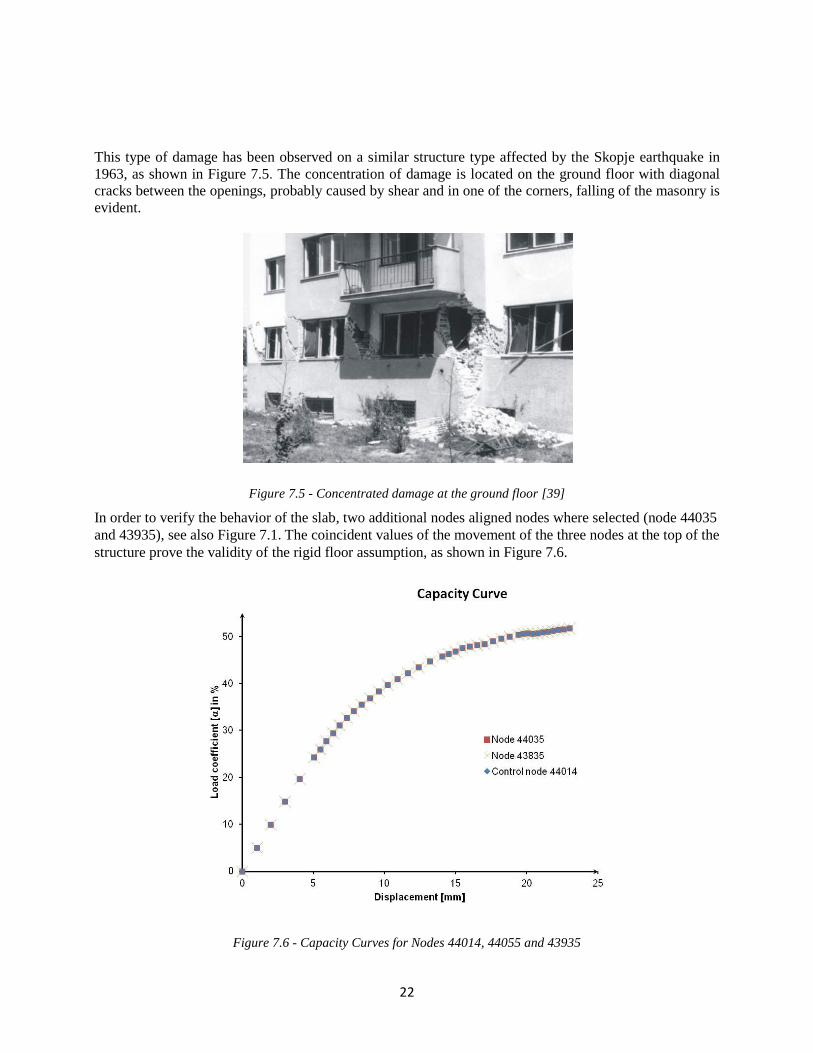
This type of damage has been observed on a similar structure type affected by the Skopje earthquake in
1963, as shown in Figure 7.5. The concentration of damage is located on the ground floor with diagonal
cracks between the openings, probably caused by shear and in one of the corners, falling of the masonry is
evident.
Figure 7.5 - Concentrated damage at the ground floor [39]
In order to verify the behavior of the slab, two additional nodes aligned nodes where selected (node 44035
and 43935), see also Figure 7.1. The coincident values of the movement of the three nodes at the top of the
structure prove the validity of the rigid floor assumption, as shown in Figure 7.6.
Figure 7.6 - Capacity Curves for Nodes 44014, 44055 and 43935
23
7.2 Conclusion - FEM
The behavior of this structure can be clearly connected to the behavior of masonry structures stated by
Tomaževič [20]. The diagonal cracks in the load-bearing wall in direction of the seismic action are caused
by shear causing shear damage and probably later on shear failure of these walls, accompanied most
probably by bending damage as well. Due to bending, cracks are developing at the corners of the openings
represented by vertical cracks. The bending damage of the lintels will probably lead to the bending failure
of these elements. Development of the cracks located around the openings in the piers which can be
causing compression damage is seen at the façade walls (W-X1 and W-X3). Formations of some diagonal
crack have been identified, so here a combination of the compression and shear failure could be expected.
The level between the basement and the ground floor is seen as the weakest point in the structure caused
by a large change of stiffness.
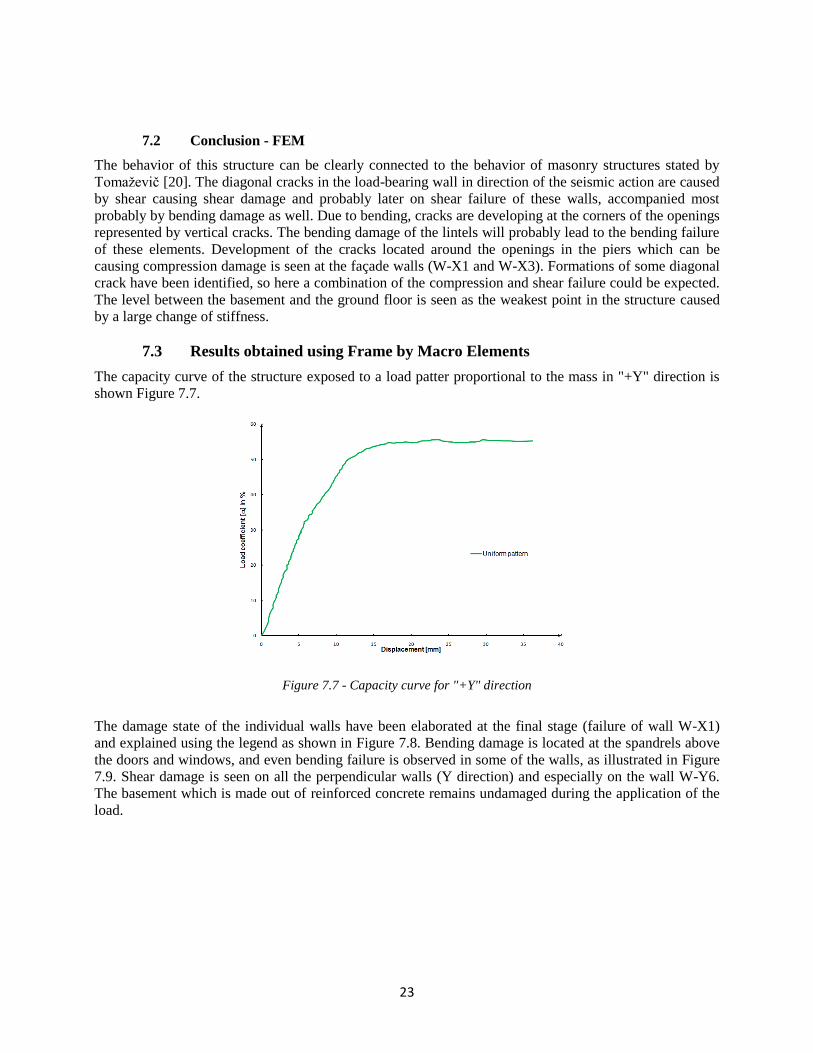
7.3 Results obtained using Frame by Macro Elements
The capacity curve of the structure exposed to a load patter proportional to the mass in "+Y" direction is
shown Figure 7.7.
Figure 7.7 - Capacity curve for "+Y" direction
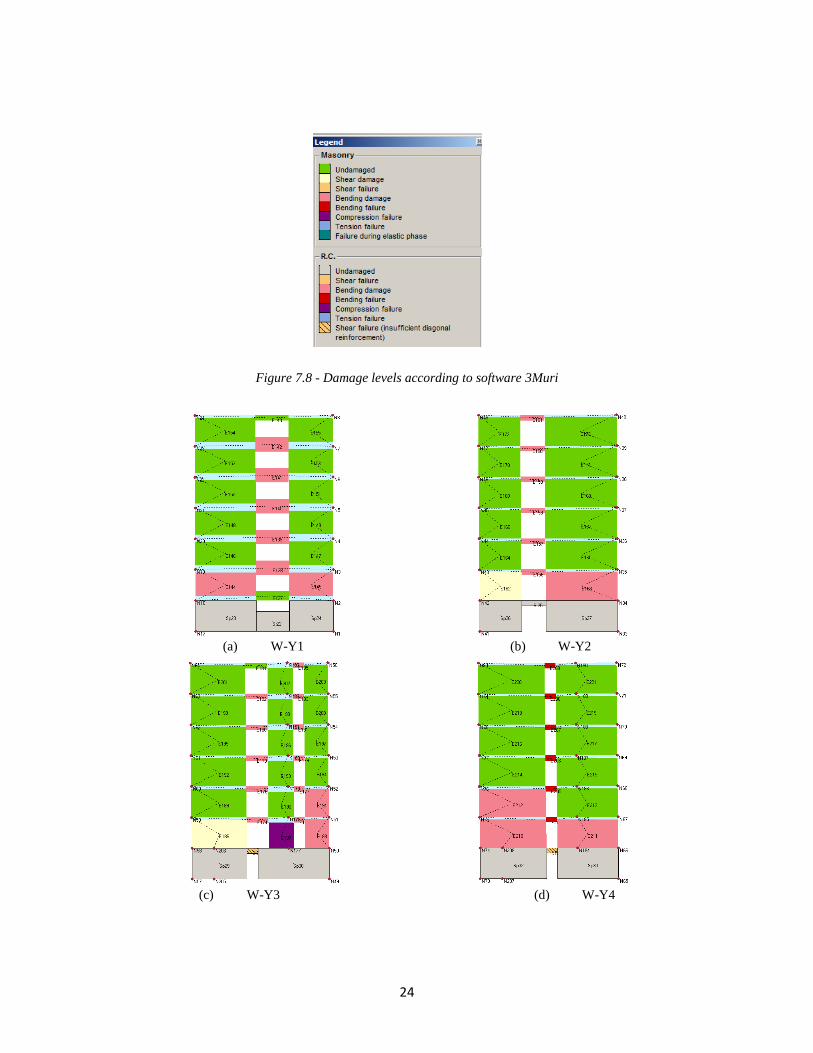
The damage state of the individual walls have been elaborated at the final stage (failure of wall W-X1)
and explained using the legend as shown in Figure 7.8. Bending damage is located at the spandrels above
the doors and windows, and even bending failure is observed in some of the walls, as illustrated in Figure
7.9. Shear damage is seen on all the perpendicular walls (Y direction) and especially on the wall W-Y6.
The basement which is made out of reinforced concrete remains undamaged during the application of the
load.
24
Figure 7.8 - Damage levels according to software 3Muri
(a) W-Y1 (b) W-Y2
(c) W-Y3 (d) W-Y4
25
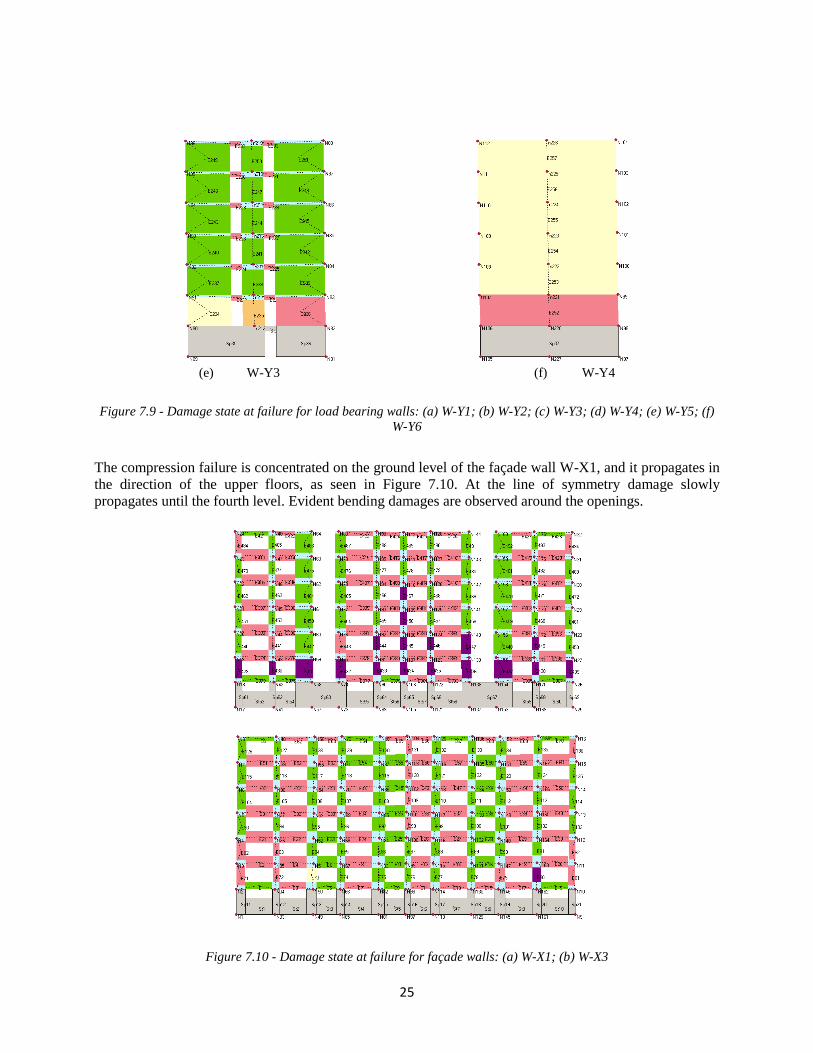
(e) W-Y3 (f) W-Y4
Figure 7.9 - Damage state at failure for load bearing walls: (a) W-Y1; (b) W-Y2; (c) W-Y3; (d) W-Y4; (e) W-Y5; (f)
W-Y6
The compression failure is concentrated on the ground level of the façade wall W-X1, and it propagates in
the direction of the upper floors, as seen in Figure 7.10. At the line of symmetry damage slowly
propagates until the fourth level. Evident bending damages are observed around the openings.
Figure 7.10 - Damage state at failure for façade walls: (a) W-X1; (b) W-X3
26
7.4 Conclusion – FME
On the basis of the analysis done using the 3MURI program, it could be seen that the structure has a
typical shear behavior. As the structure is composed by load-bearing walls in only one direction, the
weakness in the other direction ("X" direction - longitudinal walls) was evident. Additionally, damage of
the spandrels is due to stress concentration around the openings. Regarding the façade walls, most of the
damage is concentrated on the lower floors with slow rising of the damage to the upper levels. On the
basis of these calculations it could be concluded that the structure has a rather "good" behavior in the "Y"
direction, however its evident weakness in the "X" direction in the global view makes the structure not
capable of resisting earthquake actions of this range. Due to this strengthening of the structure is
suggested.
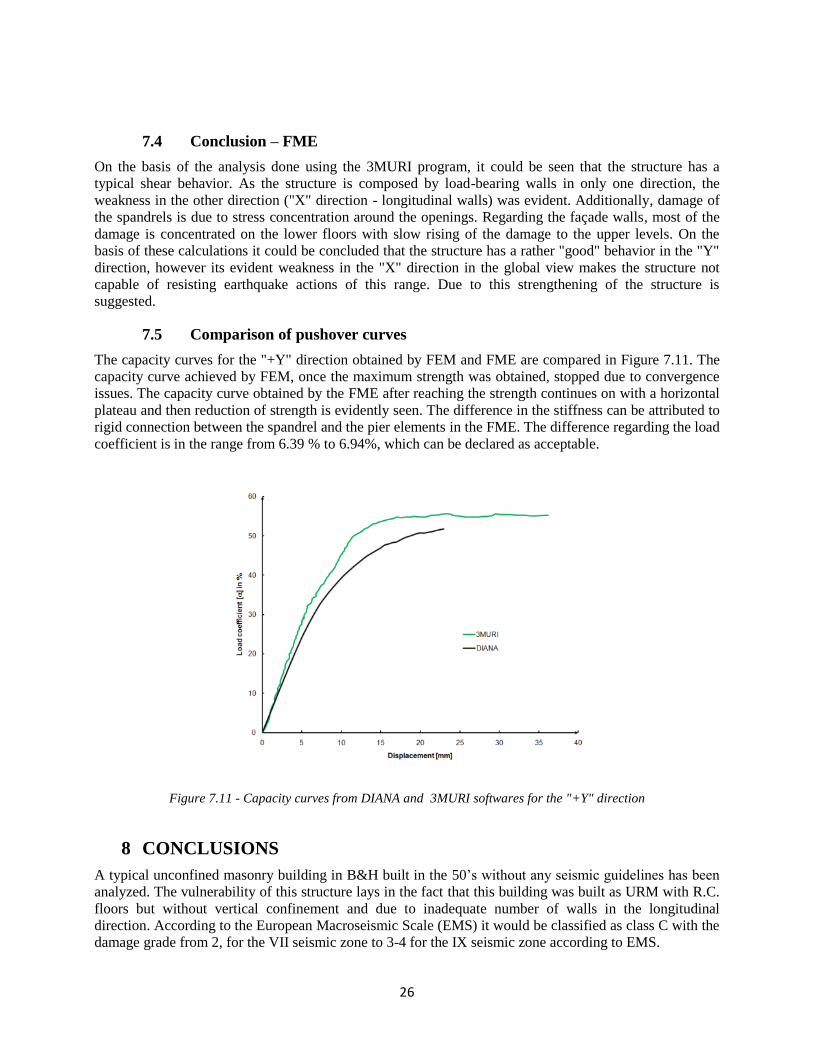
7.5 Comparison of pushover curves
The capacity curves for the "+Y" direction obtained by FEM and FME are compared in Figure 7.11. The
capacity curve achieved by FEM, once the maximum strength was obtained, stopped due to convergence
issues. The capacity curve obtained by the FME after reaching the strength continues on with a horizontal
plateau and then reduction of strength is evidently seen. The difference in the stiffness can be attributed to
rigid connection between the spandrel and the pier elements in the FME. The difference regarding the load
coefficient is in the range from 6.39 % to 6.94%, which can be declared as acceptable.
Figure 7.11 - Capacity curves from DIANA and 3MURI softwares for the "+Y" direction
8 CONCLUSIONS
A typical unconfined masonry building in B&H built in the 50’s without any seismic guidelines has been
analyzed. The vulnerability of this structure lays in the fact that this building was built as URM with R.C.
floors but without vertical confinement and due to inadequate number of walls in the longitudinal
direction. According to the European Macroseismic Scale (EMS) it would be classified as class C with the
damage grade from 2, for the VII seismic zone to 3-4 for the IX seismic zone according to EMS.
27
Several comparisons have been made, and it can be concluded that the choice regarding the level of
sophistication of the model has a direct impact on the accuracy of the results as well as on the degree of
detail regarding the representation of the crack pattern. FEM model done gives a very detailed crack
pattern, however at the same time the computational time is much longer in respect to FME. In this case
study, the structure being rather regular, results obtained with 3MURI are in a very good correlation with
the results obtained by DIANA.
In both calculations the structure showed a typical shear failure mode in the walls parallel to the action of
the load. In the façade walls (along the X-axis) the concentration of the damage in both models is seen at
the lower floors with a slow propagation over the height of the structure. The location of this concentrated
damage can be connected to the large stiffness change at this location.
On the basis of this it may be concluded that in this case calculation with 3MURI program could be
recommended for engineering analysis of this type of structures, having quite good results with a less
computation time. However, in the need for more precise results FEM should be utilized.
9 ACKNOWLEDGEMENTS
We wish to acknowledge the following organizations whose support and contributions led to the success
of the master thesis conducted at the University of Minho. Financial support provided by the European
Commission; members of SACH Consortium for giving the opportunity to the first author to work on the
thesis that she has chosen. The appreciation goes to University of Minho for giving the opportunity to the
first author to conduct the simulation on the DIANA software. Finally, the acknowledgment goes as well
to the Faculty of Civil Engineering in Sarajevo and the Institute for Materials and Structures where
experimental work has been conducted.
10 REFERENCES
[1] Gisdevelopment. www.gisdevelopment.net. Gisdevelopment. [Online] 2008.
[2] World-Atlas, 2011. World Atlas. [Online] [Cited: April 20, 2011.]
http://www.worldatlas.com/webimage/countrys/europe/balkans.htm.
[3] J.M. Nocquet, et al. Intraplate deformations in Western Europe deducted from an analysis of the
International Terrestrian Reference Frame 1997 (ITRF 1997) velocity field. J. Geophys. Res. 2001; Vol.
106, No. B6, p. 11,239-11,257.
[4] G. Mele. The Adriatic lithosphere is a pomontory of the African Plate; evidence of a continuous
mantle lid in the Ionian Sea from efficient Sn propagation.. Geophys. Res. Lett, 2001; Vol. 28, p.431-434.
[5] S. McClusky, et al. Global Positioning System constraints on plate kinematics and dynamics in the
eastern Mediterranean and Caucasus. J. Geophys. Res. 2000; Vol. 105, p. 5695-5719.
[6] B. Pribičević, D. Medak, Damir, E. Prelogović. Determination of the recent structural fabric in the
Alps – Dinarides area by combination of geodetic and geologic methods. Ljubljana: Zbornik predavanja
Raziskave s področja geodezije in geofizike, Fakulteta za gradbeništvo in geodezijo, Univerza v Ljubljani,
2002, p.57-64.
[7] J.S. Oldow, et al. Active fragmentation of Adria, the north African promontory, central Mediterranean
orogen, Geology, 2002; Vol. 30, p. 779-782.
[8] J. Papeš. Tektonska građa teritorije SR BiH [Izvještaj], Sarajevo: Geoinstitut Ilidža, 1988. (in Bosnian)
[9] H. Hrvatović. Seismicity and Seismotectonic of the Dinarides of Bosnia and Herzegovina.
Geotectonic. Tom. Geodynamics of the Balkan Peninsula Monograph 2006; No. 5 (80), p. 73-91.
28
[10] http://www.emsc-csem.org/. European-Mediterranean Seismological Center. [Online] [Cited: April
13, 2011.]
[11] M. Hrasnica. Seizmička analiza zgrada, Gradjevinski fakultet Sarajevo, 2005. (in Bosnian)
[12] European-Mediterranean-Seismic-Hazard-Map, 2005.
http://www.preventionweb.net/files/10049_10049ESCSESAMEposterA41.jpg [Online] //. European-
Mediterranean Seismic Hazard Map. - 2005. [Online] 2005. [Cited: april 09, 2011.]
[13] M Hrasnica. Damage Assessment of Masonry and Historical Buildings in Bosnia and Herzegovina,
Chapter in: Damage assessment and reconstruction after war or natural disasters, eds: Ibrahimbegović and
Zlatar, Springer Verlag 2009; p.333-356.
[14] EMS, European Macroseiscic Scale, editor. P.Grünthal, Luxembourg, 1998.
[15] P. Fajfar, P. Gaspersic. The N2 method for the seismic damage analysis of RC buildings. Earthquake
Engineering and Structural Dynamics, 1996; Vol. 25, p.31–46. [16] M. Saiidi, MA. Sozen. Simple nonlinear seismic analysis of R/C structures. Journal of the Structural
Division, ASCE, 1981;107(ST5), p.937–51.
[17] P. Fajfar, and M. Fischinger. N2 - Method for Nonlinear Seismic Analysis of Regular Structures,
Proceedings of the Ninth World Conference on Earthquake Engineering (Tokyo-Kyoto, Japan, 1988), Vol.
5, 1988; p. 111-116.
[18] W.K.Tso, A.S. Moghadam. Pushover procedure for seismic analysis of buildings, Progress in
Structural Engineering and Materials, 1998; Vol. 1, No.3, p.337-344.
[19] J.M. Bracci, S.K. Kunnath, A.M. Reinhorn. Seismic performance and retrofit evaluation of reinforced
concrete structures. Journal of Structural Engineering, ASCE 1997; 123(1), p.3-10.
[20] M. Tomaževič. Earthquake-Resistant Design of Masonary Buildings, Imperial College
Press, Tom. I., 1999.
[21] G. Magenes. A. Della Fontana. Simplified non-linear seismic analysis of masonry buildings,
Proceedings of the British Masonry Society, 1998; Vol. 8, p. 190-195
[22] FEMA-356. Prestandard and Commentary for the seismic rehabilitation of buildings, American
Society of Civil Engineers (ASCE). 2000. Reston, VA.
[23] Eurocode 8. Design provisions for earthquake resistance of structures. Part 1-1, 1-2 and 1-3, Comite
Europeen de Normalisation, 1994.European Pre-standard ENV 1998-1-1, 1-2, and 1-3, Bruxelles.
[24] R.S. Lawson, V. Vance, and H. Krawinkler. Nonlinear static pushover analysis, why, when and how
?, Proceedings of 5th US National Conference on Earthquake Engineering, Chicago, Vol. 1. 1994). p. 283-
92.
[25] H. Krawinkler, G.D. Seneviratna, Pros and cons of pushover analysis of seismic performance
evaluation, Engineering Structures, Vol. 20, No.4-6. 1998. p. 452-464.
[26] K. Tanrikulu, Yalcin M. and H. McNiven. The Non-linear Response of Unreinforced Masonry
Buildings to Earthquake Excitation. Earthquake Engineering and Structural Dynamics. John Wiley &
Sons, Ltd, 1992. Vol. 21. p. 965-985.
[27] Đ. Peulić, Konstruktivni elementi zgrada. Zagreb: Croatiaknjiga, 2002.
[28] P.B. Lourenço. Computations of historical masonary constructions, Prog. Struct. Eng. Mater, 2002;
Vol. 4 (3), p. 301-319.
[29] DIANA 9.4, TNO. DIsplacement method ANAlyser 9.4. Finite element analysis. User’s Manual,
release 9.4,. Netherlands: s.n., 2009; Vol. Release 9.4.
[30] S.T.A.-DATA. 3 Muri Manual. Torino: STA DATA srl, 2010.
[31] N. Ademovi. Structural and Seismic Behavior of Typical Masonry Buildings from Bosnia and
Herzegovina, MSc Thesis, University of Minho, 2011.
[32] N. Mendes, P.B. Lourenço. Sesimic Assessment of Masonry "Gaioleiro" Buildig in Lisbon, Portugal,
Journal of Earthquake Engineering. 2010; Vol 14 (1), p. 80-101.
[33] Eurocode 2. Design of concrete structures. Comite Europeen de Normalisation, 2002. Bruxelles.
29
[34] Eurocode 6. Design of Masonry Structures - Part 1-1: General Rules for Reinforced and Unreinforced
Masonry Structures Comite Europeen de Normalisation, 1996.European Pre-standard ENV 1998,
Bruxelles.
[35] P.B. Lourenço, J.C. Almeida, and J.A. Barros. Experimental Investigation of Brick Under Uniaxial
Tensile Testing. Masonry International. Vol I. 2005.
[36] P.B. Lourenço. Recent Advances in Masonry Modeling: Micro-Modeling and Homogenization .
Multiscale Modeling in Solid Mechanics: Computational Approaches. Book editors. Ugo Galvanetto and
M H Aliabadi. London. Imperial College Press. 2010.
[37] Z. Sorić. Zidane Konstrukcije I. Zagreb, Hrvatski savez građevinskih inženjera, 2004. (in Bosnian)
[38] Zienkiewicz, CBE, FRS. The Finite Element Method: Its Basis and Fundamentals, Elsevier, 2005.
[39] T.J. Petrovski. Damaging Effects of July 26, 1963 Skopje Earthquake. Skopje. European Earthquake
Engineering (SE-40EEE). International Conference 40 years 1963 Skopje Earthquake, 2003.