Embed Size (px)
Citation preview

warwick.ac.uk/lib-publications
Manuscript version: Working paper (or pre-print) The version presented here is a Working Paper (or ‘pre-print’) that may be later published elsewhere. Persistent WRAP URL: http://wrap.warwick.ac.uk/152800 How to cite: Please refer to the repository item page, detailed above, for the most recent bibliographic citation information. If a published version is known of, the repository item page linked to above, will contain details on accessing it. Copyright and reuse: The Warwick Research Archive Portal (WRAP) makes this work by researchers of the University of Warwick available open access under the following conditions. Copyright © and all moral rights to the version of the paper presented here belong to the individual author(s) and/or other copyright owners. To the extent reasonable and practicable the material made available in WRAP has been checked for eligibility before being made available. Copies of full items can be used for personal research or study, educational, or not-for-profit purposes without prior permission or charge. Provided that the authors, title and full bibliographic details are credited, a hyperlink and/or URL is given for the original metadata page and the content is not changed in any way. Publisher’s statement: Please refer to the repository item page, publisher’s statement section, for further information. For more information, please contact the WRAP Team at: [email protected].
Warwick Economics Research Papers
ISSN 2059-4283 (online)
ISSN 0083-7350 (print)
The 15-Hour Week: Keynes’s Prediction Revisited
Nicholas Crafts
(This paper also appears as CAGE Discussion paper 566)
May 2021 No: 1360
The 15-Hour Week: Keynes’s Prediction Revisited
Nicholas Crafts
University of Sussex and CAGE, University of Warwick
May 2021
Abstract
In 1930 Keynes opined that by 2030 people would work only 15 hours per week. As such, this
prediction will not be realised. However, expected lifetime hours of leisure and non-market work in
the UK rose by 60 per cent between 1931 and 2011, considerably more than Keynes would have
expected. This reflects increases in life expectancy at older ages and much longer expected periods
of retirement. Leisure in retirement contributes to high life satisfaction for the elderly but building up
savings to pay for it is a barrier to working only 15 hours per week.
Keywords: Leisure: Life Expectancy; Retirement; Work
JEL Classification: J22; J26; N34
Acknowledgements: an earlier version of this paper was presented to a workshop at the University
of Groningen where participants made helpful comments. I am also grateful to Paul Johnson and
Leandro Prados de la Escosura for useful suggestions and to Richard Disney and Daniel Sgroi for their
expert advice. The usual disclaimer applies.
1
Introduction
In 1930, Keynes published a short essay called “Economic possibilities for our grandchildren”. It is
famous (notorious?) for its prediction that a hundred years hence people would work for only 15 hours
per week. Although this was originally conceived as an after-dinner talk for schoolboys and then as a
public lecture rather than as a serious piece of scholarly research, it has a high profile. This was
underlined by a collection of 14 papers commenting on the essay mostly written by distinguished
economists including 4 Nobel Prize winners (Pecchi and Puga 2008).
In his own words, this is what Keynes said: “I would predict that the standard of life in progressive
countries a hundred years hence will be between 4 and 8 times as high as it is today” (2008: 21). At
that point, “everybody will need to do some work if he is to be contented … a 15-hour week may put
off the problem for a great while. For 3 hours a day is quite enough to satisfy the old Adam in most
of us!” (2008: 23). Keynes was foreseeing a future where consumption needs could be met with very
little or no work but where most men would not want to give up work completely.1 There is a back-
of-the-envelope flavour to this prediction but, even so, it has been much discussed.
The general reaction among economists is nicely captured by Pecchi and Piga: “How could it be that a
man of Keynes’s intelligence, with a deep understanding of economics and society, could be so right
in predicting a future of economic growth and improving living standards and so wrong in
understanding the future trends of labor and leisure, consumption and saving?” (2008: 3). The
economists in their volume discuss several plausible hypotheses to explain the failure of work hours
to fall as Keynes predicted. These include that for work-leisure choices substitution effects were
bigger and income effects smaller than Keynes (implicitly) assumed, that new goods created new
consumer wants, and that preferences have changed in response to advertising, and that consumer
expenditures keep increasing to keep up with or outdo fellow citizens.2
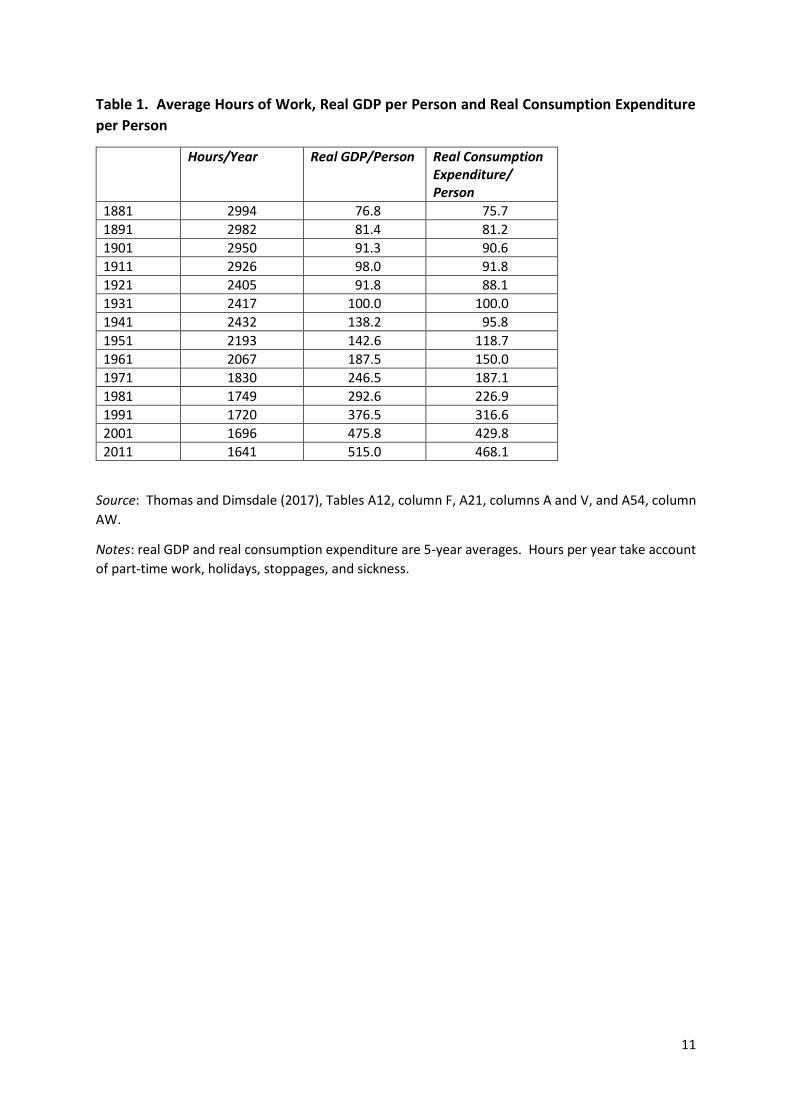
The data reported in Table 1 are typical of those that have been used to compare outcomes with
Keynes’s predictions and to suggest that he was right about growth but wrong about leisure. The UK
has experienced lower growth than most other advanced economies since 1931 but, nevertheless,
real GDP per person in 2011 was a little over 5 times the 1931 level, i.e., already within the 4 to 8 times
band so on that measure Keynes’s prediction about economic growth was well on track. Although
average hours of market work per year fell by almost a third between 1931 and 2011, in that year they
were still a long way above Keynes’s prediction of 780 hours and had decreased by less than 5 per
cent in the previous 20 years.
Another way to express Keynes’s prediction is as an expected increase in the amount of leisure (and/or
non-market work). Allowing a conventional 8 hours per day for sleep, there are 112 waking hours
available per week. The work week averaged 46.5 hours (2417/52) in 1931, so this left 65.5 hours for
leisure and non-market work. A work week of 15 hours would leave 97 hours per week, so Keynes’s
was predicting an increase of 48.1 per cent (97-65.5)/65.5 in leisure/non-market work time. This is
more than double the actual increase between 1931 and 2011 which was 22.7 per cent (80.4 –
65.5)/65.5 according to Table 1.
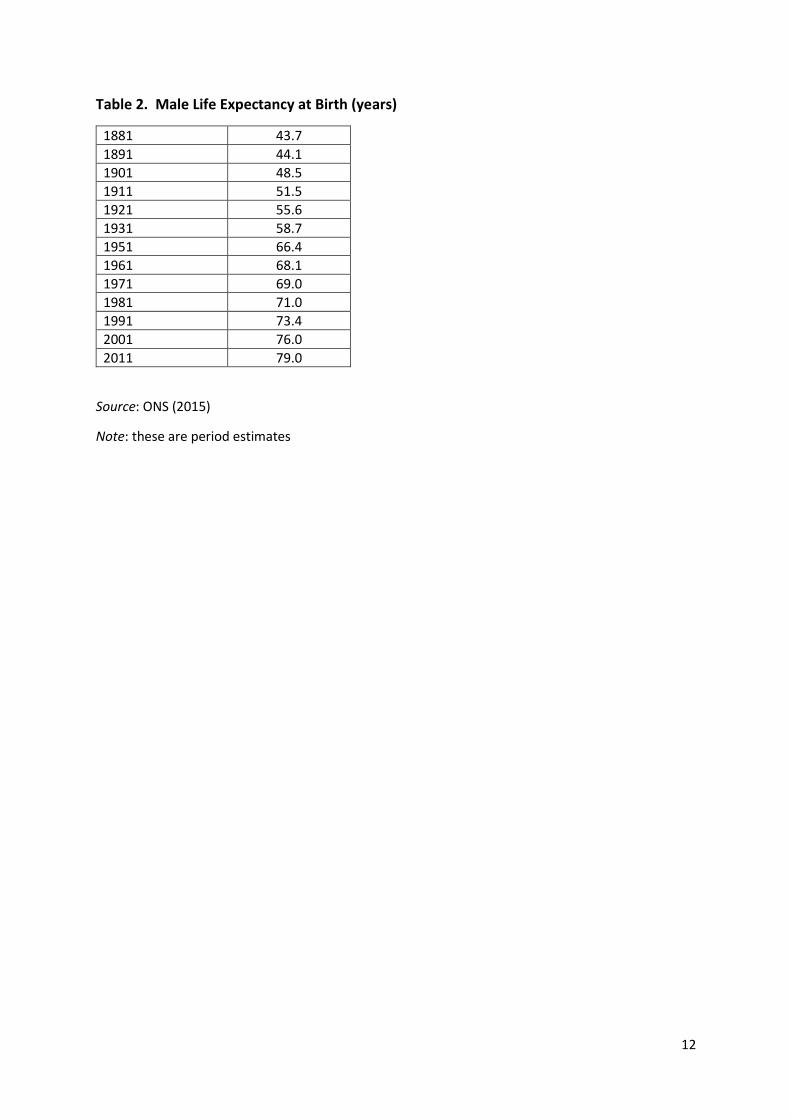
However, this only takes account of time use during a person’s working years and does not include
later life. This is an important omission in the context of increases in life expectancy and length of
1 The discussion in Keynes’s paper is clearly about the future of men’s rather than women’s work. 2 An increase in wage rates raises both income and the opportunity cost of leisure. Its effect on labour supply is ambiguous and depends on the relative size of the two effects. The last three arguments might be interpreted as reasons for the substitution and income effects being different from what Keynes imagined.
2
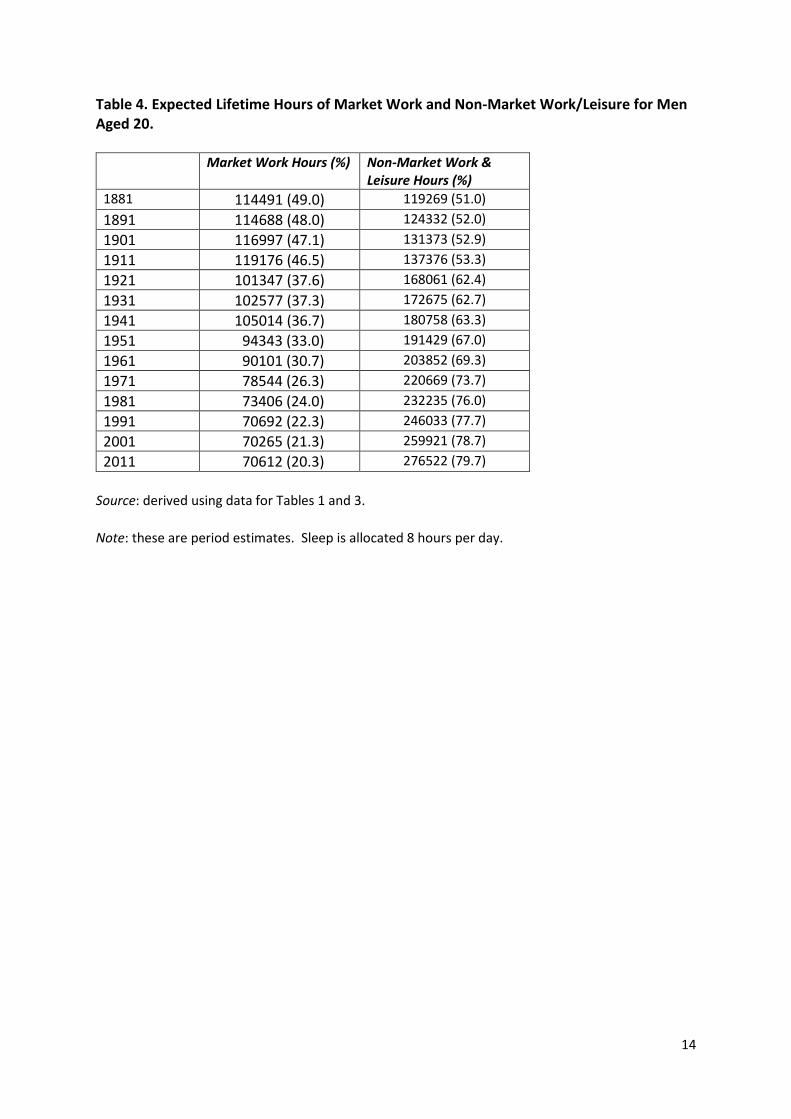
retirement since 1931 (Tables 2 and 3), as this paper shows. I calculate that over his lifetime a 20-year
old male in 2011 could expect 276522 hours of leisure or non-market work compared with 172675 for
his 1931 counterpart, an increase of 60.1 per cent (Table 4). On reasonable assumptions, this is more
than Keynes would have predicted, as the paper also demonstrates. The main reason for his
‘underprediction’ is that, contrary to the expectation of 1930s’ experts, life expectancy at older ages
has increased considerably since the 1960s.
A life-cycle perspective is also useful for understanding why, although total lifetime leisure and non-
market work has risen by more than Keynes would have predicted, average hours of market work for
those in employment have fallen by less than he suggested. Consumption during a longer expected
period of retirement needs to be financed by the accumulation of assets during working life and this
is likely to have been underwritten by continuing to undertake a substantial amount of market work
pre-retirement.
Estimating Expected Length of Retirement (ELRP)
The method used to obtain estimates of the length of retirement is basically the same as that proposed
by Lee (2001). Retirement duration is estimated for male workers at age 20 by calculating a weighted
average of life expectancy at each age of retirement. The weight assigned to life expectancy at age x,
ex, is the probability of retiring at age x. In turn, this is the product of the following probabilities: the
probability of remaining alive to age x (Sx), the probability of remaining in the labour force until age x
conditional on surviving to age x (Tx), and the probability of retiring at age x conditional on remaining
in the labour force at age x (x). Among the men who would retire between age x and age x + 1 (SxTxx),
the proportion of those who die is given by the mortality rate within the age interval (1qx). If the
likelihood of retirement does not vary within the age interval, half of these men would die before they
leave the labour force. Therefore the probability of retirement between age x and x + 1 is SxTxx[1 −
(0.5 1qx)]. If a man retires between age x and x + 1, his expected length of retirement is (ex + ex + 1)/2.
Assuming for simplicity that the earliest age at retirement is 50, this gives the expected length of
retirement at age 20 as follows:
ELRP = 20-50x = 50-89SxTxx[1 − (0.5 1qx)][(ex + ex + 1)/2]
where 20-50 is the probability at age 20 of surviving until age 50.
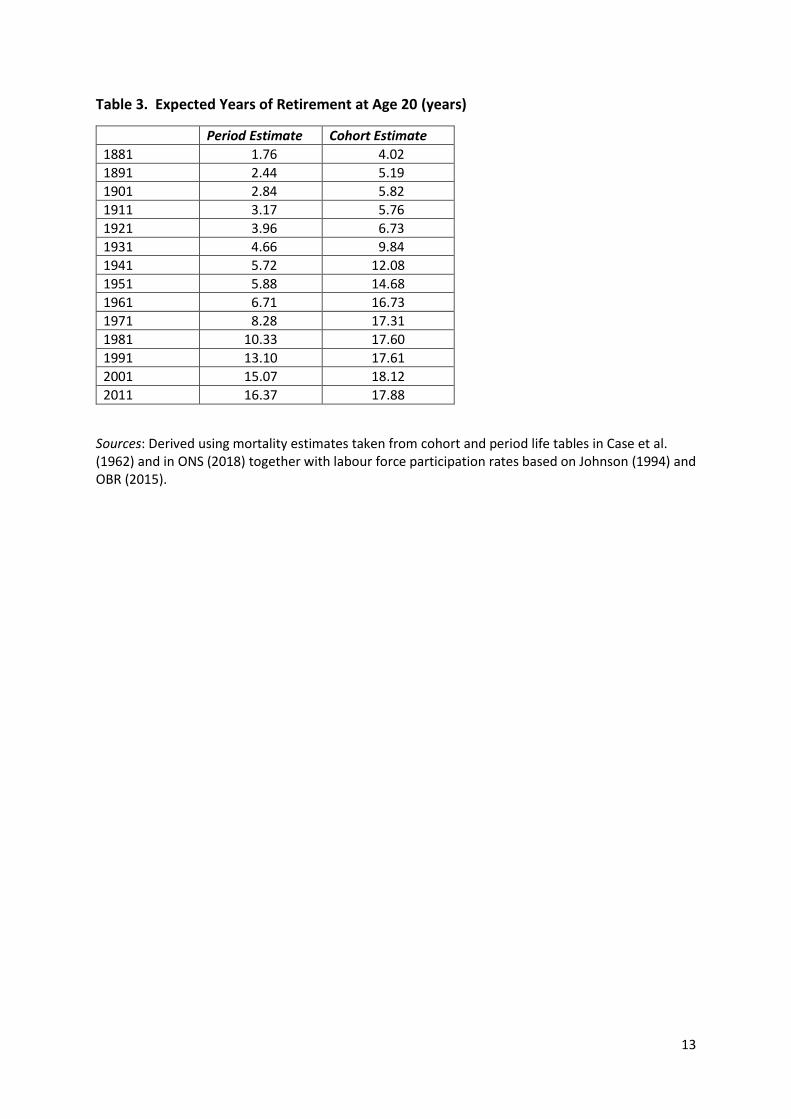
Both period and cohort estimates of ELRP are reported in Table 3. Period estimates are based on the
assumption that a 20-year old man estimates his retirement duration based on current mortality and
retirement rates remaining unchanged in future. Cohort estimates are based on the mortality and
retirement rates that obtained as the 20-year old passes through his life and are equivalent to an
assumption of perfect foresight of future life expectancy and labour force participation probabilities.
Except for those cohorts reaching the age of 20 a long time ago estimates are partly based on future
projections. Since, over time, life expectancy has been increasing and, at least until recently, fewer
people have been working late in life, in general, the period estimates of ELRP may be considered as
a lower bound and the cohort estimates as an upper bound. The gap between the two has varied in
the past and has described an inverted-U shape since 1881.
The data used to estimate ELRP were as follows. Life expectancies and survival rates prior to 1951
were taken from Case et al. (1962) who compiled the evidence of early English life tables which were
3
constructed using information collected by the Registrar General. From 1951, life tables published by
the Office for National Statistics (2018) were used. These include projections through to 2068 such
that cohort estimates for a 20-year old are available up to 2011. Labour force participation rates from
1881 to 1981 are taken from Johnson (1994) who derived them from the Population Census.3 Later
years use tabulations from the Labour Force Survey and projections of future participation rates
through to 2065 in Office for Budget Responsibility (2015).
Table 3 reports estimates for ELRP that reflect a large increase between 1881 and 2001. During those
years the period estimate rose by 14.61 years and the cohort estimate by 13.86 years. In the years
since Keynes published his essay, from 1931 to 2011, the period and the cohort estimates gained 11.71
and 8.04 years, respectively.
The main reason for longer expected retirement is increased longevity. The period estimates for life
expectancy at age 20 were 40.0 years in 1881, 47.1 years in 1931 and 59.4 years in 2011 and at age 65
were 10.3, 11.4 and 18.3, respectively. When Keynes wrote a 20-year old had a 70.4 per cent chance
of surviving to age 65, which became the conventional age at which men retired, whereas by 2011 this
had risen to 87.1 per cent. ELRP is estimated as 5.36 years using 2011 participation rates and 1881
mortality or 7.58 years using 1931 mortality and 2011 participation rates. Thus, 11.01 out of the 14.61
and 8.79 out of the 11.71 years increases in ELRP between 1881 and 2011 and between 1931 and
2011, respectively, resulted from improved life expectancy.
Estimating Expected Lifetime Hours of Market Work and of Non-Market Work or Leisure
Having made estimates of ELRP and using estimates of annual hours worked (AHW) from Table 1, it is
possible to divide expected lifetime hours at age 20 into expected hours of market work and of non-
market work or leisure. The estimates assume that the average year comprises 8766 hours of which
2922 are allocated to sleep.4. Total lifetime hours are 5844 multiplied by life expectancy at age 20
(e20). Then
Expected Hours of Market Work = (e20 – ELRP) x AHW
Expected Hours of Non-Market Work & Leisure = (5844 x e20) - (e20 – ELRP) x AHW
The limitation of this formula is that it does not capture phased moves into retirement where workers
initially scale down their hours before retiring completely. However, since only a small proportion of
lifetime expected market work hours are post-65 and there were shorter hours at these ages both in
1931 and in 2011, any bias in comparisons of expected lifetime leisure/non-market work between
these two years is likely to be very small. The evidence available for 1931 is for workers in London and
shows average weekly hours for those who worked at ages 65, 70 and 74 were 41.4, 35.0 and 31.1,
respectively (Baines and Johnson 1997), and on average in England and Wales 5.1 per cent of lifetime
hours were after the age of 65. For the UK in 2011 men who worked at the ages of 65-69 and 70-74
3 The census was not taken in 1941 for which year Johnson interpolated his estimates. 4 This allows for a leap year every fourth year.
4
averaged 30 hours and 20 hours per week, respectively (Chandler and Tetlow 2014), and 3.4 per cent
of lifetime hours were post-65.
Table 4 reports a major change in the expected proportions of a worker's lifetime spent in work and
leisure/non-market work. Whereas in 1881, with then current mortality and labour force participation
rates 49.0 per cent of expected waking hours would be spent in market work by 2011 that had fallen
to 20.3 per cent. The expected hours of leisure/non-market work more than doubled over the same
period from around 119000 to around 277000. According to the estimates in Table 4, a 20-year old
male in 2011 could expect 276522 lifetime hours of leisure or non-market work compared with 172675
for his counterpart in 1931, an increase of 60.1 per cent.
As noted above, there is an issue regarding hours of work for older men but this does not make much
difference. Using the evidence on hours of work for workers after the age of 65 in Baines and Johnson
(1997) and Chandler and Tetlow (2014) together with participation rates from Johnson (1994) and
OBR (2015), the adjusted estimates would be 173905 expected hours of leisure or non-market work
in 1931 compared with 277167 in 2011. The increase over the period would be 59.4 per cent rather
than 60.1 per cent if no adjustment is made.
The increase in lifetime hours of expected leisure and non-market work hours has some interesting
features. First, a relatively large part of this increase, 68433 hours or 65.9 per cent of the total, accrues
during retirement, i.e., towards the end of life when health may be deteriorating. The increase in
expected leisure or non-market work time pre-retirement is only 24.3 per cent compared with 60.1
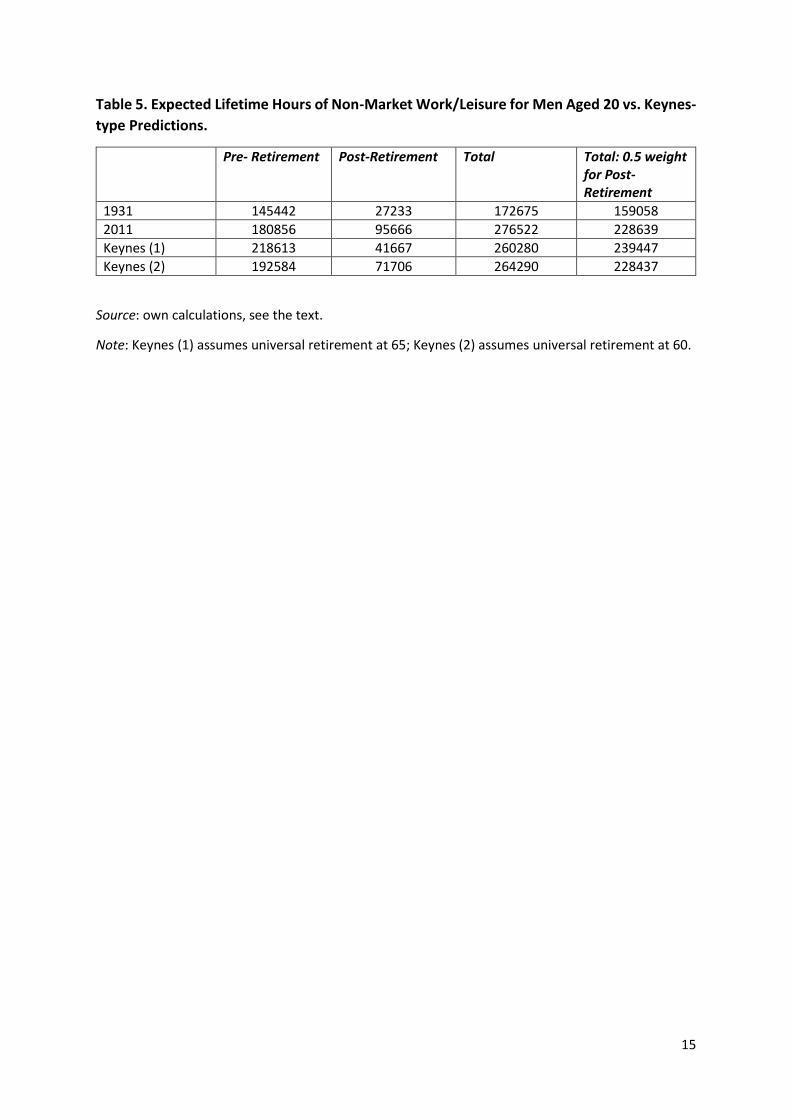
per cent overall (Table 5). Second, almost half of the 35414 rise in expected pre-retirement
leisure/non-market work hours is in the form of vacation time which rose from an average of 2.2
weeks per year in 1931 to 5.8 weeks in 2011 (Ward et al. 2018) so that 15.4 per cent of these hours
were on vacation in 2011 compared with 7.2 per cent in 1931. A rising share of leisure time being
taken as vacations is perhaps not surprising when the very high valence rating of ‘vacation’ is
recognised.5
A Lifetime Equivalent of Keynes’s Prediction
Keynes did not discuss the future of work over the whole life cycle nor did he ever predict what life
expectancy or retirement behaviour might be a hundred years after he wrote. It is possible, however,
to make some informed guesses at what he might have assumed and thus to make an estimate of
lifetime expected hours of leisure and non-market work in 2030 from a 1930 Keynesian perspective.
The demographic future was a high-profile issue in the 1930s in the context of worries that the future
was one of a declining population. The best-known and much-publicized predictions were made by
Charles (1935). She offered 3 variants of which her estimate b) which took account of increases in
future life expectancy is the most appropriate. Her views were typical of the time; she foresaw steady
decreases in mortality below the age of 70 for the next 30 years, at which point a minimum level would
5 In other words, ‘vacation’ is a word that strongly connotes ‘happiness’; for details of the measurement of the valence of words on which this observation is based using the Affective Norms for English Words (ANEW) dataset, see Hills et al. (2019). In their sample of 13915 words, ‘vacation’ scored 8.63/9 and ranked 1st.
5
have been reached, but she expected mortality over the age of 70 to remain at the 1935 level. In 1965
the maximum life expectancy at birth of 68.3 years would have been attained. This is very close to
the 68.1 years in the life table for 1961 (Table 1). I will assume for my lifetime equivalent of Keynes’s
prediction that the life table for 1961 still obtains in 2030; in other words, in common with informed
opinion of the 1930s, Keynes is assumed not to have foreseen the further increase in life expectancy
to 79.0 years in 2011.
By 1930, the concept of occupational pensions which would become widespread after World War II
had arrived for the lucky few. These schemes typically had a normal retirement age and by the 1930s
this was generally 65 years for men. This was also established as the state pension age in 1928 and,
as Hannah put it, “The age of 65 as the pension age for men had long been considered ideal” (1986:
128). By the 1950s, it was possible for middle-class men to retire completely at 65 and enjoy a
comfortable retirement which most chose to do. However, in 1930 the most generous occupational
pension scheme, from which civil servants benefited, had a retirement age of 60 so perhaps this would
be expected to be the norm in 2030. I will assume for my lifetime equivalent of Keynes’s prediction
that age-specific labour force participation rates were as in 1931 up to 65 with AHW = 780 after which
age no-one works but I also calculate a variant in which no-one works past 60.
If a lifetime equivalent of Keynes’s prediction is based on the life table of 1961 and full retirement at
age 65 for those still in work, then expected lifetime hours of leisure or non-market work for a 20-year
old man are 260280 and expected hours of market work are 39673. If the calculation is reworked with
full retirement at 60, then leisure or non-market work increases to 264290 hours. The increase in
lifetime leisure or non-market work compared with 1931 is 50.7 and 53.1 per cent, respectively. In
either case, this is appreciably below the 60.1 per cent increase that accrued between 1931 and 2011.
So, contrary to conventional wisdom, it seems that actual increases in the expected time available for
leisure and non-market work have exceeded anything Keynes might have predicted.
This conclusion may not be persuasive, however, if leisure or non-market work time during retirement
years is regarded as less valuable than that enjoyed earlier in life. This may be the view of Skidelsky
and Skidelsky when they say “it must surely be wrong to concentrate so much leisure in the last years
of a person’s life {when] capacity for enjoying it may well have diminished” (2013: 25). The
calculations reported in Table 5 show that if, for example, expected leisure or non-market work in
retirement is regarded as only half as valuable, then the increase between 1931 and 2011 is lower
than the lifetime equivalent of Keynes’s prediction where everyone retires at 65 and about the same
as in the variant where everyone retires at 60.
Historically, for some men retirement was not through choice and entailed a life of poverty. In the
early 21st century, however, this would seem a very pessimistic interpretation of the average
experience. Noting a greater capacity to finance retirement and much better pension arrangements,
Hannah argued that “Voluntary retirement is … a luxury good whose incidence would be expected to
grow” (1986: 124). Costa (1998) pointed to the lower price of recreational goods and their increased
variety as reasons why retirement became a lot more enjoyable in the later 20th century.
Other economic and social historians have emphasized that many elderly people at this point had the
option of a fairly comfortable retirement, that living standards in old age had improved markedly
6
compared with the mid-20th century, both in absolute terms and relative to those in employment, and
that older people often described themselves as active, involved and happy (Johnson 1989; Thane
2000). This last observation is consistent with the evidence of a large volume of happiness studies
which report relatively high levels of subjective well-being in later life. In 2011-15, UK responses to
the survey question ‘Overall, how satisfied are you with your life nowadays?’ on a scale of 0-10
averaged 7.8 at 65, 7.85 at 70 and 7.7 at 85 – higher than at any age between 20 and 65 (Blanchflower
and Oswald, 2019).6
I conclude that Keynes was right to predict a large increase in leisure or non-market work time but
failed to see that much of this would be enjoyed in retirement. Keynes did not put his prediction in
terms of lifetime experience but if he had done so he would surely have under- rather than over-
predicted the expected increase for a 20-year old man in 2011 compared with his predecessor of 1930.
The change in life expectancy since the 1930s would be a very nice surprise.
A Life-Cycle View
It is helpful to analyse decisions about how much to work in the context of a life-cycle framework in
which their intertemporal aspect is recognised. A stylized example taught to economics students
would see a phase of borrowing when young, accumulating assets while middle-aged and dissaving
during retirement. It might be expected that there is consumption smoothing over time and the
central prediction is that optimization will be achieved by equating the marginal utility of consumption
over time. The accumulation of assets pre-retirement, which reflects both work effort and savings
behaviour, matters for living standards during retirement.
The much greater accumulation of assets by the average person at the end compared with the
beginning of the 20th century underpins the notion of being able to finance an enjoyable retirement,
as Hannah (1986) noted. These assets often included occupational pension and housing wealth as
well as an entitlement to a state pension. A recent study found households adopting a three-pronged
asset accumulation strategy based on homeownership, pensions and savings to provide financial
security as welfare benefits have become less generous (Hillig 2019). The number of persons in receipt
of payment of an occupational pension, which were typically based on defined benefit schemes, rose
from 0.2 million in 1936 to 9.2 million in 2011 (Hannah 1986; ONS 2019). The percentage of dwellings
which were owner-occupied rose from 23.4 in 1918 to 34.1 in 1939 and 65.0 in 2011, having peaked
at 69.8 per cent in 2001 (Holmans 2005; DCLG 2013). In 2011, house ownership was normal for the
‘traditional working class’ as well as the middle classes and the elite (Savage et al. 2013).
A life-cycle model with consumption smoothing predicts that an expectation of a longer period of
retirement implies that individuals will aim to enter retirement with a larger stock of assets. This
implies that an increase in ELRP will encourage working more and/or saving a higher fraction of income
pre-retirement. Increases in life expectancy in the second half of the 20th century tended to mean
longer retirement for many men given the norm or even the contractual obligation to retire at 65.7
6 ‘Retirement’ is also quite a happy word according to its valence. It scores 6.6 and ranks in the top 11 per cent of words. 7 A survey in 1994 found that 53 per cent of men had an upper limit on their retirement age and more than three quarters of men had an expected retirement age of 65 (Meadows 2003).
7
Life expectancy for men at 65 rose from 11.4 years in 1931 to 18.3 years in 2011. Other things equal,
this implies that to maintain a given level of consumption the amount of assets required at retirement
period was 1.6 times larger in 2011. If this is to be achieved by accumulation of housing wealth, there
is a strong incentive to move up the housing ladder rapidly by working more (Banks et al. 2017;
Bottazzi et al. 2010) For those with occupational pensions, longer life post-65 acts as a disincentive in
defined contribution or career-average defined benefit schemes to reduce working hours prior to
retirement.8 For those schemes where the defined benefit is based on final salary, it raises the cost in
terms of foregone earnings and pension payments of a reduction in work hours.9
Overall, it seems plausible that increases in life expectancy and the associated lengthening of the
retirement period have meant not only much increased time spent in non-market work or leisure in
later life but also have acted to discourage dramatic reductions in market work hours in youth and
middle age. This provides a further important reason, not previously stressed in the literature, why
Keynes’s 15-hour week prediction was incorrect.
Conclusions
It is generally agreed that Keynes’s bold prediction of a 15-hour week by 2030 will not be realised. If
this is taken to be 780 hours per year of market work, this compares with 1641 hours in 2011. Between
1931 and 2011, annual hours of work fell by about a third whereas Keynes predict a fall of two thirds
by 2030. An alternative way to frame Keynes’s prediction is in terms of an increase of 48 per cent in
time available for leisure or non-market work per week. Not surprisingly, this also seems wide of the
mark since up to 2011 the actual increase was a little under 23 per cent.
If, however, the increase in expected leisure and non-market work time is considered on a lifetime
basis, a very different picture is revealed. For a 20-year old man expected years of retirement have
increased from 4.66 years in 1931 to 16.37 years in 2011 mainly as a result of improved life expectancy.
The implication is that expected lifetime hours of leisure/non-market work rose by 60.1 per cent
between 1931 and 2011.
Keynes did not make a prediction on a lifetime basis but if he had it would surely have assumed that
life expectancy, especially for the elderly, would have risen by much less actually was the case. Using
conventional 1930s’ demographers’ assumptions plus a 15-hour week and universal retirement at 65,
his prediction for the increase in expected lifetime leisure/non-market work hours would have been
about 50 per cent rather than the 60 per cent that transpired. Viewed from this perspective, contrary
to conventional wisdom, the outcome has exceeded Keynes’s expectations.
8 The damage done by reducing work hours for part of a career is illustrated by the high impact of reduced hours and career breaks for women who have children. In their early 60s women in the UK have median private pension wealth which is about one third of that of the median for men and 47 per cent of the difference is attributable to interruptions to full-time work (Jeetwa 2019). 9 For example, for someone in a 2/3 final salary scheme whose full time-earnings are y, the total cost of going half time at age 55 is 5y + (0.33y x 11.4) = 8.76y if life expectancy at 65 is 11.4 years as in 1931 but 5y + (0.33y x 18.3) = 11.04y if life expectancy at 65 is 18.3 years as in 2011. Obviously, with no pension entitlement the cost of going half time is only 5y.

8
Much of the additional leisure/non-market work that a 20-year old man can now expect will accrue in
retirement. This should not be considered ‘low value’. The evidence suggests that on average persons
aged 65 and over have a high level of life satisfaction nowadays. Enjoying a comfortable retirement
is facilitated by accumulating assets earlier in life and this has mitigated against larger reductions in
annual hours of market work.
9
References
Baines, D. and P. Johnson (1997) “The labour-force participation and economic well-being of older men in London, 1929-31.” London School of Economics Working Paper No. 37. Banks, J., R. Blundell, Z. Oldfield and J.P. Smith (2017) “House price volatility and the housing ladder,” in D.A. Wise (ed.) Insights in the Economics of Aging. Chicago: University of Chicago Press: 87-119. Blanchflower, D. and A. Oswald (2019) “Do modern humans suffer a psychological loss in midlife? Two approaches (with and without controls) in seven data sets,” in M. Rojas (ed.) The Economics of Happiness: How the Easterlin Paradox Transformed our Understanding of Well-Being and Progress. Switzerland: Springer Nature: 439-453. Bottazzi, R., H. Low and M. Wakefield (2010) “Why do homeowners work longer hours?” Institute for Fiscal Studies Working Paper No. 10/07. Case, R. A. M., C. Coghill, J. L. Harley, and J. T. Pearson (1962) The Chester Beatty Research Institute Serial Abridged Life Tables, England and Wales 1841-1960. London: Institute of Cancer Research. Chandler, D. and G. Tetlow “Employment of older people in England, 2012-13.” Institute of Fiscal Studies Briefing Note BN 193. Charles, E. (1935) “The effect of present trends in fertility and mortality upon the future population of England and Wales and upon its age composition.” London and Cambridge Economic Service Special Memorandum No. 40. Costa, D.L. (1998) The Evolution of Retirement: an American Economic History, 1880-1990. Chicago: University of Chicago Press. Department for Communities and Local Government (2013) English Housing Survey. Hannah, L. (1986) Inventing Retirement. Cambridge: Cambridge University Press. Hillig, A. (2019) “Everyday financialization: the case of UK households.” Environment and Planning A 51(7): 1460-1478. Hills, T.T., E. Proto, D. Sgroi and C.I. Senesinhe (2019) “Historical analysis of subjective wellbeing using millions of digitized books.” Nature Human Behaviour, October 15. Holmans, A.E. (2005) Historical Statistics of Housing in Britain. Cambridge: Cambridge Centre for Housing. Jeetwa, C. (2019) Understanding the Gender Pensions Gap. London: Pensions Policy Institute. Johnson, P. (1989) “The structured dependency of the elderly: a critical note,” in M. Jefferys (ed.) Growing Old in the Twentieth Century. London: Routledge: 63-73. Johnson, P. (1994) “The employment and retirement of older men in England and Wales, 1881- 1981.” Economic History Review 47(1): 106-28.
10
Keynes, J.M. (2008) (1930) “Economic possibilities for our grandchildren,” in L. Pecchi and G. Piga (eds.) Revisiting Keynes: Economic Possibilities for our Grandchildren. Cambridge, MA.: MIT Press: 17-26. Lee. C. (2001) “The expected length of male retirement in the United States, 1850-1990.” Journal of Population Economics 14(4): 641-650. Meadows, P. (2003) “Retirement ages in the UK: a review of the literature.” Department of Trade and Industry Employment Relations Research Series No. 18. Office for Budget Responsibility (2015) Fiscal Sustainability Report: Supplementary Tables.
Office for National Statistics (2015) How Has Life Expectancy Changed Over Time?
Office for National Statistics (2018) Life Tables Principal Projection, UK.
Office for National Statistics (2020) Occupational Pension Schemes Survey: UK 2019.
Pecchi, L. and G. Piga (2008) “Economic Possibilities for our Grandchildren: a twenty-first century
perspective,” in L. Pecchi and G. Piga (eds.), Revisiting Keynes: Economic Possibilities for our
Grandchildren. Cambridge, MA.: MIT Press: 1-16.
Savage, M., F. Devine, N. Cunningham, M. Taylor, Y. Li, J. Hjellbrekke, B. Le Roux, S. Friedman and A.
Miles (2013) “A new model of social class? Findings from the BBC’s Great British class survey
experiment.” Sociology 47(2): 219-250.
Thane, P. (2000) Old Age in English History: Past Experiences, Present Issues. Oxford: Oxford
University Press.
Thomas, R. and N. Dimsdale (2017) “A millennium of UK data.” Bank of England OBRA Dataset.
http://www.bankofengland.co.uk/research/Pages/onebank/threecenturies.aspx
Ward, A., M.B.Zinni and P. Marianna (2018) International productivity gaps: are labour input
measures compatible? OECD Statistics Working Paper No. 208/12.
11
Table 1. Average Hours of Work, Real GDP per Person and Real Consumption Expenditure
per Person
Hours/Year Real GDP/Person Real Consumption Expenditure/ Person
1881 2994 76.8 75.7
1891 2982 81.4 81.2
1901 2950 91.3 90.6
1911 2926 98.0 91.8
1921 2405 91.8 88.1
1931 2417 100.0 100.0
1941 2432 138.2 95.8
1951 2193 142.6 118.7
1961 2067 187.5 150.0
1971 1830 246.5 187.1
1981 1749 292.6 226.9
1991 1720 376.5 316.6
2001 1696 475.8 429.8
2011 1641 515.0 468.1
Source: Thomas and Dimsdale (2017), Tables A12, column F, A21, columns A and V, and A54, column
AW.
Notes: real GDP and real consumption expenditure are 5-year averages. Hours per year take account
of part-time work, holidays, stoppages, and sickness.
12
Table 2. Male Life Expectancy at Birth (years)
1881 43.7
1891 44.1
1901 48.5
1911 51.5
1921 55.6
1931 58.7
1951 66.4
1961 68.1
1971 69.0
1981 71.0
1991 73.4
2001 76.0
2011 79.0
Source: ONS (2015)
Note: these are period estimates
13
Table 3. Expected Years of Retirement at Age 20 (years)
Period Estimate Cohort Estimate
1881 1.76 4.02
1891 2.44 5.19
1901 2.84 5.82
1911 3.17 5.76
1921 3.96 6.73
1931 4.66 9.84
1941 5.72 12.08
1951 5.88 14.68
1961 6.71 16.73
1971 8.28 17.31
1981 10.33 17.60
1991 13.10 17.61
2001 15.07 18.12
2011 16.37 17.88
Sources: Derived using mortality estimates taken from cohort and period life tables in Case et al. (1962) and in ONS (2018) together with labour force participation rates based on Johnson (1994) and OBR (2015).
14
Table 4. Expected Lifetime Hours of Market Work and Non-Market Work/Leisure for Men Aged 20.
Market Work Hours (%) Non-Market Work & Leisure Hours (%)
1881 114491 (49.0) 119269 (51.0)
1891 114688 (48.0) 124332 (52.0)
1901 116997 (47.1) 131373 (52.9)
1911 119176 (46.5) 137376 (53.3)
1921 101347 (37.6) 168061 (62.4)
1931 102577 (37.3) 172675 (62.7)
1941 105014 (36.7) 180758 (63.3)
1951 94343 (33.0) 191429 (67.0)
1961 90101 (30.7) 203852 (69.3)
1971 78544 (26.3) 220669 (73.7)
1981 73406 (24.0) 232235 (76.0)
1991 70692 (22.3) 246033 (77.7)
2001 70265 (21.3) 259921 (78.7)
2011 70612 (20.3) 276522 (79.7)
Source: derived using data for Tables 1 and 3.
Note: these are period estimates. Sleep is allocated 8 hours per day.
15
Table 5. Expected Lifetime Hours of Non-Market Work/Leisure for Men Aged 20 vs. Keynes-
type Predictions.
Pre- Retirement Post-Retirement Total Total: 0.5 weight for Post-Retirement
1931 145442 27233 172675 159058
2011 180856 95666 276522 228639
Keynes (1) 218613 41667 260280 239447
Keynes (2) 192584 71706 264290 228437
Source: own calculations, see the text.
Note: Keynes (1) assumes universal retirement at 65; Keynes (2) assumes universal retirement at 60.


![PRE SE]VTING THE MANUSCRIPT - Islamic manuscripts](https://img.pdfslide.net/doc/110x75/616a068211a7b741a34dfcb9/pre-sevting-the-manuscript-islamic-manuscripts.jpg)