Embed Size (px)
Citation preview

Many-Faceted Rasch Modeling Expert Judgment in Test Development
By: Weimo Zhu, Catherine D. Ennis, and Ang Chen
Zhu, W., Ennis, C. D., & Chen, A. (1998). Many-faceted Rasch modeling expert judgment in test development.
Measurement in Physical Education and Exercise Science, 2(1), 21-39.
Made available courtesy of Taylor and Francis: http://www.tandf.co.uk/journals/
***Reprinted with permission. No further reproduction is authorized without written permission from
Taylor and Francis. This version of the document is not the version of record. Figures and/or pictures
may be missing from this format of the document.***
Abstract:
The purpose of this study was to model expert judgment in test and instrument development using the many-
faceted Rasch model. A 150-item value orientation inventory-2 (VOI-2) assessing the value of physical
education curriculum goals was developed and evaluated by 128 university educators and 103 school-based
physical educators. The experts were asked to rate the consistency of each item to represent one part of the
broad curriculum goals using a 5-point rating scale. The many-faceted Rasch model was used to calibrate the
rating scores, and 6 facets—gender, ethnicity, employment type, rater, content area, and item—were defined.
Severity and consistency of the experts' judgments were examined and corrected before being applied to item
evaluation. Further, the impact of group membership on expert judgment was examined. Items were then
evaluated based on their logit scores and the consistency of their performance. Results suggest that most VOI-2
items were content domain representative and the raters were truly experts. The many-faceted Rasch model
demonstrates a psychometrically appropriate technique for applying expert judgment in test development.
Key words: item response theory, judging, rating scale, teacher evaluation, value orientation inventory, Rasch
model
Article:
Expert judgment is essential in test or instrument development. For example, expert judgment has been
conventionally involved in determining item appropriateness (Tittle, 1982) or content-related evidence of
validity (American Educational Research Association, American Psychological Association, & National
Council on Measurement in Education, 1985; Safrit & Wood, 1995). In criterion-referenced measurement, test
standards or criteria also often are determined by expert judgment (Glass, 1978). More recently, expert
judgment has played a critical role in new formats of assessments (e.g., performance-based assessments;
Dunbar, Koretz, & Hoover, 1991). Subjectivity and arbitrariness involved in the decision process of expert
judgment, however, have always made measurement specialists uneasy (Ebel, 1972). The impact of experts'
characteristics, such as gender, ethnic group, and educational level on their judgments should be considered for
both technical and legal reasons, which, unfortunately, often have been ignored in the test development.
Although a number of indexes or methods are available to apply expert judgment to test development, most of
them, according to Popham (1992), can be classified into two categories, majority and average. The first, and
perhaps the oldest one, is to simply compute the percentage of experts who consider an item to be content
appropriate. For example, if an item is approved by 51% or more of experts, the item is considered content
appropriate. Similarly, in other cases, experts are asked to rate items on a multicategory scale, such as crucial,
important, questionable, or not relevant. The multiscale ratings are then translated into positive or negative
judgments by item, based on the percentage of experts who gave positive ratings compared to the percentage of
experts who gave negative ratings. Because whether an item is appropriate is dependent on the approval of the
majority of experts, this method is called the majority method.
The second, and perhaps the most commonly used method, is to average experts' ratings and make decisions
based on the average scores. For example, after comparing average item scores with a predetermined criterion,

the item appropriateness in terms of its content representativeness can be determined. Because this method is
based on average scores, it is called the average method.
Applying both the majority and average methods appropriately, however, depends on a very important
assumption that experts make their ratings based on the same scale with the same severity. This means that a
valid rating should have the same meaning no matter which expert issues it and should be independent of the
experts employed. Two primary aspects of raters performance—severity and consistency—may threaten the
validity of their ratings (Saal, Downey, & Lahey, 1980).1 Severity is defined as a rater's tendency to assign a
higher or lower rating to an object than is warranted by that object's quality or behavior.2 Severity may not
become a major threat if every item in a test is rated by all raters employed, because a severe rating will be
treated either as a normal low rating in the majority method or canceled out by a lenient rating in the average
method. If, however, items are not rated by all raters, as is often the case in practice, the threat of severity
becomes serious because a rating may represent a different meaning if it comes from a very severe or very
lenient rater. Consistency, or intrajudge objectivity (Safrit & Wood, 1995), is defined as the degree of variability
of a rater's severity. In contrast to severity, inconsistency is always a threat to the validity of rating in both
rating situations (i.e., items are rated either by all or some raters). This is because a rating from an inconsistent
rater often may represent a different meaning (e.g., a "4" may sometimes represent a "5" and sometimes a "2").
Because of the importance of raters' consistency in determining the quality of a rating, a great effort has been
made in emphasizing the necessity of rater training, in which raters are required to standardize their
understanding of a rating scale. Unfortunately, such standardization is not usually reflected in rating practice
and experts have demonstrated differences in their rating severity even with pre-rating training (Raymond,
Webb, & Houston, 1991; Tittle, 1982). As a result, numerous indexes3 have been developed to address threats
to the reliability of expert judgment. Cohen's kappa index (1960), for example, is the best known early attempt
to determine two raters' agreement using a nominal scale. This index was later generalized to include various
situations, such as weighted agreement (Cohen, 1968) and agreement among multiple raters (Conger, 1980).
The indexes determining the agreement among raters are often called inter-rater reliability coefficients, and the
indexes determining the agreement among a rater's multiple ratings over time are called intra-rater reliability
coefficients.
Many researchers (e.g., Bakeman & Gottman, 1986; Kazdin, 1977), however, have suggested that neither inter-
rater nor intra-rater reliability coefficients are adequate in determining raters' consistency. This is because a
number of factors, such as raters' background (e.g., quality and quantity of rater training) and scoring method
(e.g., the number of categories in the rating scale), may impact raters' consistency simultaneously. A
multifaceted approach is better able to address threats to rater consistency. Multifaceted designs based on
generalizability theory were proposed to detect experts' judgment bias in content validity ratings (Crocker,
Llabre, & Miller, 1988). The generalizability theory, introduced by Cronbach, Gleser, Nanda, and Rajaratnam
(1972), is a statistical theory about the dependability of behavioral measurement. It enables estimation of the
relative magnitudes of various components of error variation and is a powerful approach to assessing
measurement consistency. The generalizability theory method, however, has its limitations. Although various
error sources can be detected, these errors cannot be corrected in the calibration of ratings (Lunz et al., 1996).
Furthermore, because raters' severity cannot be detected, the impact of seventy errors cannot be taken into
account in rating calibration. Clearly, more sophisticated measurement models are needed and the many-faceted
Rasch model is a good alternative.
The many-faceted Rasch model, introduced by Linacre (1989), is based on the well-developed Rasch model
family (Wright & Masters, 1982). The Rasch model (Rasch, 1960/1980), known also as the one-parameter
logistic model, is a measurement model in the framework of item response theory (IRT). The Rasch model is a
two-faceted model that is usually used to model the relation between an examinee's underlying trait and his or
her response (e.g., correct and incorrect) to a test item. If an examinee's ability is higher than the difficulty of a
testing item, the chance that the examinee will complete the item successfully should become larger; in contrast,
if the ability is lower than the difficulty, the chance becomes smaller. In the context of rating the content

representativeness of items, the two facets are the raters' underlying trait (severity) and the quality of the test
items (good or bad). Thus, the probability that an item will receive a good rating depends on both the raters'
severity and item quality. This two-faceted model can be extended to a many-faceted model (Andrich, 1988;
Linacre, 1989). For example, if we take experts' group membership, such as gender, into consideration in the
modeling, the two-faceted model then becomes a three-faceted (i.e., item, rater, and gender) model. For more
information about the many-faceted Rasch model, interested readers may refer to Zhu and Cole (1996) for a
basic introduction and Linacre (1989) for a more thorough description.
The major advantage of the many-faceted Rasch model in modeling expert judgment relies on its invariance
feature—an advanced feature of IRT. In the general context of two-faceted modeling (i.e., item and examinee),
invariance means that item parameters are independent from examinees employed, and similarly, examinee
ability parameters are independent from testing items employed. Invariance, thus, is very much like the
invariant feature of any regression function: A regression function is unchanged even if the distribution of the
predictor variables is changed. The same invariance principle can be applied to the rating situation, where the
parameter of rater severity should also be invariant (Lunz et al., 1996). This means that, through appropriate
judgment and linkage plans (Linacre, 1994a), the impact of raters' severity can be examined and corrected4 even
if raters rate different items. As a result, parameters of objects rated, which could be examinees' abilities or item
qualities, is independent of the effects of rater severity and other related facets.
There are other advantages of applying the many-faceted Rasch model to the assessment of expert judgment.
First, the consistency of raters' performance and rater-by-item "bias" can be monitored and examined, which
can provide quantitative information about raters' performance, as well as valuable feedback on their
performance (Stahl & Lunz, 1996). Second, the quality of the items can be more appropriately evaluated using
logit scores generated in the Rasch modeling in which judge severity has been corrected (Lunz et al,, 1996).
Finally, in contrast to conventional methods, the many-faceted Rasch model does not require every judge to rate
every item if a network connecting all of the judges through common items has been completed (Linacre,
1994a).
A number of successful applications of the many-faceted Rasch model to judgment practices have been
reported. Lunz, Wright, and Linacre (1990), for example, examined judge severity by assigning examination
scores into three facets—examinee performances, items, and judges—and calibrated them using the model.
Engelhard (1992) applied the model to assessments of writing ability and reported that there were significant
differences in rater severity even after extensive training. Using the same model, Kenyon and Stansfield (1992)
examined the validity of a speaking scale used in a performance assessment. More recently, Looney (1997)
applied the model to analyze the judging scores from the 1994 Olympic figure skating competition and
concluded that there was unanimity in rankings across judges. The model, however, has not been applied to the
modeling of experts' judgment in test or instrument development. The purpose of this article, therefore, was to
apply the many-faceted Rasch model to the process of validating an inventory and to model experts' judgments
on the content representativeness of items. The significance of this research lies in the application of the many-
faceted Rasch model to the examination of experts' judgments. Routine use of this procedure may enhance the
standardization of expert judgment in item evaluation.
METHOD
Participants
Two hundred ninety-eight university educators and school-based physical education teachers served as
experts5.These experts were selected randomly from individuals who had attended professional conferences and
who were considered to be active professionals. The university educators (n = 140) represented individuals
working at universities and colleges with curricular and instructional interests in elementary, middle, and high
school physical education. At the time of the study, each was involved in preparing and supervising preservice
teachers. The school-based physical educators (n = 158) represented individuals teaching physical education in
elementary, middle, and high schools.

Instrument Development
An instrument assessing educational value orientations (Ennis & Hooper, 1988) was revised to better examine
the role that educational beliefs play in curriculum decision making (Ennis & Chen, 1993). Value orientations
represent belief systems that are influential in teachers' educational decision making. Based on previous studies
(e.g., Ennis, Chen, & Ross, 1992), five value orientations were defined in the curriculum content domains of
disciplinary mastery, learning process, self-actualization, ecological integration, and social reconstruction/
responsibility described in Table 1. One hundred fifty items were developed to represent these value
orientations. Examples of these items are also included in Table 1.01 the 150 items developed, 35 were used as
distractors. Distractors were included in an effort to confuse raters who were uncertain about their responses.
Because these items did not represent the content domains, experts were expected to assign low ratings when
assessing item content representatives.
Data Collection
Judgment and linkage plan. Because of the time commitment required to evaluate 150 items, items were
randomly assigned to one of four rating forms, consisting of 60 items each, with 30 common items across all
forms. The common items were used for the form linkage, based on which four forms (A—D) were set on a
common scale6. The judgment and linkage plan employed is illustrated in Figure 1. Note that common items
were counted only once when computing the total number of items in each content area (e.g., n = 7 in
disciplinary mastery). The rating forms were sent to raters to evaluate the extent to which each item represented
its corresponding content domain. More specifically, respondents were asked to rate the consistency of each
item to represent one part of the broad curriculum goals using a 5-point rating scale ranging from 1 (not
consistent) to 5 (item very consistent with the domain sentence). Although no face-to-face training was provided
due to the limitation of mail survey, detailed instructions on how ratings should be issued were included in both
the cover letters and instruments to the respondents. Respondents were also asked to provide their personal
demographic information, including gender, ethnicity, and type of employment (elementary, middle, high
school, or university).
Respondents. Two hundred thirty-one raters (77.52%), including 128 university educators, 16 elementary, 26
middle school, and 36 high school teachers, returned their rating forms. Additionally, 7 respondents indicated
they taught at more than one school level (coded as multilevel) and 15 served as administrators. Also, 3
respondents' employment information was missing. Among the respondents, 85 (36.80%) were male, 142
(61.47%) were female, and 4 did not indicate their gender. The majority were White (n = 191, 82.68%), 27
(11.69%) did not indicate their ethnicity, and 13 (5.63%) reported minority status. Demographic data for the
respondents are reported in Table 2.
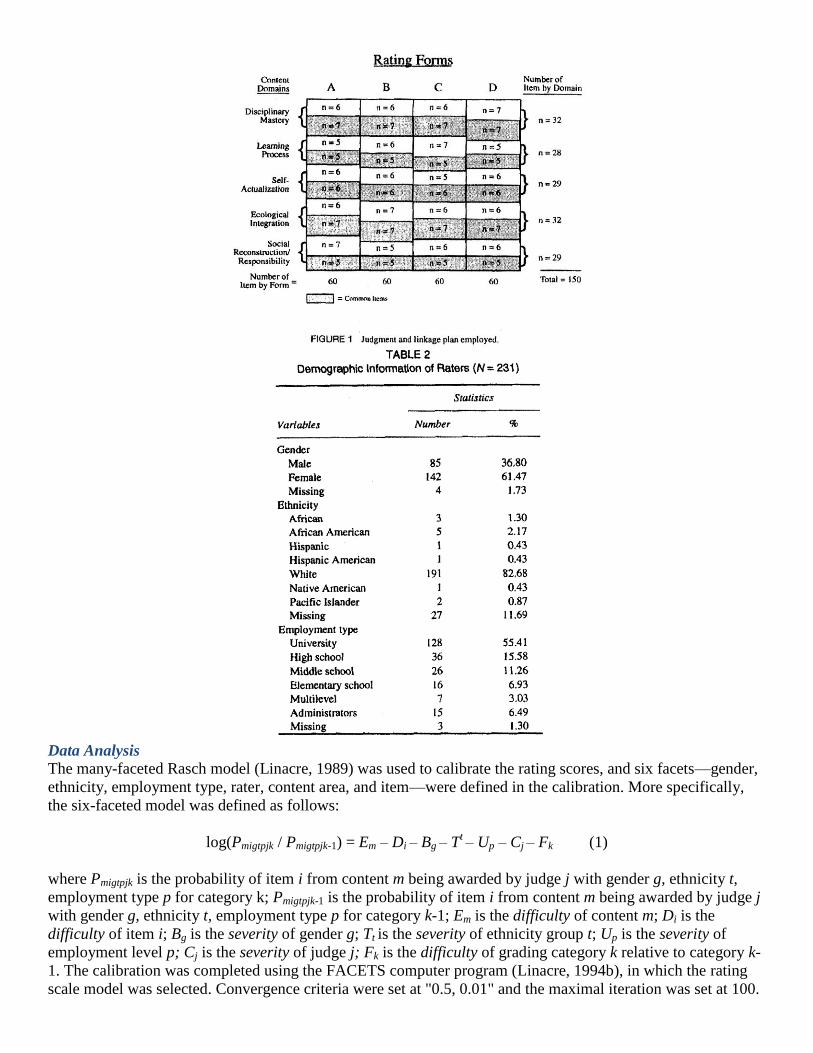
Data Analysis
The many-faceted Rasch model (Linacre, 1989) was used to calibrate the rating scores, and six facets—gender,
ethnicity, employment type, rater, content area, and item—were defined in the calibration. More specifically,
the six-faceted model was defined as follows:
log(Pmigtpjk / Pmigtpjk-1) = Em – Di – Bg – Tt – Up – Cj – Fk (1)
where Pmigtpjk is the probability of item i from content m being awarded by judge j with gender g, ethnicity t,
employment type p for category k; Pmigtpjk-1 is the probability of item i from content m being awarded by judge j
with gender g, ethnicity t, employment type p for category k-1; Em is the difficulty of content m; Di is the
difficulty of item i; Bg is the severity of gender g; Tt is the severity of ethnicity group t; Up is the severity of
employment level p; Cj is the severity of judge j; Fk is the difficulty of grading category k relative to category k-
1. The calibration was completed using the FACETS computer program (Linacre, 1994b), in which the rating
scale model was selected. Convergence criteria were set at "0.5, 0.01" and the maximal iteration was set at 100.

Item facet was defined to be measured positively. Therefore, a more consistent item would receive a higher
logit score. In contrast, a more lenient judge would receive a lower logit score, which reflects less severity.
Two fit-statistic indexes, Infit and Outfit (Wright & Masters, 1982), were provided by FACETS and were used
to assess the model—data fit. Infit denoted the information-weighted mean-square fit statistic and Outfit had the
same form as Infit but was more sensitive to outliers. Infit and Outfit statistics with a value 1 were considered to
have a satisfactory model—data fit. In this study, a value greater than 1.3 or lower than 0.7 was defined as a
misfit. In the context of this study, values greater than 1.3 can be interpreted as noisy or inconsistent ratings,
whereas values less than 0.7 reflect too little variation or too little independence.
Based on observed and calibrated information, descriptive statistics, including the correlation, were computed
for average judge raw scores and logit scores. Using the calibrated information, group differences in ratings
were compared by gender, ethnicity, and employment level. Then, raters' rating consistency was evaluated using
fit statistics provided by FACETS. Similarly, average item raw scores and logit scores were computed and
compared, and items were evaluated using the logit scores. More specifically, items were classified into three
categories based on descriptive statistics of logit scores: low rating (< —0.72), that is, 1 standard deviation
(SD) below the mean; medium rating (≥ —0.72 to ≤ 0.72), that is, between ±1 SD; and high rating (> 0.72), that
is, above +1 SD. According to fit statistics, items in each category were further classified as consistent or
inconsistent, The consistent category included items with high interjudge agreement, whereas the inconsistent
category included items with low interjudge agreement.
RESULTS
Corresponding to logit scores, obvious variations of average judge raw scores were found, although the
correlation between these scores was high. The average judge raw scores (M = 2.9, SD = 0.4), logit scores (M =
—0,44, SD = 0.52), and the relation among these scores (r = —0.91) is reported in Figure 2.

An examination of experts' judgments indicated that they might be affected by the experts' backgrounds. The
impact of group membership on experts' ratings and the consistency of their rating performance, including
calibrated logits, standard errors of the logits, and Infit and Outfit statistics, are reported in Table 3. Male raters
were more severe than female raters, and the minority group was more severe than the White group. Among the
employment-type groups, the university educator group gave the most favorable ratings and the multilevel
group gave the most severe ratings. Satisfactory model—data fits were found for all groups.
Most raters were consistent with their ratings. Of the 13,705 valid individual ratings, only 152 (1.11%) were
identified as misfit. Of the 152 misfit ratings, 63.81% were attributed to raters who had one or two misfit
ratings. Individual misfit ratings are summarized in Table 4. There were 11 raters who had three misfit ratings,
and 4 raters who had more than three misfit ratings (4, 5, 6, and 7 each). Misfits by gender, ethnicity, and
employment type are also reported in Table 4.
Corresponding to logit scores, variations were also found in average item raw scores, although, again, the linear
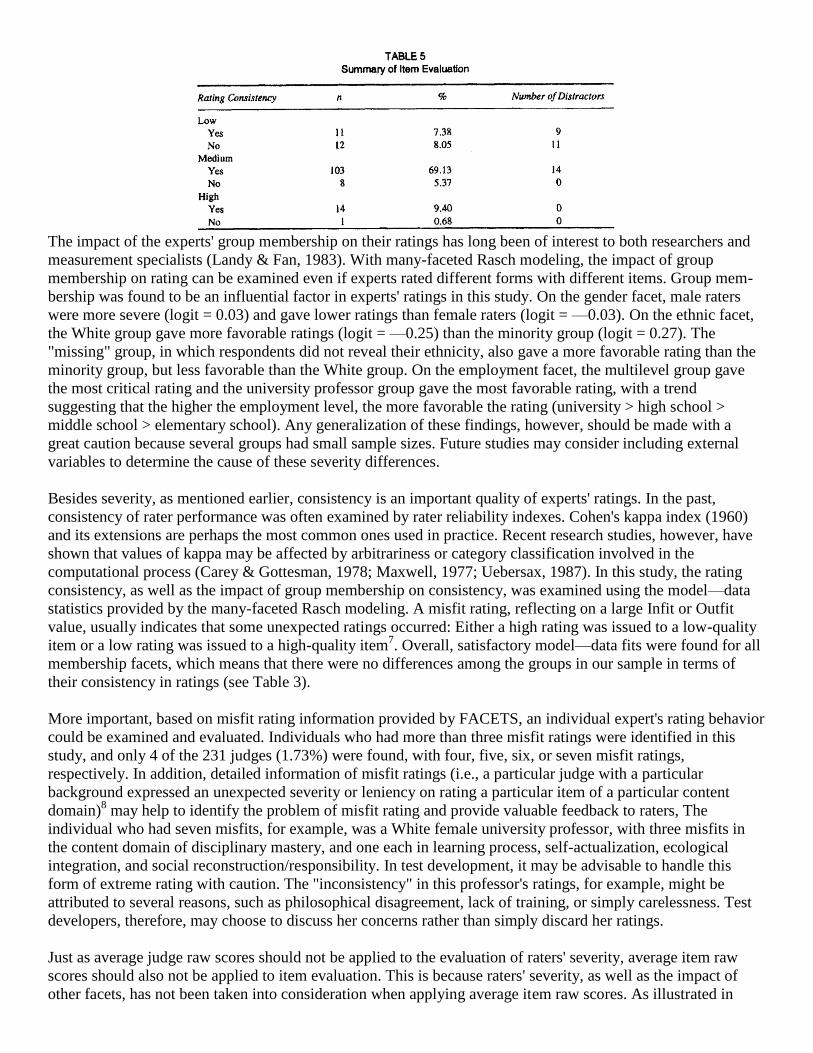
relationship between scores was high (r = 0.98, see Figure 3). Item evaluations based on logit scores are
summarized in Table 5. Items are classified into three categories: (a) low rating, in which items needed to be

revised or deleted, (b) medium rating, in which some items needed to be revised, and (c) high rating, in which
most of items should be retained. Item 136, a distractor, was deleted due to incomplete information. Of 149
items retained, 21 (14.09%) were found to be misfits (see "no" in consistency categories in Table 5). Most
misfit items occurred in the low-rating (n = 12, 57.14%) and medium-rating (n = 8, 38.10%) categories (see
Table 5), Most items written as distractors (n = 20, 58.82%) were classified into the low rating category.
Very little difference, according to logit scores, was found among the content domains in terms of both overall
quality and consistency, suggesting that these domains were balanced designed. The calibration of the content-
domain facet, as well as fit statistics, were summarized in Table 3.
FIGURE 3 Average item raw rating scores, logit scores, and their relation.
DISCUSSION
A major benefit of applying the many-faceted Rasch model to modeling expert judgment in test development is
that judging severity can be detected, corrected if necessary, and unbiased ratings can then be applied to item
evaluation. In the past, very little attempt has been made to detect and correct experts' severity in the
conventional practice of item evaluation. As a result, controlling expert severity merely by pre-rating training
has been demonstrated as often ineffective (Raymond et al., 1991).
Although it is more convenient to use average judge raw scores to examine experts' severity, scores may be
biased, especially if experts are asked to rate different items. It is then difficult to determine the real cause of
low rating scores from two judges on two different items. It could be that one judge is more severe than another,
but it also could be that one item has lower quality than another. In contrast, through the linkage of common
items, the many-faceted Rasch modeling could set items being rated, as well as different facets of a rating, on a
common reference frame of a measurement. Raters' severity, then, become independent from items that experts
rated. As expected, a large variation corresponding to a similar logit score (i.e., a similar rating severity) was
found in average judge raw scores in this study. At the logit score —1.0, for example, the corresponding
average judge raw scores ranged from 3.1 to 3.5 (Figure 2). Thus, the many-faceted Rasch modeling provides
an objective and quantitative approach to examine experts' judging severity.
The impact of the experts' group membership on their ratings has long been of interest to both researchers and
measurement specialists (Landy & Fan, 1983). With many-faceted Rasch modeling, the impact of group
membership on rating can be examined even if experts rated different forms with different items. Group mem-
bership was found to be an influential factor in experts' ratings in this study. On the gender facet, male raters
were more severe (logit = 0.03) and gave lower ratings than female raters (logit = —0.03). On the ethnic facet,
the White group gave more favorable ratings (logit = —0.25) than the minority group (logit = 0.27). The
"missing" group, in which respondents did not reveal their ethnicity, also gave a more favorable rating than the
minority group, but less favorable than the White group. On the employment facet, the multilevel group gave
the most critical rating and the university professor group gave the most favorable rating, with a trend
suggesting that the higher the employment level, the more favorable the rating (university > high school >
middle school > elementary school). Any generalization of these findings, however, should be made with a
great caution because several groups had small sample sizes. Future studies may consider including external
variables to determine the cause of these severity differences.
Besides severity, as mentioned earlier, consistency is an important quality of experts' ratings. In the past,
consistency of rater performance was often examined by rater reliability indexes. Cohen's kappa index (1960)
and its extensions are perhaps the most common ones used in practice. Recent research studies, however, have
shown that values of kappa may be affected by arbitrariness or category classification involved in the
computational process (Carey & Gottesman, 1978; Maxwell, 1977; Uebersax, 1987). In this study, the rating
consistency, as well as the impact of group membership on consistency, was examined using the model—data
statistics provided by the many-faceted Rasch modeling. A misfit rating, reflecting on a large Infit or Outfit
value, usually indicates that some unexpected ratings occurred: Either a high rating was issued to a low-quality
item or a low rating was issued to a high-quality item7. Overall, satisfactory model—data fits were found for all
membership facets, which means that there were no differences among the groups in our sample in terms of
their consistency in ratings (see Table 3).
More important, based on misfit rating information provided by FACETS, an individual expert's rating behavior
could be examined and evaluated. Individuals who had more than three misfit ratings were identified in this
study, and only 4 of the 231 judges (1.73%) were found, with four, five, six, or seven misfit ratings,
respectively. In addition, detailed information of misfit ratings (i.e., a particular judge with a particular
background expressed an unexpected severity or leniency on rating a particular item of a particular content
domain)8 may help to identify the problem of misfit rating and provide valuable feedback to raters, The
individual who had seven misfits, for example, was a White female university professor, with three misfits in
the content domain of disciplinary mastery, and one each in learning process, self-actualization, ecological
integration, and social reconstruction/responsibility. In test development, it may be advisable to handle this
form of extreme rating with caution. The "inconsistency" in this professor's ratings, for example, might be
attributed to several reasons, such as philosophical disagreement, lack of training, or simply carelessness. Test
developers, therefore, may choose to discuss her concerns rather than simply discard her ratings.
Just as average judge raw scores should not be applied to the evaluation of raters' severity, average item raw
scores should also not be applied to item evaluation. This is because raters' severity, as well as the impact of
other facets, has not been taken into consideration when applying average item raw scores. As illustrated in

Figure 3, even though the average item raw scores were highly correlated with the logit scores in this study, the
influence of judges' rating severity existed. At the logit score —0.75, for example, the corresponding average
raw rating scores ranged from L7 to 2.2. Logit scores, in which raters' severity and the impact of other facets
were taken into account, therefore, should be employed and applied to item evaluation.
Similar to expert severity, the quality of an item was evaluated on two different aspects: its overall quality
expressed by a logit score and its fit statistics. A logit score reflects an overall rating from experts on an item in
terms of its content representativeness, but it is no longer dependent on the unique characteristics of the selected
experts and forms encountered, In other words, the effects of expert severity and other facets of the rating have
been taken into account in a logit score. Item fit statistics reflects the degree of unexpected ratings on an item. If
many severe raters give high ratings on an item, but many lenient raters give the item low ratings, it will be
defined as a misfit item. A misfit item, thus, really means that either the item was poorly defined or the item
was biased by raters' group membership. An item should be revised or dropped if it has a low logit score or a
poor fit statistic.
All of the low and inconsistent items identified by the Rasch modeling (Table 5) were those purposely written
as distractors. This was also true for the items classified as consistently low, except for Items 11 and 114. The
fact that raters accurately classified distractors reflected at least two positive aspects of the instrument
development in this study: (a) most items developed represented their content domains, and (b) the raters
involved were truly experts. Although Items 11 and 114 were not developed as distractors, lower ratings of the
items indicated that their representativeness of the content domain was questionable. These items should be
either revised or deleted. Because 11 distractors were classified into the medium-consistent category, some
items in this category, as well as those in the medium-inconsistent category, may need further improvement.
Finally, taking other item-related facets into consideration in the calibration provided a new way to evaluate the
appropriateness of testing items. In this study, for example, overall quality and consistency across different
content domains (Table 3) were also examined using logits, which provided test developers additional
information regarding the quality of the test designed.
The many-faceted Rasch model thus provided a frame of reference for quantifying all elements of test
development. The Rasch multifaceted analysis permits all elements involved in the test development to be
examined quantitatively and objectively. If a judge is found to be inconsistent in his or her rating severity, he or
she should be retrained or dropped from future involvement. If an item's rating is affected by judges' ethnic and
or gender backgrounds, it suggests that the item may be racially/ethnically, or gender biased. Test developers
might choose to include or delete the item based on the purpose of the test or research.
However, the many-faceted Rasch modeling is not without limitations. First, the Rasch analysis is more
computationally complex than traditional methods based on the classical test theory. Second, the Rasch model
belongs to more restricted measurement models and must fit the data before it can be applied (Zhu & Cole,
1996). Third, a careful linking plan must be developed if multiple raters and forms are involved in the judgment
of the protocols. In addition, other measurement models may sometimes work better than the many-faceted
Rasch model in certain circumstances. For example, a multilevel and multidimensional model has been
proposed to examine rater severity in more complex situations (Wang, 1997). As in all data analyses,
investigators should examine the assumptions and situations carefully before selecting an analysis strategy.
CONCLUSION
In summary, facets of expert judgment in test development were analyzed and evaluated quantitatively using the
many-faceted Rasch model. Although group membership did not affect the model-data fit, its impact on item
ratings was detected. The many-faceted Rasch model facilitated the examination of expert severity and the
influence of the expert's group membership on his or her ratings, thus achieving an objective, or rater-free, item
evaluation. The many-faceted Rasch model contributed to the test developers' understanding of the rating
process and provided additional quantitative supports for inclusion and deletion of potential test items.

Notes:
1 Other aspects °Crating, such as rating formats, halo effect, central tendency, and restriction of range, may also
threaten the validity of ratings. Interested readers may refer to Saal et al. (1980) for information.
2 Various operational definitions have been proposed for severity and leniency. Interested readers may refer to
Lunz, Stahl, and Wright (1996) and Saal et al. (1980) for more detail.
3 The indexes described here are used mainly for category variables that are commonly used in experts' ratings.
Interested readers may refer to Traub (1994) for the reliability coefficients for continuous variables.
4 The correction, or adjustment, was made based on the invariance feature of the Rasch calibration; that is, the
bias introduced by the combination of raters and forms that an item encounters is accounted for in the
calibration, Interested readers may refer to Linacre (1989) and Lunz and Stahl (1993) for more information.
5 Because expertise was loosely defined in this study, the terms expert, rater, and judge were used
interchangably. So were the terms judgment and rating.
6 The linkage was accomplished through the many-faceted Rasch calibration. Because of its invariance feature,
the forms were calibrated and or linked on the same metric through a single FACETS calibration (Linacre,
1994b). This is different from the common practice in the conventional equating, in which various forms are set
on the same scale by separate links.
7 The expectation refers to the Rasch model expectation, which is similar to the prediction in a regression
analysis. If there is too little variation in a rater's ratings (e.g., all ratings are "4s"), the rater will also be
identified as a misfit rater, but with a small Infit and Outfit value, Interested readers may refer to Linacre
(1994b, p. 74) for more information about misfit criteria and their interpretations.
8 Some authors (e.g., Stahl & Lunz, 1996) have referred to this kind of severity or leniency as a rating bias.
REFERENCES
American Educational Research Association, American Psychological Association, & National Council on
Measurement in Education. (1985). Standards for educational and psychological testing. Washington, DC:
American Psychological Association.
Andrich, D. (1988). A general form of Ranch's extended logistic model for partial credit scoring. Applied
Measurement in Education, 4,363-378.
Bakeman, R., & Gottman, J. M. (1986). Observing interaction: An introduction to sequential analysis. London:
Cambridge University Press.
Carey, G., & Gottesman, I. I. (1978). Reliability and validity in binary ratings: Areas of common
misunderstanding in diagnosis and symptom ratings. Archives of General Psychiatry, 35, 1454-1459.
Cohen, J. (1960). A coefficient of agreement for nominal scales. Educational and Psychological Measurement,
20, 37-46.
Cohen, J. (1968). Weighted kappa: Nominal agreement with provision for scaled disagreement or partial credit.
Psychological Bulletin, 70, 213-220.
Conger, A. J. (1980). Integration and generalization of kappas for multiple raters, Psychological Bulletin, 88,
322-328.
Crocker, L., Llabre, M., & Miller, M. D. (1988), The generalizability of content validity ratings, Journal of
Educational Measurement, 25,287-299.
Cronbach, L. J., Gleser, G. C., Nanda, H„ & Rajaratnarn, N, (1972). The dependability of behavioral
measurements. New York: Wiley.
Dunbar, S. B., Koretz, D. M., & Hoover, H. D. (1991), Quality control in the development and use of
performance assessment. Applied Measurement in Education, 4, 289-303.
Ebel, R. L. (1972). Essentials of educational measurement. Englewood Cliffs, NJ: Prentice-Hall.
Engelhard, G., Jr. (1992). The measurement of writing ability with a Many-Faceted Rasch model. Applied
Measurement in Education, 5, 171-191.
Ennis, C. D., & Chen, A. (1993). Domain specifications and content representativeness of the revised value
orientation inventory, Research Quarterly for Exercise and Sport, 64, 436-446.
Ennis, C, D„ Chen, A., & Ross, J. (1992). Educational value orientations as a theoretical framework for
experienced urban teachers' curricular decision making. Journal of Research and Development in Education,
25, 156-163.

Ennis, C. D., & Hooper, L. M. (1988). Development of an instrument for assessing educational value
orientations. Journal of Curriculum Studies, 20, 277-280.
Glass, G. V. (1978). Standards and criteria, Journal of Educational Measurement, 15, 237-261. Kazdin, A. E.
(1977). Artifacts, bias, and complexity of assessment: The ABC's of reliability. Journal of Applied Behavior
Analysis, 10, 141-150.
Kenyon, D. M., & Stansfield, C. W. (1992, April). Examining the validity of a scale used in a performance
assessment from many angles using the Many-Faceted Rasch Model. Paper presented at the meeting of the
American Educational Research Association, San Francisco, CA.
Landy, F. J., & Farr, J. L. (1983). The measurement of work performance: Methods, theory, and applications.
New York: Academic.
Linacre, J. M. (1989). Many-faceted Rasch measurement. Chicago: MESA Press.
Linacre, J, M. (1994a). Constructing measurement with a many-facet Rasch model. In M. Wilson (Ed.),
Objective measurement: Theory into practice (Vol. 2, pp, 129-144). Norwood, NJ: Ablex.
Linacre, J. M. (1994b). FACETS: Rasch Measurement Computer Program (Version 2.7) [Computer software].
Chicago: MESA Press.
Looney, M. A. (1997). A many-facet Rasch analysis of 1994 Olympic figure skating scores [Abstract].
Research Quarterly for Exercise and Sport, 68(Suppl. I), A-53.
Lunz, M. E., & Stahl, J. A. (1993). The effect of rater severity on person ability measure: A Rasch model
analysis. The American Journal of Occupational Therapy, 47,311-317.
Lunz, M. E., Stahl, J. A., & Wright, B. D. (1996). The invariance of judge severity calibrations. In G. Engelhard
& M. Wilson (Eds.), Objective measurement: theory into practice (Vol. 3, pp. 99-112). Norwood, NJ: Ablex.
Lunz, M. E., Wright, B. D., & Linacre, J. M. (1990). Measuring the impact of judge severity of examination
scores. Applied Measurement in Education, 3,331-345.
Maxwell, A. E. (1977). Coefficients of agreement between observers and their interpretation. British Journal of
Psychiatry, 130, 79-83.
Popham, W, J. (1992). Appropriate expectations for content judgments regarding teacher licensure tests.
Applied Measurement in Education, 5,285-301.
Rasch, G. (1980). Probabilistic models for some intelligence and attainment tests. Chicago: University of
Chicago Press. (Original work published 1960)
Raymond, M., Webb, L., & Houston, W. (1991). Correcting performance rating errors in oral examinations.
Evaluation and the Health Professions, 14, 100-122.
Saal, F. E., Downey, R. G., & Lahey, M. A. (1980). Rating the ratings: Assessing the psychometric quality of
rating data. Psychological Bulletin, 88, 413-428.
Safrit, M. J., & Wood, T. M. (1995). Introduction to measurement in physical education and exercise science
(3rd e4:1). St. Louis, MO: Mosby.
Stahl, J. A., & Lunz, M. E, (1996). Judge performance reports: Media and message. In G. Engelhard & M.
Wilson (Eds,), Objective measurement: Theory into practice (Vol. 3, pp. 113-125). Norwood, NJ: Ablex.
Tittle, C. K. (1982). Use of judgmental methods in item bias studies. In R. A. Berk (Ed.), Handbook of
methods for detecting test bias (pp. 31-63). Baltimore, MD: The Johns Hopkins University Press, Traub, R. E.
(1994). Reliability for the social sciences: Theory and applications. Thousand Oaks, CA: Sage.
Uebersax, J. S. (1987). Diversity of decision-making models and the measurement of interrater agreement.
Psychological Bulletin, 101, 140-146.
Wang, W. (1997, March). Estimating rater severily with multilevel and multidimensional item response
modeling. Paper presented at the meeting of the American Educational Research Association, Chicago, IL.
Wright, B. D., & Masters, G. N. (1982). Rating scale analysis: Rasch measurement. Chicago: MESA Press.
Zhu, W., & Cole, E. L. (1996). Many-faceted Rasch calibration of a gross motor instrument. Research
Quarterly for Exercise and Sport, 67, 24-34.