Embed Size (px)
Citation preview
Māori values – Iwi
Perspectives of Freshwater Management
¹ Garth Harmsworth (Te Arawa, Ngāti Tūwharetoa, Ngāti Raukawa) ² Shaun Awatere (Ngāti Porou)
¹ Landcare Research, Private Bag 11-052, Palmerston North [email protected] ² Landcare Research, Private Bag 3127, Hamilton [email protected]
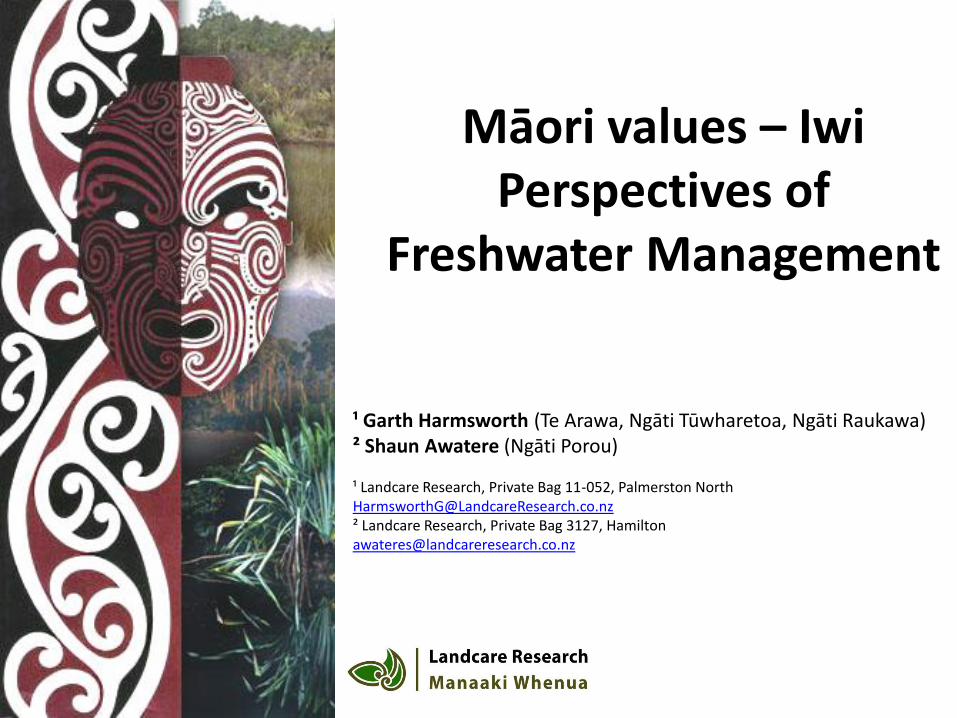
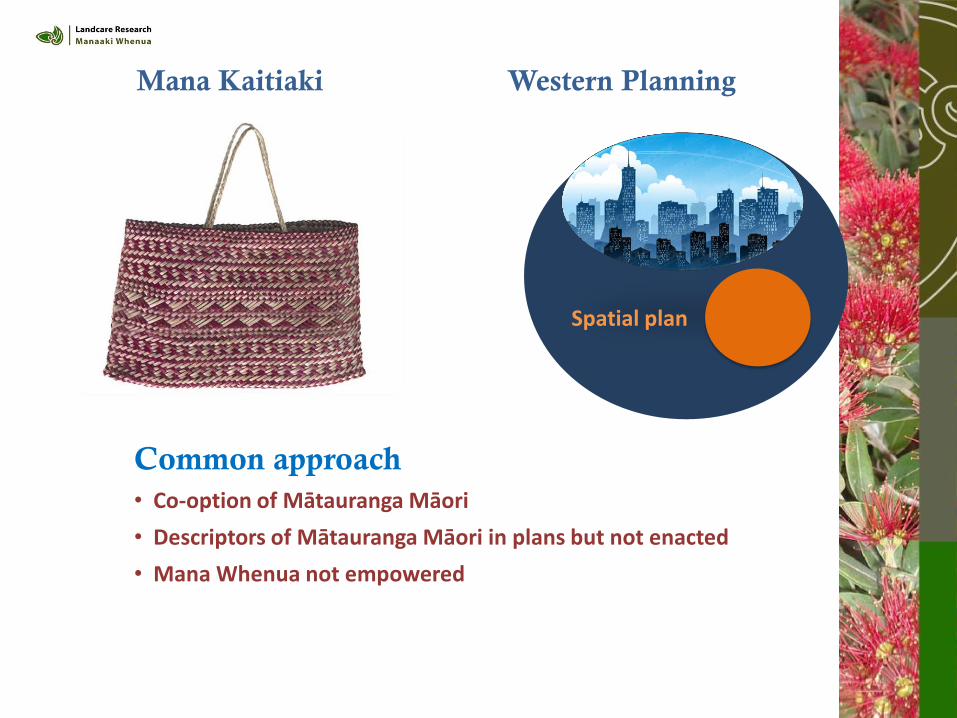
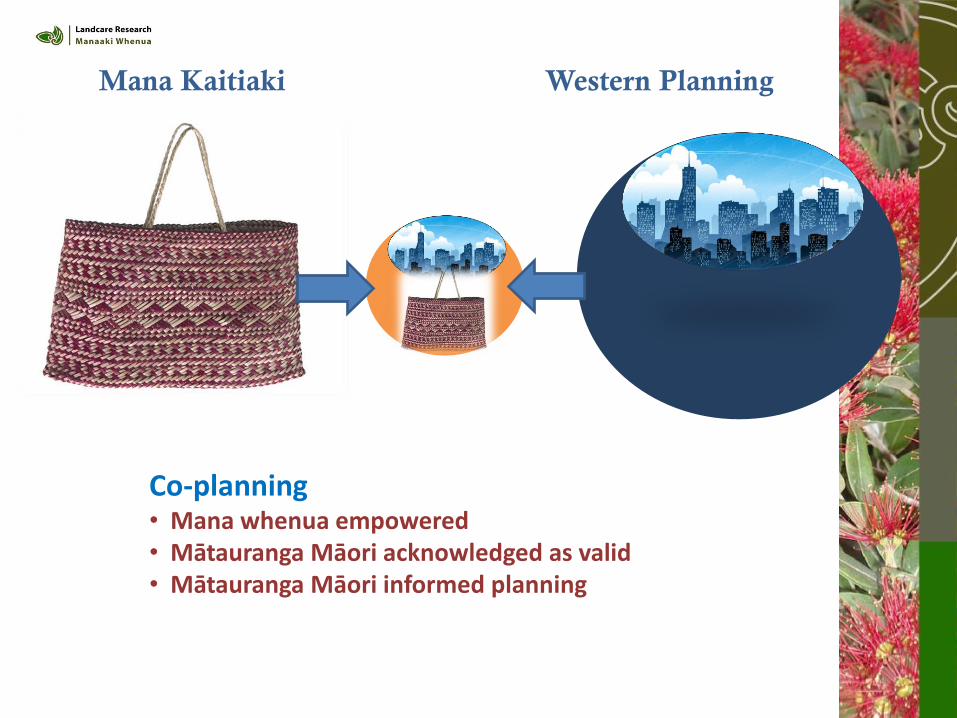
Mana Kaitiaki Western Planning
Kaitiakitanga Rangatiratanga Whakapapa
Western–centric
Neo-liberal economics
Globalised economies
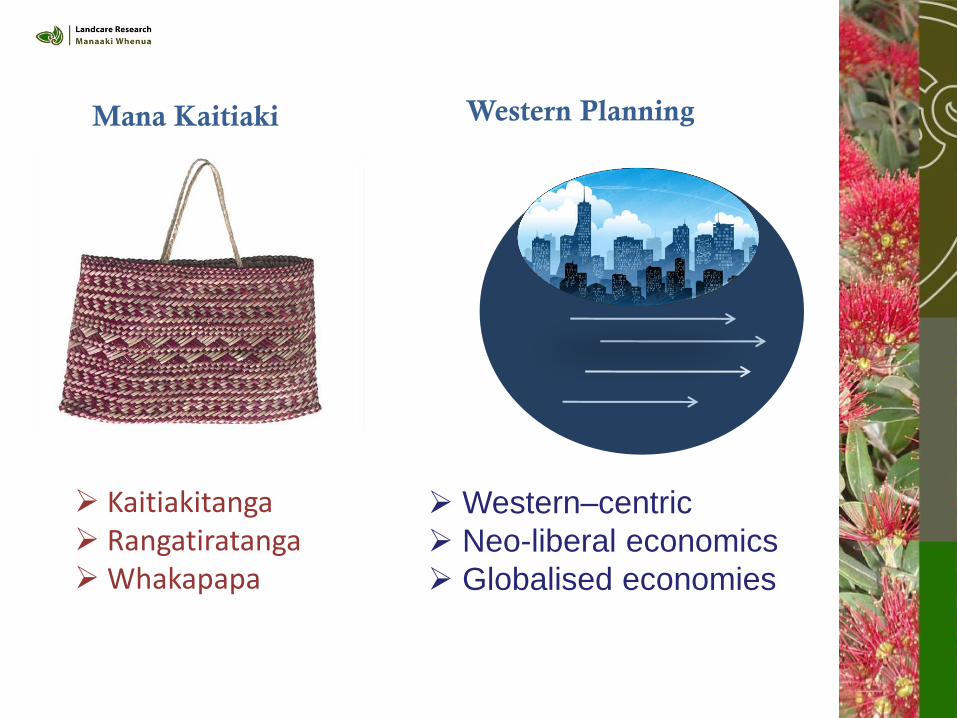
Global pressures e.g. climate change globalisation resource depletion
Mana Kaitiaki
Co-management Sustainability Alternative paradigms for urban planning
Dominant Western Planning
Resilience
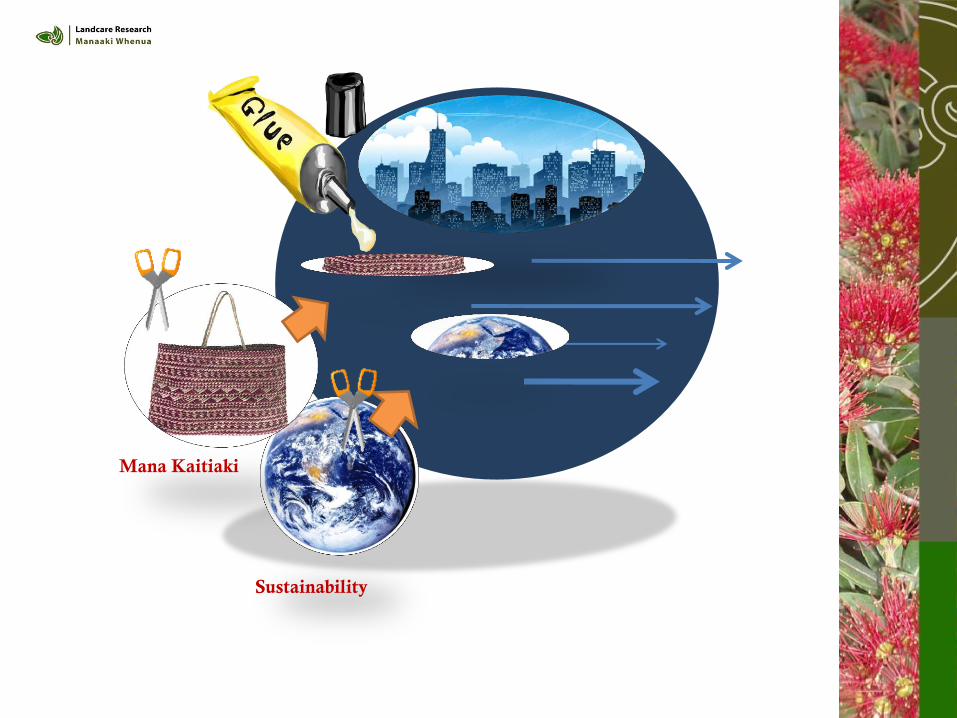
Sustainability
Mana Kaitiaki
Mana Kaitiaki Western Planning
Common approach • Co-option of Mātauranga Māori
• Descriptors of Mātauranga Māori in plans but not enacted
• Mana Whenua not empowered
Spatial plan
Mana Kaitiaki Western Planning
Co-planning • Mana whenua empowered • Mātauranga Māori acknowledged as valid • Mātauranga Māori informed planning
HE WERO THE CHALLENGE
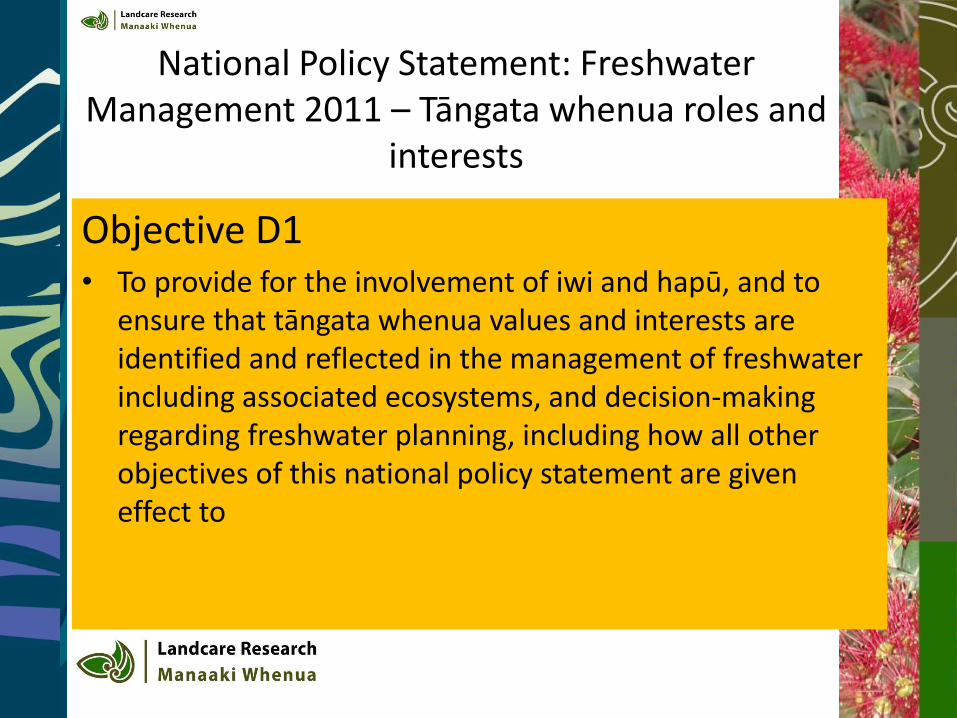
National Policy Statement: Freshwater
Management 2011 – Tāngata whenua roles and interests
Objective D1 • To provide for the involvement of iwi and hapū, and to
ensure that tāngata whenua values and interests are identified and reflected in the management of freshwater including associated ecosystems, and decision-making regarding freshwater planning, including how all other objectives of this national policy statement are given effect to
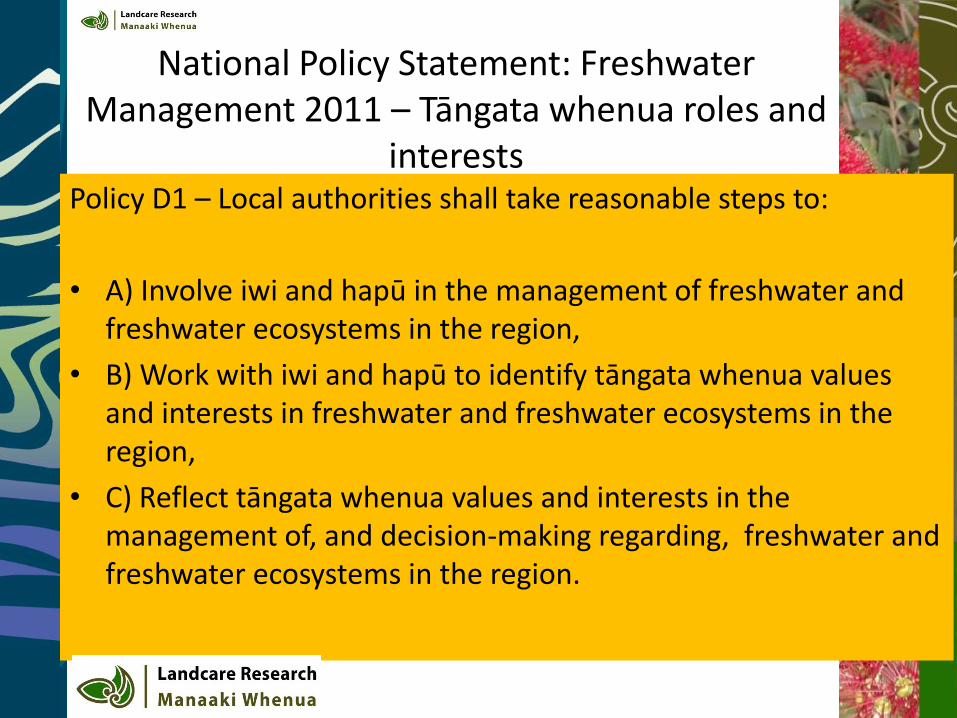
Policy D1 – Local authorities shall take reasonable steps to:
• A) Involve iwi and hapū in the management of freshwater and freshwater ecosystems in the region,
• B) Work with iwi and hapū to identify tāngata whenua values and interests in freshwater and freshwater ecosystems in the region,
• C) Reflect tāngata whenua values and interests in the management of, and decision-making regarding, freshwater and freshwater ecosystems in the region.
National Policy Statement: Freshwater
Management 2011 – Tāngata whenua roles and interests
NGĀ POU HERENGA FRAMEWORK
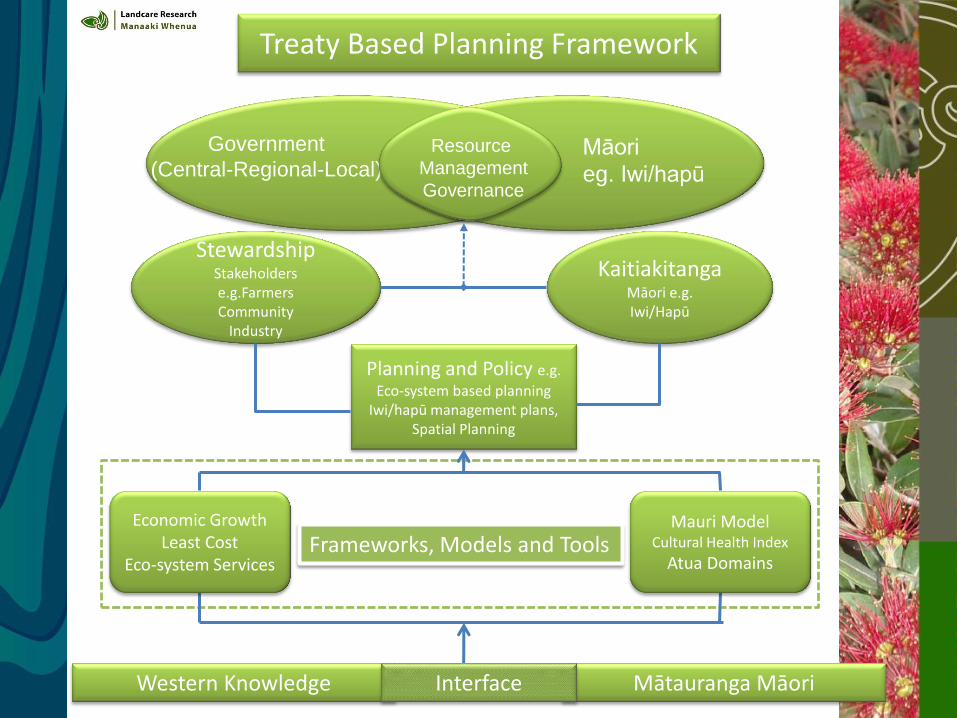
Treaty Based Planning Framework
Planning and Policy e.g.
Eco-system based planning Iwi/hapū management plans,
Spatial Planning
Kaitiakitanga Māori e.g. Iwi/Hapū
Stewardship Stakeholders e.g.Farmers Community
Industry
Economic Growth Least Cost
Eco-system Services
Māori
eg. Iwi/hapū
Government
(Central-Regional-Local) Resource
Management
Governance
Mātauranga Māori Western Knowledge Interface
Mauri Model Cultural Health Index
Atua Domains Frameworks, Models and Tools
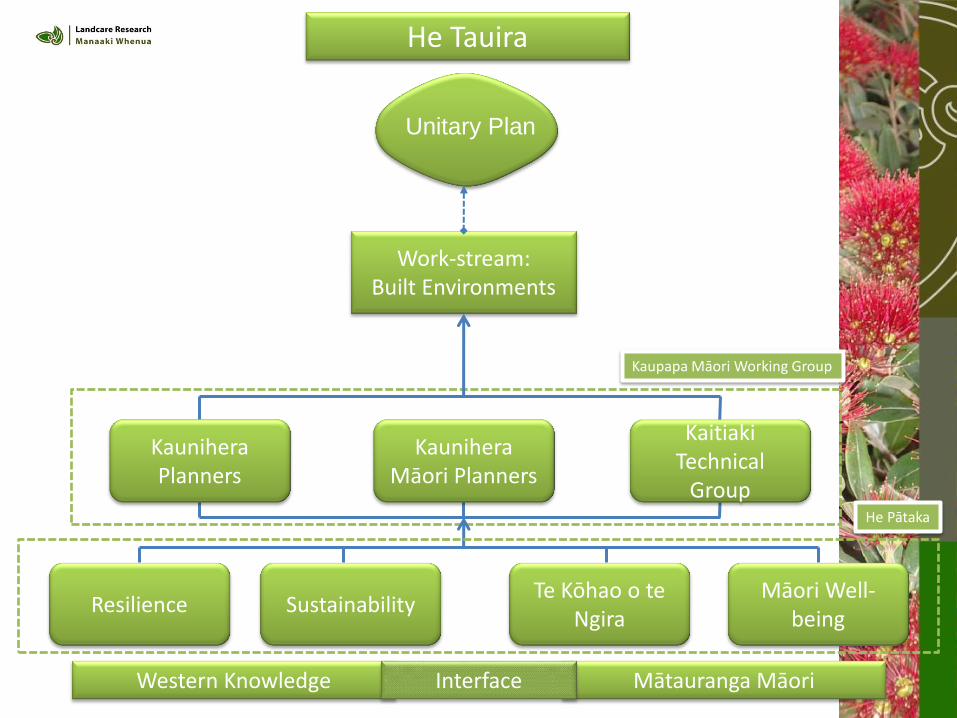
He Tauira
Kaupapa Māori Working Group
Kaunihera Planners
Kaitiaki Technical
Group
Kaunihera Māori Planners
Resilience Sustainability Te Kōhao o te
Ngira Māori Well-
being
Work-stream: Built Environments
Unitary Plan
He Pātaka
Mātauranga Māori Western Knowledge Interface
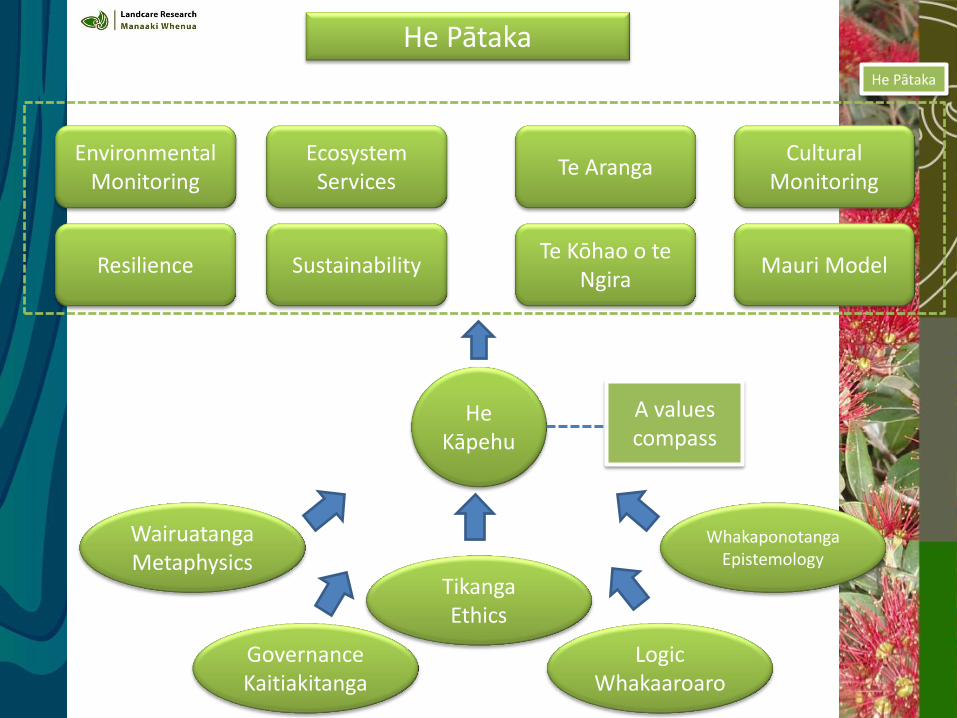
He Pātaka
Resilience Sustainability Te Kōhao o te
Ngira Mauri Model
He Pātaka
Tikanga Ethics
Whakaponotanga Epistemology
WairuatangaMetaphysics
Governance Kaitiakitanga
Logic Whakaaroaro
Environmental Monitoring
Ecosystem Services
Te Aranga Cultural
Monitoring
He Kāpehu
A values compass
Integrating Maori values into Policy
• Positive working relationships
• Capability development
• Mātauranga Māori is context specific
• Achieves joint aspirations/outcomes
• What is the role of property rights?
Integrating Maori values into Policy
• Recommend starting at a high level
– Outcomes
– Goals/objectives
– Monitoring
– Indicators
• Values inform all aspects of policy
Integrating Maori values into Policy
• Outcome: A marae can provide traditional kai – tuna, for manuhiri(manaakitanga)
• Goals/Objectives – Access to mahinga kai
– Min Mean flow
– Water quality
• Monitoring – CHI
– Atua Domains
HE TAUIRA NO NGĀI TAHU A NGĀI TAHU EXAMPLE
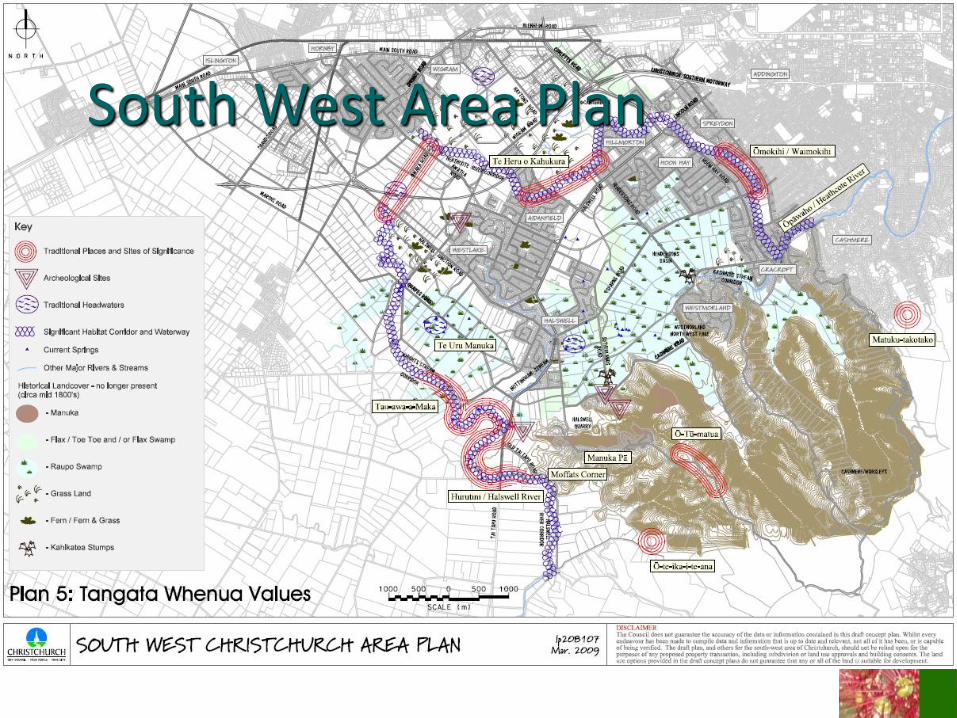
South West Area Plan South West Area Plan
South West Area Plan
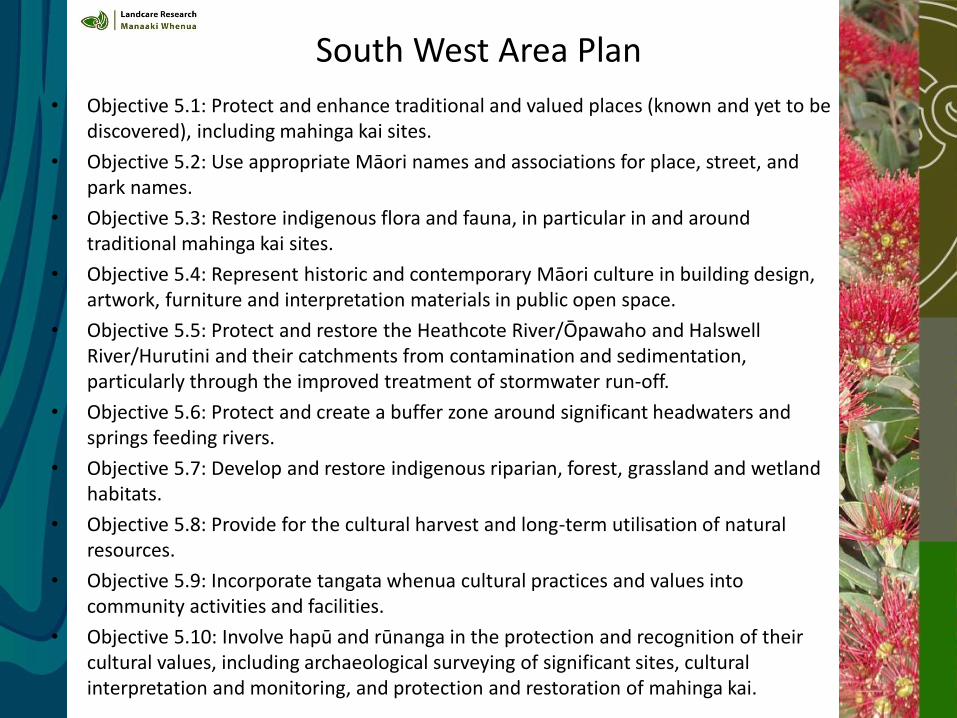
• Objective 5.1: Protect and enhance traditional and valued places (known and yet to be discovered), including mahinga kai sites.
• Objective 5.2: Use appropriate Māori names and associations for place, street, and park names.
• Objective 5.3: Restore indigenous flora and fauna, in particular in and around traditional mahinga kai sites.
• Objective 5.4: Represent historic and contemporary Māori culture in building design, artwork, furniture and interpretation materials in public open space.
• Objective 5.5: Protect and restore the Heathcote River/Ōpawaho and Halswell River/Hurutini and their catchments from contamination and sedimentation, particularly through the improved treatment of stormwater run-off.
• Objective 5.6: Protect and create a buffer zone around significant headwaters and springs feeding rivers.
• Objective 5.7: Develop and restore indigenous riparian, forest, grassland and wetland habitats.
• Objective 5.8: Provide for the cultural harvest and long-term utilisation of natural resources.
• Objective 5.9: Incorporate tangata whenua cultural practices and values into community activities and facilities.
• Objective 5.10: Involve hapū and rūnanga in the protection and recognition of their cultural values, including archaeological surveying of significant sites, cultural interpretation and monitoring, and protection and restoration of mahinga kai.
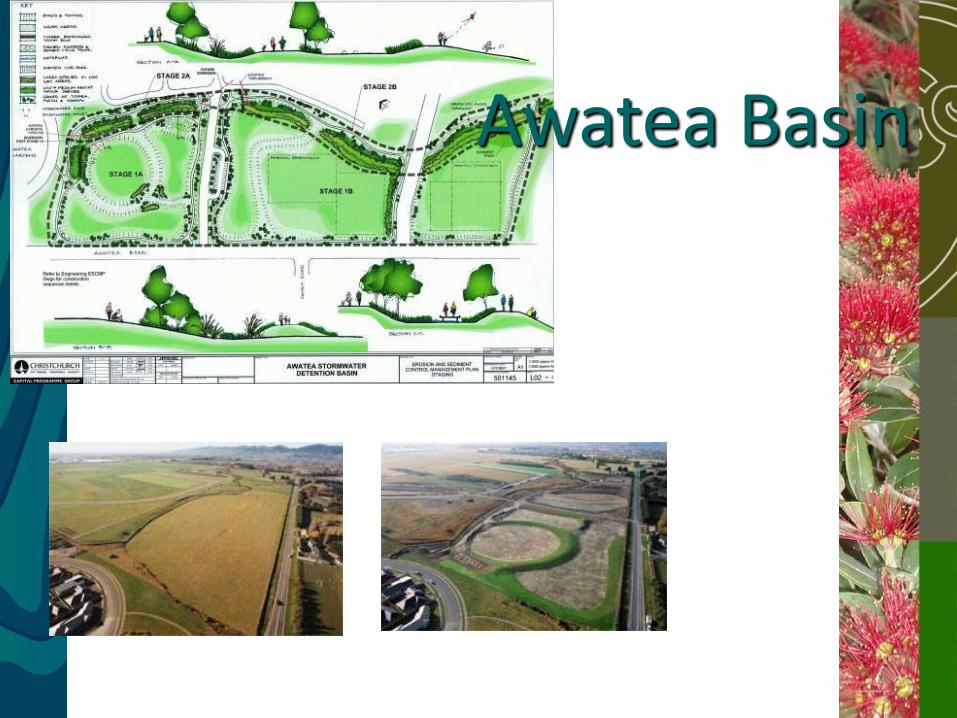
Awatea Basin
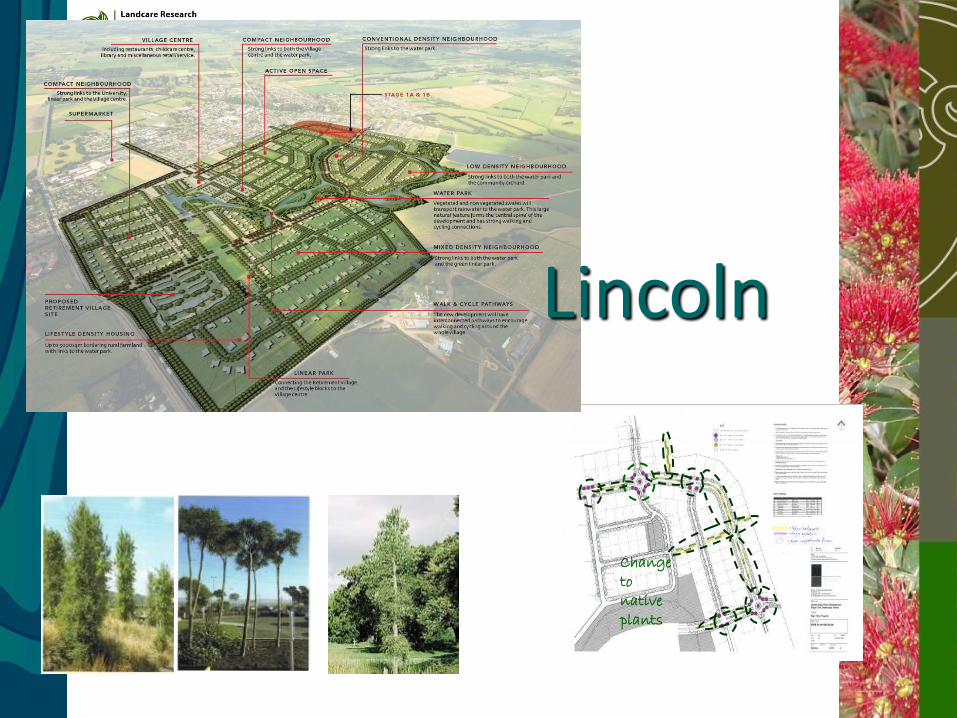
Change to native plants
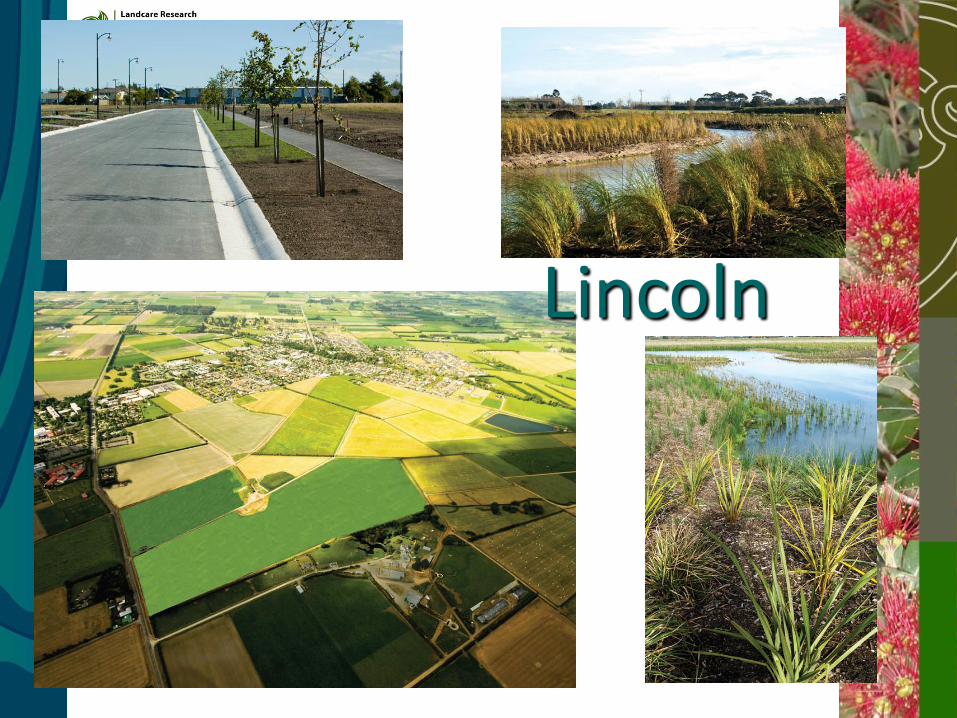
Lincoln
Lincoln
HE TAUIRA ANŌ ANOTHER EXAMPLE
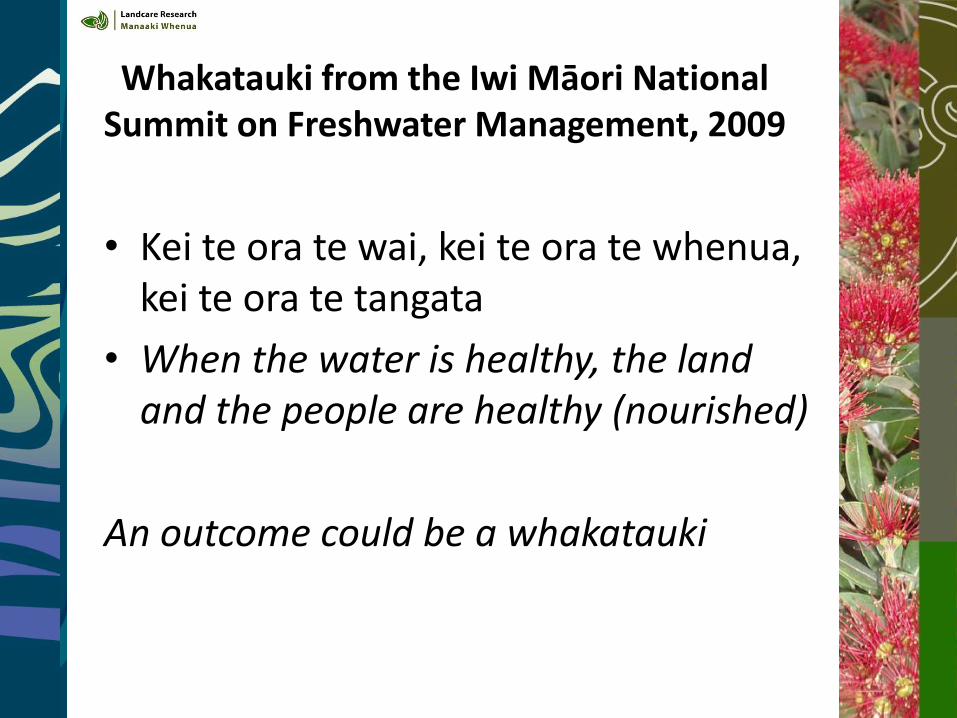
Whakatauki from the Iwi Māori National
Summit on Freshwater Management, 2009
• Kei te ora te wai, kei te ora te whenua, kei te ora te tangata
• When the water is healthy, the land and the people are healthy (nourished)
An outcome could be a whakatauki
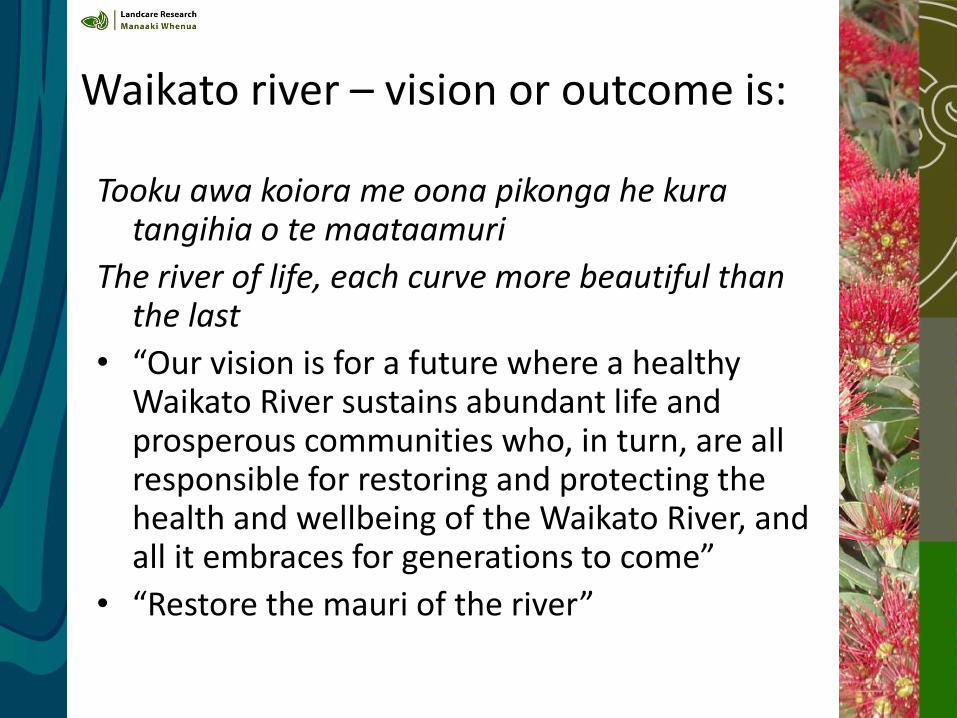
Waikato river – vision or outcome is:
Tooku awa koiora me oona pikonga he kura
tangihia o te maataamuri
The river of life, each curve more beautiful than the last
• “Our vision is for a future where a healthy Waikato River sustains abundant life and prosperous communities who, in turn, are all responsible for restoring and protecting the health and wellbeing of the Waikato River, and all it embraces for generations to come”
• “Restore the mauri of the river”
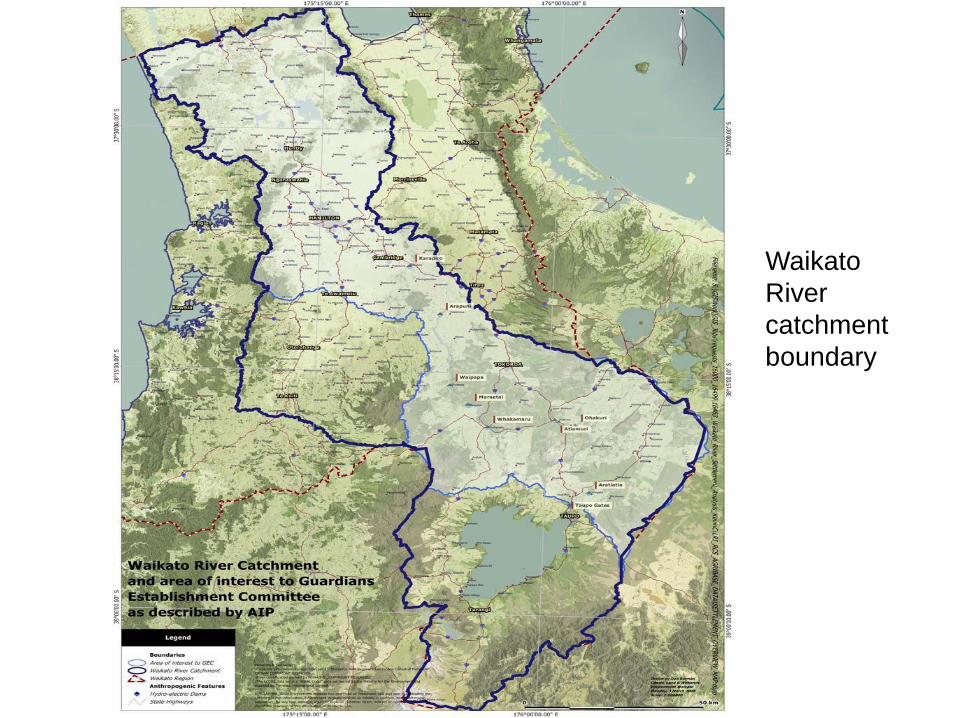
Waikato
River
catchment
boundary
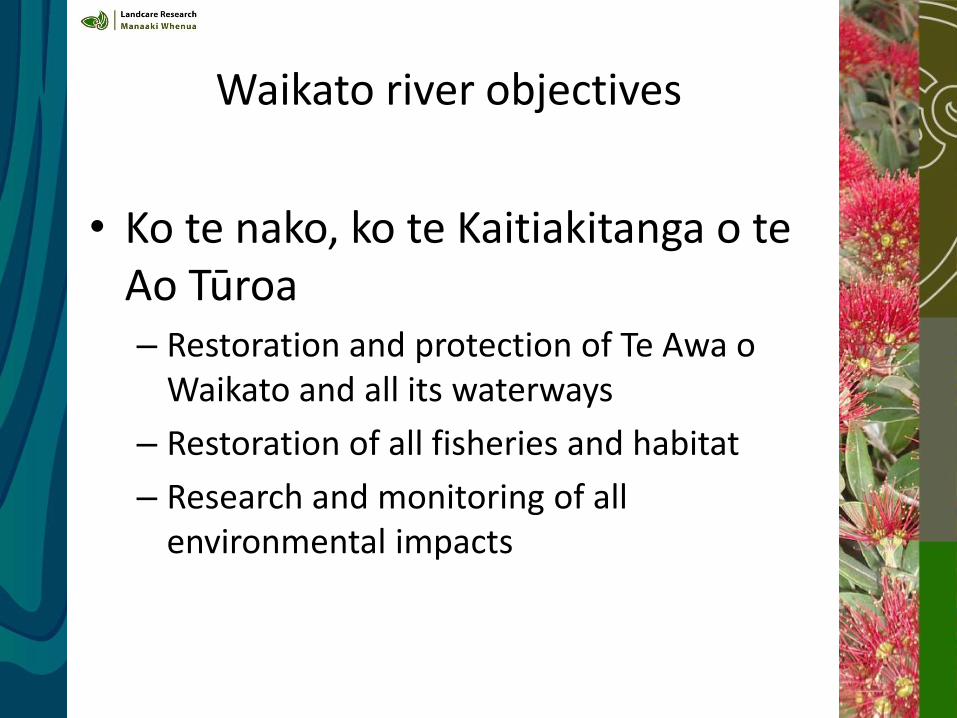
Waikato river objectives
• Ko te nako, ko te Kaitiakitanga o te Ao Tūroa – Restoration and protection of Te Awa o
Waikato and all its waterways
– Restoration of all fisheries and habitat
– Research and monitoring of all environmental impacts
NGĀ INENGA MONITORING TOOLS
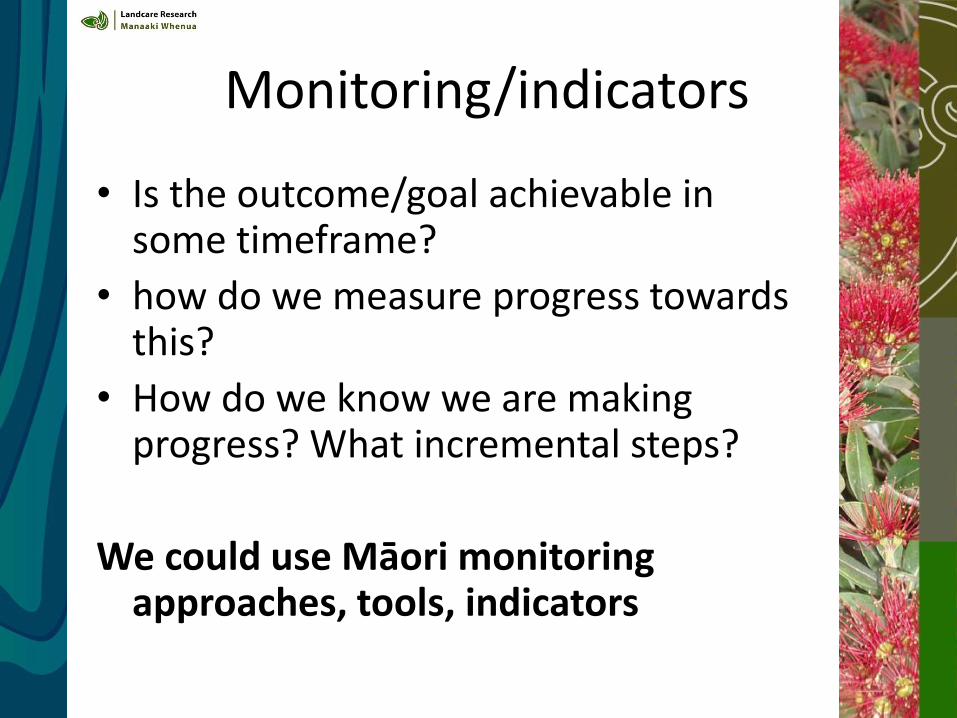
Monitoring/indicators
• Is the outcome/goal achievable in some timeframe?
• how do we measure progress towards this?
• How do we know we are making progress? What incremental steps?
We could use Māori monitoring approaches, tools, indicators
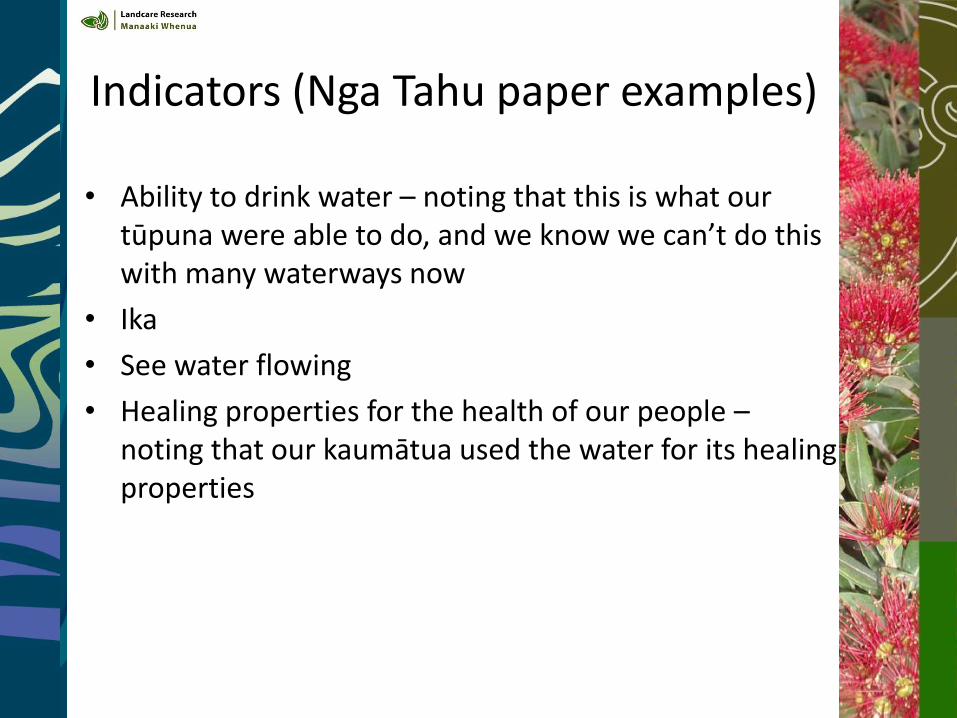
Indicators (Nga Tahu paper examples)
• Ability to drink water – noting that this is what our tūpuna were able to do, and we know we can’t do this with many waterways now
• Ika
• See water flowing
• Healing properties for the health of our people – noting that our kaumātua used the water for its healing properties
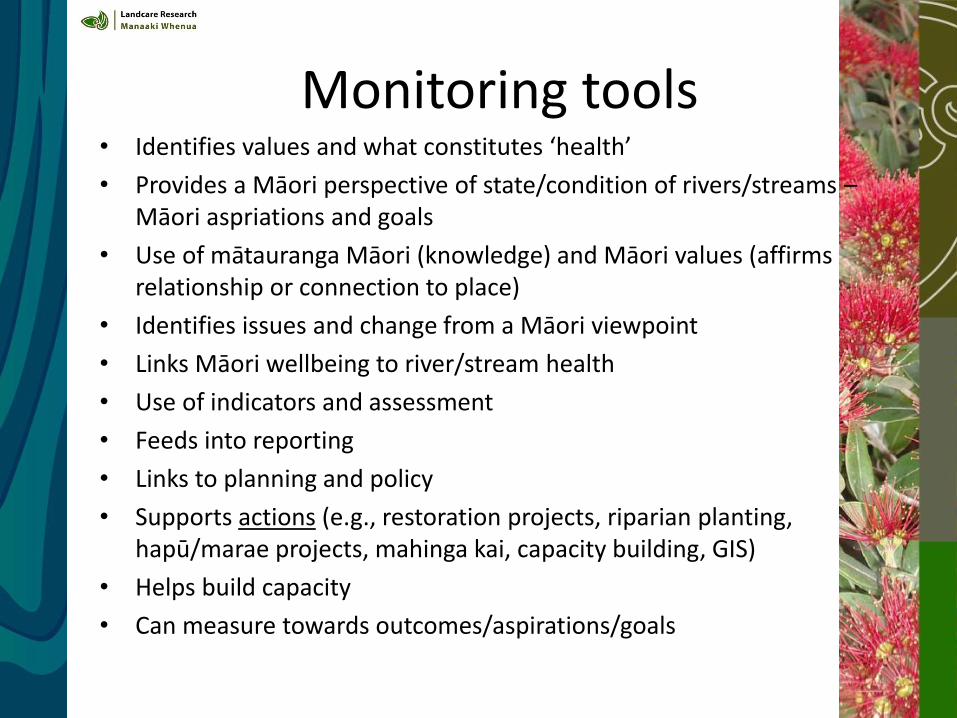
Monitoring tools • Identifies values and what constitutes ‘health’
• Provides a Māori perspective of state/condition of rivers/streams – Māori aspriations and goals
• Use of mātauranga Māori (knowledge) and Māori values (affirms relationship or connection to place)
• Identifies issues and change from a Māori viewpoint
• Links Māori wellbeing to river/stream health
• Use of indicators and assessment
• Feeds into reporting
• Links to planning and policy
• Supports actions (e.g., restoration projects, riparian planting, hapū/marae projects, mahinga kai, capacity building, GIS)
• Helps build capacity
• Can measure towards outcomes/aspirations/goals
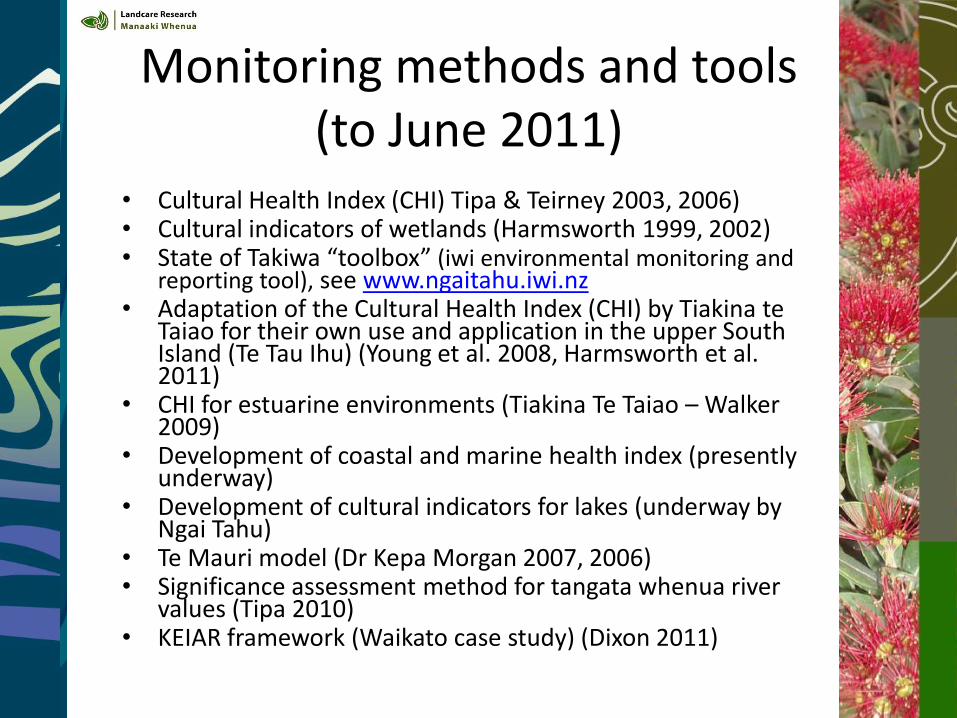
Monitoring methods and tools (to June 2011)
• Cultural Health Index (CHI) Tipa & Teirney 2003, 2006) • Cultural indicators of wetlands (Harmsworth 1999, 2002) • State of Takiwa “toolbox” (iwi environmental monitoring and
reporting tool), see www.ngaitahu.iwi.nz • Adaptation of the Cultural Health Index (CHI) by Tiakina te
Taiao for their own use and application in the upper South Island (Te Tau Ihu) (Young et al. 2008, Harmsworth et al. 2011)
• CHI for estuarine environments (Tiakina Te Taiao – Walker 2009)
• Development of coastal and marine health index (presently underway)
• Development of cultural indicators for lakes (underway by Ngai Tahu)
• Te Mauri model (Dr Kepa Morgan 2007, 2006) • Significance assessment method for tangata whenua river
values (Tipa 2010) • KEIAR framework (Waikato case study) (Dixon 2011)
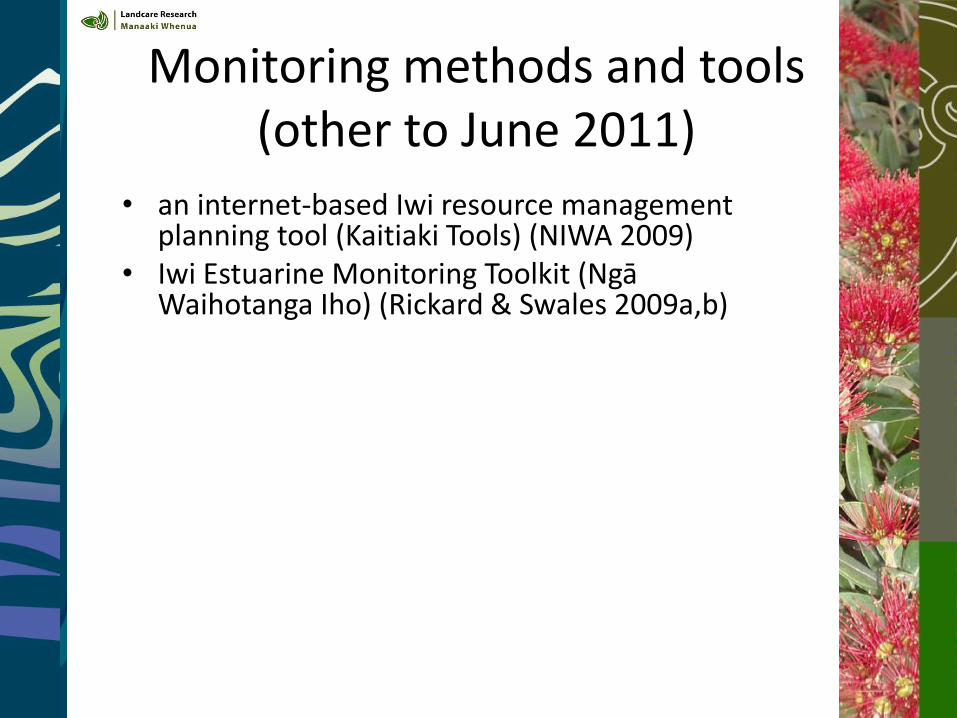
Monitoring methods and tools (other to June 2011)
• an internet-based Iwi resource management planning tool (Kaitiaki Tools) (NIWA 2009)
• Iwi Estuarine Monitoring Toolkit (Ngā Waihotanga Iho) (Rickard & Swales 2009a,b)
Māori knowledge or culturally based Community–scientific
based
Professionally based –
including scientific or technical assessments
Cultural values mapping
Cultural impact assessment
Iwi monitoring of cultural-heritage sites
Iwi monitoring of contaminated sites
Cultural health index (CHI)
Māori wetland, ngahere and estuarine indicators
Culturally based environmental indicators
Require in-depth Māori knowledge and understanding of
particular environments and issues
Understanding of Māori values, goals, and aspirations.
Examples:
Māori values
Cultural sites, Mahinga kai, pa, kainga
Cultural history
Taonga lists
Te Mauri
Knowledge on uses and preparation of taonga
Land management, development issues
Cultural information systems,
Could include culturally based assessments for river and
stream water quality
Coastal survey and monitoring of marine environs.
SHMAK
Waterway Self Assessment
Form
Community based
environmental performance
indicators
Amateur surveys
Require moderate levels of
technical input and skill but
scientifically robust and part-
value based. Cost effective,
relatively simple and short
duration.
Examples:
Stream and river condition
and health
Community based
indicators
Community values
Community coastal surveys
Non technical assessments
School monitoring
programmes
River and stream water quality monitoring
methods
Coastal survey and monitoring
Archaeological survey
Scientific environmental indicators
Laboratory analysis
Require higher levels of technical input and
skill, robust sampling strategies, analysis and
interpretation, expensive. May be time-
consuming.
Examples:
Chemistry, water quality, nutrients
Hydrology
Water table modeling
Botanical mapping, classification of plants
pH
Bacterial counts, pathogens
Giardia, Cryptosporidium
applications
Satellite imagery
Studies of fish, macro-invertebrates,
macrophytes.
Archaeological survey
Complementary assessment/monitoring approaches (adapted from
Harmsworth 2002)
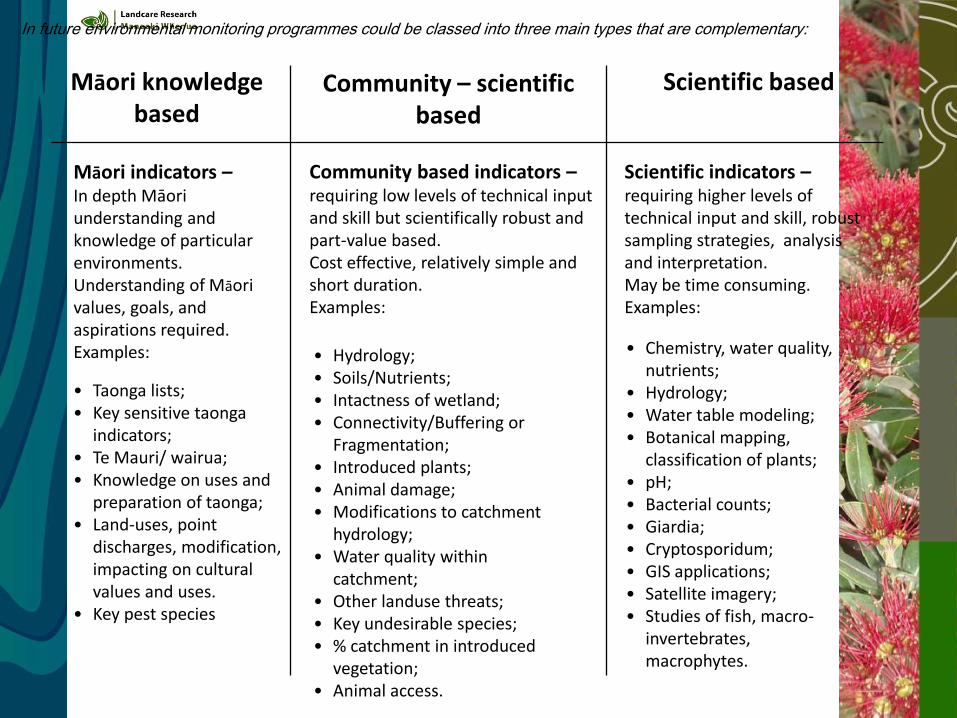
Māori knowledge based
Community – scientific based
Scientific based
Māori indicators – In depth Māori understanding and knowledge of particular environments. Understanding of Māori values, goals, and aspirations required. Examples:
Community based indicators – requiring low levels of technical input and skill but scientifically robust and part-value based. Cost effective, relatively simple and short duration. Examples:
• Hydrology; • Soils/Nutrients; • Intactness of wetland; • Connectivity/Buffering or
Fragmentation; • Introduced plants; • Animal damage; • Modifications to catchment
hydrology; • Water quality within
catchment; • Other landuse threats; • Key undesirable species; • % catchment in introduced
vegetation; • Animal access.
Scientific indicators – requiring higher levels of technical input and skill, robust sampling strategies, analysis and interpretation. May be time consuming. Examples:
• Chemistry, water quality,
nutrients; • Hydrology; • Water table modeling; • Botanical mapping,
classification of plants; • pH; • Bacterial counts; • Giardia; • Cryptosporidum; • GIS applications; • Satellite imagery; • Studies of fish, macro-
invertebrates, macrophytes.
• Taonga lists; • Key sensitive taonga
indicators; • Te Mauri/ wairua; • Knowledge on uses and
preparation of taonga; • Land-uses, point
discharges, modification, impacting on cultural values and uses.
• Key pest species
In future environmental monitoring programmes could be classed into three main types that are complementary:
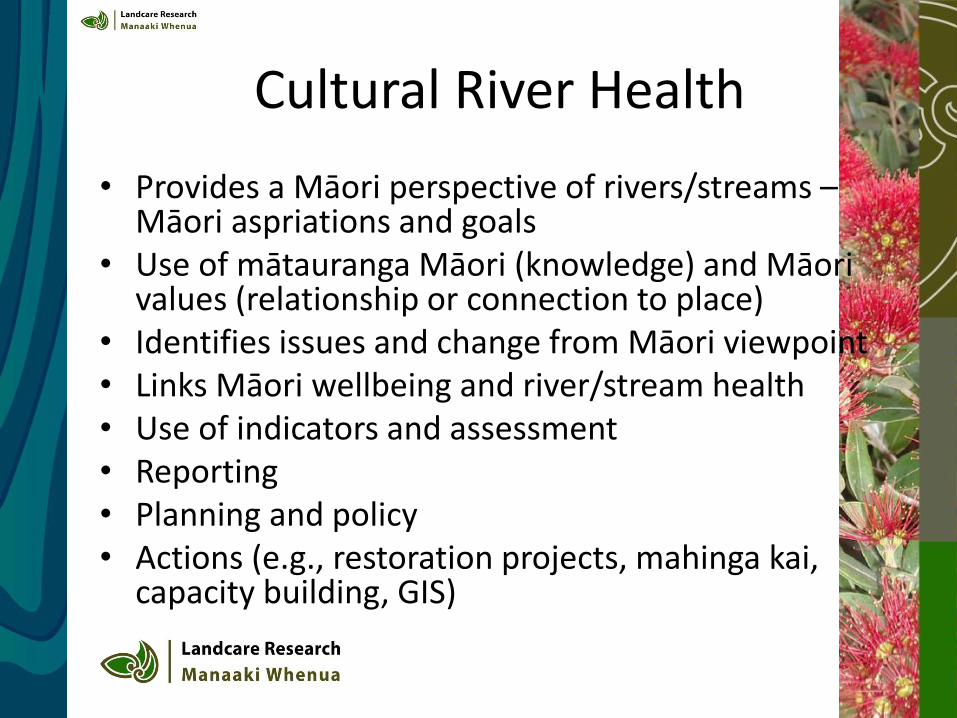
Cultural River Health
• Provides a Māori perspective of rivers/streams – Māori aspriations and goals
• Use of mātauranga Māori (knowledge) and Māori values (relationship or connection to place)
• Identifies issues and change from Māori viewpoint • Links Māori wellbeing and river/stream health • Use of indicators and assessment • Reporting • Planning and policy • Actions (e.g., restoration projects, mahinga kai,
capacity building, GIS)
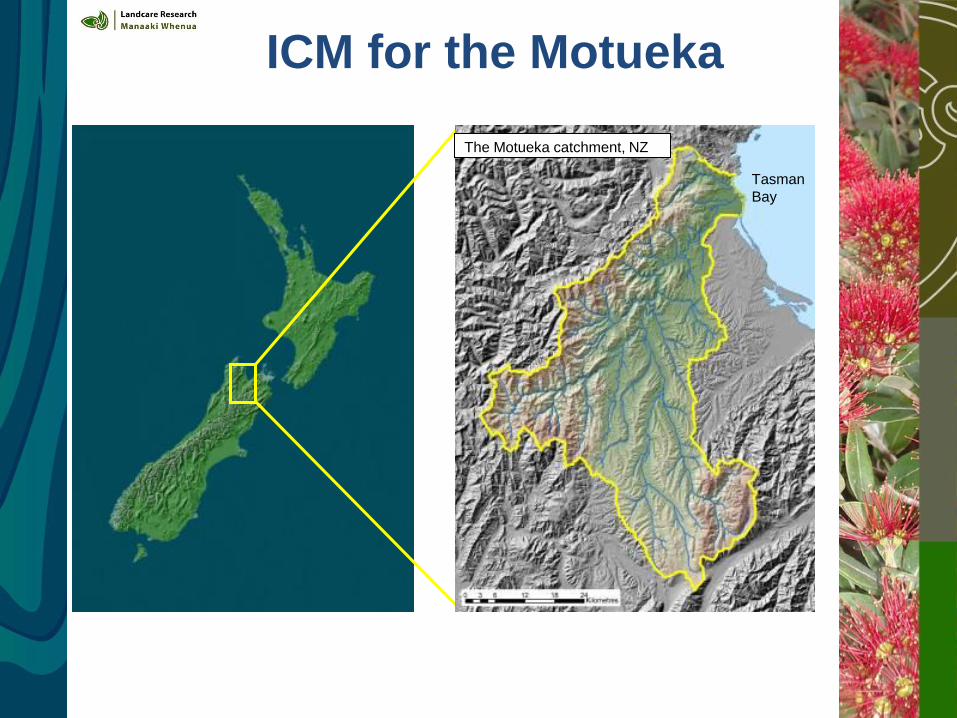
ICM for the Motueka
Tasman
Bay
The Motueka catchment, NZ
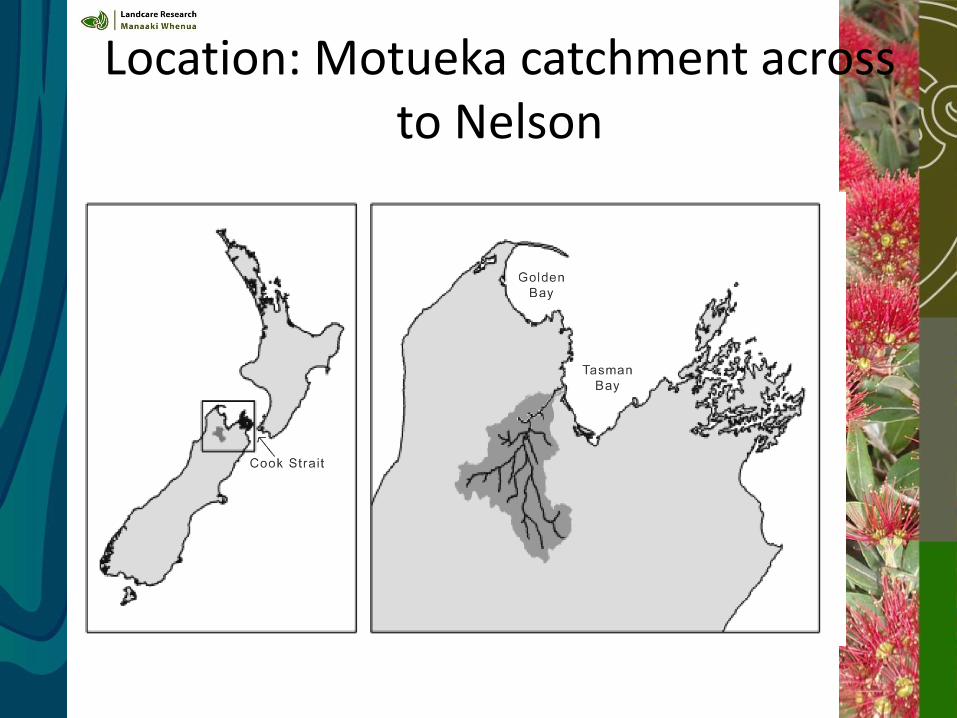
Location: Motueka catchment across to Nelson
Cultural monitoring in Motueka (2005 – 2010)
Cultural monitoring/reporting can: • Provide an indigenous knowledge/perspective on the
environment; • Articulate cultural values & aspirations; • Identify trends/change from a Maori perspective; • Be collated/aggregated to report on the iwi/hapū state of
the environment (from a cultural perspective); • Help contribute to responsibilities under kaitiakitanga,
whakapapa, tino rangatiratanga, etc; • Give responsibilities and importance of tangata whenua
engaged in Resource Management (RMA 1991); • Build iwi /hapū/whānau capacity in Resource
Management; • Feed into other SOE reporting (i.e. local, regional, national)
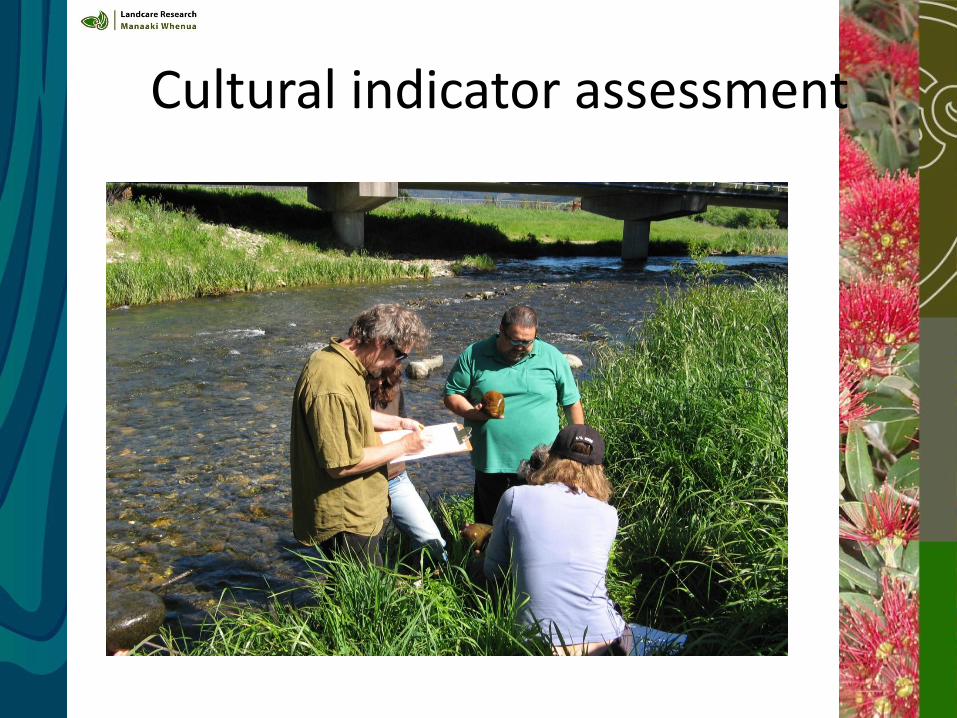
Cultural indicator assessment
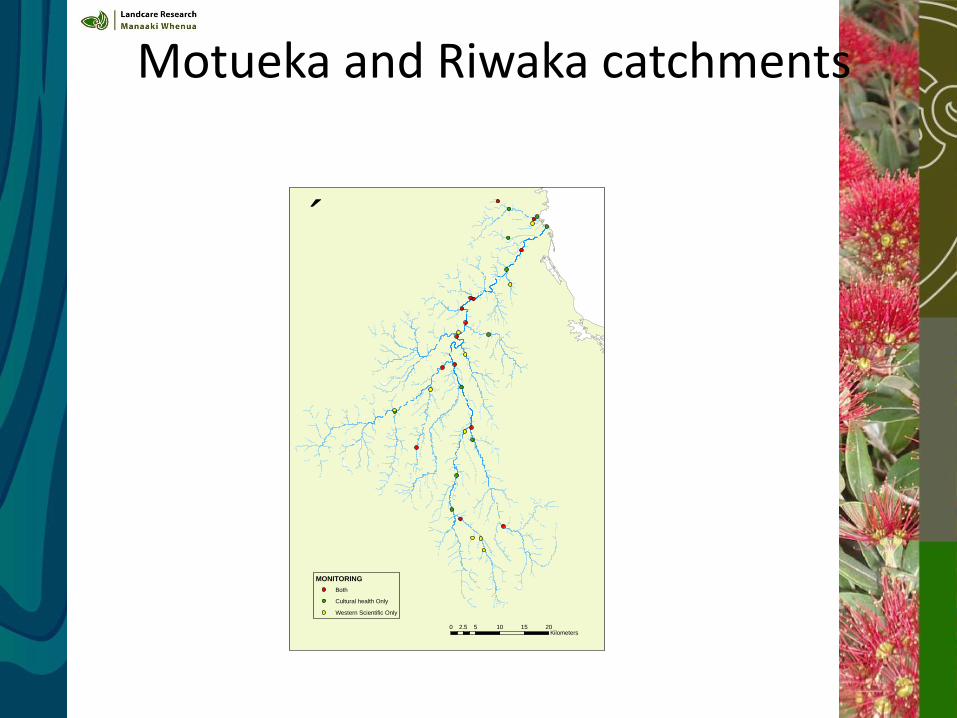
Motueka and Riwaka catchments
MONITORING
Both
Cultural health Only
Western Scientific Only
´
0 5 10 15 202.5Kilometers
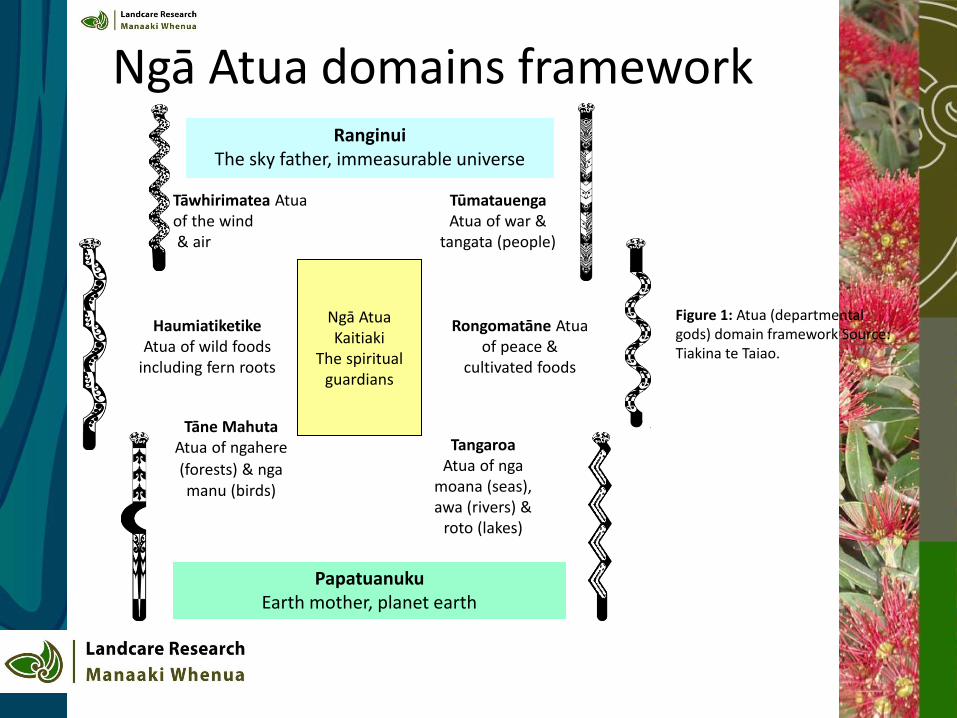
Tāne Mahuta Atua of ngahere
(forests) & nga manu (birds)
Tūmatauenga Atua of war &
tangata (people)
Tāwhirimatea Atua of the wind & air
Ranginui The sky father, immeasurable universe
Tangaroa Atua of nga
moana (seas), awa (rivers) &
roto (lakes)
Papatuanuku
Earth mother, planet earth
Haumiatiketike Atua of wild foods
including fern roots
Ngā Atua Kaitiaki
The spiritual guardians
Rongomatāne Atua of peace &
cultivated foods
Figure 1: Atua (departmental gods) domain framework Source: Tiakina te Taiao.
Ngā Atua domains framework
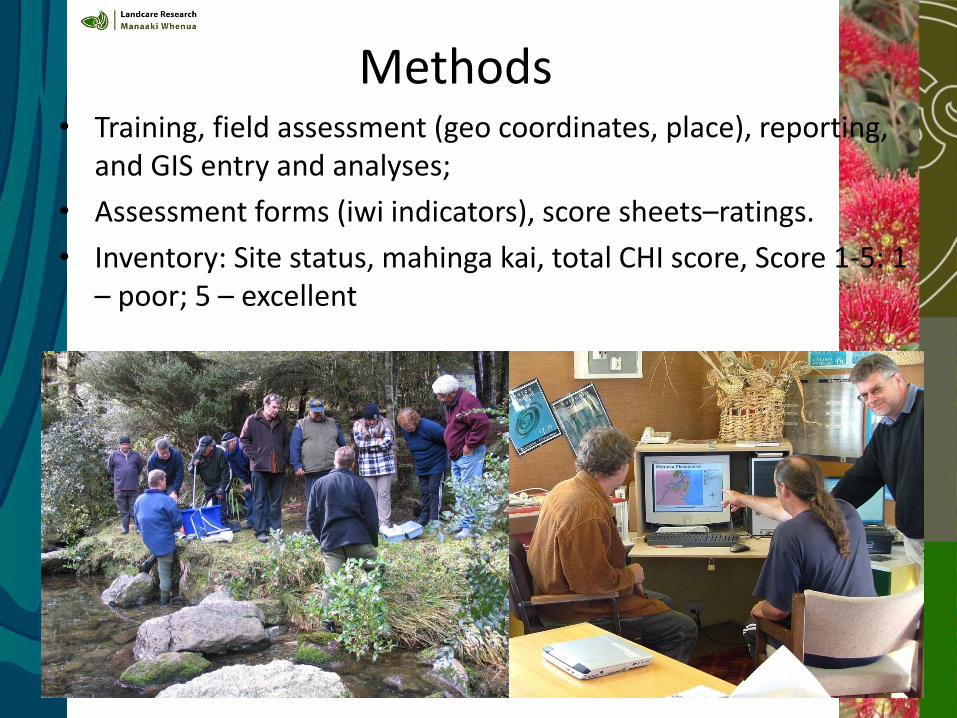
Methods • Training, field assessment (geo coordinates, place), reporting,
and GIS entry and analyses;
• Assessment forms (iwi indicators), score sheets–ratings.
• Inventory: Site status, mahinga kai, total CHI score, Score 1-5: 1 – poor; 5 – excellent
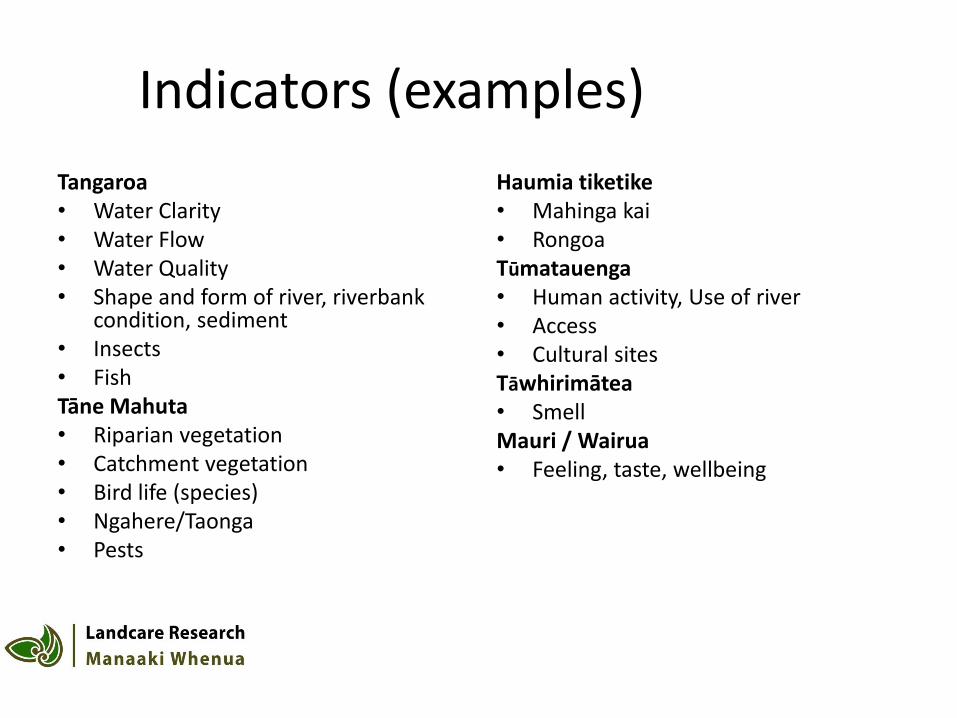
Indicators (examples)
Tangaroa • Water Clarity • Water Flow • Water Quality • Shape and form of river, riverbank
condition, sediment • Insects • Fish Tāne Mahuta • Riparian vegetation • Catchment vegetation • Bird life (species) • Ngahere/Taonga • Pests
Haumia tiketike • Mahinga kai • Rongoa Tūmatauenga • Human activity, Use of river • Access • Cultural sites Tāwhirimātea • Smell Mauri / Wairua • Feeling, taste, wellbeing
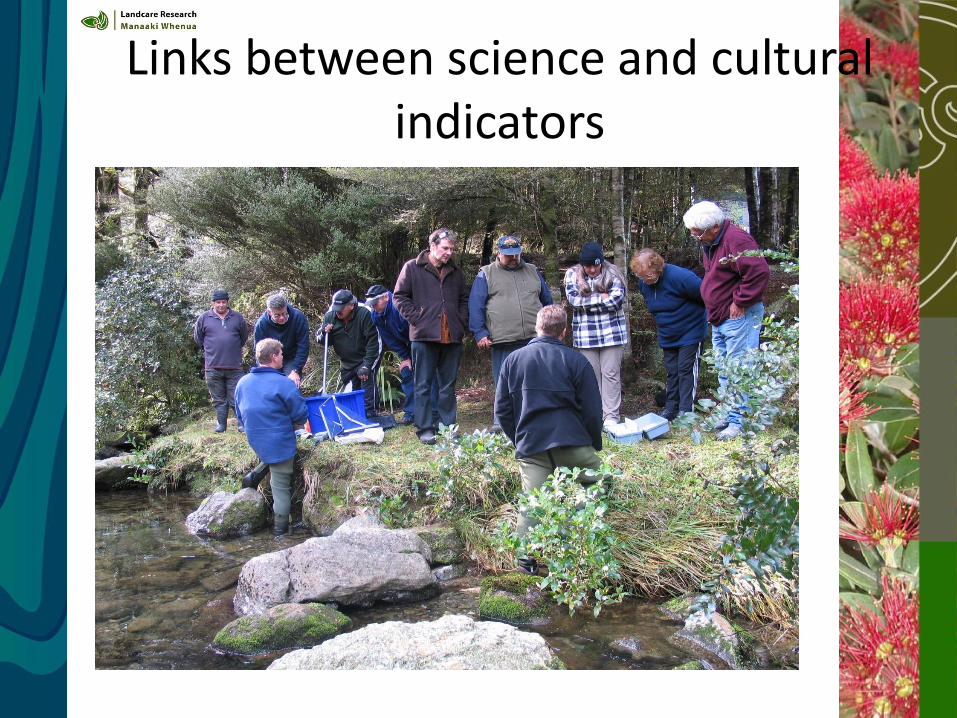
Links between science and cultural indicators
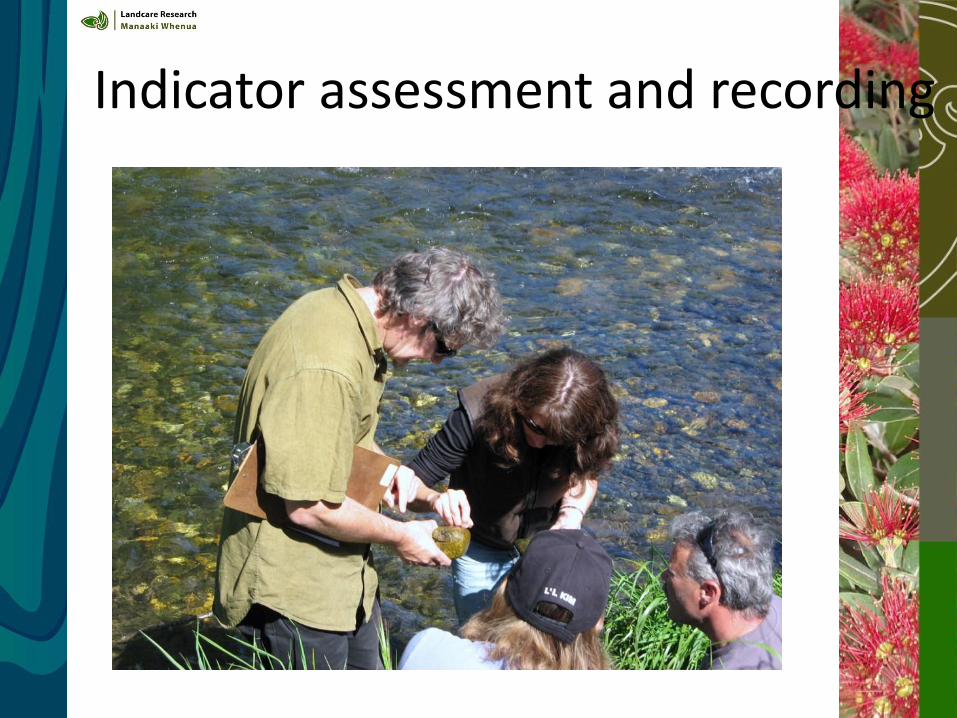
Indicator assessment and recording
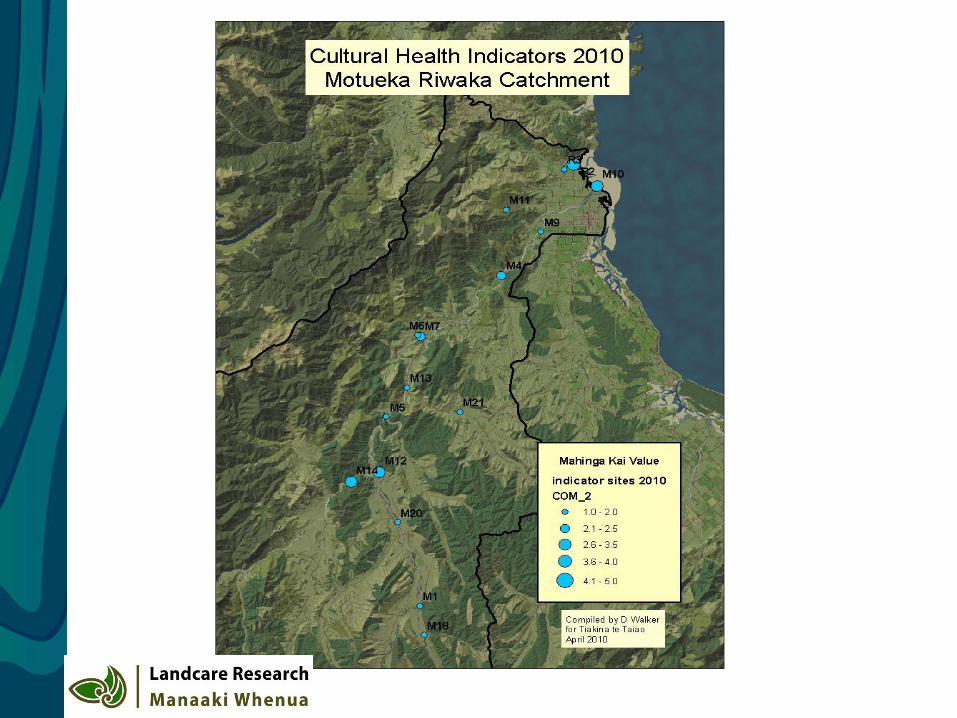
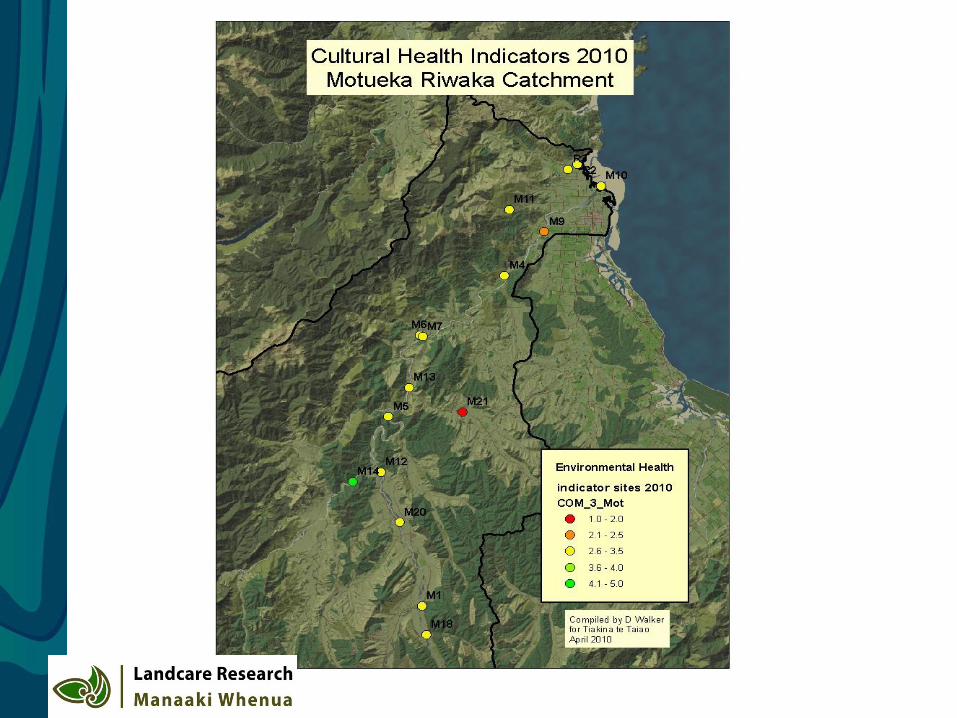
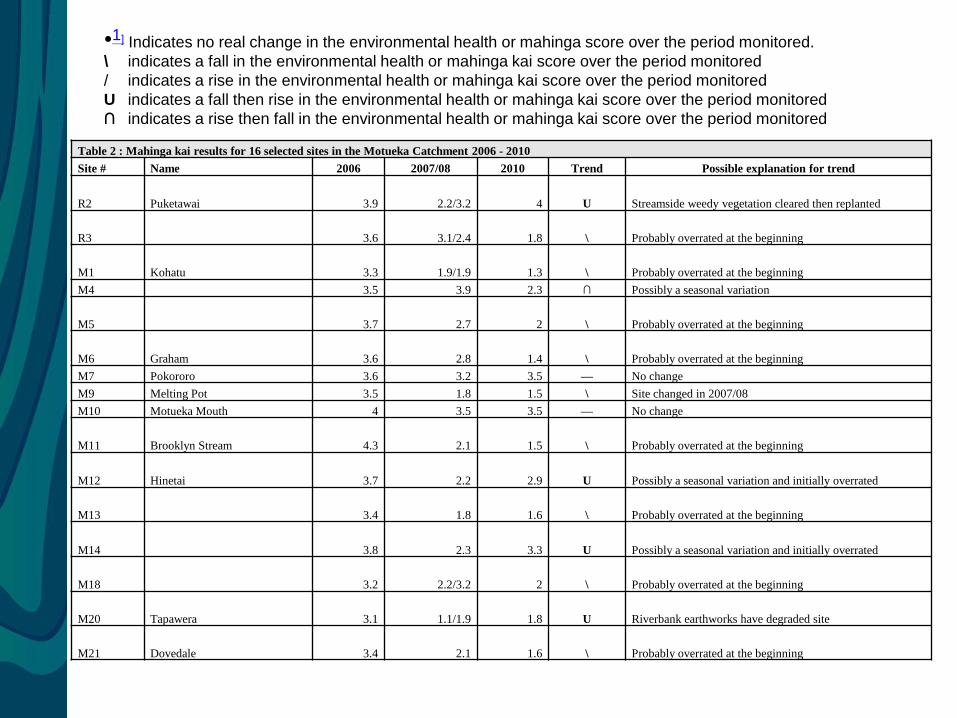
Table 2 : Mahinga kai results for 16 selected sites in the Motueka Catchment 2006 - 2010
Site # Name 2006 2007/08 2010 Trend Possible explanation for trend
R2 Puketawai 3.9 2.2/3.2 4 U Streamside weedy vegetation cleared then replanted
R3 3.6 3.1/2.4 1.8 \ Probably overrated at the beginning
M1 Kohatu 3.3 1.9/1.9 1.3 \ Probably overrated at the beginning
M4 3.5 3.9 2.3 ∩ Possibly a seasonal variation
M5 3.7 2.7 2 \ Probably overrated at the beginning
M6 Graham 3.6 2.8 1.4 \ Probably overrated at the beginning
M7 Pokororo 3.6 3.2 3.5 — No change
M9 Melting Pot 3.5 1.8 1.5 \ Site changed in 2007/08
M10 Motueka Mouth 4 3.5 3.5 — No change
M11 Brooklyn Stream 4.3 2.1 1.5 \ Probably overrated at the beginning
M12 Hinetai 3.7 2.2 2.9 U Possibly a seasonal variation and initially overrated
M13 3.4 1.8 1.6 \ Probably overrated at the beginning
M14 3.8 2.3 3.3 U Possibly a seasonal variation and initially overrated
M18 3.2 2.2/3.2 2 \ Probably overrated at the beginning
M20 Tapawera 3.1 1.1/1.9 1.8 U Riverbank earthworks have degraded site
M21 Dovedale 3.4 2.1 1.6 \ Probably overrated at the beginning
•1] Indicates no real change in the environmental health or mahinga score over the period monitored.
\ indicates a fall in the environmental health or mahinga kai score over the period monitored
/ indicates a rise in the environmental health or mahinga kai score over the period monitored
U indicates a fall then rise in the environmental health or mahinga kai score over the period monitored
∩ indicates a rise then fall in the environmental health or mahinga kai score over the period monitored
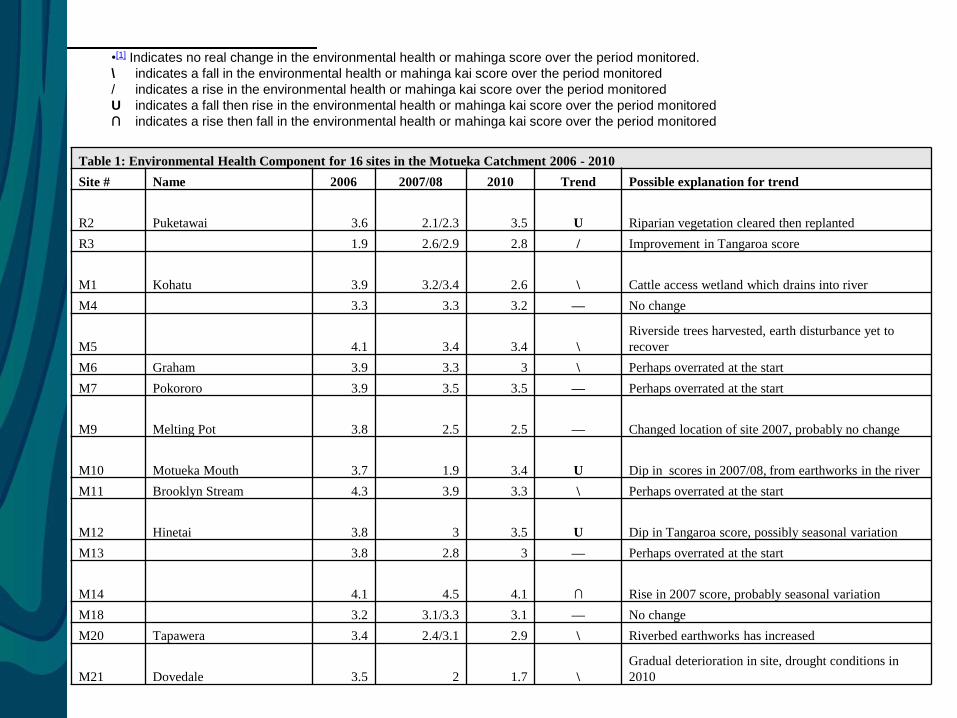
Table 1: Environmental Health Component for 16 sites in the Motueka Catchment 2006 - 2010
Site # Name 2006 2007/08 2010 Trend Possible explanation for trend
R2 Puketawai 3.6 2.1/2.3 3.5 U Riparian vegetation cleared then replanted
R3 1.9 2.6/2.9 2.8 / Improvement in Tangaroa score
M1 Kohatu 3.9 3.2/3.4 2.6 \ Cattle access wetland which drains into river
M4 3.3 3.3 3.2 — No change
M5 4.1 3.4 3.4 \
Riverside trees harvested, earth disturbance yet to
recover
M6 Graham 3.9 3.3 3 \ Perhaps overrated at the start
M7 Pokororo 3.9 3.5 3.5 — Perhaps overrated at the start
M9 Melting Pot 3.8 2.5 2.5 — Changed location of site 2007, probably no change
M10 Motueka Mouth 3.7 1.9 3.4 U Dip in scores in 2007/08, from earthworks in the river
M11 Brooklyn Stream 4.3 3.9 3.3 \ Perhaps overrated at the start
M12 Hinetai 3.8 3 3.5 U Dip in Tangaroa score, possibly seasonal variation
M13 3.8 2.8 3 — Perhaps overrated at the start
M14 4.1 4.5 4.1 ∩ Rise in 2007 score, probably seasonal variation
M18 3.2 3.1/3.3 3.1 — No change
M20 Tapawera 3.4 2.4/3.1 2.9 \ Riverbed earthworks has increased
M21 Dovedale 3.5 2 1.7 \
Gradual deterioration in site, drought conditions in
2010
•[1] Indicates no real change in the environmental health or mahinga score over the period monitored.
\ indicates a fall in the environmental health or mahinga kai score over the period monitored
/ indicates a rise in the environmental health or mahinga kai score over the period monitored
U indicates a fall then rise in the environmental health or mahinga kai score over the period monitored
∩ indicates a rise then fall in the environmental health or mahinga kai score over the period monitored
Key References
• http://www.waitangi-tribunal.govt.nz/doclibrary/public/reports/generic/Wai2358/Wai2358W.pdf
• Ministry for the Environment (MfE) 2003. Sustainable Water Programme of Action. Ministry for the Environment http://www.mfe.govt.nz/issues/water/prog-action/index.html
• Ministry for the Environment (MfE) 2005. Wai Ora: Report of the Sustainable Water Programme of Action Consultation Hui. Ministry for the Environment. http://www.mfe.govt.nz/publications/water/wpoa-hui-report-jul05/html/index.html
• Sharples P. 2009. Opening address Iwi Māori National Summit on Freshwater Management. 10 December 2009. Accessed Nov 2010-April 2011. http://www.beehive.govt.nz/speech/iwi+m%C4%81ori+national+summit+freshwater+management
• Ruru, J. 2009. The Legal Voice of Māori in Freshwater Governance: A Literature Review. Landcare Research report. ISBN 978-0-473-15854-5. 103p.
• Boffa Miskell Ltd. 2009. Exploration of Māori participation in Freshwater Management. Final Report (MfE)
• Land and Water Forum 2010. Report of Land and Water Forum A Fresh start for Freshwater. 53 high level recommendations.
• National Policy for Freshwater Management 2011. Summary of Board on Inquiry recommendations and Minister for the Environment’s Decision (2011)
• National Policy Statement for Freshwater Management (NPS) 2011
Emerging key areas to discuss (for policy) • Indigenous rights, Māori customary rights, property rights –
clarification of ownership (tino rangatiratanga, mana motuhake, whakamana) – land, waterways, coastal
• Management and use of freshwater (requires a robust management framework, new governance structures, co-management? (NPS – Involve iwi and hapū in the management of freshwater and freshwater ecosystems in the region,
participation in the management of freshwater)
• Kaitiakitanga and mana (environmental guardianship) – cultural protection and management of habitats, taonga, sites – e.g., Protection and enhancement of the freshwater environment, cultural sites, habitat and species sustainability, ecosystems, taonga, mahinga kai ...
• Actions on the ground: Collaborative projects (partnerships) e.g., Restoration projects, enhancing mahinga kai, kaimoana, use of cultural and environmental monitoring, indicators etc.
• Building capacity for iwi/hapū, and within Council
• Research, freshwater research, Māori led projects, recognition and use of mātauranga Māori
Iwi outcomes/aspirations • Ownership of water – Propriety rights, customary rights (Te Tiriti o Waitangi, tino
rangatiratanga, mana motuhake)
• Engagement processes/frameworks with iwi/hapū – meaningful relationships with councils
• Decision-making, management and use of water, management and use of cultural resources, achieving the right governance arrangements, co-management of freshwater incl. mahinga kai, kaimoana, māhinga mātaitai sites (standards, quality, condition) – Maintain areas (and access to) for customary practice and use
• Protecting/sustaining/enhancing habitats, ecosystems and species (e.g., taonga fish spp., tuna, shellfish, plants, birds, significant or iconic species etc.), mahinga kai
• Recognition and use of mātauranga Māori
• Water quality – Definitions around mauri (setting cultural standards, limits, thresholds, benchmarks) – in response to deteriorating water quality in NZ
• Water allocation (water quantity limits) – response to increasing competition for the allocation of rights to water