Embed Size (px)
Citation preview

MMaintenance
AAccountability
PProcess
Manual
MAPMAP
Washington State Department of Transportation Maintenance OperationJuly 2018
July 1999July 1999

8/27/2018 I
Table of Contents Map Manual
Page Chapter 1 - Introduction
Background 1-1 Performance Measures 1-1 MAP Today 1-2
Chapter 2 - Structure
Program M - Highway Maintenance & Operations 2-1 Subprograms - M1, M2, M5 2-1 Components and Groups 2-3
Chapter 3 – MAP Activity Descriptions and Work Operations MAP Activity General Notes 3-1
Group 1 - Roadway Maintenance & Operations 3-2 Group 2 - Drainage Maintenance & Slope Repairs 3-4 Group 3 - Roadside and Landscape Maintenance 3-5 Group 4 - Bridge & Tunnel Maintenance 3-7 Group 5 - Snow & Ice Control 3-9 Group 6 - Traffic Control Maintenance & Operations 3-10 Group 7 - Rest Area Operations 3-13 Group 8 - Support Operations 3-14 Group 9 - 3rd Party Damage Repairs & Emergency 3-14
Operation Numbers with Connection to MAP Activities Intro 3-15
Chapter 4 - Performance Measures Performance Measure Definition 4-1 Measuring Performance 4-2 Performance Measures 4-3
Group 1 - Roadway Maintenance & Operations 4-3 Group 2 - Drainage Maintenance & Slope Repairs 4-4 Group 3 - Roadside and Landscape Maintenance 4-7 Group 4 - Bridge & Tunnel Maintenance 4-9 Group 5 - Snow & Ice Control Operations 4-11 Group 6 - Traffic Control Maintenance & Operations 4-12 Group 7 - Rest Area Operations 4-16

8/27/2018 II
Group 8 - Support Operations 4-17 Group 9 - 3rd Party Damage Repairs & Group 9- Emergency Operations 4-18 Chapter 4 Appendix- 3A5 Landscape 4-19 Chapter 4 Appendix- 4A3 Bridge Cleaning 4-20
Chapter 5 - Service Level
Service Level Descriptions 5-1 Service Level Effectiveness Model 5-3 Service Level Examples
Group 1 - Roadway Maintenance & Operations 5-4 Group 2 - Drainage Maintenance & Slope Repairs 5-5 Group 3 - Roadside and Landscape Maintenance 5-6 Group 4 - Bridge & Tunnel Maintenance 5-7 Group 5 - Snow & Ice Control Operations 5-8 Group 6 - Traffic Control Maintenance & Operations 5-9 Group 7 - Rest Area Operations 5-10
Chapter 6 - Planning
Maintenance Activity Priorities 6-1
Priority Matrix 6-1 Data Collection and Reporting 6-1
Field Surveys 6-2 Quality Control/Quality Assurance 6-2 Data Input 6-3 Targets 6-4 Service Level Rating 6-5 Reporting 6-5
MAP Scores-2016 6-6 Inventories/Databases 6-7
Data Sources 6-7 MAP Team 6-8
Introduction Chapter 1
1-2
MAP Background
In 1996 the Washington State Department of Transportation embarked on an initiative to develop and employ outcome based performance measures for evaluating the effectiveness of the Maintenance Program. The Maintenance Accountability Process, or MAP as it has become known, is a comprehensive planning, measuring, and managing process that provides a means for communicating to key customers the impacts of policy and budget decisions on program service delivery.
Performance Measures
Performance measures provide the tools to link strategic planning, the budget, and maintenance service delivery. It essentially provides the means for evaluating the effectiveness of the program, and program accountability.
Asset Condition: This type of performance measure relies on the condition of highway assets as an indicator on how well the maintenance program is being delivered. Since WSDOT’s Preservation and Improvement Programs also wield significant bearing on the condition of highway assets, the Maintenance Program is only partially responsible for the results of this performance measure. This measure is made up of a condition indicator, (deficiency or condition to be measured), outcome measure, (unit of measure), and thresholds for the five service levels for each MAP activity. A threshold is the range of allowable deficiencies or conditions for each service level. Operational Assessment deals with the operational side, such as how many repairs per signal were needed in a given period of time. Condition Assessment data is collected using randomly chosen sites for Field Surveys. These surveys are based on random sampling procedures.
Task Completion: This type of performance measure focuses on the amount of work that is completed in a defined, optimal maintenance program. This can be viewed similarly to keeping up with the oil changes, tire rotations, and other maintenance tasks to keep one’s car in good condition per the maintenance schedule in the owner’s manual. The amount of work completed is simply measured and reported as the percent of required maintenance completed in a given timeframe. At the time of this printing, not all maintenance activities have been quantified. Reporting using the Task Completion component began in 2010, with 8 MAP activities. Task completion reporting has grown to 18 activities as of 2015.
MAP Priorities
One of the key MAP tools is the MAP Priority Matrix. The Matrix prioritizes maintenance activities by identifying how critical each activity is in helping the Maintenance Program achieve broad, policy objectives, which are consistent with the WSDOT Strategic Plan. This document is periodically reviewed and updated to ensure the reflection of current agency direction.
MAP Today
MAP is transitioning as WSDOT moves forward with the emphasis of moving to department wide asset management plans, with different MAP activities becoming part of

Introduction Chapter 1
1-2
the department wide integrated system, to include not only maintenance but design and construction as well.
Maintenance is increasing the emphasis on task completion in the way we communicate. With this transition, the importance of having a complete inventory for assets will assist the department in developing Highway Asset Management Plans, as we have with pavements and bridges.
As referenced above, Pavements and Bridges have become more integrated across the agency in terms of how asset condition is assessed and reported. This includes the following three MAP activities:
1A1 Pavement is now part of an integrated approach using WSPMS condition rating, which reflects the outcomes of maintenance and preservation work completed and/or needed. The condition of pavements is reported as the percentage of pavements in fair or better condition.
4A1 Bridge Deck Repair and 4A2 Structural Bridge Repair are now part of an integrated approach using bridge condition inspection ratings which reflect the outcomes of maintenance and preservation work completed and/or needed. The condition of bridges is reported as the percentage of bridges in fair or better condition.
In 2015 WSDOT Maintenance made the decision to move from asset condition level of service reports that are statistically valid at the region level, to level of service reports that are statistically valid only at the statewide level. This applies only to the 13 MAP activities for which the asset condition level of service is determined by the annual MAP field survey. This decision ties in with the emphasis of developing the department wide integrated asset management system as described above and task completion. This move to statewide reporting relies on the utilization of the various maintenance management systems, such as HATS (Highway Activity Tracking System) and the iPad launch for the use of data collection and record keeping.
The move to statewide reporting means less MAP Field surveys. The numbers of surveys will be approximately 400 sites, utilizing highway features out of HATS as the basis of the site locations. These sites are based on a randomized GIS query.
MAP activity 4A3, bridge cleaning is based on a field survey from the MAP surveyors. The bridge condition survey includes the bridge, deck, sidewalk, bridge drains and graffiti condition rating.
The sites are generated thru a Random Site Generator used thru a GIS analysis process with HATS features integrated into the system for assisting in generating the MAP field site surveys as well as the bridge inventory from BPO to get the number of bridge cleaning surveys.
There are currently 36 MAP activities that are tracked through the budget and MAP assessments. Out of the 36 different MAP activities, 27 of these activities are tracked with set service level targets and service levels delivered.
MAP Manual 2-1 August 2018
Structure Chapter 2 Program M - Highway Maintenance and Operations
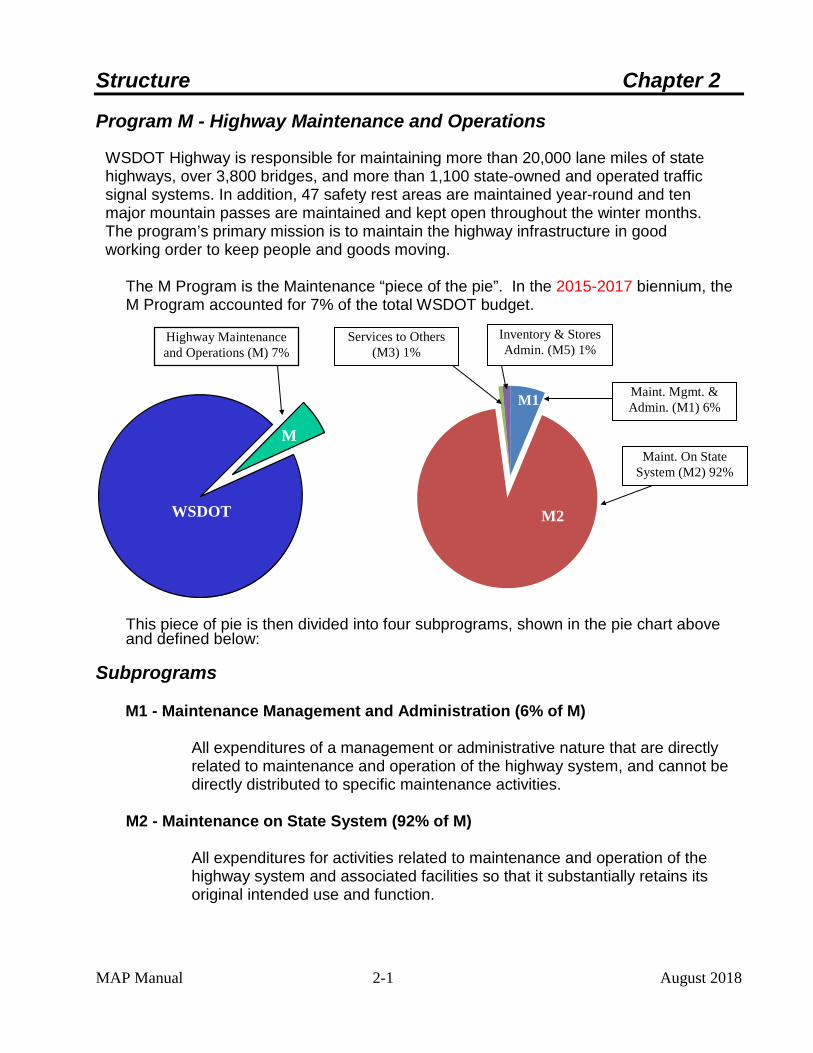
WSDOT Highway is responsible for maintaining more than 20,000 lane miles of state highways, over 3,800 bridges, and more than 1,100 state-owned and operated traffic signal systems. In addition, 47 safety rest areas are maintained year-round and ten major mountain passes are maintained and kept open throughout the winter months. The program’s primary mission is to maintain the highway infrastructure in good working order to keep people and goods moving.
The M Program is the Maintenance “piece of the pie”. In the 2015-2017 biennium, the M Program accounted for 7% of the total WSDOT budget.
This piece of pie is then divided into four subprograms, shown in the pie chart above and defined below:
Subprograms
M1 - Maintenance Management and Administration (6% of M)
All expenditures of a management or administrative nature that are directly related to maintenance and operation of the highway system, and cannot be directly distributed to specific maintenance activities.
M2 - Maintenance on State System (92% of M)
All expenditures for activities related to maintenance and operation of the highway system and associated facilities so that it substantially retains its original intended use and function.
Highway Maintenance and Operations (M) 7%
WSDOT
M
M2
Inventory & Stores Admin. (M5) 1%
Maint. Mgmt. & Admin. (M1) 6%
Services to Others (M3) 1%
M1
Maint. On State System (M2) 92%
Structure
MAP Manual Page 2 - 2 July 2018
M3 – Maintenance – Sales and Services to Others (1% of M)
Provides for reimbursable maintenance of streets and roads and other services rendered to cities, counties, and other local entities.
M5 - Inventory and Stores Administration (1% of M)
All expenditures for management and administration of necessary materials and supplies for maintenance and operations of the highway and associated facilities. This includes ordering, receiving, storing, issuing, and disposing of items such as: signs, stock piled sand and gravel, guardrail posts, traffic cones, and herbicides.
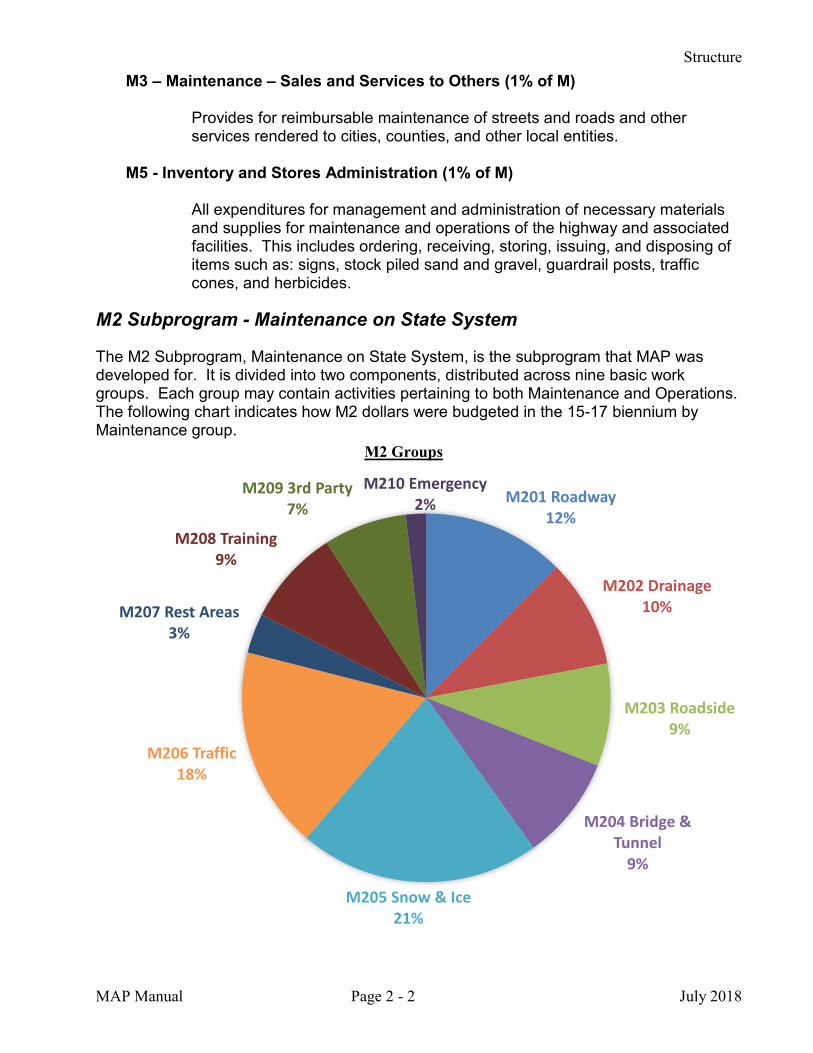
M2 Subprogram - Maintenance on State System
The M2 Subprogram, Maintenance on State System, is the subprogram that MAP was developed for. It is divided into two components, distributed across nine basic work groups. Each group may contain activities pertaining to both Maintenance and Operations.The following chart indicates how M2 dollars were budgeted in the 15-17 biennium by Maintenance group.
M201 Roadway 12%
M202 Drainage 10%
M203 Roadside 9%
M204 Bridge & Tunnel
9%
M205 Snow & Ice 21%
M206 Traffic 18%
M207 Rest Areas 3%
M208 Training 9%
M209 3rd Party 7%
M210 Emergency2%
M2 Groups
Structure
MAP Manual Page 2 - 3 July 2018
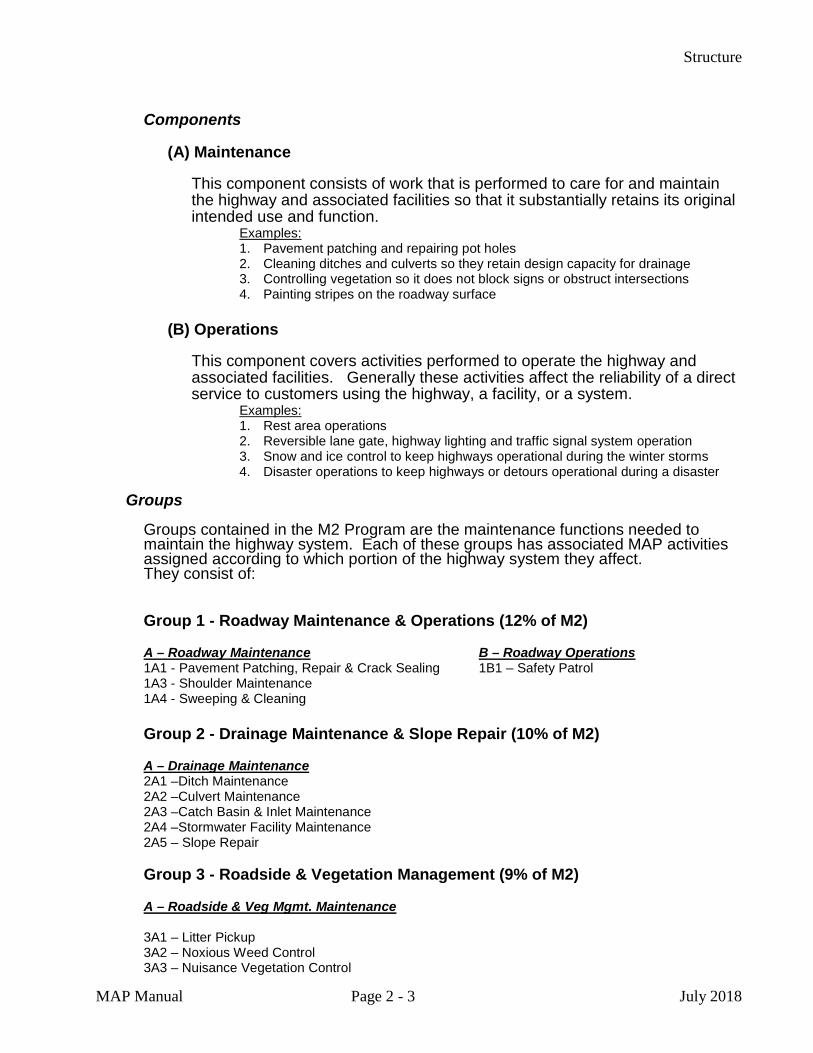
Components
(A) Maintenance This component consists of work that is performed to care for and maintain the highway and associated facilities so that it substantially retains its original intended use and function.
Examples: 1. Pavement patching and repairing pot holes 2. Cleaning ditches and culverts so they retain design capacity for drainage 3. Controlling vegetation so it does not block signs or obstruct intersections 4. Painting stripes on the roadway surface
(B) Operations
This component covers activities performed to operate the highway and associated facilities. Generally these activities affect the reliability of a direct service to customers using the highway, a facility, or a system.
Examples: 1. Rest area operations 2. Reversible lane gate, highway lighting and traffic signal system operation 3. Snow and ice control to keep highways operational during the winter storms 4. Disaster operations to keep highways or detours operational during a disaster
Groups
Groups contained in the M2 Program are the maintenance functions needed to maintain the highway system. Each of these groups has associated MAP activities assigned according to which portion of the highway system they affect. They consist of: Group 1 - Roadway Maintenance & Operations (12% of M2)
A – Roadway Maintenance B – Roadway Operations 1A1 - Pavement Patching, Repair & Crack Sealing 1B1 – Safety Patrol 1A3 - Shoulder Maintenance 1A4 - Sweeping & Cleaning
Group 2 - Drainage Maintenance & Slope Repair (10% of M2) A – Drainage Maintenance 2A1 –Ditch Maintenance 2A2 –Culvert Maintenance 2A3 –Catch Basin & Inlet Maintenance 2A4 –Stormwater Facility Maintenance 2A5 – Slope Repair Group 3 - Roadside & Vegetation Management (9% of M2) A – Roadside & Veg Mgmt. Maintenance 3A1 – Litter Pickup 3A2 – Noxious Weed Control 3A3 – Nuisance Vegetation Control
5 19%
Structure
MAP Manual Page 2 - 4 July 2018
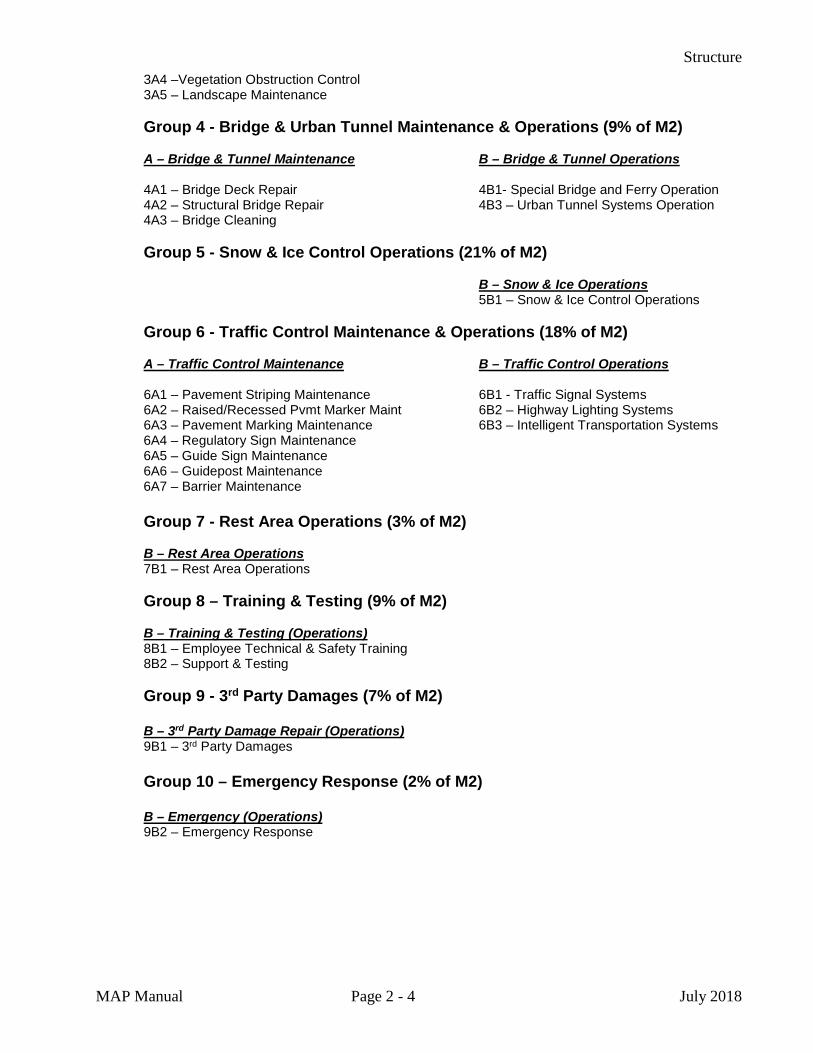
3A4 –Vegetation Obstruction Control 3A5 – Landscape Maintenance Group 4 - Bridge & Urban Tunnel Maintenance & Operations (9% of M2) A – Bridge & Tunnel Maintenance B – Bridge & Tunnel Operations 4A1 – Bridge Deck Repair 4B1- Special Bridge and Ferry Operation 4A2 – Structural Bridge Repair 4B3 – Urban Tunnel Systems Operation 4A3 – Bridge Cleaning Group 5 - Snow & Ice Control Operations (21% of M2) B – Snow & Ice Operations 5B1 – Snow & Ice Control Operations Group 6 - Traffic Control Maintenance & Operations (18% of M2) A – Traffic Control Maintenance B – Traffic Control Operations 6A1 – Pavement Striping Maintenance 6B1 - Traffic Signal Systems 6A2 – Raised/Recessed Pvmt Marker Maint 6B2 – Highway Lighting Systems 6A3 – Pavement Marking Maintenance 6B3 – Intelligent Transportation Systems 6A4 – Regulatory Sign Maintenance 6A5 – Guide Sign Maintenance 6A6 – Guidepost Maintenance 6A7 – Barrier Maintenance Group 7 - Rest Area Operations (3% of M2) B – Rest Area Operations 7B1 – Rest Area Operations Group 8 – Training & Testing (9% of M2) B – Training & Testing (Operations) 8B1 – Employee Technical & Safety Training 8B2 – Support & Testing Group 9 - 3rd Party Damages (7% of M2)
B – 3rd Party Damage Repair (Operations)
9B1 – 3rd Party Damages
Group 10 – Emergency Response (2% of M2) B – Emergency (Operations) 9B2 – Emergency Response
MAP Activity Descriptions and Work Operations Chapter 3
3-1
This chapter is all about the MAP activities and associated work operations. Each activity is defined and examples of tasks, crew size, equipment used, appropriate work operations and much more can be found here. MAP Activity numbers indicate which component and group they are a part of. The first character signifies the group, the second signifies the component and the third is simply the order of activities within a particular group. For instance, let’s look at 1A4, Sweeping and Cleaning Maintenance. The number 1 tells us this activity is in Group 1, Roadway Maintenance & Operations. The letter A informs us that this activity is considered part of the Maintenance component. Lastly, the number 4 indicates this was the fourth third item in Group 1(Crack Sealing was activity 1A2). General Notes: 1. The crew size and equipment identified for each activity is representative of what
would most commonly be used in each situation. Others may be selected, when in the judgment of trained maintenance personnel, it is determined that other methods are necessary for safe, cost effective, and expeditious execution of the activity.
2. The crew size for many maintenance activities can vary from 1 to 6 people
because additional traffic control may be needed to insure a safe work site. Many activities require one or more buffer trucks with a truck mounted attenuator and arrow boards. Highways that have high traffic volumes, are in urban locations, or have extensive curves with low visibility will require additional workers for traffic control purposes.

3-2
Group 1 - Roadway Maintenance & Operations
1A1 - Pavement Patching, Repair & Crack Sealing
Activities required to fix pavement deficiencies such as pot holes, alligator cracking, and rutting in order to extend the life of the pavement, both in the roadway lanes as well as the paved shoulders. Asphalt work on the shoulders in included under 1A1 starting with the beginning of 17_19 biennium. Work may include digging out old broken pavement, any unstable base material, and placing and compacting new, free draining, base material and asphalt mix with mechanized equipment or hand tools depending on the size of the patch. For large areas of deficient pavement, an asphalt distributor spraying hot liquid asphalt or emulsified asphalt on the distressed pavement area, and covering it with crushed rock and rolling the rock to compact and seat the stones together, or an overlay patch with hot-mix asphalt may be used. This activity also includes grading and repairing gravel roads, repairing broken curbs, and engineering services for special, roadway-related projects. Crews doing this work may vary from 2 to more than 10 people, depending on the size of the repair and amount of equipment needed to accomplish the work. Equipment may include dump trucks, front end loader, motor grader, paving machine, steel roller, rubber tire roller, chip spreader, oil tank trailer and/or an oil distributor.
This activity also includes crack sealing, which is repairing cracks in asphalt and concrete pavement in order to extend the life of the pavement. Random cracking will appear in pavements due to natural aging and traffic action. Cracks over 1/4 inch wide should be filled to prevent water from entering into and weakening the underlying subgrade. Crack sealing is accomplished by pouring hot liquid asphalt in the cracks. Crews doing this work may vary from 2 or more people, depending on the amount of cracking and amount of equipment needed to accomplish the work. Equipment may include dump trucks, compressor, and asphalt kettle. There is not a MAP Activity for 1A2 Crack Sealing any longer. This MAP activity was integrated into 1A1.
1A3 - Shoulder Maintenance
Activities required to repair deficiencies along the paved shoulder or gravel area adjacent to the edge of the pavement. Includes activities like grading the gravel to repair erosion or a drop-off developed by vehicles driving off the pavement edge, and removing shoulder buildup caused by vegetation growth, cleaning under guardrail, or sand left from winter work. Crews doing this work may vary from 1 to 4 people, depending on the size of the repair and amount of equipment needed to accomplish the work.
3-3
Equipment may include a motor grader for the grading work, backhoe, and a sweeper for cleanup, or all the equipment listed for pavement patching and crack sealing. Shoulder Maintenance is still a separate MAP activity that we track not only for edge build up and drop off, but for MAP LOS ratings. The MAP LOS for 1A3 still includes pavement deficiencies going into the 17_19 biennium.
1A4 - Sweeping & Cleaning
Includes sweeping paved shoulders and paved islands either by hand or with a self propelled mechanical sweeper. The work may include picking up all debris, hauling it to a nearby waste disposal site, and washing the pavement with a street flusher. Crews doing this work may vary from 1 to 6 people depending on the amount of traffic control needed. Equipment may include dump trucks, sweeper and street flusher.
1B1- Safety Patrol
Includes patrolling the highway to ensure that the roadway, shoulder, and right of way are free of hazards to the traveling public or hazards that may jeopardize the roadway or roadway prism. Work includes traveling the roadway to inspect for hazardous conditions or problems. Situations requiring immediate attention include rocks, debris, downed stop signs, or dead animals on the roadway. These are corrected without delay to minimize the traveling public’s exposure to the hazard. Any conditions that require a crew or special equipment, such as damaged guardrail, a sign down, a rock slide, or wind-blown tree that has encroached on the roadway are reported to the area maintenance office for future scheduling of crews. Safety patrols are routinely accomplished in areas that commonly have problems, such rockfall or slide areas, and high volume roadways where there is more likelihood of damage occurring or having debris on the roadway. This activity also includes responding to complaints from the public or the State Patrol about hazards reported to the area office. Each complaint/identified problem must be inspected to determine the severity of the problem and the appropriate remedy. Situations requiring immediate attention are corrected without delay to minimize the traveling public’s exposure to the hazard. The work is normally accomplished by one person in a truck. If, in the course of carrying out Safety Patrol, maintenance personnel spend one or more hours in a given day conducting another activity for which there is a different work operation number, that time should be

3-4
charged to that work operation number. Otherwise only use work operation code 1185 if spending less than an hour on any given maintenance action.
Group 2 - Drainage Maintenance & Slope Repair
2A1- Ditch Maintenance
Includes all work necessary to remove silt, soil and rock that have built up over time to restore the flow capacity of ditches or channels. Work may include placing rock in ditches that have eroded to restore the original flow lines and control future erosion. Re-vegetation of the cleaned ditch may also be implemented to control future erosion. Material that is removed from the ditch must be hauled to a suitable disposal site. Crews doing this work may vary from 1 to more than 7 people depending on the size of the repair and amount of equipment needed to accomplish the work. Equipment may include dump trucks, front end loader, motor grader, belt loader, excavator, or backhoe.
2A2 – Culvert Maintenance
Includes all work necessary to keep culverts that cross state highways and county road approaches free of debris and silt. Also includes removing debris build-up, beaver dams, or brush at culvert ends to insure they are free of obstructions. Crews doing this work may vary from 2 to 4 people depending on the size of the obstruction. Equipment may include a culvert rodder, dump truck, backhoe, and hand tools.
2A3 - Catch Basin & Inlet Maintenance
Includes all work necessary to restore flow and storage capacity of inlets, catch basins, manholes, and connecting pipes. Work includes removing the lid and extracting built-up debris and silt. Crews doing this work may vary from 2 to 4 people depending on the amount of traffic control required. Equipment may include a vacuum truck, culvert rodder, water tank truck, dump truck, truck mounted attenuator, and hand tools.
2A4 - Stormwater Facility Maintenance
Includes all work necessary to maintain the original functionality of stormwater facilities to meet WSDOT Highway Runoff Manual Chapter 5-5 requirements. This work may consist of removing soil/silt buildup from stormwater treatment/flow control facilities and inlet/outlet pipes. Material that is removed must be properly managed. Work may also involve erosion repair, liner repair, beaver dam removal, tree removal and noxious
3-5
and nuisance weed control within the confines of the storm water facility. Crews doing this work may vary from 2 to more than 7 people, depending on the size of the repair and amount of equipment needed to accomplish the work. Equipment may include dump trucks, front end loader, excavator, backhoe, or mowers. 2A5 - Slope Repair
Includes all work necessary to repair slope damage from slides, drifting sand or erosion. Work also includes repairing damage to riprap, cribbing, bulkheads, and dikes. For slide repair, the rock, mud, or dirt that that has slid into the ditch or on the roadway must be removed and the ditch returned to its original shape. Erosion repair will involve replacing the eroded material with rock, gravel or other material to stabilize the slope and restore it to its original shape. It may also require removing the eroded material if it has caused damage to adjoining land. Re-vegetation of the slope may also be implemented to control future slope damage. The crew size will vary greatly depending on the size of the slide or damage that has occurred and the amount of equipment needed to do the work. Equipment may include dump trucks, front end loader, excavator, or backhoe.
Group 3 - Roadside & Vegetation Management
3A1 - Litter Pickup
Includes all work necessary to remove litter, debris, and dead animal carcasses from the shoulder and roadside, and haul it to an appropriate disposal site. This work also includes Homeless Camp cleanup, as well as administration of the Adopt-A-Highway Litter Control Program including providing safety hats and vests, signs, and litter sacks to the groups and collecting the filled sacks and hauling to an appropriate disposal site. Work requires one or two people with a small truck, dump truck or garbage compactor.
3A2 - Noxious Weed Control
Includes all work necessary to eradicate and prevent the spread of seed from weeds identified in WAC 16-750 as a Class A or B noxious weed and growing on highway rights of way. The work may involve the spraying of herbicides, mowing, hand pulling, or application of biological control agents (bugs or diseases). The work also includes preventive strategies such as seeding, planting, fertilizing, or liming to enhance desirable vegetation communities which will out-compete unwanted weeds. Work is
3-6
accomplished by one or two people using power spray equipment, or mowers. A buffer truck may be necessary for traffic control safety.
3A3 - Nuisance Vegetation Control
Includes all work necessary to eradicate nuisance vegetation on the right of way that is not identified in WAC 16-750 as a Class A or B noxious weed, nor considered a safety hazard from a highway operational standpoint. This type of vegetation is either aesthetically unsightly, or is troublesome. Scotch Broom and blackberries are two plants that typically fall into this category on the west side of the state. Morning Glory and Puncture vine are examples for the east side. This work includes general mowing of the roadside to improve neatness and appearance. The work may involve the spraying of herbicides, mowing, brushing with hand tools or power saws, pulling by hand, or application of biological control agents (bugs or diseases). Also includes application of soil residual herbicides to prevent vegetation from growing in the gravel at the edge of the pavement. Work is accomplished by one to eight or more people depending on the amount and size of the project. Equipment may include dump trucks, bucket truck, power spray equipment, mowers, or spyder with a brush head. A buffer truck may be necessary for traffic control safety.
3A4 - Vegetation Obstruction Control
Includes all work necessary to eliminate vegetation on the right of way that is, or potentially will be, a safety hazard from an operational standpoint. This type of vegetation is either an obstruction to a vehicle leaving the highway that would cause damage if struck, or is an obstruction to the vision of motorists using the highway and would prevent someone from seeing an upcoming hazard and not allow adequate time to prevent an accident. The work also includes keeping sight lines to signs open; removal of trees and brush that shade the roadway causing icing conditions during the winter; removal of vegetation that is a potential fire hazard; and removal of trees that exhibit structural flaws which increase potential for failure and falling on the roadway. Also includes removal of trees that have fallen on the road after a snow or wind storm. Obstructions can include danger trees, trees 4 inches in diameter or larger in the clear zone, and vegetation blocking regulatory, warning and advisory signs. Other hazards included in this work group are vegetation blocking sight lines to ditch lines, guardrail, guideposts and private approaches. Potential obstructions are seedling trees that are not large enough to be a hazard but will be so in the future.
3-7
The work may involve the spraying of herbicides, mowing, brushing with hand tools or power saws, or pulling by hand. This group does not include preventive strategies such as seeding and fertilizing. Work is accomplished by one to eight or more people depending on the amount and size of the vegetation removed. Equipment may include dump trucks, bucket truck, power spray equipment, mowers, spyder with a brush head, chipper, chain saw, pole saw, or hand tools.
3A5 - Landscape Maintenance
Includes all activities related to the care of formal, ornamental landscape plantings along the highway and interchanges. Work includes weed prevention and eradication; operation and repair of irrigation systems; fertilizing, liming, pruning, trimming and mowing of lawns. Crew size may vary from 1 to 6 people depending on the size of the area being cared for. Equipment may include backhoe, truck, herbicide and insecticide spray equipment, chain saw, hand tools, and fertilizer spreader.
Group 4 - Bridge & Urban Tunnel Maintenance & Operations
4A1 - Bridge Deck Repair
Includes all work necessary to repair scaling, spalling, cracks, and exposed reinforcing steel on bridge decks. The work includes saw cutting and removal of broken asphalt or concrete from the damaged area and patching it with an appropriate mix or compound such as asphalt, epoxy or concrete. Deck Sealing can be applied to extend service life of a concrete deck. A light application of a penetrating sealer or an epoxy can be applied. Work requires a crew of 6-8 people with an air compressor, jackhammer, concrete saw, front end loader, shot blaster, sweeper, and trucks. A buffer truck may be necessary for traffic control safety.
4A2 - Structural Bridge Repair
Includes all work necessary to repair deficiencies that affect the structural support systems of a bridge or tunnel. This includes a wide variety of work including repairing piers or girders, replacing bearing pads, replacing damaged or deteriorated truss members, replacing or repairing expansion joints, repairing scour around piers, and removing debris build-up against piers, bulkheads, or pilings. This may also include tunnel interior maintenance, maintenance of non-structural portions of the bridge (bridge rail, traffic gates, navigation lights, etc.), and payments to other states for inter-state bridge maintenance activities. Work requires a crew of 6-8 people with an air compressor, jackhammer, concrete saw, under-bridge

3-8
bucket truck, backhoe, and dump trucks. A buffer truck may be necessary for traffic control safety.
4A3 - Bridge Cleaning
Includes all work necessary to clean bridge surfaces, sidewalks, and drains to remove sand and debris build-up, provide proper drainage, and an aesthetically clean appearance. Work includes sweeping and washing decks and sidewalks, power washing or sand blasting rust, moss, bird guano, or dirt from surfaces, and cleaning plugged drains and grates so water flows through them freely. This activity also includes painting steel structures to prevent rusting and present an aesthetically pleasant appearance. Work may require a crew of 6-8 people with an air compressor, power washer, sweeper, vactor truck, flusher truck, bucket truck, front end loader, and dump trucks. A buffer truck may be necessary for traffic control safety.
4B1 – Special Bridge and Ferry Operation
Coast Guard regulations require that certain waterways be open to navigation at all times. Highway bridges that cross these waterways must either be high enough to allow ships and boats to pass underneath, or have the ability to move the span so ships and boats can pass on demand. This activity includes all work necessary to maintain and operate moving and floating bridges that are not covered in the activities listed above. Work includes maintenance of all mechanical and electrical working parts so the bridges can be opened and closed when needed. The activity includes the work operation of opening and closing the bridge span. Also includes work to operate floating bridges including pumping water out of pontoons and adjusting anchor cable tension. This work is necessary to keep the bridges operational, afloat, and in proper alignment. Work will require a crew of 1 or more people, and some must have special electrical and mechanical skills and licenses. Tools may include a variety of specialized electrical and mechanical equipment. This activity also includes all work necessary to perform preventive maintenance tasks on mechanical and electrical bridge systems, as identified by the manufacturer, or contained in the O&M Manual. These systems can be very complex and require preventive maintenance to ensure the longest lifecycle possible. Tasks are identified and scheduled for completion in MPET (Maintenance Productivity Enhancement Tool). Work will require a crew of 1 or more people, and some must have special electrical and mechanical skills and licenses. Tools may include a variety of specialized electrical and mechanical equipment.
3-9
In 2015 the Keller Ferry was added to MAP activity 4B1. This includes all work necessary to operate the Keller Ferry which crossed Franklin D. Roosevelt Lake (slackwater behind Grand Coulee Dam) and is a vital transportation link for agricultural commerce on SR 21 between the communities of Republic and Wilbur. The ferry (the “Sanpoil”) is a diesel powered barge-type boat that navigates the 1 1/2 miles, 18 hours a day, 365 days a year. The ferry is typically operated by a two-person crew that must be licensed by the U.S. Coast Guard
4B3 - Urban Tunnel System Operation
Urban tunnels, primarily in the Seattle area, contain a number of safety and operational systems that are deployed during high traffic periods to ventilate the tunnels, or apply fire suppressants in the event of a fire. These systems require periodic testing and operation. This activity includes all work necessary to insure all the mechanical, electrical, and electronic equipment such as exhaust fans, fire protection systems, carbon dioxide monitoring equipment, lighting, radio systems, and all other equipment including the computer control system is operational at all times. This activity also includes all work necessary to perform preventive maintenance tasks as identified by the manufacture, or contained in the O&M Manual for Urban Tunnel systems. These systems can be very complex and require preventive maintenance to ensure peak performance. Tasks are identified and scheduled for completion in MPET (Maintenance Productivity Enhancement Tool). This work requires a crew of 14 to 17 technically trained personnel with specialized skills such as those found in the professions of electricians, plumbers/pipefitters, millwrights, and electronics technicians.
Group 5 - Snow & Ice Control Operations
5B1 - Snow & Ice Control
During winter months from November through March, the primary focus of highway maintenance is keeping the highways operational by the removal of snow and ice, and the routine patrolling of the roadway for early detection of slides, icing, and other winter hazards. This includes 10 mountain passes that remain open year-round. On Snoqualmie and Stevens Passes, avalanche crews monitor and control potential avalanches before they are a hazard to the traveling public. Over the past few years, the Snow & Ice Program has moved toward a chemical program, using anti-icing chemicals or deicers more, and sand less. With better technology and better weather forecasting, the appropriate use of chemicals provides the means to keep highways clearer than plowing alone. Sand continues to be used when appropriate. Between snow storms, the crews in some areas may sweep up accumulated sand to

3-10
reduce dust and minimize resulting air quality impacts. Highways are prioritized for snow and ice control based primarily on traffic volumes and functional class. Interstate and principal arterial highways with the highest average daily traffic within a given maintenance area, will normally receive the first attention. Since winter storms may occur at any time, during any day, with varying intensity, staffing schedules are adjusted to provide a broader coverage and offer better response to storm events. Crew sizes will vary depending on the number of lane miles for which they are responsible. Typical equipment may include dump trucks with a sander and a plow, motor grader, deicer tanker/truck, pickup truck, front end loader, or snow blower.
Group 6 - Traffic Control Maintenance & Operations
6A1 - Pavement Striping Maintenance
All highways have lines that delineate the travel lane for motorists. On multi-lane and two lane roadways this normally consists of a continuous edge stripe closest to the outside shoulder on each side, and a dashed centerline down the middle, to separate the roadway from oncoming traffic. On hilly and curved roads additional yellow stripes will define “No Passing” Zones. The combination of traffic, sand, dirt, and debris can wear these stripes away over time and they must routinely be replaced. The stripes may last anywhere from a month during the winter season to more than one calendar year depending on a combination of these factors. Stripes can be painted on the roadway, or be composed of thermoplastic or methyl methacrylate materials. Pavement striping normally requires a crew of six people. Equipment may include a paint truck, flat bed truck, van, and 2 or more trucks with a mounted attenuator.
6A2 - Raised/Recessed Pavement Markers (Buttons) Maintenance
On many highways, the lines that delineate the traffic lanes and other pavement markings are made up of individual pavement markers (RPM’s) or buttons. Across the state, there has been an increase of recessed pavement markings, the placement of the buttons vary whether they are placed on centerline, gores, etc. The pavement is ground out with tapers in and out, and pavement markings are placed and set with an epoxy.. RPM’s are also used to supplement painted lines. Traffic dislodges the RPM’s over time and they must routinely be replaced. Additionally, the reflectivity of RPM’s decreases due to exposure to traffic and new RPM’s must be installed even though the old ones are still in place. The RPM’s are normally glued in place with a bituminous adhesive. Placing RPM’s normally requires a crew of 5 or more people. Equipment may include a
3-11
pickup truck, air compressor, grinder, sweeper, and 2 or more trucks with a mounted attenuator.
6A3 - Pavement Marking Maintenance
There are a variety of markings on the highway to advise and direct motorists. Crosswalks, stop bars, directional arrows, HOV diamond, and railroad crossings are just a few. The combination of traffic, sand, dirt, and debris can wear these markings away over time and they must routinely be replaced. Many markings are painted on the roadway, but thermoplastic or methyl methacrylate materials are also used. Pavement marking replacement normally requires a crew of six people. Equipment may include a paint truck, flat bed truck, van, and changeable message sign mounted on a truck or trailer, and one or more truck mounted attenuators or buffers.
6A4 & 5 - Regulatory/Warning & Guide Sign Maintenance
There are a variety of signs placed on the highway to regulate, warn, guide, and inform motorists. Regulatory signs inform motorists of a law, regulation, or legal requirement such as stop signs, speed limit signs, or yield signs. Warning signs alert the motorist of a condition that may be hazardous on or adjacent to the roadway such as “Curve Ahead 35 MPH” or “Crossroad Ahead”. Guide signs provide directional or navigational information to the motorists such as “Seattle Next Right” or distance to the next interchange or community. Informational signs provide motorists with information about facilities, services, and attractions such as “FOOD, GAS, and LODGING” or which “Adopt-a-Highway” group is responsible for a given section of highway. These signs periodically get knocked down, are damaged in some manner, eventually lose their reflective properties and readability due to fading from exposure to the elements, or just get dirty. Sign cleaning, repair, or replacement normally requires a crew of two people. Equipment may include a flat bed truck, bucket truck, or a boom truck with a posthole digger
6A6 - Guidepost Maintenance
Guideposts and delineators are placed along the edge of the highway to advise and guide motorists at intersections and on curves. These markers are a reflective indicator on a flexible post used to aid driving at night or during inclement weather such as snow, rain, or fog. Guideposts periodically get damaged in some manner, eventually lose their reflective properties due to fading from exposure to the elements, or just get dirty. Beginning in 2007, guidepost locations are to be marked on the pavement, making it easier and faster to identify locations for replacement of missing guideposts. This will be instituted over time, with some marking done by
3-12
contractors or inspectors on new pavement, some being done by maintenance crews as they go about their daily tasks. Cleaning, repair, or replacement normally requires a crew of two to four people. Equipment may include a flatbed truck, pickup truck with hand tools, bucket truck, air compressor, or a boom truck. A buffer truck may be necessary for traffic control safety.
6A7 – Barrier Maintenance
Barrier (beam, cable or jersey barrier) is placed at the edge of the pavement to prevent vehicles from striking hazardous obstacles, oncoming traffic, or going down steep slopes. The purpose of the guardrail or cable barrier is to redirect errant vehicles and keep them on the road. Barrier that is damaged must be repaired in order for it to maintain its functionality. Barrier repair or replacement normally requires a crew of 3 to 10 people using a flatbed truck, backhoe, posthole digger, auger truck, and a dump truck. A buffer truck may be necessary for traffic control safety.
6B1 - Traffic Signal Systems
Traffic signals control the flow and direction of traffic at major intersections. This highly technical equipment must operate at all times to insure safe movement of vehicles through the intersection. Periodically bulbs burn out, poles are damaged or knocked down, control units malfunction and electrical wiring or services short out or are lost due to power failure. This activity (6B1) encompasses all traffic signal system repairs and also includes performing identified preventive maintenance tasks necessary to keep traffic signal systems operating at optimal performance to extend the longevity of the system. Technically skilled electricians are required to perform PM’s, repairs or replacement of signal fixtures. Essential equipment includes a truck, boom truck, bucket truck, and other specialized equipment. Also included in 6B1 are the costs of paying for electricity to power the traffic signals.
6B2 - Highway Lighting Systems
Highway luminaires provide light at major intersections, interchange ramps, rest areas and along high volume highways to improve visibility and safety at night. Major signs are also lighted to improve visibility and readability. Periodically bulbs burn out, light poles are damaged or knocked down, or electrical wiring or services malfunction. This activity includes all repairs; replacement; and performance of identified preventive maintenance tasks necessary to keep illumination systems operating at optimal performance and extend the longevity of the system. Repair,
3-13
replacement or PM of lighting fixtures requires technically skilled electricians, a truck, boom truck, bucket truck, and other specialized equipment. Operation of lighting includes paying for electricity to power the lights.
6B3 - Intelligent Transportation Systems (ITS)
Intelligent Transportation System equipment covers a broad variety of highly specialized equipment on the highway that is used to control and regulate the flow of traffic, and inform motorists. Examples of ITS for traffic control include ramp meters, reversible lane gates and signs, and variable speed limit signs. Informational equipment includes video cameras, highway advisory radio, and variable message signs. In some cases this equipment is part of a network that is operated through a central command center using telecommunications for operating and controlling the equipment. All such highly technical equipment requires preventive maintenance and repairs in order to remain at optimal performance. Preventive maintenance tasks, and the frequency for completion, have been identified for this equipment (see work operation codes). Skilled electronics technicians use a variety of specialized equipment to maintain and operate the system. Crews range in size from 2 to 4 people depending on the complexity of the work. Operation of Intelligent Traffic Systems includes paying for electricity to power the systems.
Group 7 – Rest Area Operations
7B1 – Rest Area Operations
There are 47 major rest areas in operation on the state highway system. The rest areas are small, park-like sites that offer a place for motorists to stop, use a rest room facility, rest, relax, obtain limited refreshments, and generally refresh themselves before continuing on their journey. All rest areas have rest rooms that must be cleaned and sanitized and litter receptacles emptied on a daily basis, and parking areas that must be cared for. Many rest areas have picnic tables, landscaping, and sidewalks to maintain. These sites also have water and sewer systems that must meet public health regulations for operation. Rest areas are usually cared for by one or more attendants who clean and sanitize the building and empty litter. At some locations, site work is done by separate crews on an as-needed basis. Two of the rest areas are maintained cooperatively by WSDOT and another entity.

3-14
Group 8 - Training and Testing 8B1 - Employee Technical & Safety Training
Training employees is critical to having a proficient and skilled work force. Much of the equipment that maintenance uses is very technical and requires periodic training to stay current. Many jobs require special licenses that can only be renewed through a continuing education program and obtaining a minimum number of training credits each year.
8B2 - Support and Testing
This activity covers a variety of miscellaneous things that are necessary in order for a maintenance organization to operate efficiently and effectively. Activities include field supervision, administrative/clerical support, organizing and inventorying stockpile sites, drug and alcohol testing, managing store rooms, and having a radio dispatcher.
Group 9 - 3rd Party Damages
9B1 - 3rd Party Damages
Whenever an errant vehicle damages part of the highway facility such as guardrail or a light pole, the driver is financially responsible for the repair or replacement. When a maintenance crew repairs such damage they charge their work to this activity so the cost of the repair can be accounted for and recovered.
Group 10 - Emergency Operations 9B2 – Emergency Response
Whenever a disaster, such as earthquake, flood, or fire damage restricts highway operation and the event is proclaimed a disaster by state or federal authorities, the cost for returning the facility to operation may be recoverable through disaster relief funding. This may also include the cost of personnel setting up temporary traffic control, detours, or road closures, and any other work related to operating the roadway during these disasters. When maintenance personnel are involved in any disaster-related work, they charge their work to this activity so the cost can be accounted for and recovered.
3-15
Work Operations Work Operation Numbers (also called Work Operation Codes) are numbers used to track the cost of specific activities. These are entered on timesheets, stores orders, etc. along with a work order and group. Once these numbers are entered into the systems, reports can then be run showing how much a particular work order cost, how much was spent on a single work operation in a specified date range, how much was spent on a particular MAP activity, and numerous other things. The paragraphs and links below contain information about work operations and their relationship to MAP activities. One MAP activity will have several work operation codes connected to it, but each work operation code is connected to only one MAP activity. Work operation code lists can be found in the Chart of Accounts at this web address: http://wwwi.wsdot.wa.gov/Publications/Manuals/M13-02.htm. This list contains all the work operation codes for every Program and Sub Program associated with WSDOT. Also on the web, at the Maintenance and Operations Home Page, http://wwwi.wsdot.wa.gov/MaintOps/ two work operation code lists that are specific to Maintenance, are available. The difference between these and what is found in the Chart of Accounts is the presence of a description of the work associated with the code. The first list (Long version) is used primarily in training, has many details and scenarios. Use this list if you are unfamiliar with how all of this functions together. The second list is simply a list of work operations.
Performance Measures Chapter 4
The Maintenance Accountability Process utilizes outcome based performance measures with a rating scale of A (best) to F (worst) for reporting the level of service provided. Outcome based refers to the results of tasks accomplished by Maintenance personnel.
A performance measure is made up of a condition indicator, (deficiency or condition to be measured), outcome measure, (unit of measure), and thresholds for the five service levels for each MAP activity. A threshold is the range of allowable deficiencies or conditions for each service level.
The following pages define each of the performance measures. Included with each performance measure is information on timing (when the information is gathered and reported), the level of reporting is at the statewide level beginning 2016, plus clarifying comments and the source of the data.
4-1
Re$ource$ Labor
Equipment Materials
Information
Level Of Delivery Maintenance Activities
Quantity of Work Done
Feet of cracks sealed
Number of culverts cleaned
Cu. yrds. of litterpicked up
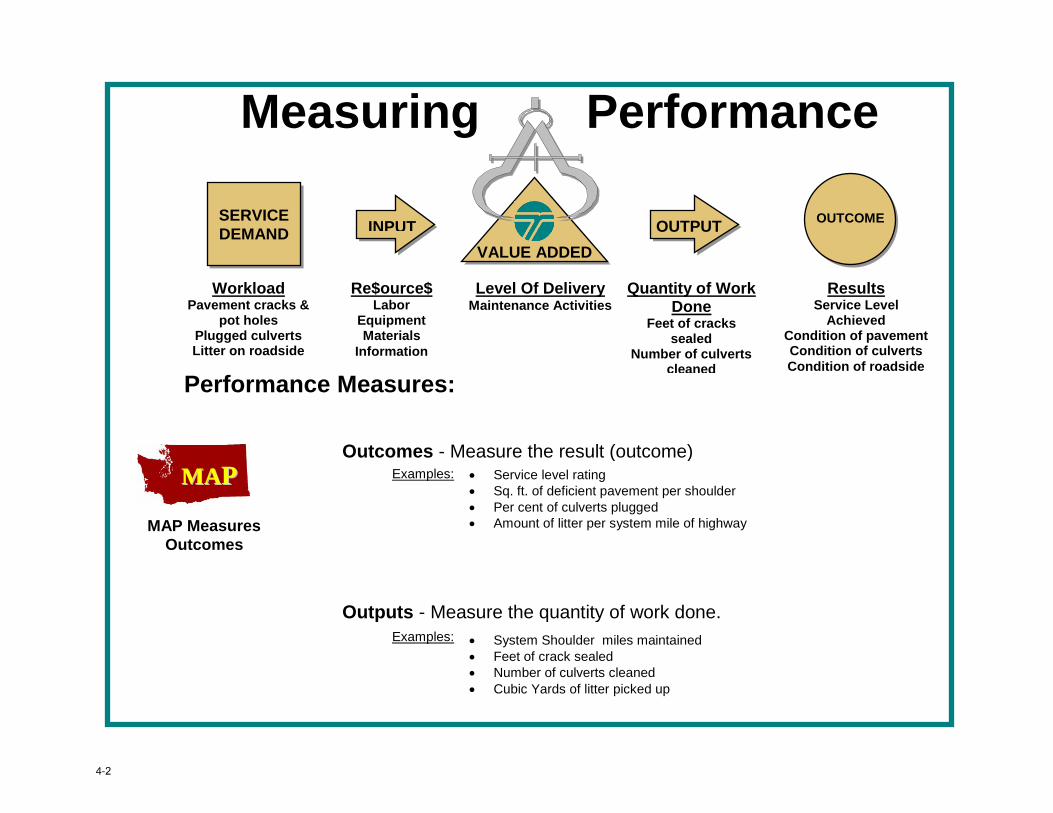
Measuring Performance
Results Service Level
Achieved Condition of pavement Condition of culverts Condition of roadside
INPUTSERVICE DEMAND
Workload Pavement cracks &
pot holes Plugged culverts Litter on roadside
Outcomes - Measure the result (outcome) achieved
Outputs - Measure the quantity of work done.
Examples: Service level rating Sq. ft. of deficient pavement per shoulder Per cent of culverts plugged Amount of litter per system mile of highway
Examples: System Shoulder miles maintained Feet of crack sealed Number of culverts cleaned Cubic Yards of litter picked up
Performance Measures:
MMAAPP
OUTPUT VALUE ADDED
OUTCOME
MAP Measures Outcomes
4-2
Maintenance Accountability ProcessPerfomance Measures
Group -
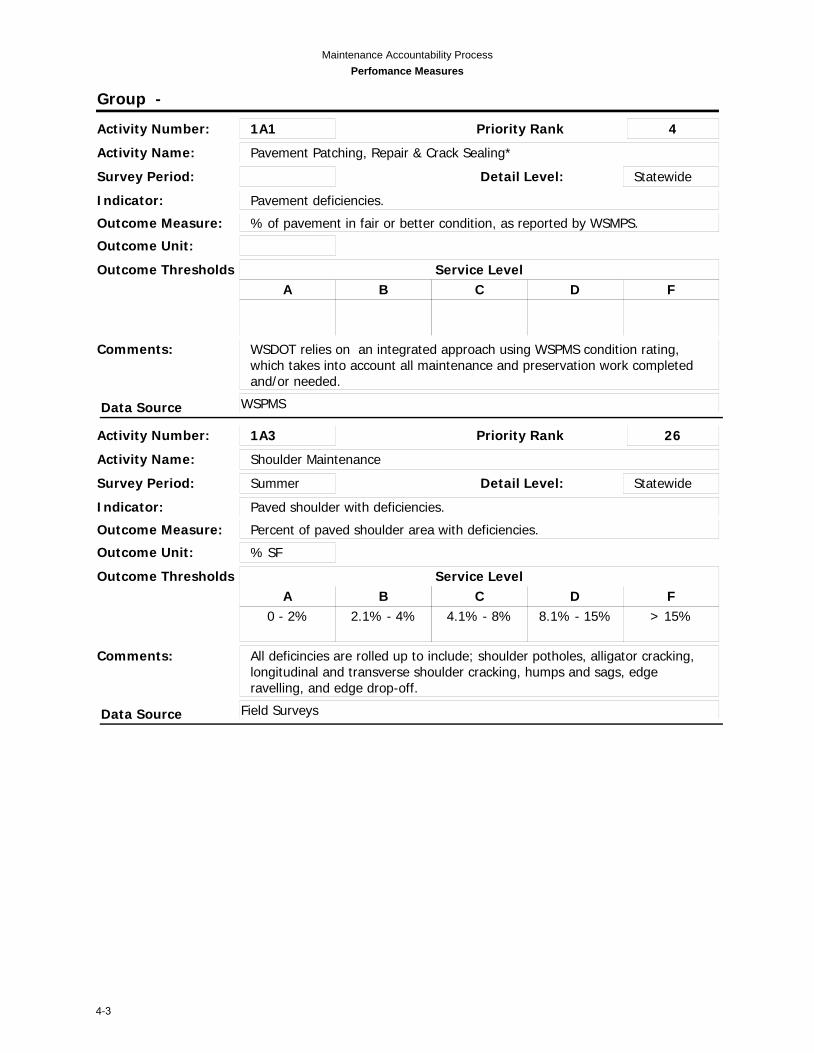
Activity Number: 1A1
Activity Name: Pavement Patching, Repair & Crack Sealing*
Outcome Unit:
Survey Period: Detail Level: Statewide
Indicator: Pavement deficiencies.
Outcome Measure: % of pavement in fair or better condition, as reported by WSMPS.
A B C D F
Outcome Thresholds Service Level
Comments: WSDOT relies on an integrated approach using WSPMS condition rating, which takes into account all maintenance and preservation work completed and/or needed.
Priority Rank 4
Data Source WSPMS
Activity Number: 1A3
Activity Name: Shoulder Maintenance
Outcome Unit: % SF
Survey Period: Summer Detail Level: Statewide
Indicator: Paved shoulder with deficiencies.
Outcome Measure: Percent of paved shoulder area with deficiencies.
A
0 - 2%
B
2.1% - 4%
C
4.1% - 8%
D
8.1% - 15%
F
> 15%
Outcome Thresholds Service Level
Comments: All deficincies are rolled up to include; shoulder potholes, alligator cracking, longitudinal and transverse shoulder cracking, humps and sags, edge ravelling, and edge drop-off.
Priority Rank 26
Data Source Field Surveys
4-3

Maintenance Accountability ProcessPerfomance Measures
Group -
Activity Number: 1A4
Activity Name: Sweeping and Cleaning
Outcome Unit: % SF
Survey Period: Summer Detail Level: Statewide
Indicator: Sand, rocks, and debris on paved shoulder.
Outcome Measure: Percent of paved shoulder area with debris.
A
0 - 5%
B
5.1% - 10%
C
10.1% - 20%
D
20.1% - 40%
F
> 40%
Outcome Thresholds Service Level
Comments:
Priority Rank 18
Data Source Field Surveys
Activity Number: 2A1
Activity Name: Ditch Maintenance
Outcome Unit: % Full
Survey Period: Summer Detail Level: Statewide
Indicator: Ditches with sediment build-up, unable to carry design flow.
Outcome Measure: Percent of ditches greater than 50% filled with sediment/debris.
A
0 - 1%
B
1.1% - 5%
C
5.1% - 10%
D
10.1% - 15%
F
>15%
Outcome Thresholds Service Level
Comments:
Priority Rank 20
Data Source Field Surveys
Activity Number: 2A2
Activity Name: Culvert Maintenance
Outcome Unit: % Full
Survey Period: Summer Detail Level: Statewide
Indicator: Cross culverts and county road approaches plugged with dirt and/or debris, unable to carry design flow.
Outcome Measure: Percent of pipes/culverts greater than 50% filled, or otherwise deficient.
A
0 - 2%
B
2.1% - 5%
C
5.1% - 10%
D
10.1% - 20%
F
>20%
Outcome Thresholds Service Level
Comments:
Priority Rank 24
Data Source Field Surveys
4-4
Maintenance Accountability ProcessPerfomance Measures
Group -
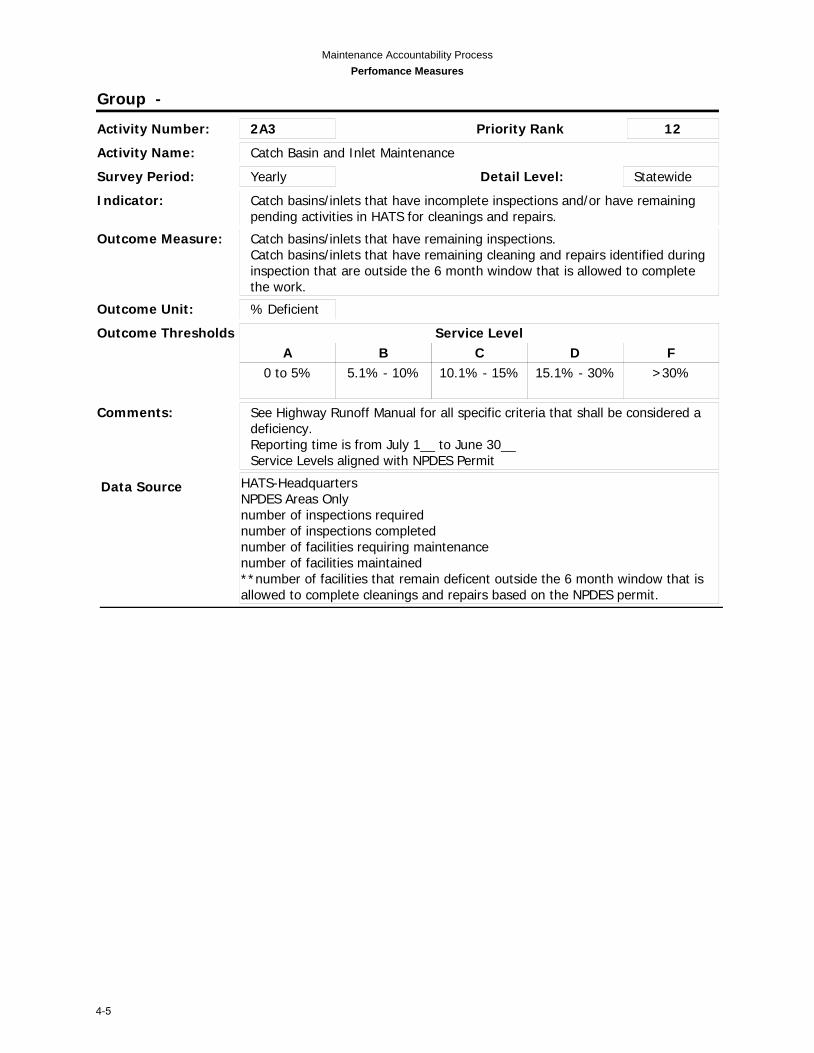
Activity Number: 2A3
Activity Name: Catch Basin and Inlet Maintenance
Outcome Unit: % Deficient
Survey Period: Yearly Detail Level: Statewide
Indicator: Catch basins/inlets that have incomplete inspections and/or have remaining pending activities in HATS for cleanings and repairs.
Outcome Measure: Catch basins/inlets that have remaining inspections.Catch basins/inlets that have remaining cleaning and repairs identified during inspection that are outside the 6 month window that is allowed to complete the work.
A
0 to 5%
B
5.1% - 10%
C
10.1% - 15%
D
15.1% - 30%
F
>30%
Outcome Thresholds Service Level
Comments: See Highway Runoff Manual for all specific criteria that shall be considered a deficiency.Reporting time is from July 1__ to June 30__Service Levels aligned with NPDES Permit
Priority Rank 12
Data Source HATS-HeadquartersNPDES Areas Onlynumber of inspections requirednumber of inspections completednumber of facilities requiring maintenancenumber of facilities maintained**number of facilities that remain deficent outside the 6 month window that is allowed to complete cleanings and repairs based on the NPDES permit.
4-5

Maintenance Accountability ProcessPerfomance Measures
Group -
Activity Number: 2A4
Activity Name: Stormwater Facilitiy Maintenance
Outcome Unit: % Def.
Survey Period: Yearly Detail Level: Statewide
Indicator: Stormwater facilities that have incomplete inspections and/or have remaining pending activities in HATS for typical and non-typical maintenance.
Outcome Measure: Stormwater Facilities that have remaining inspections. Stormwater Facilities that have remaining typical and non-typical maintenance, outside the 1 year window for typical maintenance and 2 years for non-typical maintenance.
A
0 to 5%
B
5.1% - 10%
C
10.1% - 15%
D
15.1% - 30%
F
>30%
Outcome Thresholds Service Level
Comments: See Highway Runoff Manual for all specific criteria that shall be considered a deficiency.Reporting time is from July 1__ to June 30__Service Levels aligned with NPDES Permit
Priority Rank 22
Data Source HATS -HeadquartersNPDES Areas Only number of inspections requirednumber of inspections completednumber of facilities requiring maintenancenumber of facilities maintained*Stormwater Facilites that have remaining typical and non-typical maintenance,outside the 1 year window for typical maintenance and 2 years for non-typicalmaintenance, based on the NPDES permit.
Activity Number: 2A5
Activity Name: Slope Repair
Outcome Unit: % CLM
Survey Period: Summer Detail Level: Statewide
Indicator: Unrepaired erosion or slides encroaching on, or undermining the shoulder or traveled lane.
Outcome Measure: Percent of centerline miles with slides or erosion encroaching on, or undermining the shoulder or traveled way.
A
0 - 2%
B
2.1% - 4%
C
4.1% - 7%
D
7.1% - 10%
F
>10%
Outcome Thresholds Service Level
Comments: Presence of one or more slope failures (Spring 01), reported as a yes or no.
Priority Rank 10
Data Source Field surveys
4-6
Maintenance Accountability ProcessPerfomance Measures
Group -
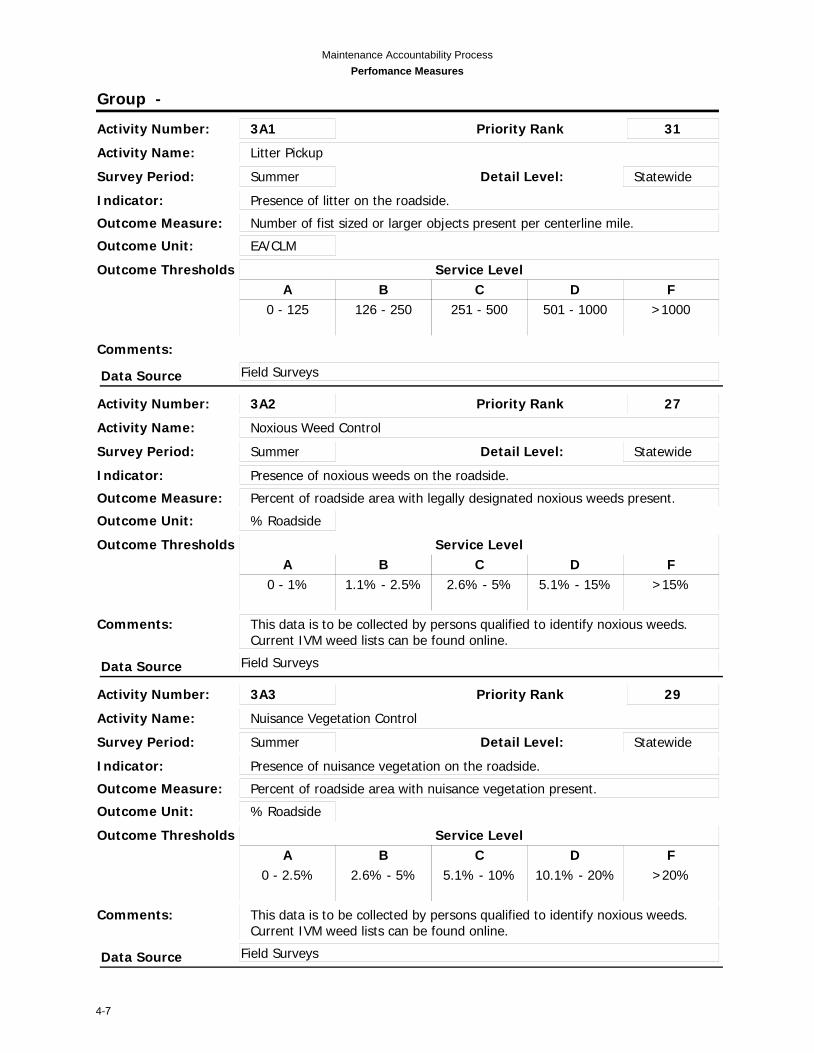
Activity Number: 3A1
Activity Name: Litter Pickup
Outcome Unit: EA/CLM
Survey Period: Summer Detail Level: Statewide
Indicator: Presence of litter on the roadside.
Outcome Measure: Number of fist sized or larger objects present per centerline mile.
A
0 - 125
B
126 - 250
C
251 - 500
D
501 - 1000
F
>1000
Outcome Thresholds Service Level
Comments:
Priority Rank 31
Data Source Field Surveys
Activity Number: 3A2
Activity Name: Noxious Weed Control
Outcome Unit: % Roadside
Survey Period: Summer Detail Level: Statewide
Indicator: Presence of noxious weeds on the roadside.
Outcome Measure: Percent of roadside area with legally designated noxious weeds present.
A
0 - 1%
B
1.1% - 2.5%
C
2.6% - 5%
D
5.1% - 15%
F
>15%
Outcome Thresholds Service Level
Comments: This data is to be collected by persons qualified to identify noxious weeds. Current IVM weed lists can be found online.
Priority Rank 27
Data Source Field Surveys
Activity Number: 3A3
Activity Name: Nuisance Vegetation Control
Outcome Unit: % Roadside
Survey Period: Summer Detail Level: Statewide
Indicator: Presence of nuisance vegetation on the roadside.
Outcome Measure: Percent of roadside area with nuisance vegetation present.
A
0 - 2.5%
B
2.6% - 5%
C
5.1% - 10%
D
10.1% - 20%
F
>20%
Outcome Thresholds Service Level
Comments: This data is to be collected by persons qualified to identify noxious weeds. Current IVM weed lists can be found online.
Priority Rank 29
Data Source Field Surveys
4-7
Maintenance Accountability ProcessPerfomance Measures
Group -
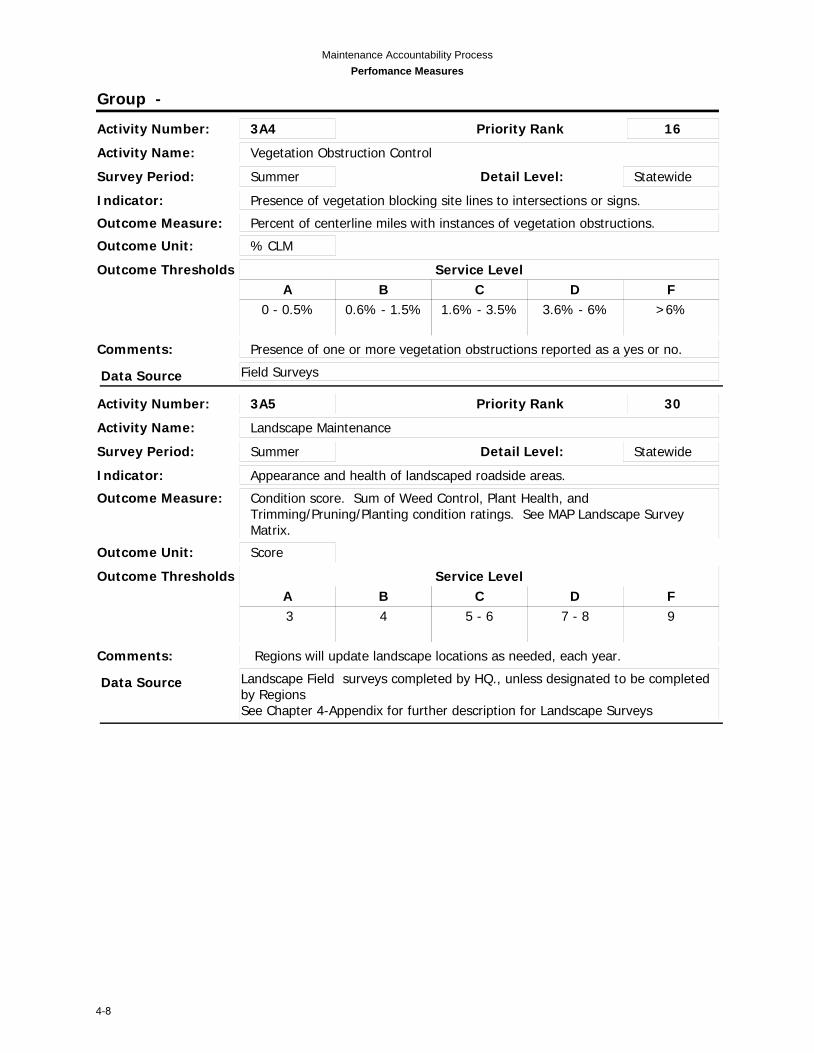
Activity Number: 3A4
Activity Name: Vegetation Obstruction Control
Outcome Unit: % CLM
Survey Period: Summer Detail Level: Statewide
Indicator: Presence of vegetation blocking site lines to intersections or signs.
Outcome Measure: Percent of centerline miles with instances of vegetation obstructions.
A
0 - 0.5%
B
0.6% - 1.5%
C
1.6% - 3.5%
D
3.6% - 6%
F
>6%
Outcome Thresholds Service Level
Comments: Presence of one or more vegetation obstructions reported as a yes or no.
Priority Rank 16
Data Source Field Surveys
Activity Number: 3A5
Activity Name: Landscape Maintenance
Outcome Unit: Score
Survey Period: Summer Detail Level: Statewide
Indicator: Appearance and health of landscaped roadside areas.
Outcome Measure: Condition score. Sum of Weed Control, Plant Health, and Trimming/Pruning/Planting condition ratings. See MAP Landscape Survey Matrix.
A
3
B
4
C
5 - 6
D
7 - 8
F
9
Outcome Thresholds Service Level
Comments: Regions will update landscape locations as needed, each year.
Priority Rank 30
Data Source Landscape Field surveys completed by HQ., unless designated to be completed by RegionsSee Chapter 4-Appendix for further description for Landscape Surveys
4-8

Maintenance Accountability ProcessPerfomance Measures
Group -
Activity Number: 4A1
Activity Name: Bridge Deck Repair
Outcome Unit:
Survey Period: Detail Level: Statewide
Indicator: Bridge deficenices.
Outcome Measure: Percentage of Bridges in fair or better condition, as reported by BPO (Bridge Preservation Office).
A B C D F
Outcome Thresholds Service Level
Comments: Effective in 2014 WSDOT has transitioned to an integrated approach with the Bridge Preservation office on condtion based assesments.
Priority Rank 11
Data Source Bridge inspection reports, via BPOData source is the Quarterly Reports supplied and verified by the Regions.
Activity Number: 4A2
Activity Name: Structural Bridge Repair
Outcome Unit:
Survey Period: Detail Level: Statewide
Indicator: Priority 1 deficiencies identified on bridges.
Outcome Measure: Percentage of Bridges in fair or better condition, as reported by BPO (Bridge Preservation Office).
A B C D F
Outcome Thresholds Service Level
Comments: Effective in 2014 WSDOT has transitioned to an integrated approach with the Bridge Preservation Office on condition based assesments.Reporting Time for task completion is July 1__ to June 30__.
Priority Rank 7
Data Source Bridge Repair List and Regional emergent repair lists. Bridge inspection reports, via BPO
4-9
Maintenance Accountability ProcessPerfomance Measures
Group -
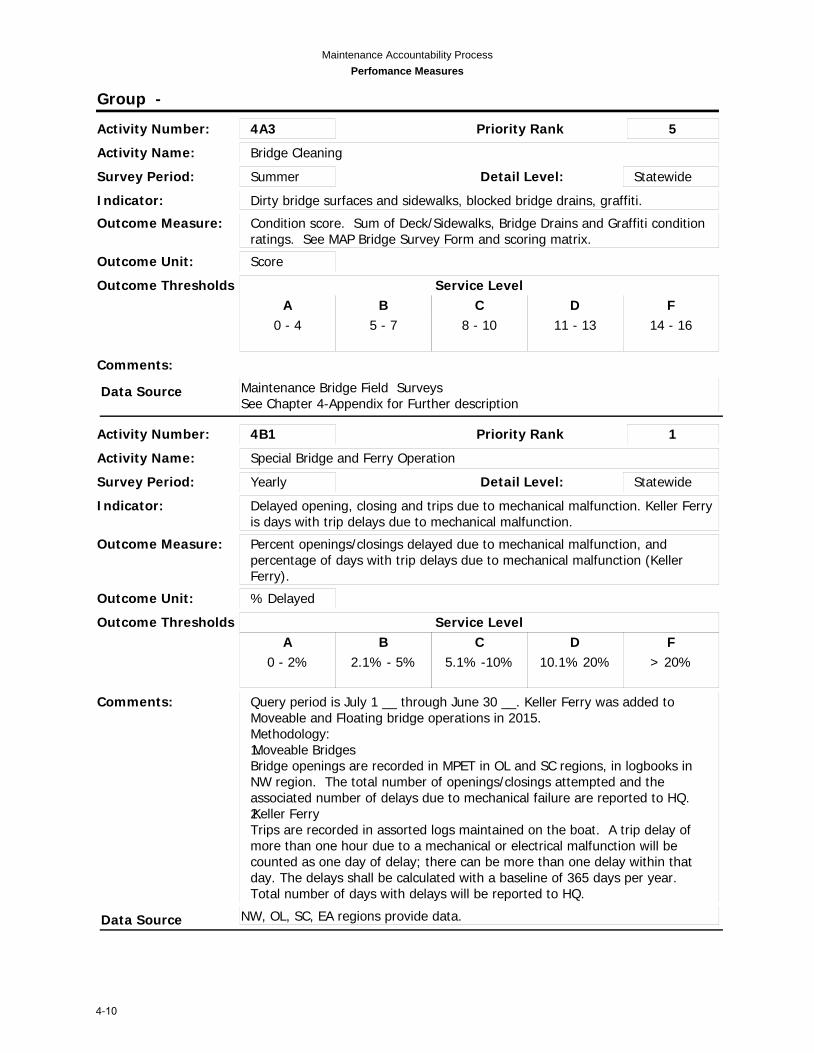
Activity Number: 4A3
Activity Name: Bridge Cleaning
Outcome Unit: Score
Survey Period: Summer Detail Level: Statewide
Indicator: Dirty bridge surfaces and sidewalks, blocked bridge drains, graffiti.
Outcome Measure: Condition score. Sum of Deck/Sidewalks, Bridge Drains and Graffiti condition ratings. See MAP Bridge Survey Form and scoring matrix.
A
0 - 4
B
5 - 7
C
8 - 10
D
11 - 13
F
14 - 16
Outcome Thresholds Service Level
Comments:
Priority Rank 5
Data Source Maintenance Bridge Field SurveysSee Chapter 4-Appendix for Further description
Activity Number: 4B1
Activity Name: Special Bridge and Ferry Operation
Outcome Unit: % Delayed
Survey Period: Yearly Detail Level: Statewide
Indicator: Delayed opening, closing and trips due to mechanical malfunction. Keller Ferry is days with trip delays due to mechanical malfunction.
Outcome Measure: Percent openings/closings delayed due to mechanical malfunction, and percentage of days with trip delays due to mechanical malfunction (Keller Ferry).
A
0 - 2%
B
2.1% - 5%
C
5.1% -10%
D
10.1% 20%
F
> 20%
Outcome Thresholds Service Level
Comments: Query period is July 1 __ through June 30 __. Keller Ferry was added to Moveable and Floating bridge operations in 2015.Methodology: 1.Moveable BridgesBridge openings are recorded in MPET in OL and SC regions, in logbooks inNW region. The total number of openings/closings attempted and theassociated number of delays due to mechanical failure are reported to HQ.2.Keller FerryTrips are recorded in assorted logs maintained on the boat. A trip delay ofmore than one hour due to a mechanical or electrical malfunction will becounted as one day of delay; there can be more than one delay within thatday. The delays shall be calculated with a baseline of 365 days per year.Total number of days with delays will be reported to HQ.
Priority Rank 1
Data Source NW, OL, SC, EA regions provide data.
4-10

Maintenance Accountability ProcessPerfomance Measures
Group -
Activity Number: 4B3
Activity Name: Urban Tunnel Systems Operation
Outcome Unit: Closure/Year
Survey Period: Yearly Detail Level: Statewide
Indicator: Tunnel closure to flammable cargo for maintenance repairs (not closures for planned PM work) or malfunctioning mechanical, electrical, or control systems.
Outcome Measure: Number of tunnel closures to flammable cargo per year; not due to project work or planned maintenance.
A
0 - 5
B
6 -10
C
11 - 25
D
26 -50
F
>50
Outcome Thresholds Service Level
Comments: Reporting period is July 1 __ through June 30 __.
Priority Rank 6
Data Source I-90 Tunnels.The I-5 tunnels not included, not funded thru M2 dollars. No firesupression during a malfunction or closures. Closures are placared forflammables when restricted.
Activity Number: 5B1
Activity Name: Snow and Ice Control Operations
Outcome Unit: Score
Survey Period: Yearly Detail Level: Statewide
Indicator: Snow and/or ice on the roadway reducing traction and safety.
Outcome Measure: Improved road conditions from application of sand or deicer to the highway surface when snow and/or ice is present.
A
1 -2.00
B
2.1 - 3.00
C
3.1 - 4.00
D
4.1 - 5.00
F
> 5
Outcome Thresholds Service Level
Comments: Reporting period is Nov 1 __ through March 31 __.
Priority Rank 3
Data Source Snow and Ice HATS MAP LOS Records
4-11

Maintenance Accountability ProcessPerfomance Measures
Group -
Activity Number: 6A1
Activity Name: Pavement Striping Maintenance
Outcome Unit: %
Survey Period: Yearly Detail Level: Statewide
Indicator: Striping that is not repainted annually. The assumption is that all stripes will be repainted each year.
Outcome Measure: Percentage of total painted line miles completed, that are represented by completion of paint stripe line miles >90 Res or RL readings, and excluding any line miles not completed due to construction.
A
> = 90%
B
89.9 - 80%
C
79.9 - 70%
D
69.9 - 60%
F
<59.9%
Outcome Thresholds Service Level
Comments: Data is collected by striping crew prior to striping and forwarded to M&O MAP personnel on a monthly basis; during striping season.Spring/Summer/ Fall of calendar year
Priority Rank 14
Data Source Regions/SkiplineRegions to supply an inventory of long lines. Assumption is all line miles will be painted every year.
Activity Number: 6A2
Activity Name: Raised/Recessed Pavement Marker Maintenance
Outcome Unit: % Def.
Survey Period: Summer Detail Level: Statewide
Indicator: Missing or damaged pavement markers (buttons).
Outcome Measure: Percent of pavement markers damaged or missing.
A
0 - 5%
B
5.1% - 10%
C
10.1% - 20%
D
20.1% - 30%
F
> 30%
Outcome Thresholds Service Level
Comments:
Priority Rank 15
Data Source Field Surveys
4-12

Maintenance Accountability ProcessPerfomance Measures
Group -
Activity Number: 6A3
Activity Name: Pavement Marking Maintenance
Outcome Unit: % Def.
Survey Period: Summer Detail Level: Statewide
Indicator: Stop bars, arrows, crosswalks, etc., having more than 25% of marking worn or missing.
Outcome Measure: Percent of pavement markings with more than 25% worn or missing.
A
0 - 2%
B
2.1% - 10%
C
10.1% - 20%
D
20.1% - 30%
F
> 30%
Outcome Thresholds Service Level
Comments:
Priority Rank 25
Data Source Field Surveys
Activity Number: 6A4
Activity Name: Regulatory Sign Maintenance
Outcome Unit: % Def.
Survey Period: Yearly Detail Level: Statewide
Indicator: Regulatory signs that are unreadable at night.
Outcome Measure: Percent of regulatory signs that are unreadable at night.
A
0 - 1%
B
1.1% - 2%
C
2.1% - 5%
D
5.1% - 10%
F
> 10%
Outcome Thresholds Service Level
Comments: In accordance with Title 23, United States Code, Section 109(d) and Title 23, Code of Federal Regulations, Part 655.603, and is approved as the national standard for designing, applying, and planning traffic control devices the MUTCD is the national standard control devices. The MUTCD requires public agencies to have an assessment or management method to maintain sign retroreflectivity. To fulfill this requirement, the department reviews half of the signs each year at night, and results are inputted into the Traffic Sign Management System (TSMS) database.
Priority Rank 8
Data Source HQ Traffic sign databaseReporting period July 1__ to June 30__
4-13
Maintenance Accountability ProcessPerfomance Measures
Group -
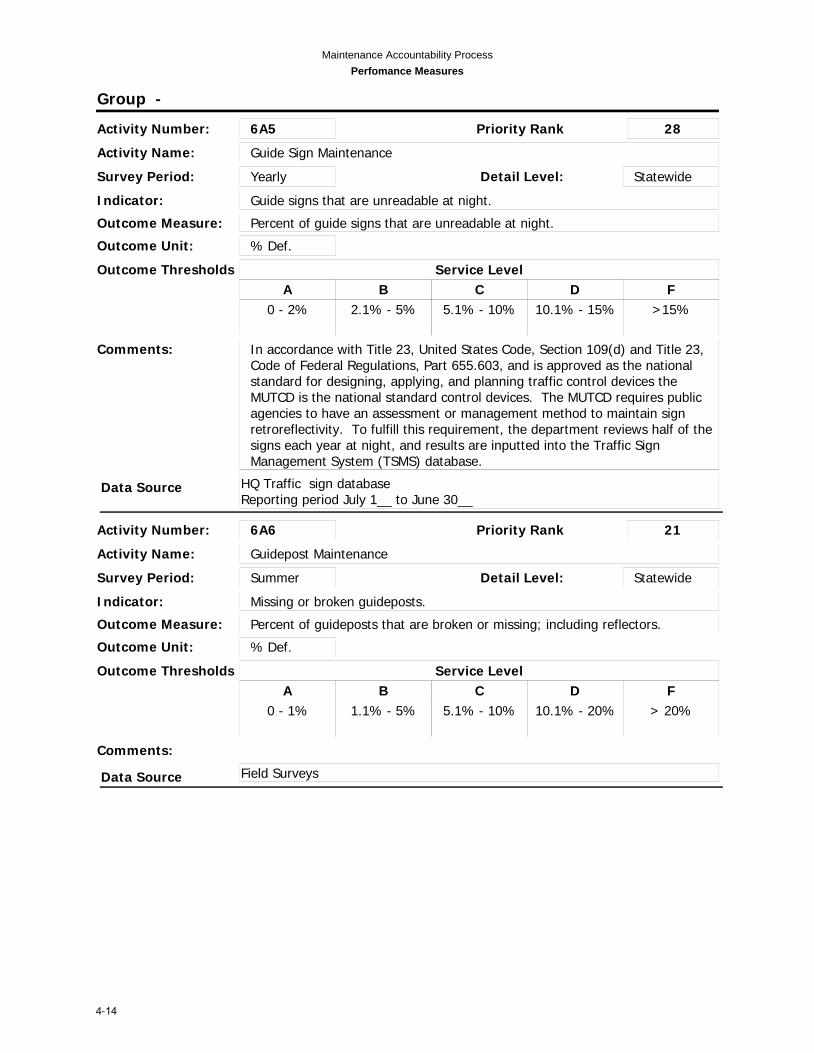
Activity Number: 6A5
Activity Name: Guide Sign Maintenance
Outcome Unit: % Def.
Survey Period: Yearly Detail Level: Statewide
Indicator: Guide signs that are unreadable at night.
Outcome Measure: Percent of guide signs that are unreadable at night.
A
0 - 2%
B
2.1% - 5%
C
5.1% - 10%
D
10.1% - 15%
F
>15%
Outcome Thresholds Service Level
Comments: In accordance with Title 23, United States Code, Section 109(d) and Title 23, Code of Federal Regulations, Part 655.603, and is approved as the national standard for designing, applying, and planning traffic control devices the MUTCD is the national standard control devices. The MUTCD requires public agencies to have an assessment or management method to maintain sign retroreflectivity. To fulfill this requirement, the department reviews half of the signs each year at night, and results are inputted into the Traffic Sign Management System (TSMS) database.
Priority Rank 28
Data Source HQ Traffic sign databaseReporting period July 1__ to June 30__
Activity Number: 6A6
Activity Name: Guidepost Maintenance
Outcome Unit: % Def.
Survey Period: Summer Detail Level: Statewide
Indicator: Missing or broken guideposts.
Outcome Measure: Percent of guideposts that are broken or missing; including reflectors.
A
0 - 1%
B
1.1% - 5%
C
5.1% - 10%
D
10.1% - 20%
F
> 20%
Outcome Thresholds Service Level
Comments:
Priority Rank 21
Data Source Field Surveys
4-14

Maintenance Accountability ProcessPerfomance Measures
Group -
Activity Number: 6A7
Activity Name: Barrier Maintenance
Outcome Unit: % Def.
Survey Period: Summer Detail Level: Statewide
Indicator: Damaged or defective barrier.
Outcome Measure: Percent of barrier that is damaged or missing.
A
0 - 1%
B
1.1% - 3%
C
3.1% - 5%
D
5.1% - 10%
F
> 10%
Outcome Thresholds Service Level
Comments: Surveys indicate type of barrier, i.e. beam or jersey barrier.All barrier types including cable barrier will be collected under field surveys separately.
Priority Rank 13
Data Source Field Surveys
Activity Number: 6B1
Activity Name: Traffic Signal Systems
Outcome Unit: Rep./Sig./Yr
Survey Period: Yearly Detail Level: Statewide
Indicator: Traffic signals at an intersection flashing, with burned out bulbs, or with a control system malfunction.
Outcome Measure: Total number of repairs for a percentage of malfunctions against the total inventory of signal systems.
A
1 per 2 years
B
1 per year
C
2 per year
D
3 per year
F
4 per year
Outcome Thresholds Service Level
Comments: Reporting period is July 1 __ through June 30 __.Do not include 3rd party damages or lightning stirikes as these are not an indicator of the asset condition.
Priority Rank 2
Data Source SIMMS database, with regional concurrance.
4-15
Maintenance Accountability ProcessPerfomance Measures
Group -
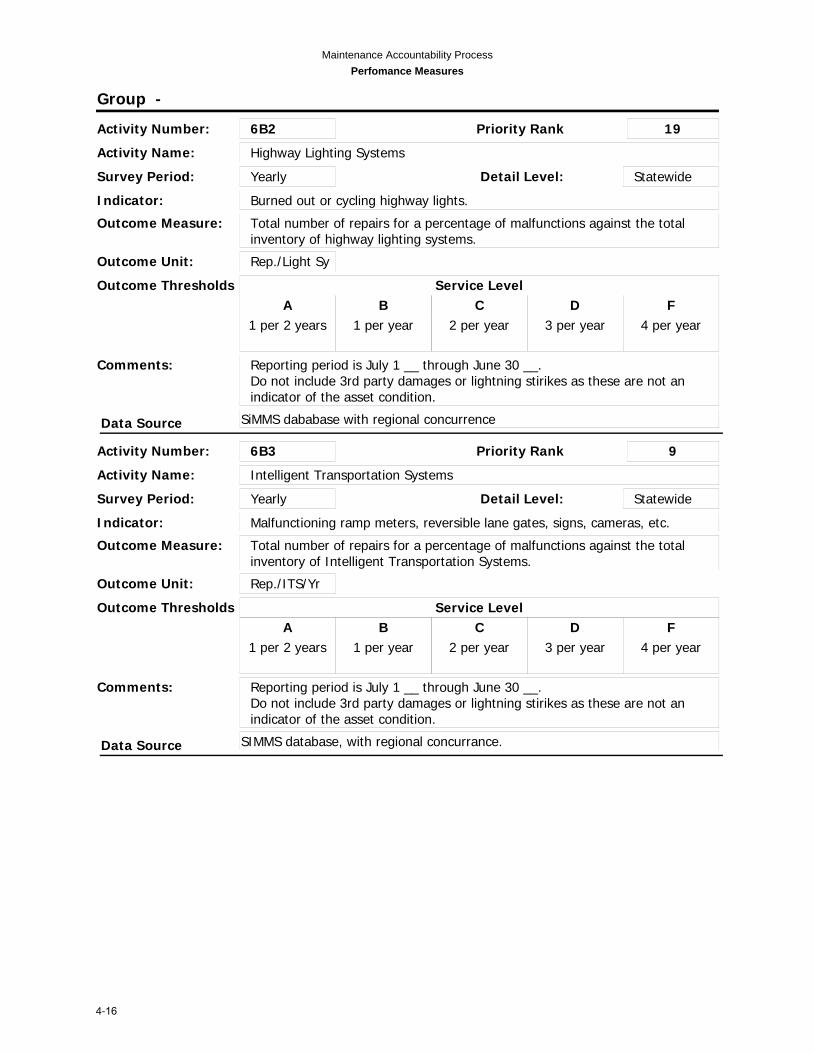
Activity Number: 6B2
Activity Name: Highway Lighting Systems
Outcome Unit: Rep./Light Sy
Survey Period: Yearly Detail Level: Statewide
Indicator: Burned out or cycling highway lights.
Outcome Measure: Total number of repairs for a percentage of malfunctions against the total inventory of highway lighting systems.
A
1 per 2 years
B
1 per year
C
2 per year
D
3 per year
F
4 per year
Outcome Thresholds Service Level
Comments: Reporting period is July 1 __ through June 30 __.Do not include 3rd party damages or lightning stirikes as these are not an indicator of the asset condition.
Priority Rank 19
Data Source SiMMS dababase with regional concurrence
Activity Number: 6B3
Activity Name: Intelligent Transportation Systems
Outcome Unit: Rep./ITS/Yr
Survey Period: Yearly Detail Level: Statewide
Indicator: Malfunctioning ramp meters, reversible lane gates, signs, cameras, etc.
Outcome Measure: Total number of repairs for a percentage of malfunctions against the total inventory of Intelligent Transportation Systems.
A
1 per 2 years
B
1 per year
C
2 per year
D
3 per year
F
4 per year
Outcome Thresholds Service Level
Comments: Reporting period is July 1 __ through June 30 __.Do not include 3rd party damages or lightning stirikes as these are not an indicator of the asset condition.
Priority Rank 9
Data Source SIMMS database, with regional concurrance.
4-16

Maintenance Accountability ProcessPerfomance Measures
Group -
Activity Number: 7B1
Activity Name: Rest Area Operations
Outcome Unit: Score
Survey Period: Yearly Detail Level: Statewide
Indicator: Cleanliness of building, non-functional building/utility systems (hand dryer, soap dispenser, RV dump station), appearance of landscaped areas, and sidewalks and pavement.
Outcome Measure: Condition score. See MAP Rest Area Survey Form.
A
<5
B
6 - 9
C
10 - 13
D
14 - 17
F
>17
Outcome Thresholds Service Level
Comments: Reporting Time
Priority Rank 17
Data Source HQ Rest Area Field Surveys-calendar year
Activity Number: 8B1
Activity Name: Employee Technical and Safety Training
Outcome Unit: None
Survey Period: Detail Level:
Indicator: None
Outcome Measure: None
A B C D F
Outcome Thresholds Service Level
Comments:
Priority Rank
Data Source
Activity Number: 8B2
Activity Name: Support and Testing
Outcome Unit: None
Survey Period: Detail Level:
Indicator: None
Outcome Measure: None
A B C D F
Outcome Thresholds Service Level
Comments:
Priority Rank
Data Source
4-17

Maintenance Accountability ProcessPerfomance Measures
Group -
Activity Number: 9B1
Activity Name: 3rd Party Damages
Outcome Unit: None
Survey Period: Detail Level:
Indicator: None
Outcome Measure: None
A B C D F
Outcome Thresholds Service Level
Comments:
Priority Rank
Data Source
Activity Number: 9B2
Activity Name: Emergency Response
Outcome Unit: None
Survey Period: Detail Level:
Indicator: None
Outcome Measure: None
A B C D F
Outcome Thresholds Service Level
Comments:
Priority Rank
Data Source
4-18
MAP Manual 4-19 March 2012
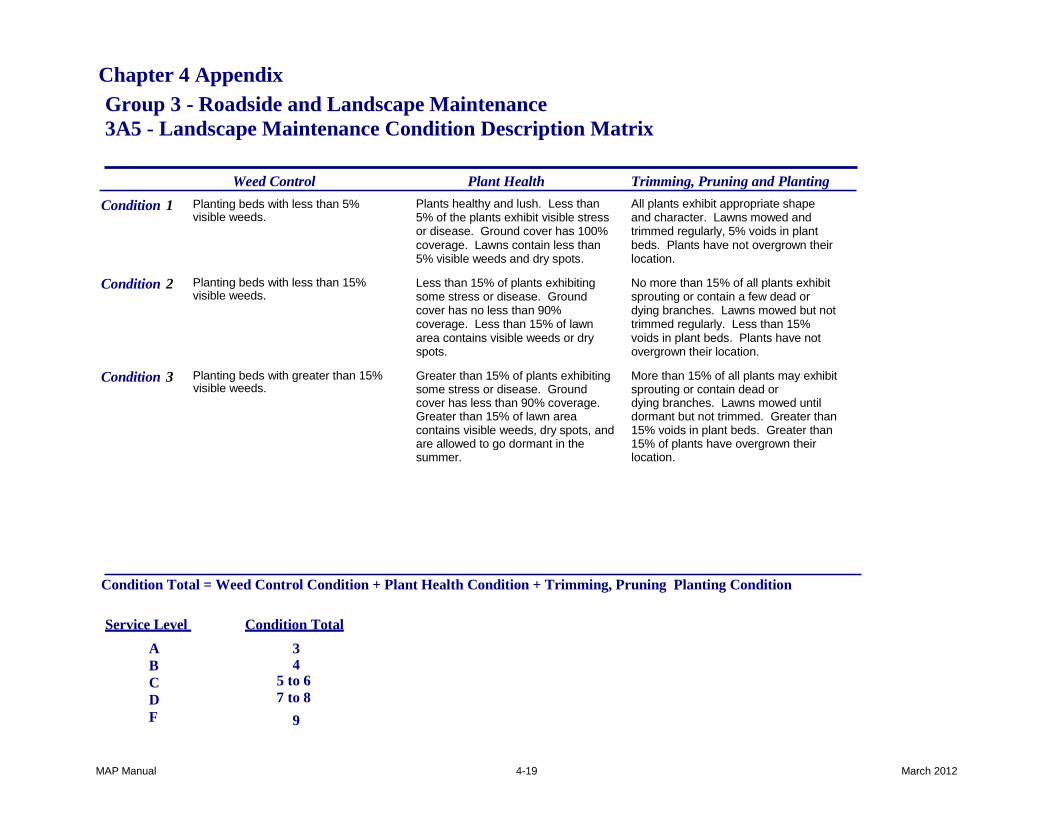
Chapter 4 Appendix Group 3 - Roadside and Landscape Maintenance 3A5 - Landscape Maintenance Condition Description Matrix
Weed Control Plant Health Trimming, Pruning and Planting Condition 1 Planting beds with less than 5%
visible weeds.
Condition 2 Planting beds with less than 15% visible weeds.
Condition 3 Planting beds with greater than 15% visible weeds.
Plants healthy and lush. Less than 5% of the plants exhibit visible stress or disease. Ground cover has 100% coverage. Lawns contain less than 5% visible weeds and dry spots.
Less than 15% of plants exhibiting some stress or disease. Ground cover has no less than 90% coverage. Less than 15% of lawn area contains visible weeds or dry spots.
Greater than 15% of plants exhibiting some stress or disease. Ground cover has less than 90% coverage. Greater than 15% of lawn area contains visible weeds, dry spots, and are allowed to go dormant in the summer.
All plants exhibit appropriate shape and character. Lawns mowed and trimmed regularly, 5% voids in plant beds. Plants have not overgrown their location.
No more than 15% of all plants exhibit sprouting or contain a few dead or dying branches. Lawns mowed but not trimmed regularly. Less than 15% voids in plant beds. Plants have not overgrown their location.
More than 15% of all plants may exhibit sprouting or contain dead or dying branches. Lawns mowed until dormant but not trimmed. Greater than 15% voids in plant beds. Greater than 15% of plants have overgrown their location.
Condition Total = Weed Control Condition + Plant Health Condition + Trimming, Pruning Planting Condition
Service Level A B C D F
Condition Total 34
5 to 6 7 to 8
9

MAP Manual 4-20 March 2012
Chapter 4 Appendix Group 4 - Bridge Maintenance 4A3 - Bridge Cleaning Condition Description Matrix
Decks and Sidewalks Grates and Drains Rails, Girders, Trusses, Piers Abutments
Condition 1 Free of visible sand and debris. Free of visible sand & debris.
Free of graffiti, moss, bird droppings, rust or other surface dirt.
Condition 2 Less than 10% of surface area covered with sand or debris.
Less than 5% blocked or partially blocked.
Less than 10% of bridge surface covered with graffiti, moss, bird droppings, rust or other surface dirt.
Condition 3 Less than 20% of surface area covered with sand or debris.
Less than 10% blocked or partially blocked.
Less than 30% of bridge surface covered with graffiti, moss, bird droppings, rust or other surface dirt.
Condition 4 Less than 40% of surface area covered with sand or debris.
Less than 20% blocked or partially blocked.
Less than 50% of bridge surface covered with graffiti, moss, bird droppings, rust or other surface dirt.
Condition 5 Greater than 40% of surface area covered with sand or debris.
More than 20% blocked or partially blocked
More than 50% of bridge surface covered with graffiti, moss, bird droppings, rust or other surface dirt.
Condition Total=Decks and Sidewalks + Graffiti+ Grates and Drains
Service Level Condition Total
A 4 B 5 to 7 C 8 to 10 D 11 to 13 F 14-16 or more
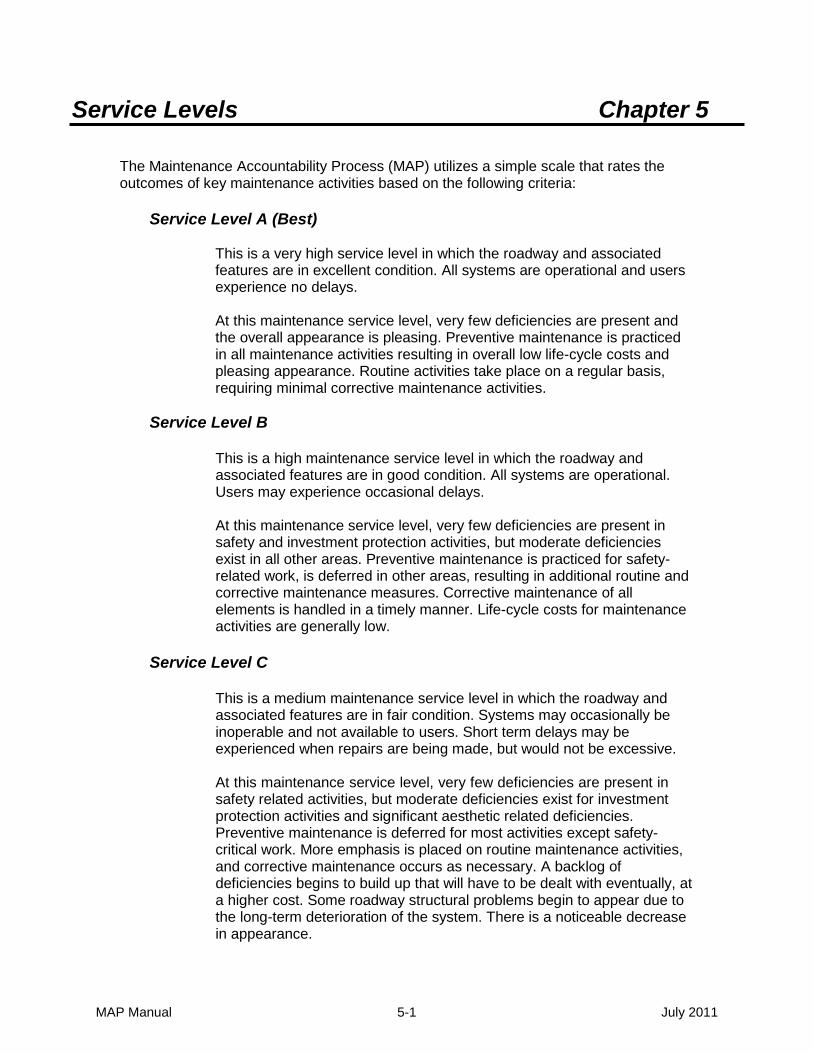
MAP Manual 5-1 July 2011
Service Levels Chapter 5
The Maintenance Accountability Process (MAP) utilizes a simple scale that rates the outcomes of key maintenance activities based on the following criteria:
Service Level A (Best)
This is a very high service level in which the roadway and associated features are in excellent condition. All systems are operational and users experience no delays.
At this maintenance service level, very few deficiencies are present and the overall appearance is pleasing. Preventive maintenance is practiced in all maintenance activities resulting in overall low life-cycle costs and pleasing appearance. Routine activities take place on a regular basis, requiring minimal corrective maintenance activities.
Service Level B
This is a high maintenance service level in which the roadway and associated features are in good condition. All systems are operational. Users may experience occasional delays.
At this maintenance service level, very few deficiencies are present in safety and investment protection activities, but moderate deficiencies exist in all other areas. Preventive maintenance is practiced for safety- related work, is deferred in other areas, resulting in additional routine and corrective maintenance measures. Corrective maintenance of all elements is handled in a timely manner. Life-cycle costs for maintenance activities are generally low.
Service Level C
This is a medium maintenance service level in which the roadway and associated features are in fair condition. Systems may occasionally be inoperable and not available to users. Short term delays may be experienced when repairs are being made, but would not be excessive.
At this maintenance service level, very few deficiencies are present in safety related activities, but moderate deficiencies exist for investment protection activities and significant aesthetic related deficiencies. Preventive maintenance is deferred for most activities except safety- critical work. More emphasis is placed on routine maintenance activities, and corrective maintenance occurs as necessary. A backlog of deficiencies begins to build up that will have to be dealt with eventually, at a higher cost. Some roadway structural problems begin to appear due to the long-term deterioration of the system. There is a noticeable decrease in appearance.

MAP Manual 5-2 July 2011
Service Level D
This is a low maintenance service level in which the roadway and associated features are kept in generally poor condition. Systems failures occur regularly because it is impossible to react in a timely manner to all problems. Occasionally delays may be significant.
At this maintenance service level, moderate deficiencies are present in safety related activities, and significant deficiencies exist for all other activities. Little preventive maintenance is accomplished. Maintenance has become very reactionary and places emphasis on correcting problems as they occur. A significant backlog of deficiencies will begin to build up that will have to be dealt with eventually, at a much higher cost. . Safety problems begin to appear that increase risk and liability, and significant roadway structural deficiencies exist that accelerate the long- term deterioration of the system. The overall appearance is very poor.
Service Level F (Worst)
This is a very low service level in which the roadway and associated features are kept in poor and failing condition. A backlog of systems failures would occur because it is impossible to react in a timely manner to all problems. Significant delays occur on a regular basis.
At this maintenance service level, significant deficiencies are present in all maintenance activities. The overall appearance is not aesthetically pleasing. Preventive maintenance is not practiced for any maintenance activities. Maintenance is totally reactive, and places emphasis on correcting problems after they occur. Significant backlogs of maintenance deficiencies exist. Excessive safety problems occur. Road conditions are such that maintenance treatments are not enough to correct the deficiencies that exist, necessitating additional high-cost remedial construction preservation projects in the future. Overall maintenance operations are at their highest life-cycle costs.
The chart on the following page gives a pictorial view of the relationship between the level of investment, level of delivery and service level outcome. Level of investment means how much money is budgeted. This budget pays for the resources (labor, equipment and materials) required to achieve our goals. More money equals more resources equals a higher LOS; less money equals fewer resources equals a lower LOS.
Following the chart, pictures and narration provide examples of service levels for each group of activities.

MAP Manual 5-3 July 2011
Service Level Effectiveness Model
MMAAPPAA
SSEERRVVIICCEE LLEEVVEELL OOUUTTCCOOMMEEBB
CC
DDSSeerrvviiccee LLeevveell NNuummeerriicc SSccaallee
FF
1.0 1.9 2.0 2.9 3.0 3.9 4.0 4.9 5.0 5.9
LLEEVVEELL OOFF DDEELLIIVVEERRYYPreventive Routine
MaintenanceCorrective
Low HighLife Cycle Costs
Low HighProgram Priorities
Low HighDegree of Risk
More LessReliability
LL EEVV EE
LLOO
FFIN
VEST
MEN
TR
esou
rces
Less
Mor
e

MAP Manual 5-4 July 2011
GROUP 1 – Roadway Maintenance and Operations
Service Level - A
Pavement with few unrepaired potholes, ruts, or unsealed cracks. No drop-off at the pavement edge. The shoulder is generally clean and free of debris.
Service Level - B
Pavement has a minor amount of unrepaired potholes, ruts, or unsealed cracks. A minor amount of drop-off and minor erosion is at the pavement edge. The paved shoulder contains a small amount of debris build-up at the edge.
Service Level - C
Pavement has a moderate amount of unrepaired potholes, ruts, or unsealed cracks. A moderate amount of drop-off has developed from at the pavement edge with some erosion. The paved shoulder contains a noticeable debris build-up that may be unsightly.
Service Level - D
Pavement has a significant amount of unrepaired potholes, ruts or unsealed cracks. A significant drop-off has developed at the pavement edge with noticeable erosion. The paved shoulder contains significant debris that would restrict bicycle or pedestrian use, and be unsightly.
Service Level - F
Pavement has an extensive amount of unrepaired potholes, ruts, or unsealed cracks. Extensive erosion or drop-off has developed at the pavement edge. The paved shoulder contains debris build-up that would prevent bicycle and pedestrian use, be a hazard to vehicles, and be unsightly.
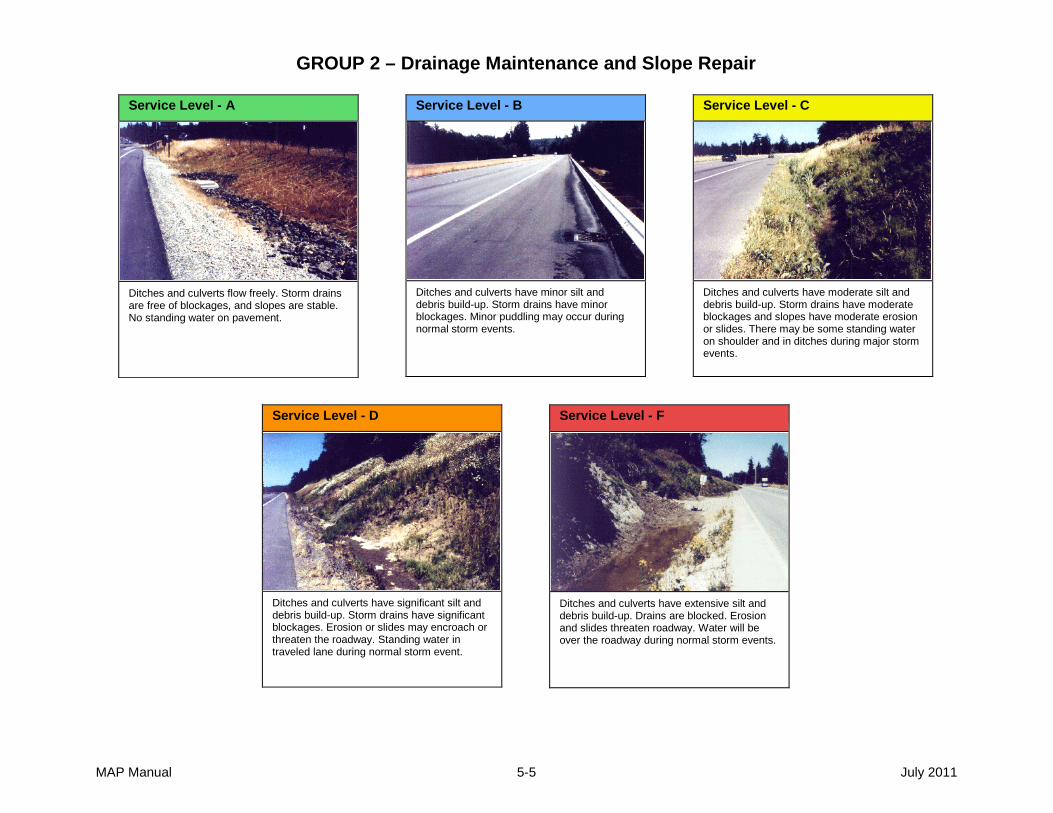
MAP Manual 5-5 July 2011
GROUP 2 – Drainage Maintenance and Slope Repair
Service Level - A
Ditches and culverts flow freely. Storm drains are free of blockages, and slopes are stable. No standing water on pavement.
Service Level - B
Ditches and culverts have minor silt and debris build-up. Storm drains have minor blockages. Minor puddling may occur during normal storm events.
Service Level - C
Ditches and culverts have moderate silt and debris build-up. Storm drains have moderate blockages and slopes have moderate erosion or slides. There may be some standing water on shoulder and in ditches during major storm events.
Service Level - D
Ditches and culverts have significant silt and debris build-up. Storm drains have significant blockages. Erosion or slides may encroach or threaten the roadway. Standing water in traveled lane during normal storm event.
Service Level - F
Ditches and culverts have extensive silt and debris build-up. Drains are blocked. Erosion and slides threaten roadway. Water will be over the roadway during normal storm events.

MAP Manual 5-6 July 2011
GROUP 3 – Roadside and Landscape Maintenance
Service Level - A
Roadside has minimal visible litter, no noxious weeds, nuisance vegetation, or vegetation obstructions. Ditch lines, guardrail, signs and sight lines are completely visible.
Service Level - B
Roadside has a minor amount of visible litter, noxious weeds, nuisance vegetation, or vegetation obstructions. Ditch lines, guardrail, signs, and sight lines are slightly obscured by encroaching vegetation.
Service Level - C
Roadside has a moderate amount of visible litter, noxious weeds, nuisance vegetation, or vegetation obstructions. Vegetation is starting to encroach on the pavement edge, moderately obscuring ditch lines, guardrail, signs, and sight lines.
Service Level - D
Roadside has a significant amount of visible litter, noxious weeds, nuisance vegetation, or vegetation obstructions. Vegetation is encroaching on the pavement edge, significantly obscuring ditch lines, guardrail, signs, and sight lines.
Service Level - F
Roadside has a extensive amount of visible litter, noxious weeds, nuisance vegetation, or vegetation obstructions. Vegetation has encroached on the pavement, extensively obscuring ditch lines, guardrail, signs, and sight lines.
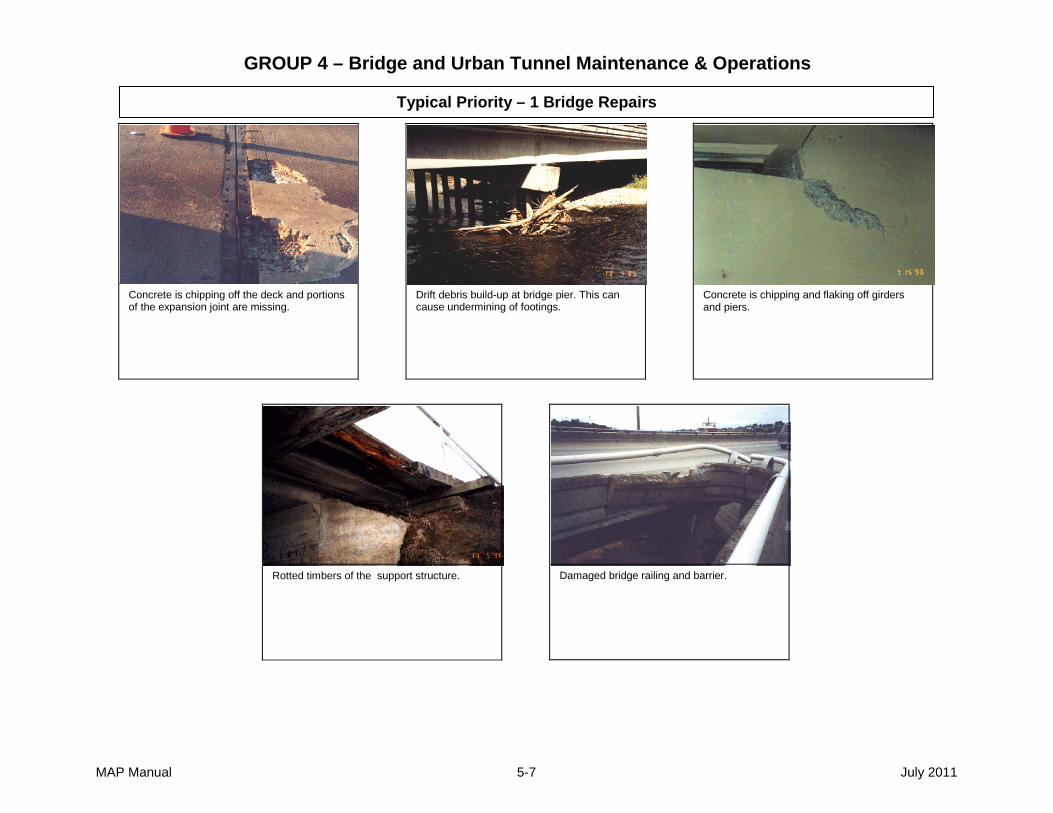
MAP Manual 5-7 July 2011
GROUP 4 – Bridge and Urban Tunnel Maintenance & Operations
Concrete is chipping and flaking off girders and piers.
Drift debris build-up at bridge pier. This can cause undermining of footings.
Concrete is chipping off the deck and portions of the expansion joint are missing.
Rotted timbers of the support structure.
Damaged bridge railing and barrier.
Typical Priority – 1 Bridge Repairs
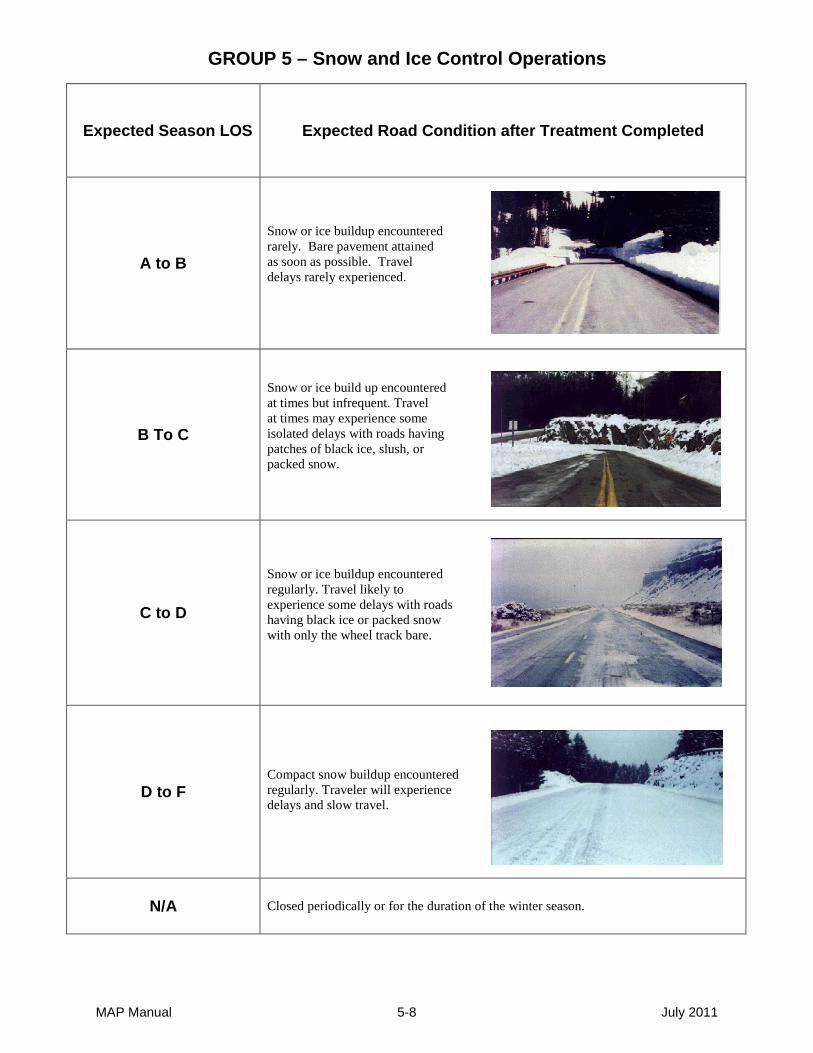
MAP Manual 5-8 July 2011
GROUP 5 – Snow and Ice Control Operations
Expected Season LOS
Expected Road Condition after Treatment Completed
A to B
Snow or ice buildup encountered rarely. Bare pavement attained as soon as possible. Travel delays rarely experienced.
B To C
Snow or ice build up encountered at times but infrequent. Travel at times may experience some isolated delays with roads having patches of black ice, slush, or packed snow.
C to D
Snow or ice buildup encountered regularly. Travel likely to experience some delays with roads having black ice or packed snow with only the wheel track bare.
D to F
Compact snow buildup encountered regularly. Traveler will experience delays and slow travel.
N/A
Closed periodically or for the duration of the winter season.
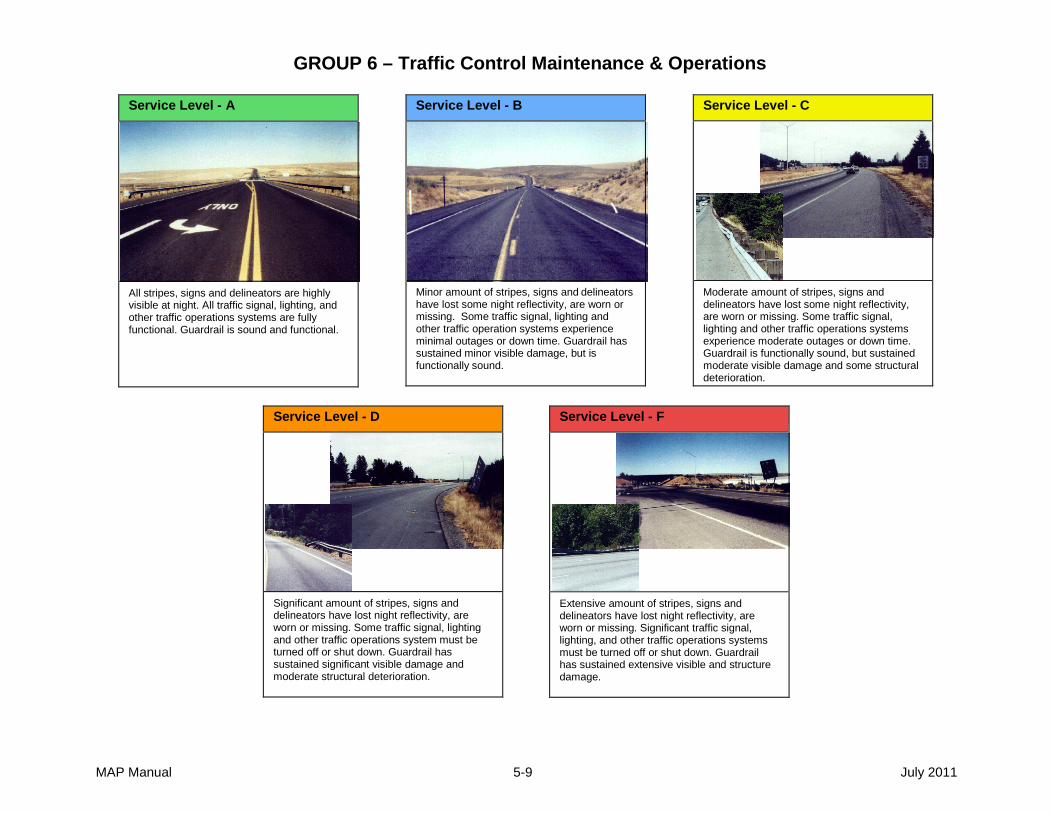
MAP Manual 5-9 July 2011
GROUP 6 – Traffic Control Maintenance & Operations
Service Level - A
All stripes, signs and delineators are highly visible at night. All traffic signal, lighting, and other traffic operations systems are fully functional. Guardrail is sound and functional.
Service Level - B
Minor amount of stripes, signs and delineators have lost some night reflectivity, are worn or missing. Some traffic signal, lighting and other traffic operation systems experience minimal outages or down time. Guardrail has sustained minor visible damage, but is functionally sound.
Service Level - C
Moderate amount of stripes, signs and delineators have lost some night reflectivity, are worn or missing. Some traffic signal, lighting and other traffic operations systems experience moderate outages or down time. Guardrail is functionally sound, but sustained moderate visible damage and some structural deterioration.
Service Level - D
Significant amount of stripes, signs and delineators have lost night reflectivity, are worn or missing. Some traffic signal, lighting and other traffic operations system must be turned off or shut down. Guardrail has sustained significant visible damage and moderate structural deterioration.
Service Level - F
Extensive amount of stripes, signs and delineators have lost night reflectivity, are worn or missing. Significant traffic signal, lighting, and other traffic operations systems must be turned off or shut down. Guardrail has sustained extensive visible and structure damage.

MAP Manual 5-10 July 2011
GROUP 7 – Rest Area Operations
Service Level - A
Rest rooms cleaned regularly to meet the highest standard for cleanliness. Water and sewer systems comply with current codes. All building facilities are functional, painted and free of graffiti. Site is free of litter. Grounds are neat and manicured.
Service Level - B
Rest rooms cleaned regularly as much as 2-3 times a day to meet most standards for cleanliness. Water and sewer systems comply with current codes. Buildings contain minor functional damage and some graffiti. Site contains a minor amount of litter. Grounds are clean but exhibits minor wear and damage.
Service Level - C
Rest rooms are cleaned regularly 1-2 times a day to meet moderate standards for cleanliness except in rest areas that receive the highest use. Water and sewer systems comply with current codes, but experience some breakdowns due to aging and wear. Buildings contain moderate functional damage and graffiti. Site contains a moderate amount of litter. Grounds exhibit moderate wear and damage.
Service Level - D
Rest rooms are cleaned only once a day to meet minimal standards for cleanliness except in rest areas that receive the highest use. Water and sewer systems comply with current codes, but experience frequent breakdowns forcing short term rest area closures. Buildings contain significant functional damage and graffiti. Site contains a significant amount of litter. Grounds exhibit significant wear and damage.
Service Level - F
Due to building, water or sewer system deficiencies, some rest areas are closed for extended periods. Portable toilets may be the only service provided. Grounds contain significant defects and extensive litter.

6-1
Planning Chapter 6 Maintenance Activity Priorities
Maintenance activities are prioritized according to their contribution to helping the program achieve specific policy objectives. These objectives are aligned with goals of the WSDOT Strategic Plan as follows:
*Safety: Reduce number of fatal and serious injuries (Goal 2) System Operation: Optimize highway system capacity (Goals 2 and 6) Environmental Stewardship (Goal 3) Maintain Highway Assets: Strategic Investment for Preservation and Maintenance (Goal 1) Address Legal Mandates and Obligations (Goals 1, 3, and 5) Comfort and Aesthetics (Goal 5) *The priority matrix is currently under review to align with the departments updated goals.
A 0 to 9 scale (9 being highest impact) is used to rate the impact of each maintenance activity on each policy objective. Each policy objective is represented by a multiplier. When the math is done, a numerical priority value is obtained. Priorities are set using these values, highest to lowest. This priority matrix is typically not used solely to make decisions about budget and program delivery decisions. However, it is a valuable tool when used in concert with various other tools/information in making such decisions.
The 2017-2019 Priority Matrix can be found at: http://www.wsdot.wa.gov/Maintenance/Accountability/.
Data Collection and Reporting
Data is collected in many different ways, depending on which activity is involved. See Chapter 4 for details about each activity, including the data source and when it is collected.
Field Surveys
Field condition surveys are conducted once a year, during the summer months, collecting data for 13 MAP activities. This data is used to assess the maintenance service levels regarding condition of highway assets that exist at a given point in time. Each region will have a dedicated survey team, with one alternate. Surveyors may collect data in their normally assigned area or section. The
6-2
teams will collect data according to the criteria in the Field Data Collection Manual (available online at) http://www.wsdot.wa.gov/Maintenance/Accountability/. Prior to 2016, we surveyed a number of randomly-selected locations sufficient to generate statistically-valid Level of Service reports for individual regions as well as our statewide program. In 2016, the number of locations was reduced so only a Level of Service report for the statewide program would be valid. This change was made to conserve resources as well as support the concept of focusing region performance measurement on the metric of task completion and relying on the asset condition metric to reflect the outcomes of maintenance work completed in concert with improvement and preservation work completed across the entire system. There are approximately 400 sites across the state randomly picked through a GIS program. The GIS model is based on the following: Sites are based on a HATS feature that is along the interstate or highway system; starting in 2016 culverts were the feature used. Sites remain 528 l.f. in length and all data is collected as it has been. Exclusions to survey locations include highways in cities over 25,000 population, National Parks, ramps, interchanges, and structures such as bridges.
Training is set up by HQ MAP personnel in conjunction with regional maintenance trainers/ MAP coordinators. Training is offered once a year, with training varying from statewide to westside/eastside, tor regional training prior to the field survey period. The training time is spent in the classroom and the other in the field. Additionally, HQ MAP personnel will spend time y with each team within the first two-three week of the survey period, working side by side with the teams as they conduct their surveys.
Quality Control/Quality Assurance “QA/QC” surveys are performed by HQ personnel alongside the regional surveyors, as they conduct their surveys. Field surveys will be completed with each regional team to help answer any questions and to increase the accuracy and consistency of data collection. The “QA/QC process will then continue to be complete as data is reviewed by both the field surveyors and HQ personnel.

6-3
HQ personnel will continue to review and process data looking for any discrepancies during processing. QA/QC will then continue with Regional crews (superintendents, assistant superintendents) being involved with reviewing data collected in their area. Any discrepancies can then be reviewed and updated through coordination with HQ personnel. Once field survey processing and review is completed and vetted with the regional areas, all findings will be conveyed through regional superintendent meetings and/or the year end Maintenance Engineers meeting.
Data Input An IPad application has been developed for MAP and is the only option for data collection. The device is used in the field and downloaded once the surveyors return to the office. Use of the IPad and options for reviewing after download will be covered in the training sessions.
Targets
In the early years of MAP, targets were established based on initial levels of service achieved. Decisions to adjust targets up or down were made at the discretion of the Regional Maintenance Engineers and the State Maintenance Engineer, working together on these decisions, once again, based on history and level of service achieved. This was changed during the 2007 Legislative Session. Legislators fine-tuned the targets and included them in LEAP Transportation Document 2007-C, thereby writing the targets for the 07-09 biennium into “legislation”. In the 09-11 biennium the Secretary of WSDOT lowered some MAP targets in response to budget constraints. The 2015-2017 targets are on the next page. The MAP targets are now out of the Legislative Leap document and are once again, at the discretion of the Regional Maintenance Engineers and the State Maintenance Engineer.
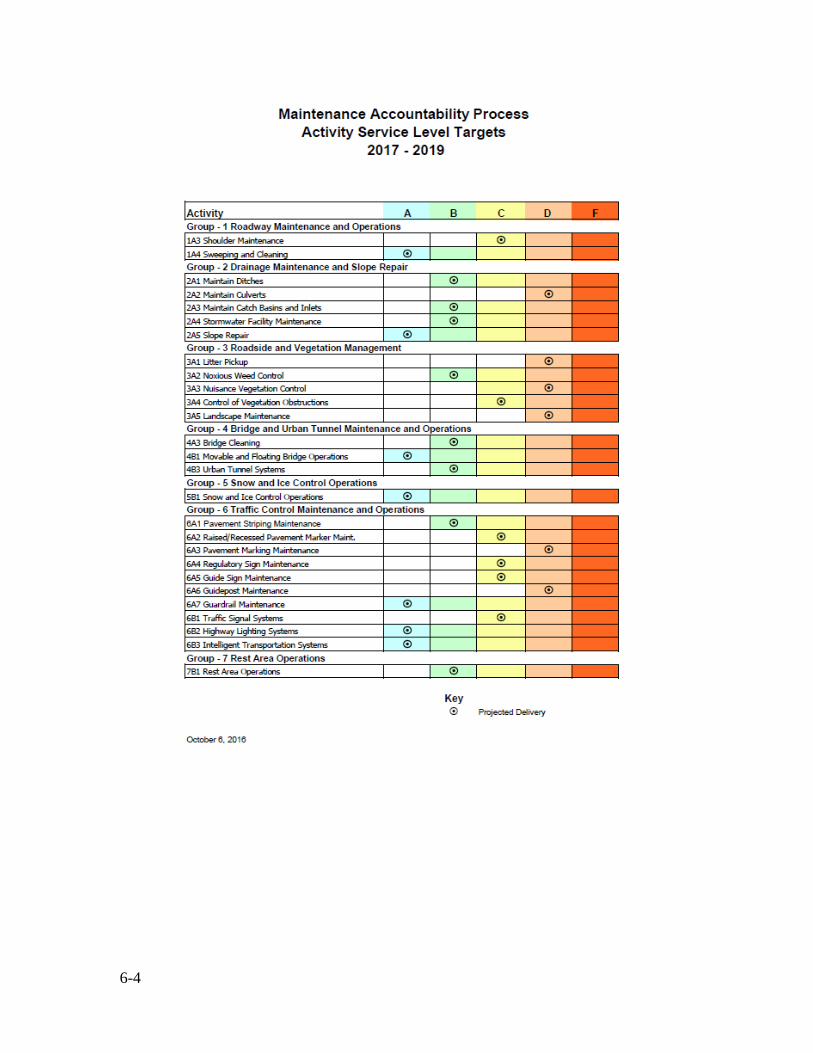
6-4
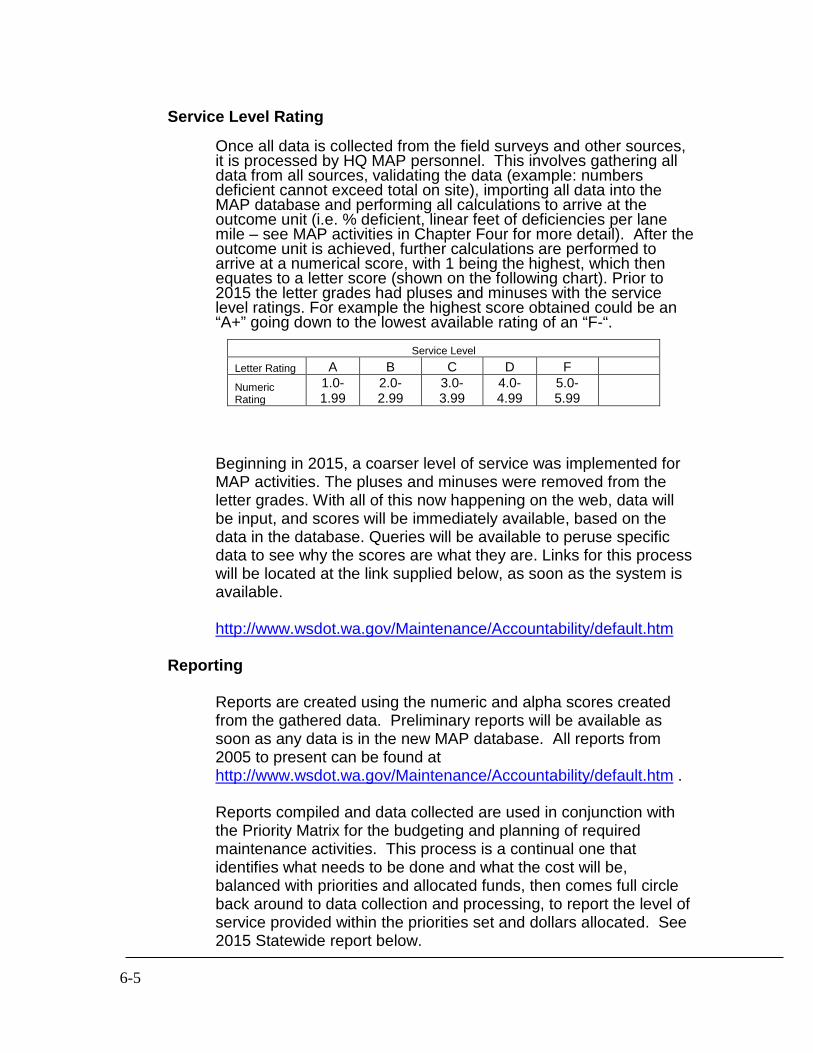
6-5
Service Level Rating
Once all data is collected from the field surveys and other sources, it is processed by HQ MAP personnel. This involves gathering all data from all sources, validating the data (example: numbers deficient cannot exceed total on site), importing all data into the MAP database and performing all calculations to arrive at the outcome unit (i.e. % deficient, linear feet of deficiencies per lane mile – see MAP activities in Chapter Four for more detail). After the outcome unit is achieved, further calculations are performed to arrive at a numerical score, with 1 being the highest, which then equates to a letter score (shown on the following chart). Prior to 2015 the letter grades had pluses and minuses with the service level ratings. For example the highest score obtained could be an “A+” going down to the lowest available rating of an “F-“.
Beginning in 2015, a coarser level of service was implemented for MAP activities. The pluses and minuses were removed from the letter grades. With all of this now happening on the web, data will be input, and scores will be immediately available, based on the data in the database. Queries will be available to peruse specific data to see why the scores are what they are. Links for this process will be located at the link supplied below, as soon as the system is available.
http://www.wsdot.wa.gov/Maintenance/Accountability/default.htm
Reporting
Reports are created using the numeric and alpha scores created from the gathered data. Preliminary reports will be available as soon as any data is in the new MAP database. All reports from 2005 to present can be found at http://www.wsdot.wa.gov/Maintenance/Accountability/default.htm . Reports compiled and data collected are used in conjunction with the Priority Matrix for the budgeting and planning of required maintenance activities. This process is a continual one that identifies what needs to be done and what the cost will be, balanced with priorities and allocated funds, then comes full circle back around to data collection and processing, to report the level of service provided within the priorities set and dollars allocated. See 2015 Statewide report below.
Service Level Letter Rating A B C D F Numeric Rating
1.0-1.99
2.0-2.99
3.0-3.99
4.0-4.99
5.0-5.99
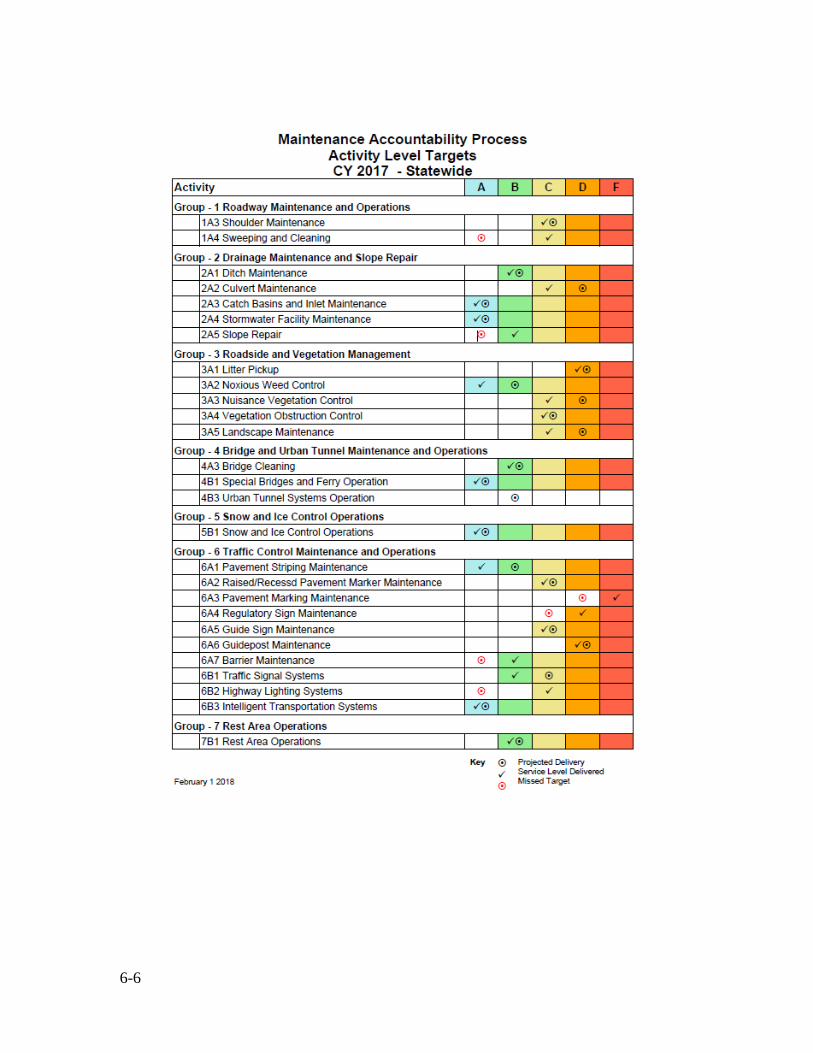
6-6
6-7
Inventories and Databases
As the MAP has evolved, it has become apparent that inventories should play a major role in planning and execution of this process. Unfortunately, a complete inventory of all WSDOT features does not exist at this time. Existing data sources used for MAP are:
Data Sources: Signal Maintenance Management System (SIMMS) – contains all location, preventive maintenance and repair information for Signals, Intelligent Transportation Systems (ITS) and Illumination. Traffic Sign Management System (TSMS) – contains sign location info, sign description info, sign materials, post materials, and maintenance history (reasons and actions). MPET – Maintenance Productivity Enhancement Tool- contains all information for Urban Tunnels, all movable bridges, plus the two Tacoma Narrows Bridges, per the Operating Manuel for each bridge, including schedules and completion of preventive maintenance tasks and all repairs. Also, four regions have added their fixed bridges, with three regions using MPET for all of their bridges data needs. The Bridge Preservation Office (BPO) has a database containing information (location, type of structure, BPO inspections, maintenance reports and much more) for all bridges statewide. A pilot project is in development between BPO and MPET, to allow the exchange of information from the Bridge Repair List that will permit the bridge crews to access their work requirements much quicker and provide the results back to BPO in a more expedient manner. HATS- Highway Asset Tracking System is designed to be a tool for managing Maintenance activities by asset and/or roadway section. The system connects to Highway Features (HF) where the asset information of the agency is stored (ex. Asset ID, Name and location). Maintenance Technicians, using an IPad, will use this program to document their work, while building/maintaining the inventory in HATS at the same time. When doing an inspection on an asset, they will have the capability to add the asset, and/or generate a pending activity, recording deficiencies which require action to be taken. The action could be anything from making a specific repair, cleaning, or making a recommendation for a larger repair. The system will track when, where and what was inspected; if a pending activity was generated from the inspection, when the

6-8
pending activity was completed, or if it remains to be completed. The system will also track multiple work activities within a section of roadway. An example of this is Safety Patrol, where multiple activities are done on a given section of roadway. The system will create a pending repair for those items that cannot be completed at the time of the safety patrol SKIPLINE-uses a data logger on board the paint stripe trucks to report work completed, locations of work, and the application rates.
MAP Team
Currently there is not a MAP team with representatives from each Region. Current members of the HQ MAP Team are: Headquarters Kelly Shields Jeffry Gibson