Embed Size (px)
Citation preview
1
MAP PROJECT OF FONGAFALE ISLAND, FUNAFUTI
ATOLL, TUVALU
Hajime KAYANNE University of Tokyo
Hiroya YAMANO National Institute of Environmental Studies
Hiromune YOKOKI Ibaraki University
Yuji KUWAHARA Ibaraki University
Daisaku SATO Ibaraki University
2
Table of contents
1. Introduction
2. Contents of the map
3. Construction of the basic map
4. Digital data set
5. Combination examples for adaptation
5.1 Nearshore hazard
5.2 Agriculture
5.3 Inundation
6. Conclusion
Acknowledgement
3
1. Introduction The map is fundamental tool for local resident and island management. Therefore the
contents of the map should be updated latest information and not only the natural factors but also the
artificial factors should be included. In addition it is useful for considering the adaptation that the
map includes additional information that indicates the present and future influences in some fields
that will be caused by the sea-level rise. Fongafale Island, target site of the project, has the simple
map of facilities and topographic characteristic and the bathymetric map. However there is no map
that includes the island elevation and integrates some information. In addition, the digital dataset for
periodic update of the map is not adjusted for easy use. Then, this project constructed the basic map
and the applied map for adaptation on Fongafale Island of Funafuti Atoll, as well as the digital
dataset based on the ArcGIS.
Fundamental contents such as road, buildings, and elevation contour should be included in
the daily and widely usable map. All of contents included in the basic map are able to revise easily
on the general PC in which ArcGIS was installed. Even if ArcGIS is not available, the provided data
can be converted to the other GIS software format easily.
Adaptation against the sea-level rise is a big subject in many fields. Although estimation
and evaluation of local influence of sea-level rise are significant, it is difficult to grasp plural
information without an integrated result. Then, this project constructed the applied maps for
adaptation in the field of nearshore hazard, inundation, and agriculture which were based on the
digital dataset. The constructed maps provide not only precious information to management officers
in each field but also an example of application of the provided data of island contents. It is desired
the applied map of other field which was not focused by the project will be constructed using the
method conducted in this project.
4
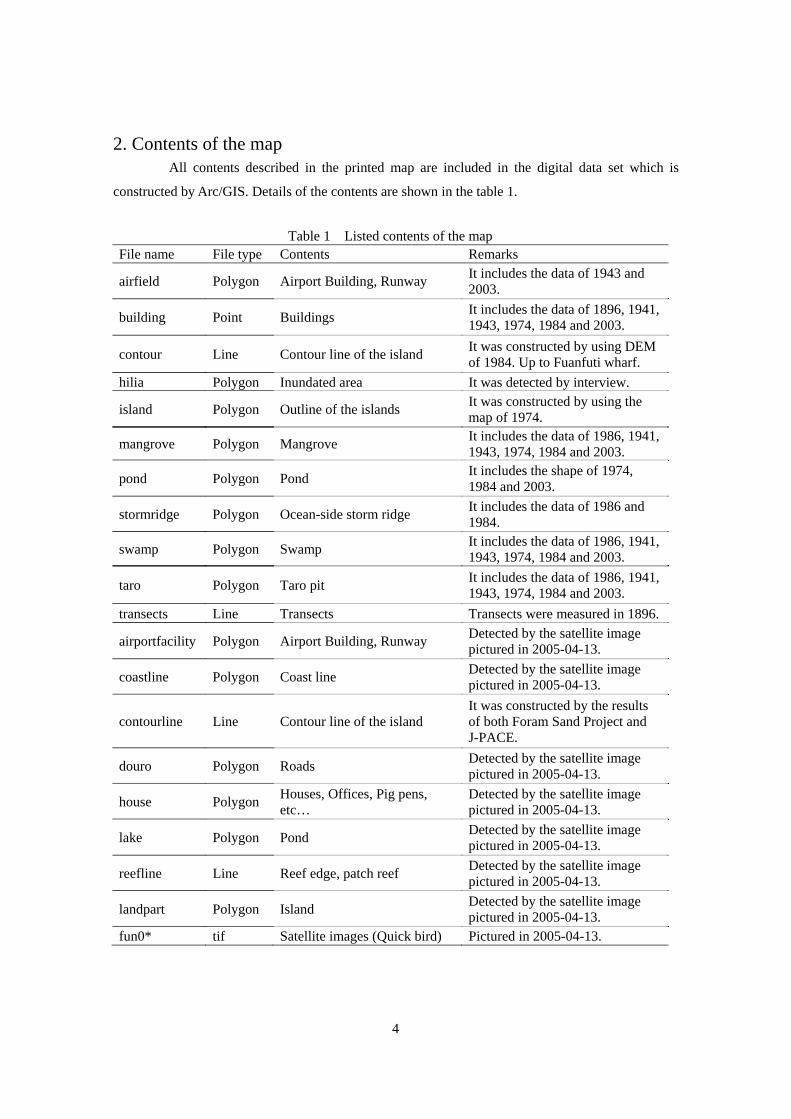
2. Contents of the map All contents described in the printed map are included in the digital data set which is
constructed by Arc/GIS. Details of the contents are shown in the table 1.
Table 1 Listed contents of the map File name File type Contents Remarks
airfield Polygon Airport Building, Runway It includes the data of 1943 and 2003.
building Point Buildings It includes the data of 1896, 1941, 1943, 1974, 1984 and 2003.
contour Line Contour line of the island It was constructed by using DEM of 1984. Up to Fuanfuti wharf.
hilia Polygon Inundated area It was detected by interview.
island Polygon Outline of the islands It was constructed by using the map of 1974.
mangrove Polygon Mangrove It includes the data of 1986, 1941, 1943, 1974, 1984 and 2003.
pond Polygon Pond It includes the shape of 1974, 1984 and 2003.
stormridge Polygon Ocean-side storm ridge It includes the data of 1986 and 1984.
swamp Polygon Swamp It includes the data of 1986, 1941, 1943, 1974, 1984 and 2003.
taro Polygon Taro pit It includes the data of 1986, 1941, 1943, 1974, 1984 and 2003.
transects Line Transects Transects were measured in 1896.
airportfacility Polygon Airport Building, Runway Detected by the satellite image pictured in 2005-04-13.
coastline Polygon Coast line Detected by the satellite image pictured in 2005-04-13.
contourline Line Contour line of the island It was constructed by the results of both Foram Sand Project and J-PACE.
douro Polygon Roads Detected by the satellite image pictured in 2005-04-13.
house Polygon Houses, Offices, Pig pens, etc…
Detected by the satellite image pictured in 2005-04-13.
lake Polygon Pond Detected by the satellite image pictured in 2005-04-13.
reefline Line Reef edge, patch reef Detected by the satellite image pictured in 2005-04-13.
landpart Polygon Island Detected by the satellite image pictured in 2005-04-13.
fun0* tif Satellite images (Quick bird) Pictured in 2005-04-13.
5
3. Construction of the basic map Basic map includes fundamental contents for not only the officers but also the residents
who are living in Fongafale Island. The map is constructed by latest and high-resolution satellite
images and the measured results of field investigation by Foram Sand Project, J-PACE and SOPAC.
For government officers, the basic map which includes infrastructure facilities and many of other
city components is quite useful and important to discuss the land management and development
strategy. For residents in Fongafale, the basic information on geomorphology such as the island
elevation and the bathymetry is useful for their daily life.
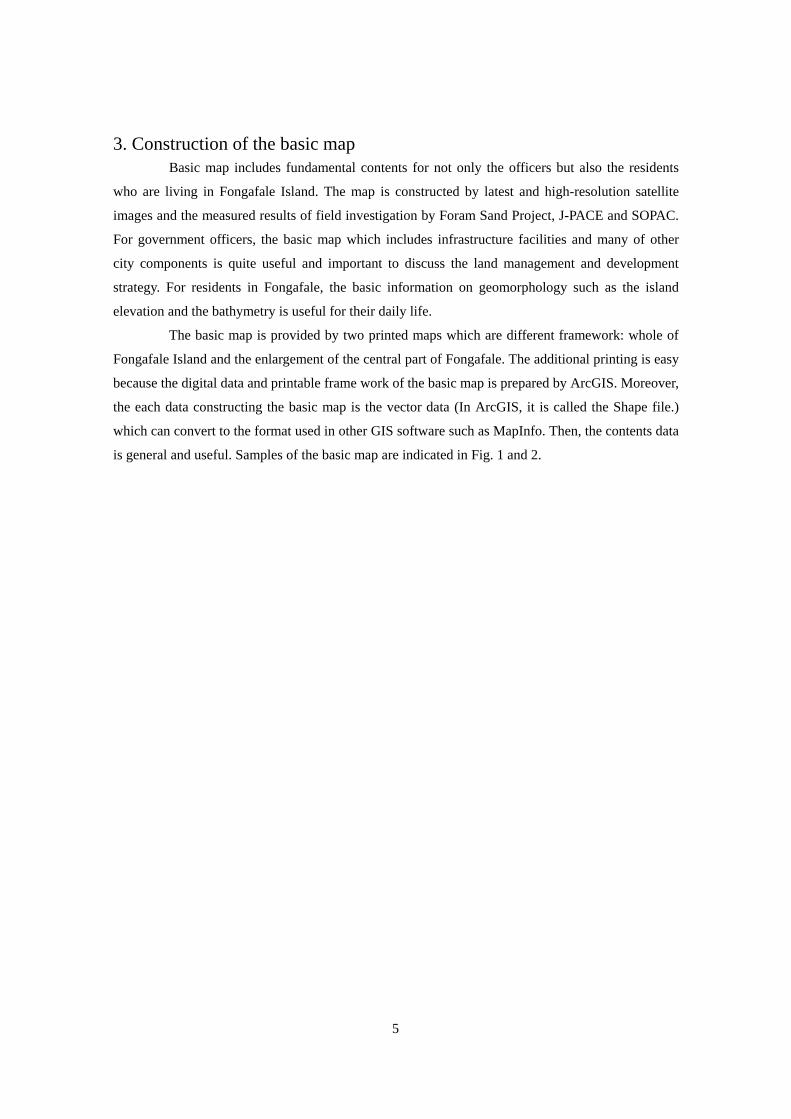
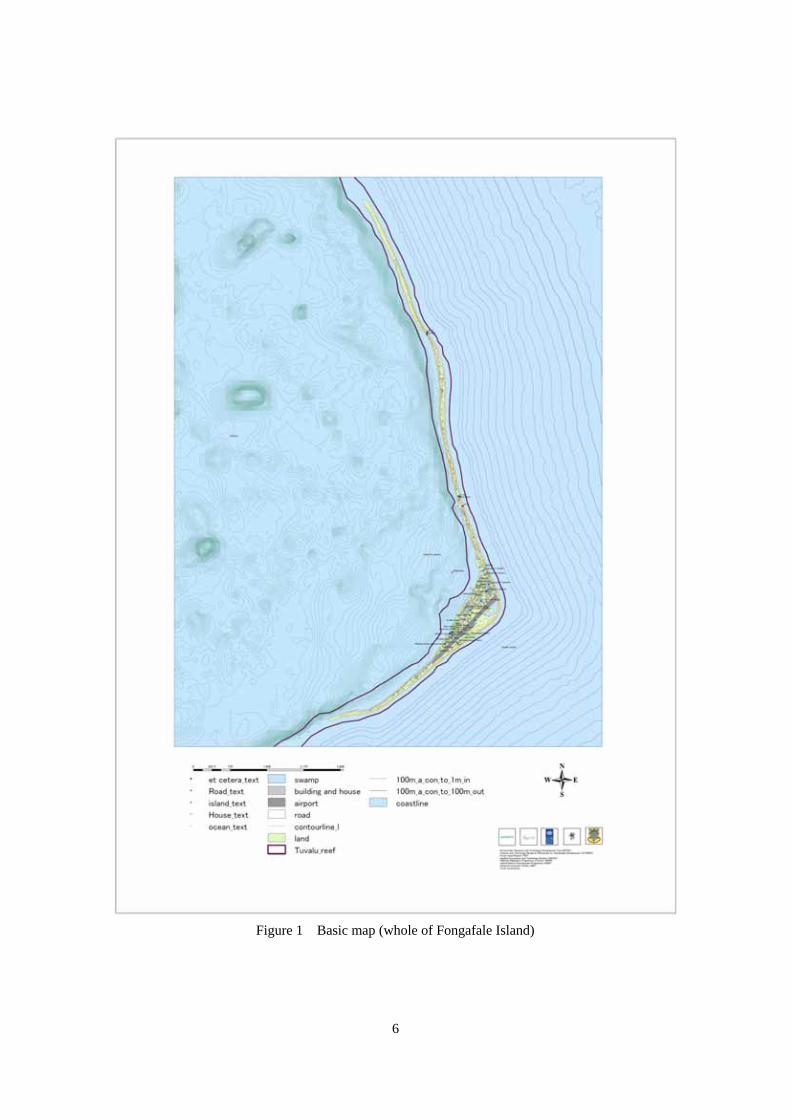
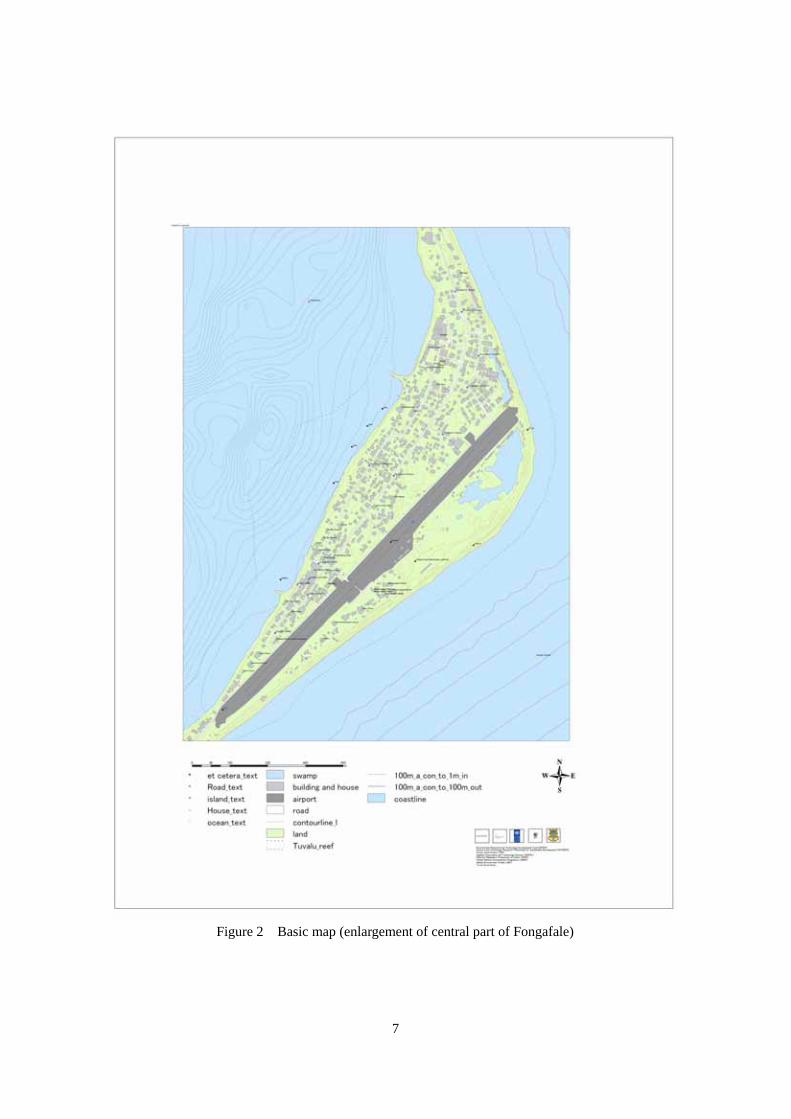
The basic map is provided by two printed maps which are different framework: whole of
Fongafale Island and the enlargement of the central part of Fongafale. The additional printing is easy
because the digital data and printable frame work of the basic map is prepared by ArcGIS. Moreover,
the each data constructing the basic map is the vector data (In ArcGIS, it is called the Shape file.)
which can convert to the format used in other GIS software such as MapInfo. Then, the contents data
is general and useful. Samples of the basic map are indicated in Fig. 1 and 2.
6
Figure 1 Basic map (whole of Fongafale Island)
7
Figure 2 Basic map (enlargement of central part of Fongafale)
8
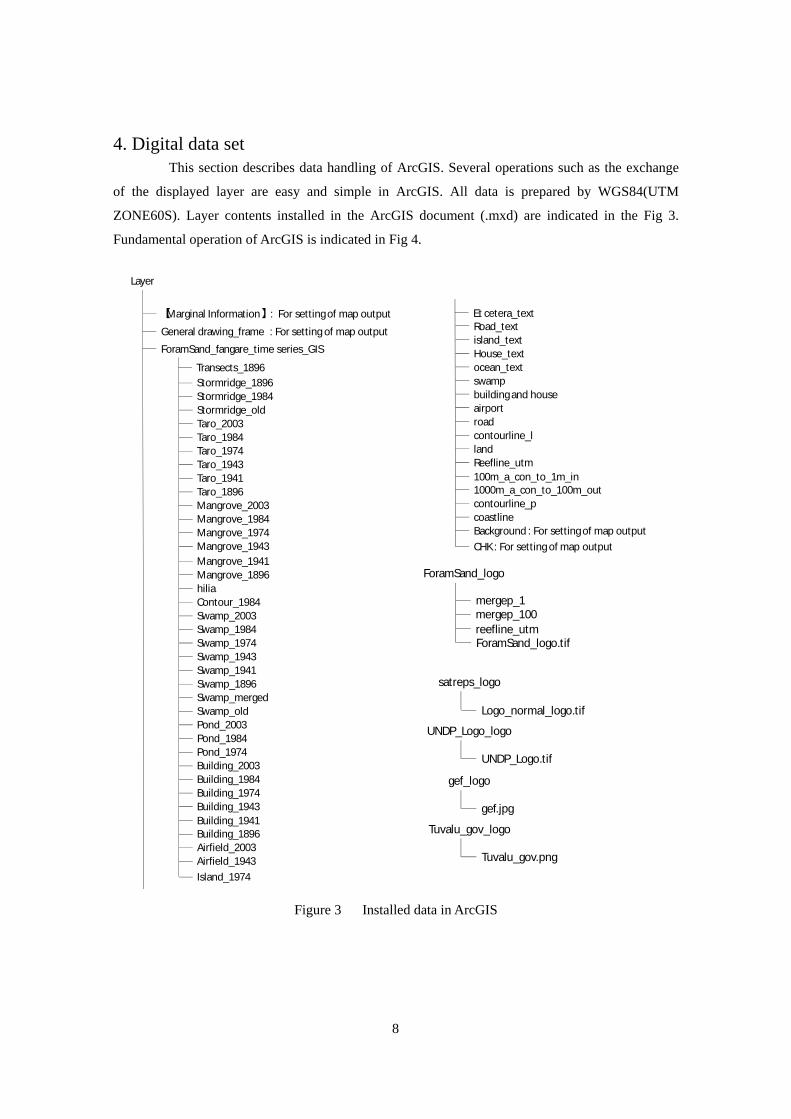
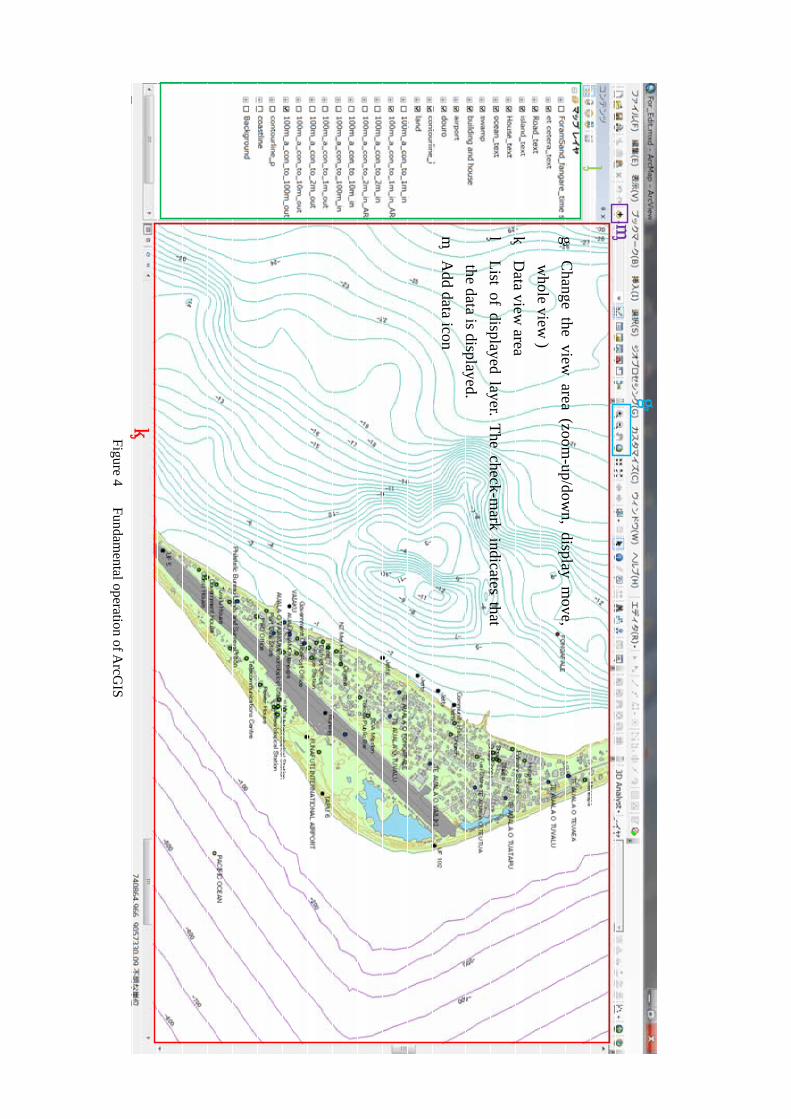
4. Digital data set This section describes data handling of ArcGIS. Several operations such as the exchange
of the displayed layer are easy and simple in ArcGIS. All data is prepared by WGS84(UTM
ZONE60S). Layer contents installed in the ArcGIS document (.mxd) are indicated in the Fig 3.
Fundamental operation of ArcGIS is indicated in Fig 4.
Layer
【Marginal Information】 : For setting of map output
General drawing_frame : For setting of map output
ForamSand_fangare_time series_GIS
Transects_1896Stormridge_1896Stormridge_1984Stormridge_oldTaro_2003Taro_1984Taro_1974Taro_1943Taro_1941Taro_1896Mangrove_2003Mangrove_1984Mangrove_1974Mangrove_1943Mangrove_1941Mangrove_1896hiliaContour_1984Swamp_2003Swamp_1984Swamp_1974Swamp_1943Swamp_1941Swamp_1896Swamp_mergedSwamp_oldPond_2003Pond_1984Pond_1974Building_2003Building_1984Building_1974Building_1943Building_1941Building_1896Airfield_2003Airfield_1943Island_1974
Et cetera_textRoad_textisland_textHouse_textocean_textswampbuilding and houseairportroadcontourline_llandReefline_utm100m_a_con_to_1m_in1000m_a_con_to_100m_outcontourline_pcoastlineBackground : For setting of map outputCHK : For setting of map output
ForamSand_logo
mergep_1mergep_100reefline_utmForamSand_logo.tif
satreps_logo
Logo_normal_logo.tif
UNDP_Logo_logo
UNDP_Logo.tif
gef_logo
gef.jpg
Tuvalu_gov_logo
Tuvalu_gov.png
Figure 3 Installed data in ArcGIS
9
① ②
③ ④
① C
hange the view area (zoom
-up/down, display m
ove,
whole view
)
② D
ata view area
③ L
ist of displayed layer. The check-m
ark indicates that
the data is displayed.
④ A
dd data icon
Figu
re 4 Fu
ndam
ental operation
of ArcG
IS
F
igure 4 Fundamental operation of A
rcGIS
10
5. Examples of application toward adaptation This section describes the application examples of the provided map data to consider the
adaptation against the sea-level rise. This project focused on the fields of the nearshore hazard,
inundation, and agriculture.
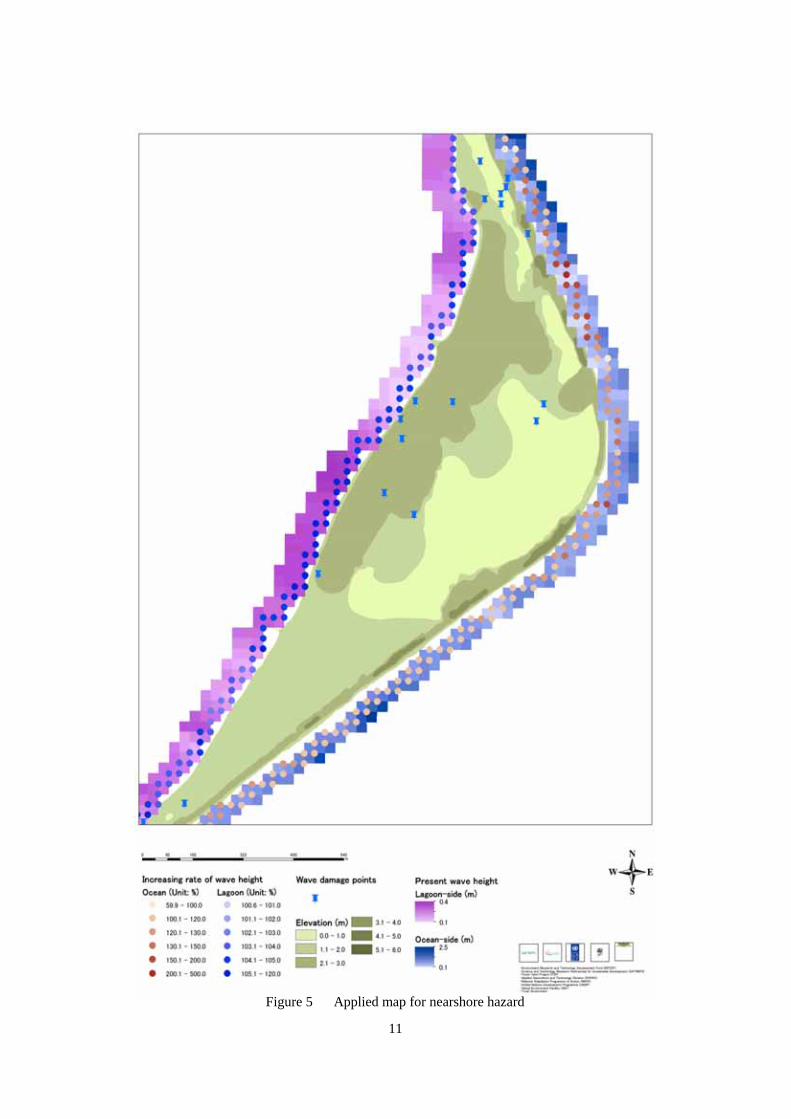
5.1 Nearshore hazard Nearshore hazard is the serious and general problem in atoll islands because almost all
residents live in coastal zone. In addition, it is indicated that the sea-level rise due to the global
warming will increase the nearshore wave height and it would cause the wave overtopping
frequently. The map provides the basic and important information for considering the adaptation
against the present and future wave overtopping (Fig 5).
This map focused on the wave overtopping, which is classified as one of the significant
problems in the nearshore hazard in the atoll islands, and showed the present wave damage points
and nearshore wave height, and future wave situation. Wave damage caused by the wave
overtopping was reported in the lagoon-side coast of middle of Fongafale Island and the ocean-side
of northern part. The difference of the materials in the lagoon-side coast seemed important for wave
damage because the lagoon-side coast with wave damage has higher elevation than the nearby area
and was calculated as same wave condition as nearby area. In the future, it was estimated that the
sea-level rise of 10cm makes wave height increase by 1.2 times as the maximum increase rate. In the
ocean-side, it is recognized that the northern part has the high wave height at the present and the
high increase rate in future. On the other hands, increase rate of future wave height in the southern
part of the ocean-side coast is lower than northern part. Countermeasure against the overtopping,
however, should be considered in this area because the storm ridge is quite low partly.
Contents of the map
Color map of elevation The data is constructed by the contour line of
elevation which is included in the basic map.
Wave damage points The wave damage points identified by the
questionnaire survey conducted by JPACE.
The present nearshore wave
height
The max wave height between the trade and
non-trade wind season which was calculated by
numerical simulation.
Increasing rate of wave height
Increasing rate of wave height which was calculated
by the present and the future wave field. The value of
sea-level rise in the future condition was considered of
10cm. 100% or more indicates that the wave height
increases higher than the present situation.
11
Figure 5 Applied map for nearshore hazard
12
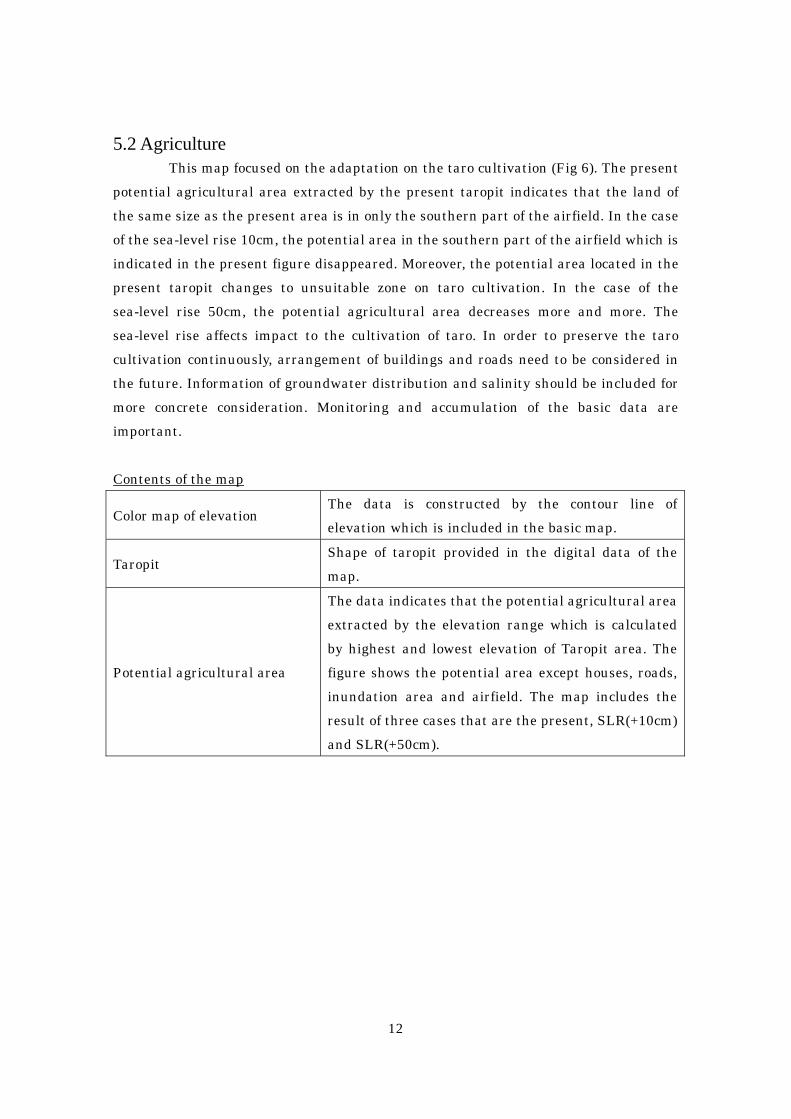
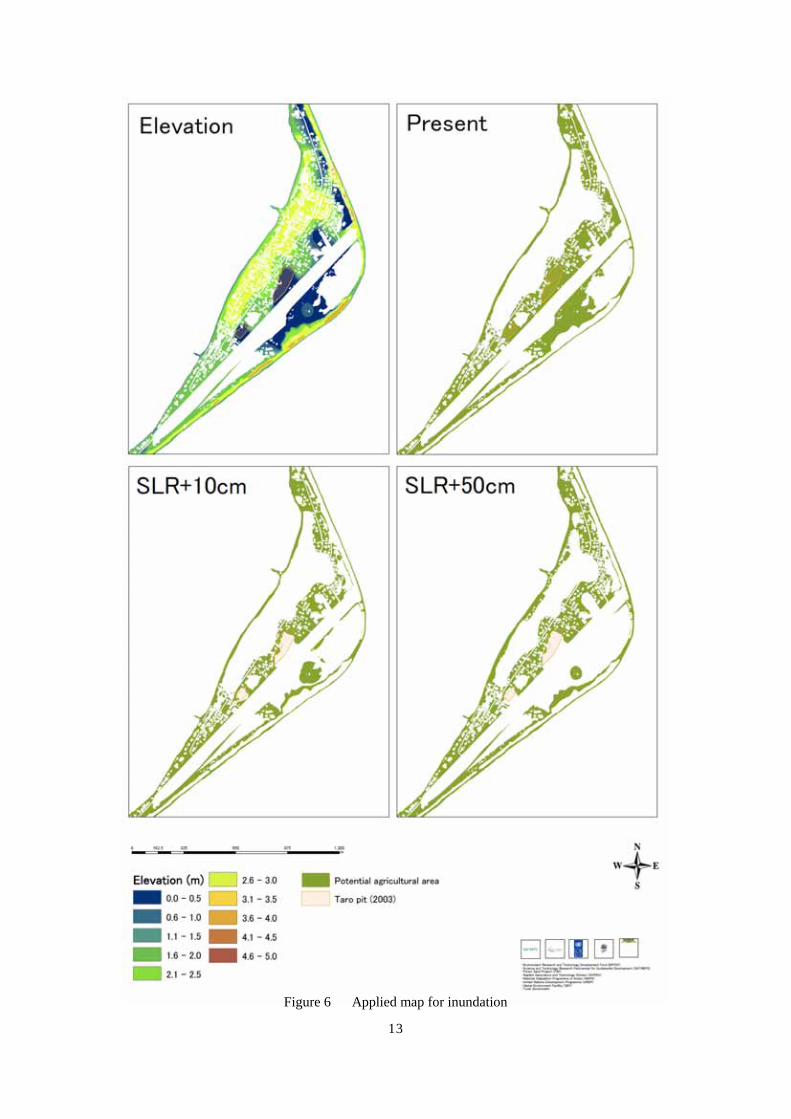
5.2 Agriculture This map focused on the adaptation on the taro cultivation (Fig 6). The present
potential agricultural area extracted by the present taropit indicates that the land of
the same size as the present area is in only the southern part of the airfield. In the case
of the sea-level rise 10cm, the potential area in the southern part of the airfield which is
indicated in the present figure disappeared. Moreover, the potential area located in the
present taropit changes to unsuitable zone on taro cultivation. In the case of the
sea-level rise 50cm, the potential agricultural area decreases more and more. The
sea-level rise affects impact to the cultivation of taro. In order to preserve the taro
cultivation continuously, arrangement of buildings and roads need to be considered in
the future. Information of groundwater distribution and salinity should be included for
more concrete consideration. Monitoring and accumulation of the basic data are
important.
Contents of the map
Color map of elevation The data is constructed by the contour line of
elevation which is included in the basic map.
Taropit Shape of taropit provided in the digital data of the
map.
Potential agricultural area
The data indicates that the potential agricultural area
extracted by the elevation range which is calculated
by highest and lowest elevation of Taropit area. The
figure shows the potential area except houses, roads,
inundation area and airfield. The map includes the
result of three cases that are the present, SLR(+10cm)
and SLR(+50cm).
13
Figure 6 Applied map for inundation
14
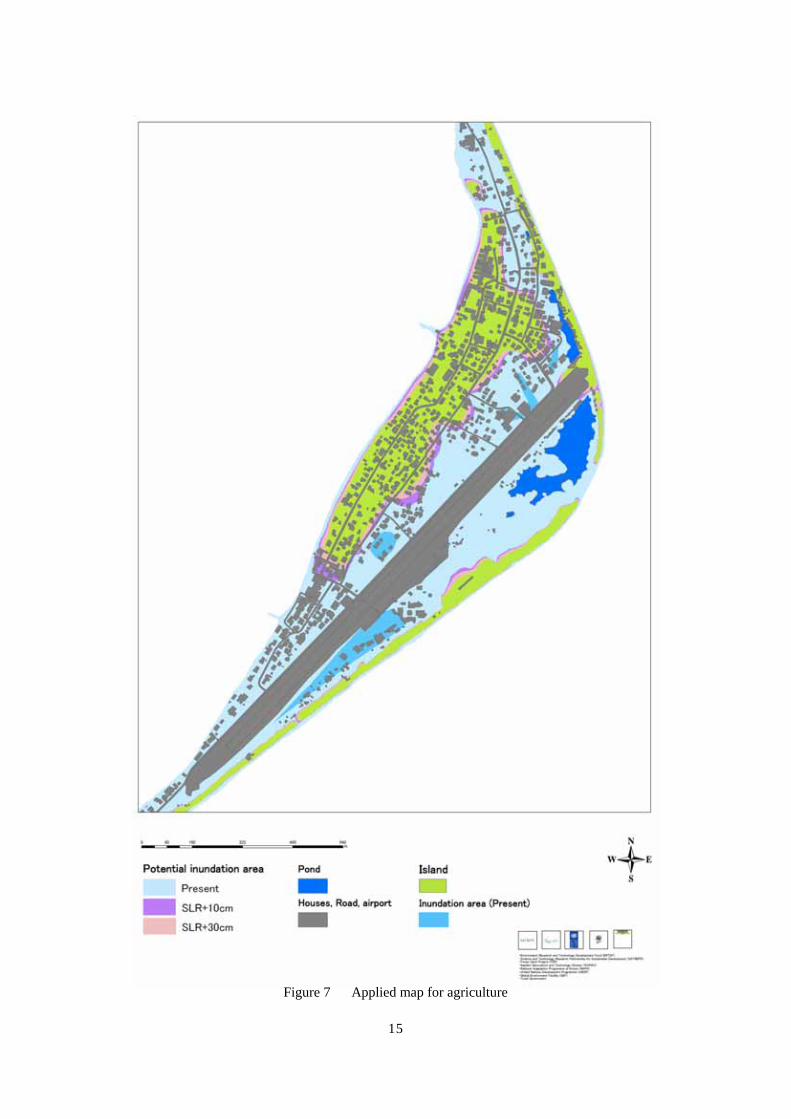
5.3 Inundation This map focused on the adaptation against the inundation (Fig 7). The potential
inundation area which was analyzed based on the elevation and present inundation area was
provided in the map. The area around the airfield is as same elevation as the present inundation area
and belongs to the potential inundation area. The sea-level rise expanded the potential inundation
area toward higher elevation. The results provide fundamental information for constructing the
future construction management plan of housing and facilities.
Calculated potential inundation area is extremely larger than the present inundation area,
because of lack of information such as the source and speed of inundation. Higher accurate
evaluation needs the detailed monitoring of inundation.
Contents of the map
Color map of island This data indicates material of the island (island
shape, road, airfield and pond).
Inundation area The data indicates inundation area which was
measured by local residents of Tuvalu.
Potential inundation area
The described data was calculated by the highest
inundated elevation which was extracted by using the
present inundation area. This data was constructed
based on the assumption that the island area below
the extracted elevation has potential of inundation.
The results about present, SLR(+10cm), and
SLR(+30cm) were provided in the map.
15
Figure 7 Applied map for agriculture
16
6. Conclusion This project provided the fundamental map that includes elevation contour and facilities
and infrastructure in addition to the map adoptable to considering the adaptation. In addition, the
digital data which is formed by not only the data included in the fundamental map but also the
historical data of pond, mangrove, elevation, buildings, and taropit was provided by the ArcGIS
format. It is easy to add the new and revised data to the digital dataset. Then, the digital dataset
should be revised periodically by local officers. Topographical and infrastructural data is essential
information for all of residents in Fongafale Island. And the latest situation of these data needs to be
understood. Periodic and continuous update of the map data is desired strongly.
Acknowledgement This project was supported by SATREPS and Technical support for NAPA with integrated
coastal management map of Fongafale Island (TUVALU), UNDP. In the revision process, officers of
Tuvalu government provided us a lot of valuable comments. Project members considerably
appreciate it.