Embed Size (px)
Citation preview
“Intrinsic value is the only logical approach to evaluate the relative attractiveness of
investments” - Warren E. Buffett
A software-as-a-service approach to map intrinsic value of world business
August, 2011
Efi Ben-Dor778-990-4015

Stocks follow intrinsic value
Dec-2008Dec-2009
March-2010June-2010
Dec-2010March-2011
June-2011
0.00
50.00
100.00
150.00
200.00
250.00
300.00
350.00
Capitalized IV-buyCapitalized IV-sellCapitalized-market
Sell range
Buy range
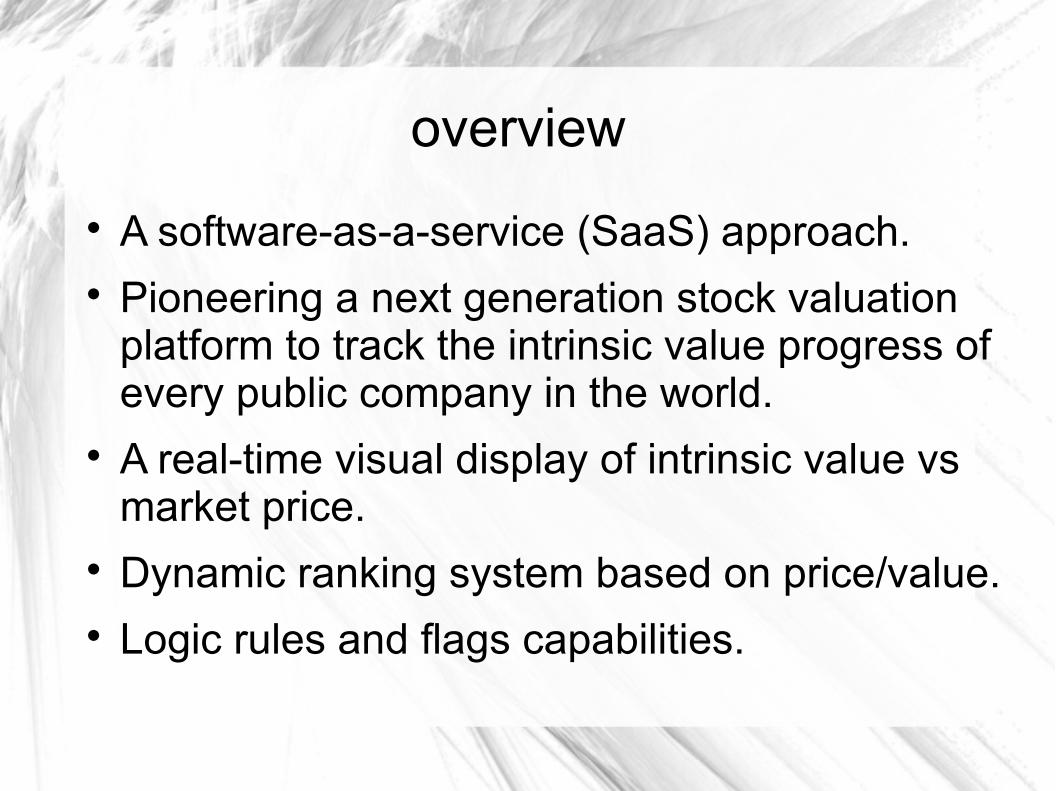
overview
A software-as-a-service (SaaS) approach. Pioneering a next generation stock valuation
platform to track the intrinsic value progress of every public company in the world.
A real-time visual display of intrinsic value vs market price.
Dynamic ranking system based on price/value. Logic rules and flags capabilities.
Intrinsic value
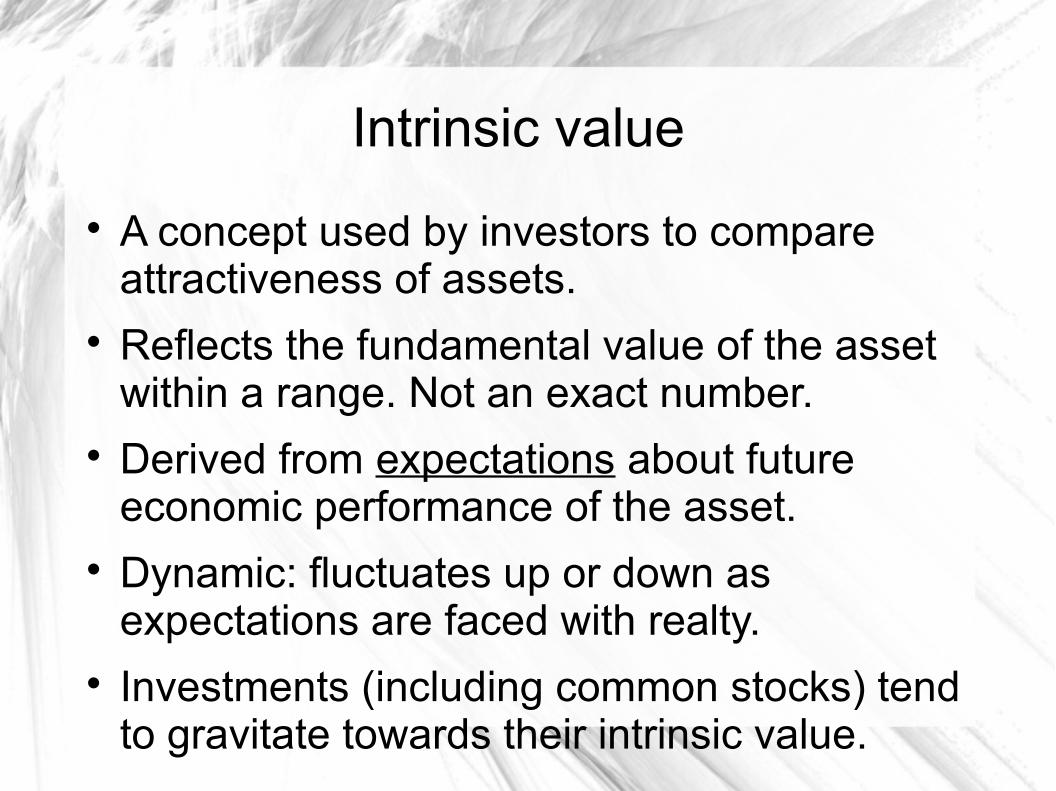
A concept used by investors to compare attractiveness of assets.
Reflects the fundamental value of the asset within a range. Not an exact number.
Derived from expectations about future economic performance of the asset.
Dynamic: fluctuates up or down as expectations are faced with realty.
Investments (including common stocks) tend to gravitate towards their intrinsic value.
Background
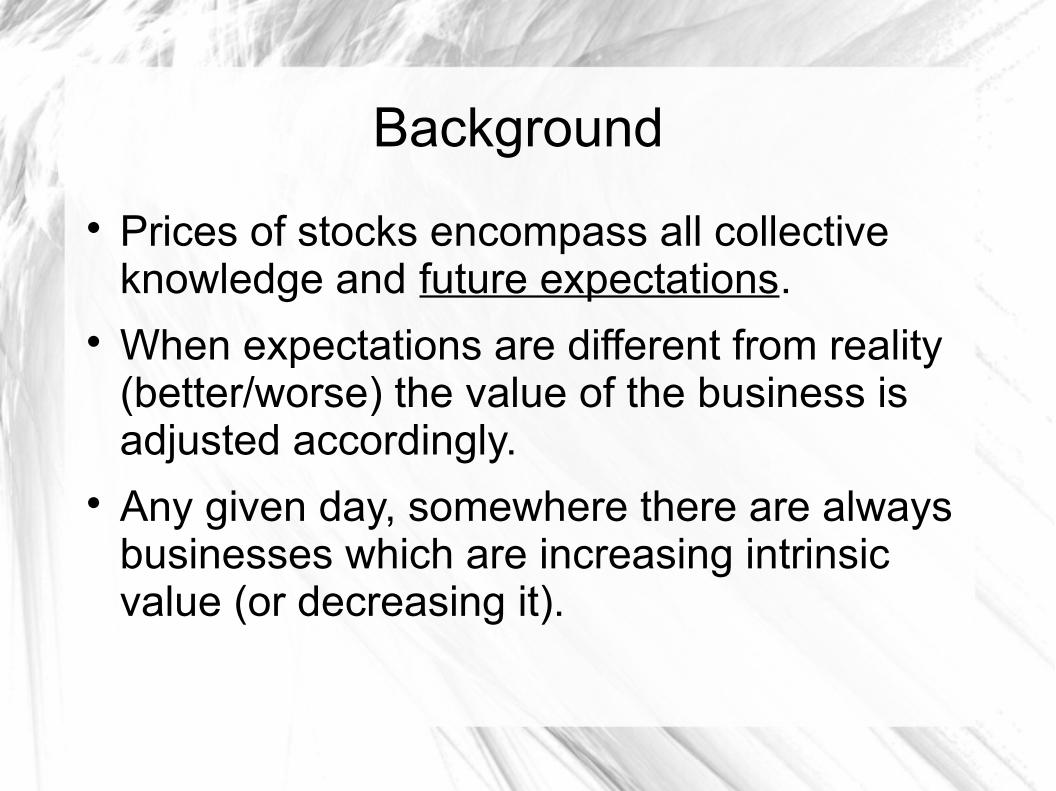
Prices of stocks encompass all collective knowledge and future expectations.
When expectations are different from reality (better/worse) the value of the business is adjusted accordingly.
Any given day, somewhere there are always businesses which are increasing intrinsic value (or decreasing it).
Challenges
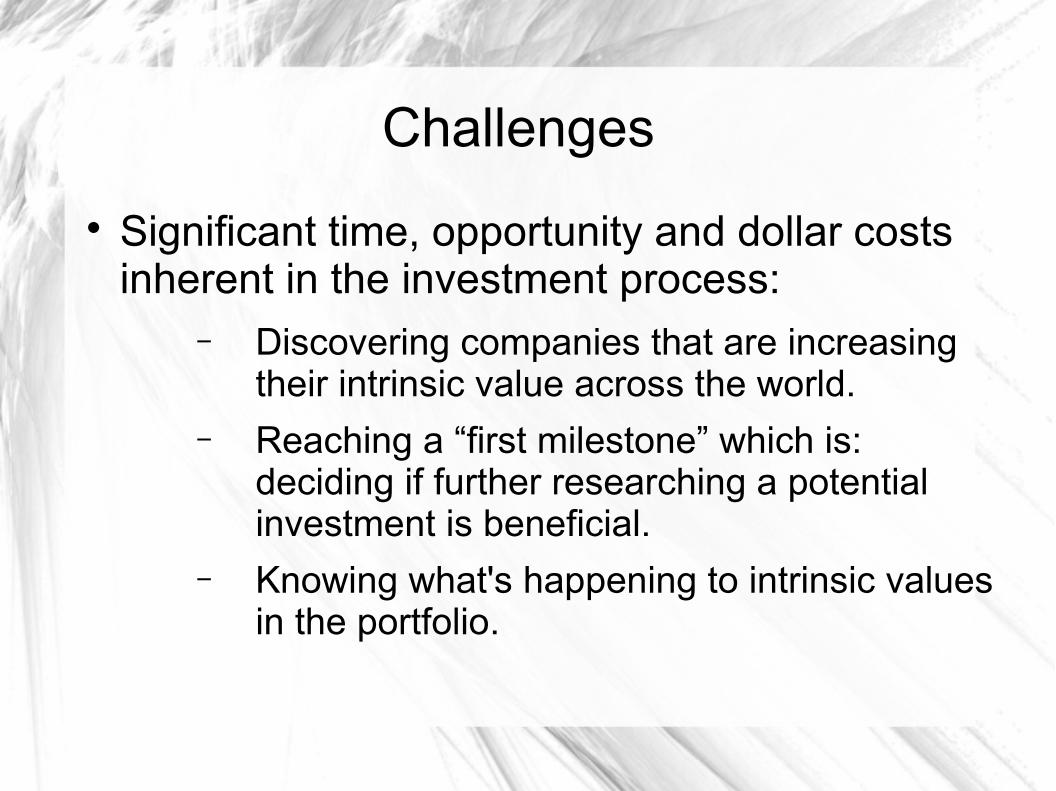
Significant time, opportunity and dollar costs inherent in the investment process:
− Discovering companies that are increasing their intrinsic value across the world.
− Reaching a “first milestone” which is: deciding if further researching a potential investment is beneficial.
− Knowing what's happening to intrinsic values in the portfolio.
Challenges
Strong and increasing need for original investment insights : – Raw data is not enough. Interpretation is key.
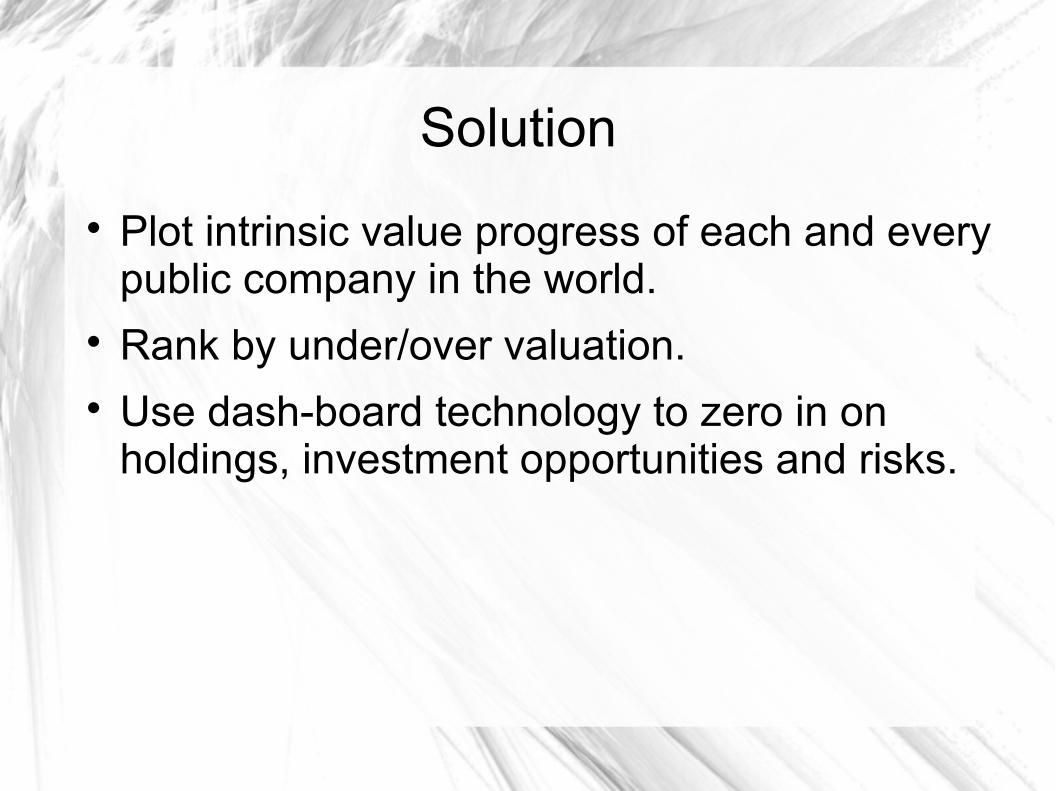
Solution
Plot intrinsic value progress of each and every public company in the world.
Rank by under/over valuation. Use dash-board technology to zero in on
holdings, investment opportunities and risks.
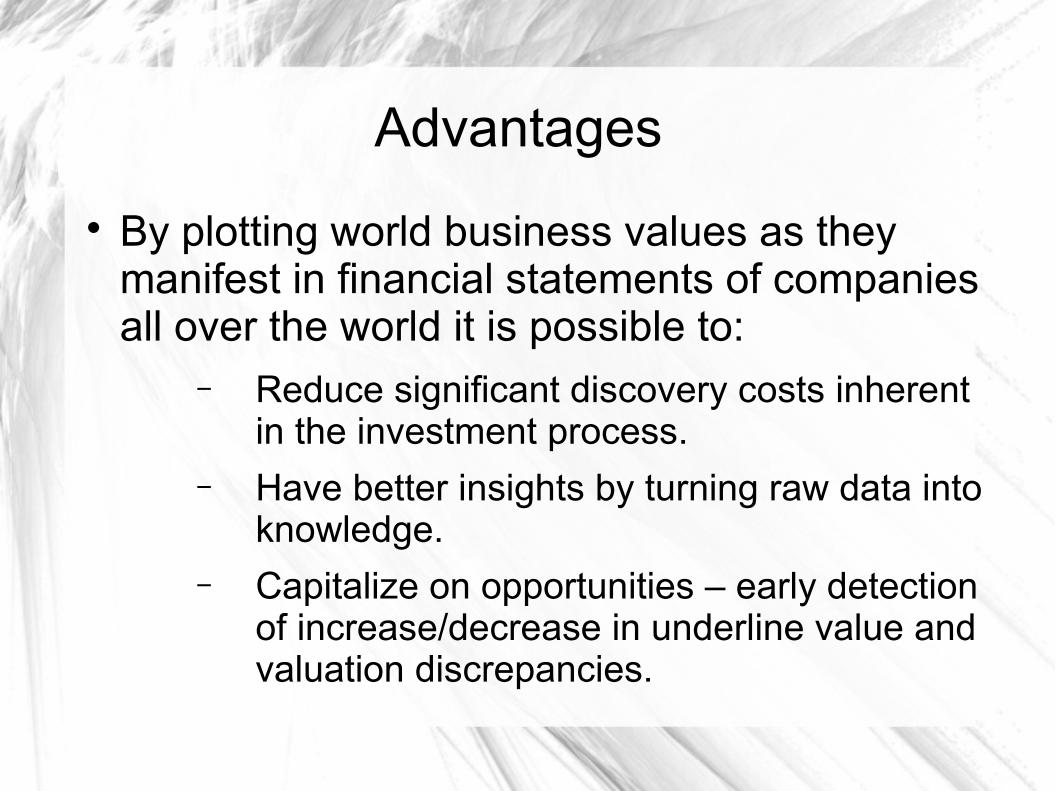
Advantages
By plotting world business values as they manifest in financial statements of companies all over the world it is possible to:
− Reduce significant discovery costs inherent in the investment process.
− Have better insights by turning raw data into knowledge.
− Capitalize on opportunities – early detection of increase/decrease in underline value and valuation discrepancies.
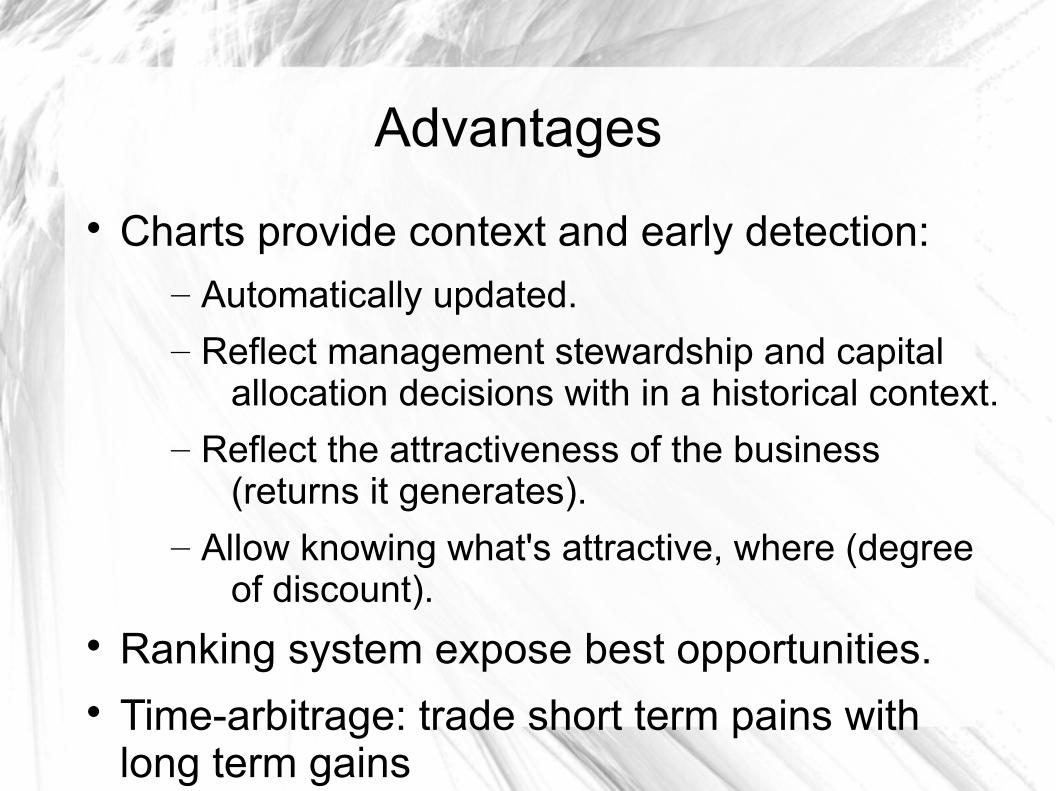
Advantages
Charts provide context and early detection: – Automatically updated.
– Reflect management stewardship and capital allocation decisions with in a historical context.
– Reflect the attractiveness of the business (returns it generates).
– Allow knowing what's attractive, where (degree of discount).
Ranking system expose best opportunities. Time-arbitrage: trade short term pains with
long term gains
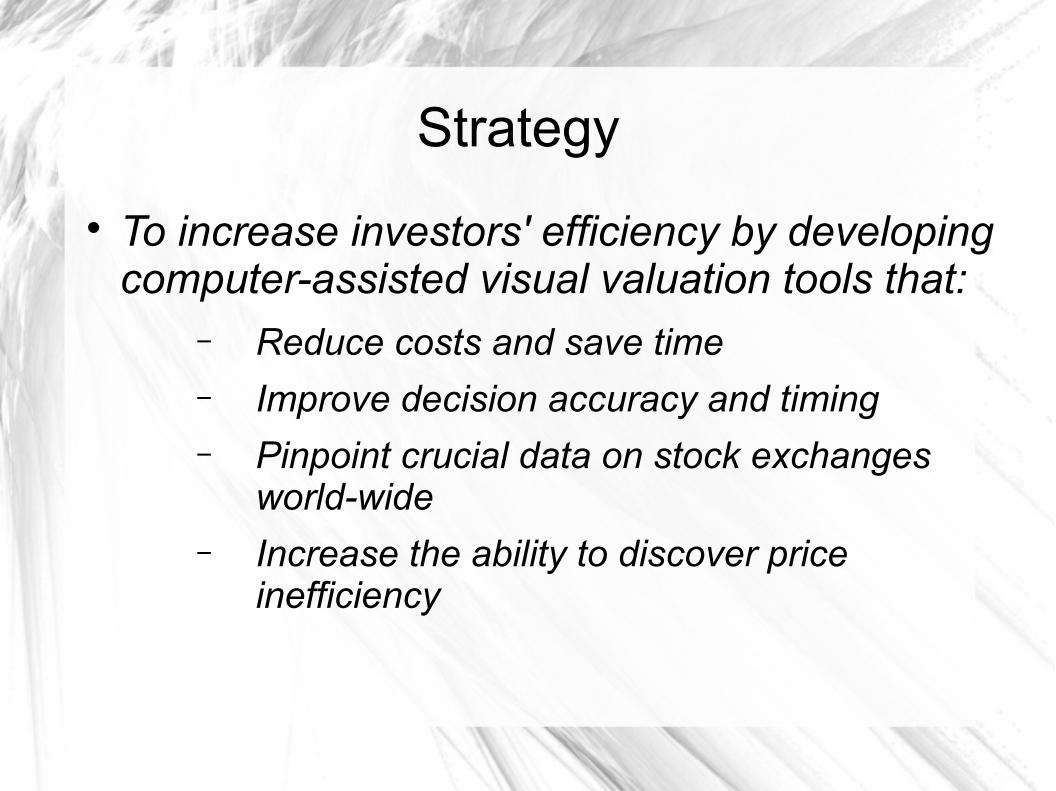
Strategy
To increase investors' efficiency by developing computer-assisted visual valuation tools that:
− Reduce costs and save time
− Improve decision accuracy and timing
− Pinpoint crucial data on stock exchanges world-wide
− Increase the ability to discover price inefficiency

Business model
Embedded platform: customized solutions into investors data decision systems and/or agreements with financial data providers.
Subscriptions: Institutional / Private investors.
Customized research: data mining insights (whats happening , where).
Pay per display: advertising supported. Risk sharing: pay for performance.
Competition
Ford equity research
− Provider of financial data, stock charts and trading strategies.
− Business model: content partnership agreements w/ financial data providers, subscriptions, content syndication, customized research, value graphs
− Value graphs rely on actual market data (e.g. historical high/low PE ) there for reflects market gyrations which is a concept separate from market price
Competition
Zacks equity research − Provider of financial data, stock charts and
trading strategies.
− Business model: content partnership agreements w/ financial data providers, subscriptions, content syndication, customized research, financial data software
− Monitor changes in analyst estimates. Access to analyst estimates is a commodity. Also found to be not accurate at times.
competition
FusionIQ− Provider of group ranking system using a
combination of technical and fundamental data.
− Business model: subscriptions, mainly to individual investors.
− Products are based mostly on technical analysis.
competition
MorningStar− Provider of stock and mutual fund research.
− Business model: subscriptions, managing assets.
− Provide ranking of stocks based on fundamental data. Employ expensive labor.
competition
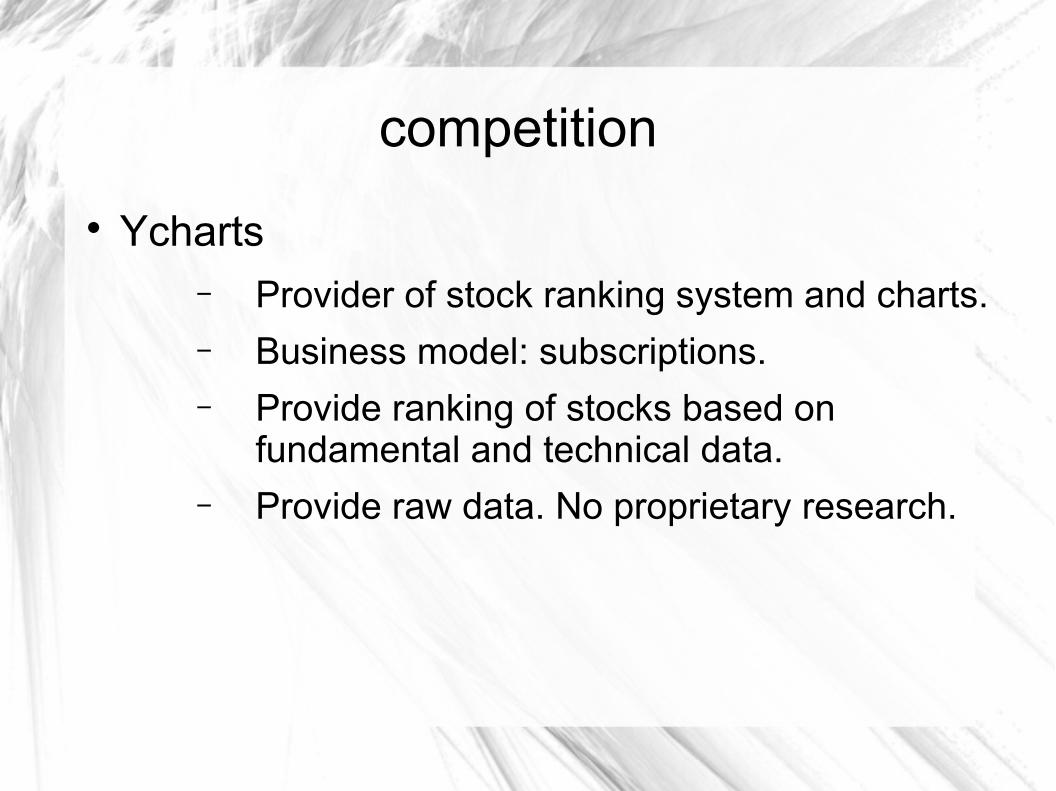
Ycharts− Provider of stock ranking system and charts.
− Business model: subscriptions.
− Provide ranking of stocks based on fundamental and technical data.
− Provide raw data. No proprietary research.
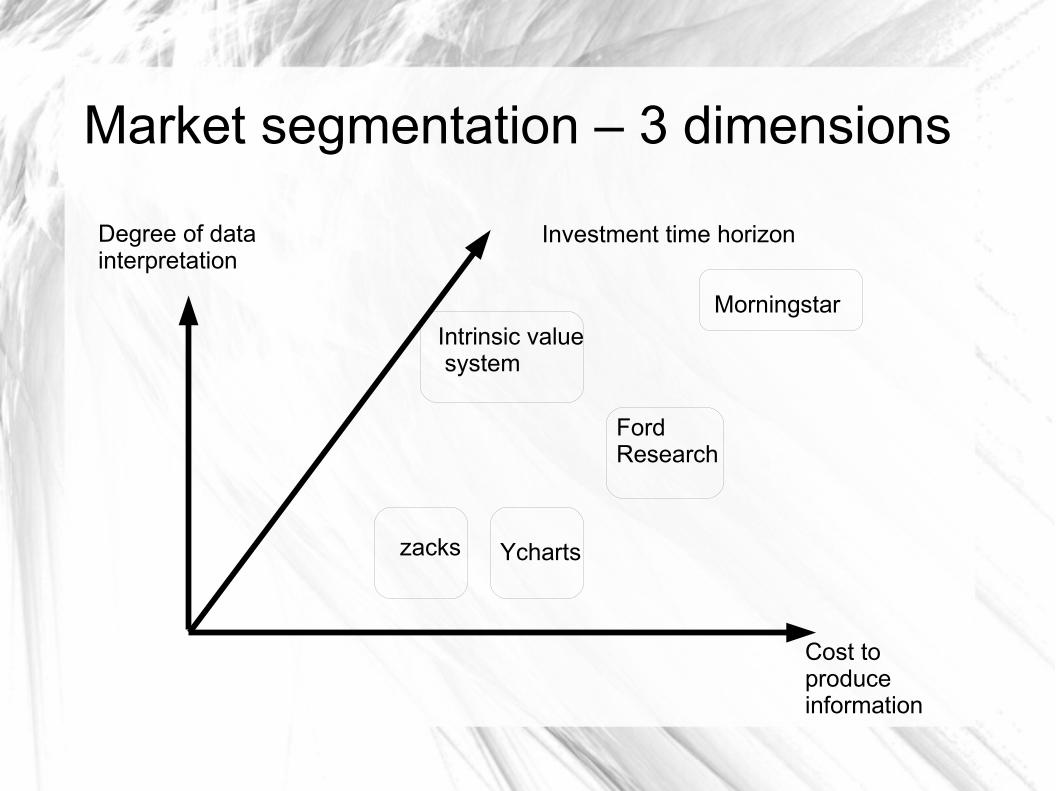
Market segmentation – 3 dimensions
Investment time horizonDegree of data interpretation
Cost to produce information
MorningstarIntrinsic value system
zacks Ycharts
Ford Research
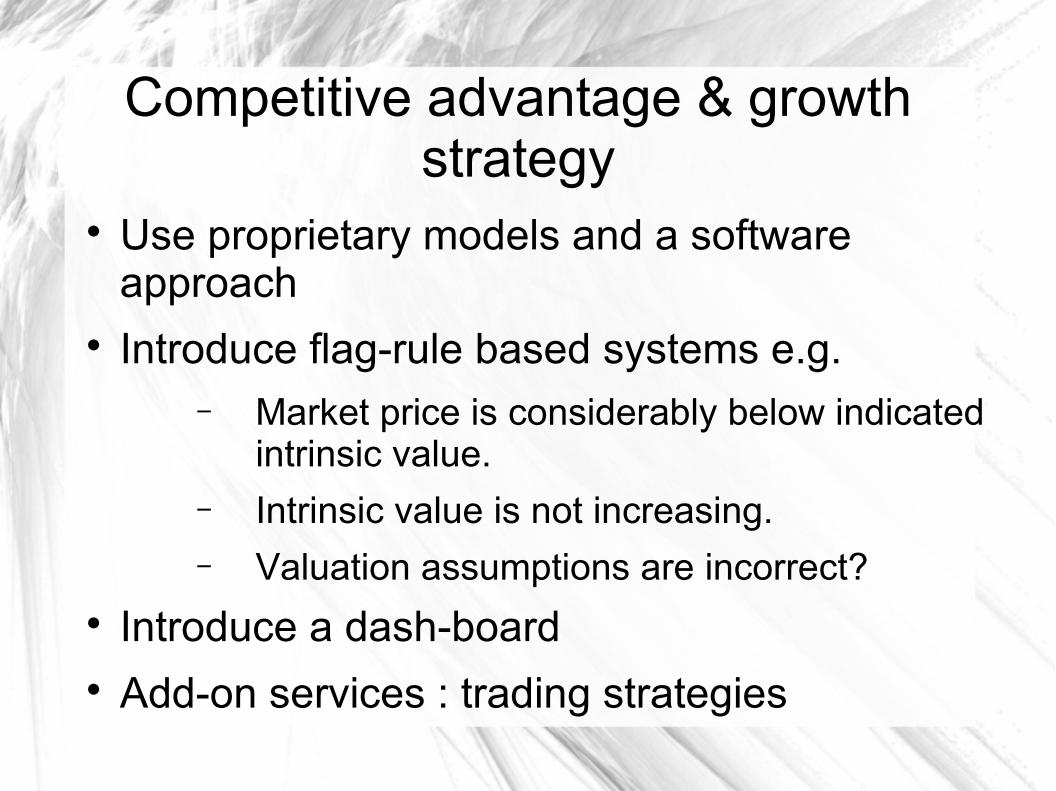
Competitive advantage & growth strategy
Use proprietary models and a software approach
Introduce flag-rule based systems e.g.− Market price is considerably below indicated
intrinsic value.
− Intrinsic value is not increasing.
− Valuation assumptions are incorrect? Introduce a dash-board Add-on services : trading strategies
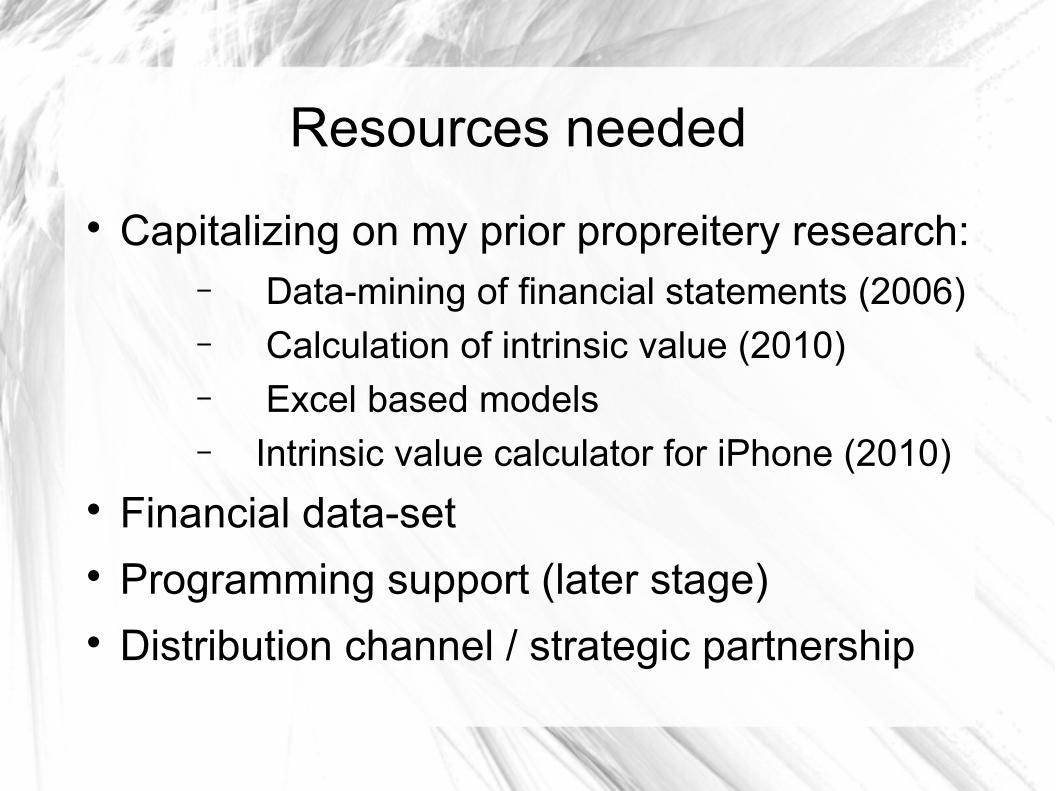
Resources needed
Capitalizing on my prior propreitery research:− Data-mining of financial statements (2006)− Calculation of intrinsic value (2010)− Excel based models− Intrinsic value calculator for iPhone (2010)
Financial data-set Programming support (later stage) Distribution channel / strategic partnership
Time table
First version based on excel covering all US stocks within 3 months of starting operations.
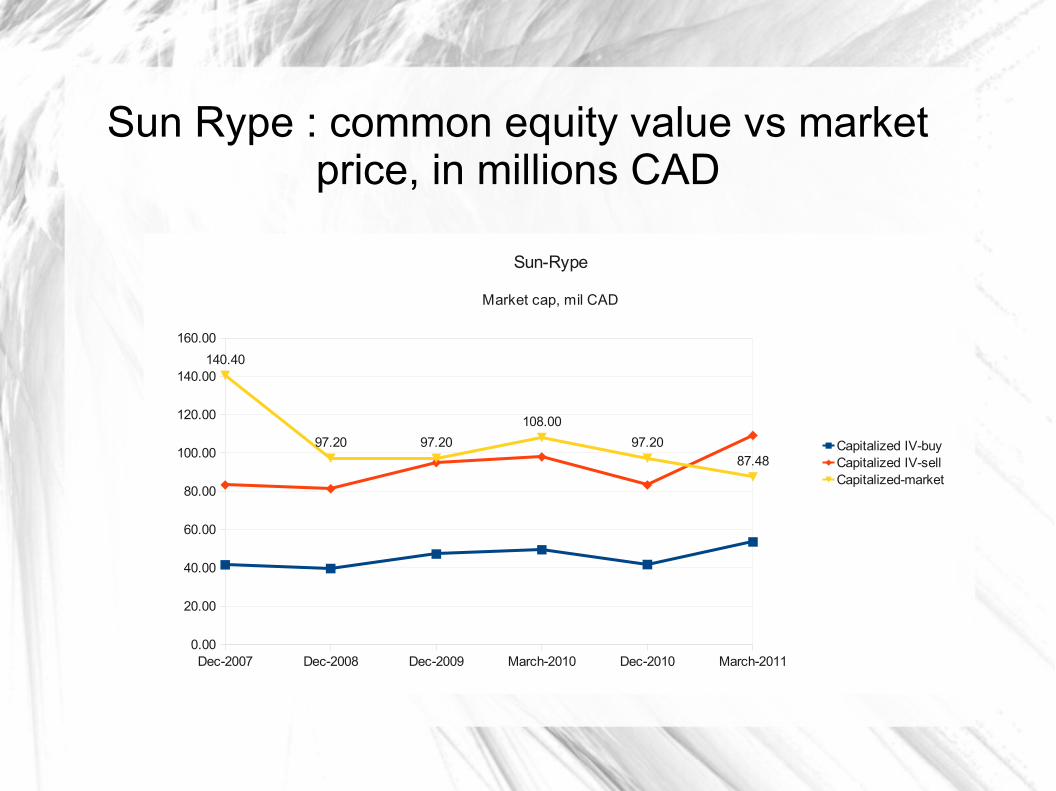
Sun Rype : common equity value vs market price, in millions CAD
Dec-2007 Dec-2008 Dec-2009 March-2010 Dec-2010 March-20110.00
20.00
40.00
60.00
80.00
100.00
120.00
140.00
160.00
140.40
97.20 97.20
108.00
97.20
87.48
Sun-Rype
Market cap, mil CAD
Capitalized IV-buyCapitalized IV-sellCapitalized-market

Glacier Media : common equity value vs market price, in millions CAD
Dec-2007 Dec-2008 Dec-2009 March-2010 Dec-2010 March-20110.00
50.00
100.00
150.00
200.00
250.00
300.00
350.00
400.00
450.00
209.88
93.52
175.42 180.25167.16 171.08
Capitalized IV-buyCapitalized IV-sellCapitalized-market
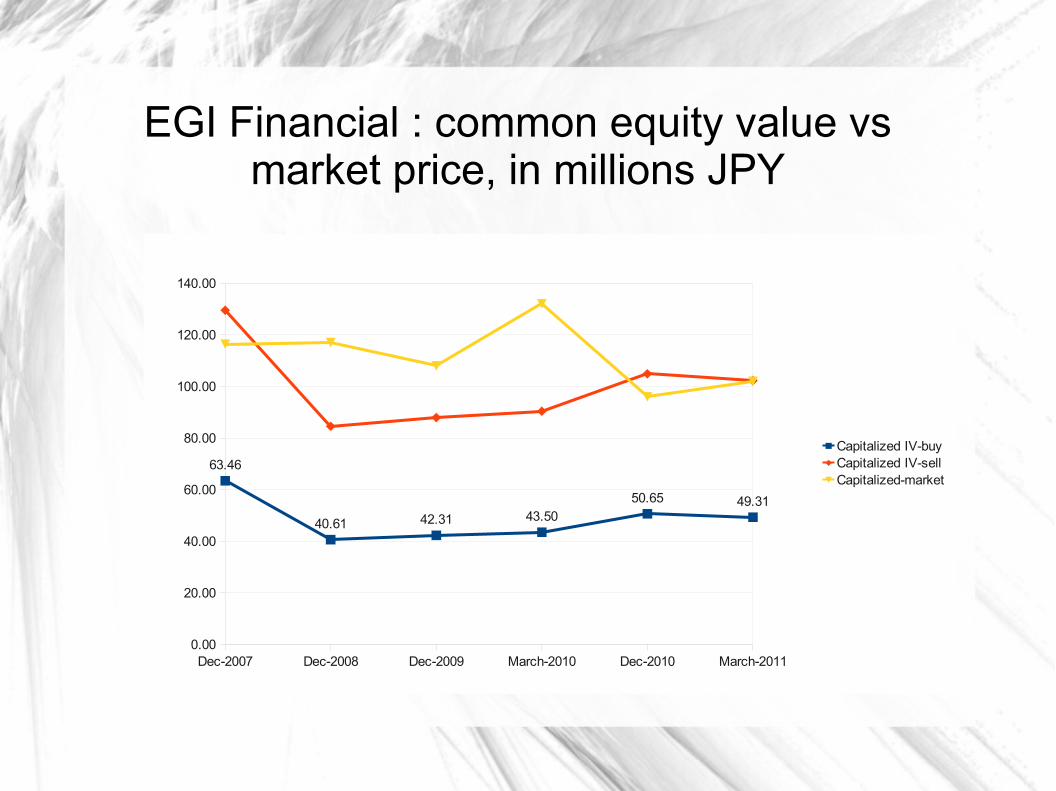
EGI Financial : common equity value vs market price, in millions JPY
Dec-2007 Dec-2008 Dec-2009 March-2010 Dec-2010 March-20110.00
20.00
40.00
60.00
80.00
100.00
120.00
140.00
63.46
40.61 42.31 43.5050.65 49.31
Capitalized IV-buyCapitalized IV-sellCapitalized-market
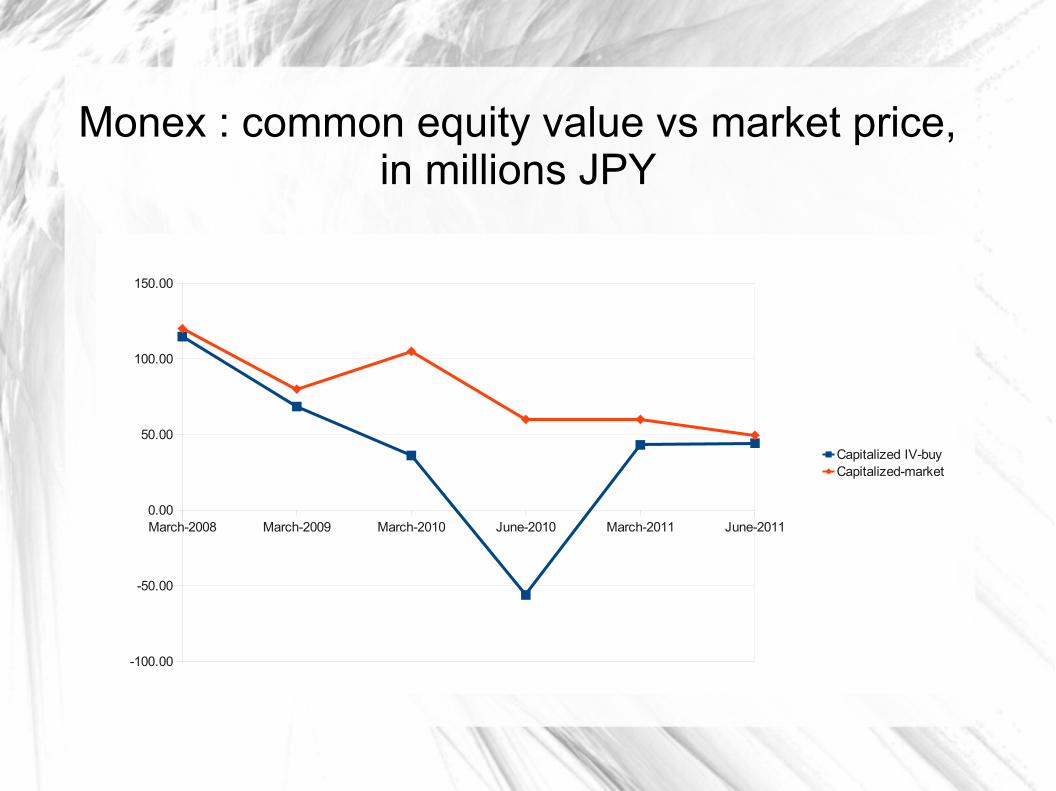
Monex : common equity value vs market price, in millions JPY
March-2008 March-2009 March-2010 June-2010 March-2011 June-2011
-100.00
-50.00
0.00
50.00
100.00
150.00
Capitalized IV-buyCapitalized-market
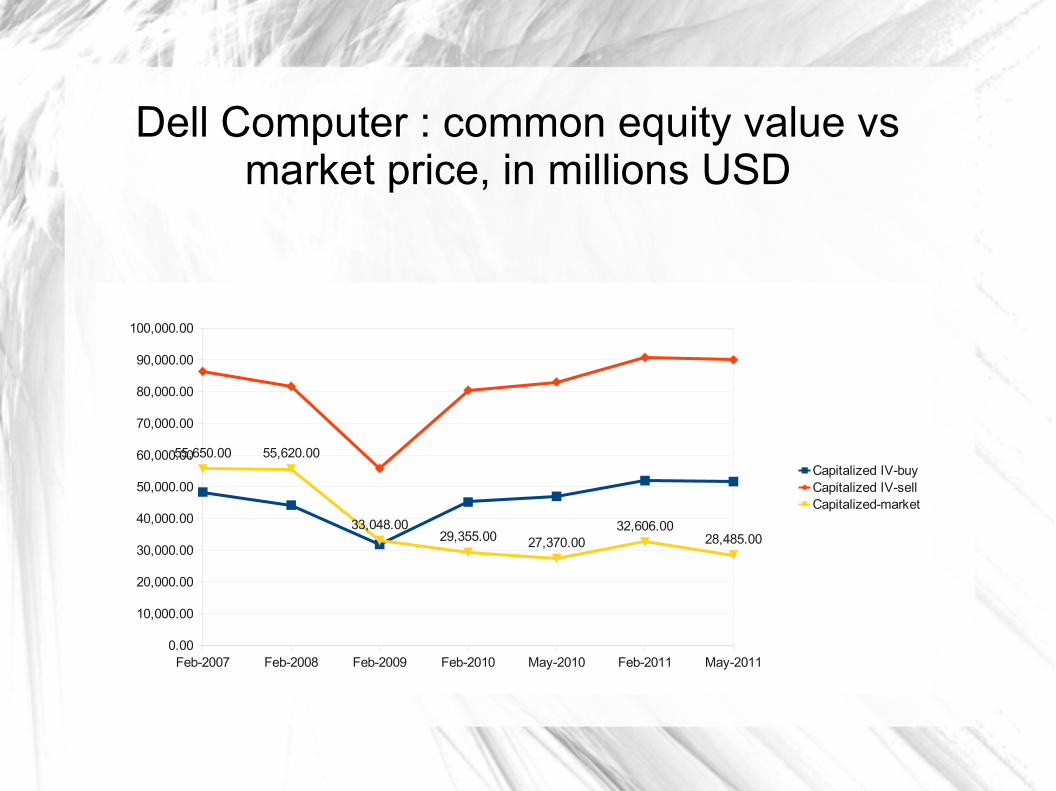
Dell Computer : common equity value vs market price, in millions USD
Feb-2007 Feb-2008 Feb-2009 Feb-2010 May-2010 Feb-2011 May-20110.00
10,000.00
20,000.00
30,000.00
40,000.00
50,000.00
60,000.00
70,000.00
80,000.00
90,000.00
100,000.00
55,650.00 55,620.00
33,048.0029,355.00 27,370.00
32,606.0028,485.00
Capitalized IV-buyCapitalized IV-sellCapitalized-market
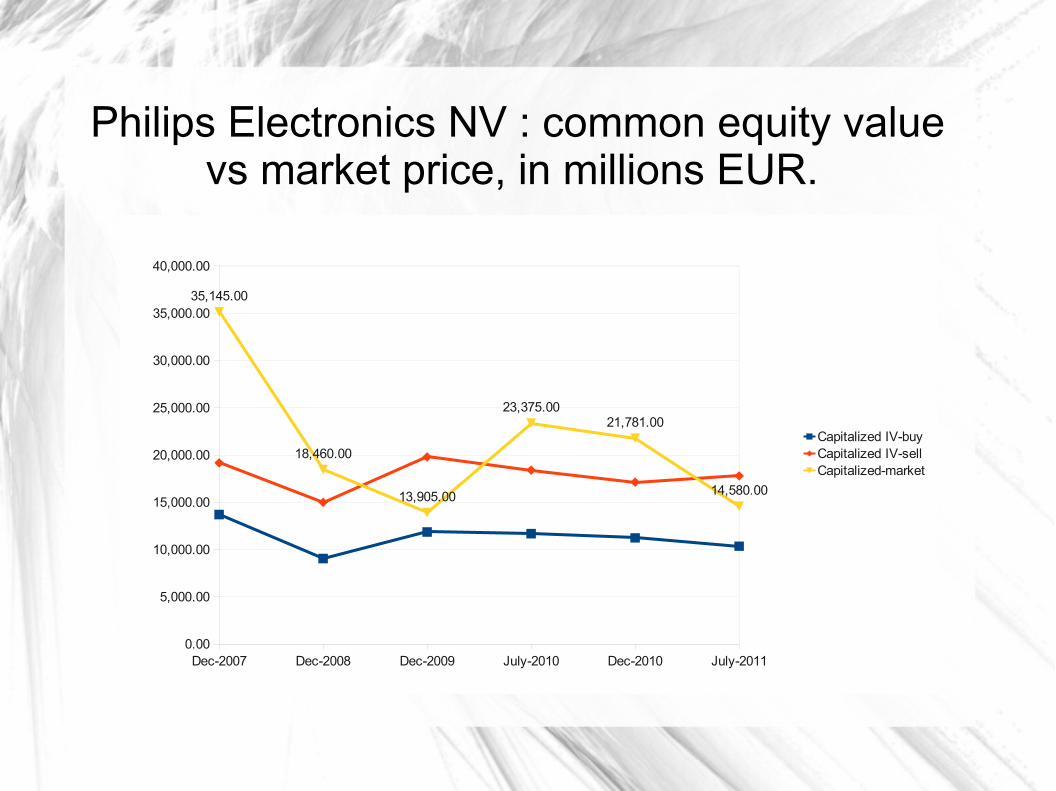
Philips Electronics NV : common equity value vs market price, in millions EUR.
Dec-2007 Dec-2008 Dec-2009 July-2010 Dec-2010 July-20110.00
5,000.00
10,000.00
15,000.00
20,000.00
25,000.00
30,000.00
35,000.00
40,000.00
35,145.00
18,460.00
13,905.00
23,375.0021,781.00
14,580.00
Capitalized IV-buyCapitalized IV-sellCapitalized-market
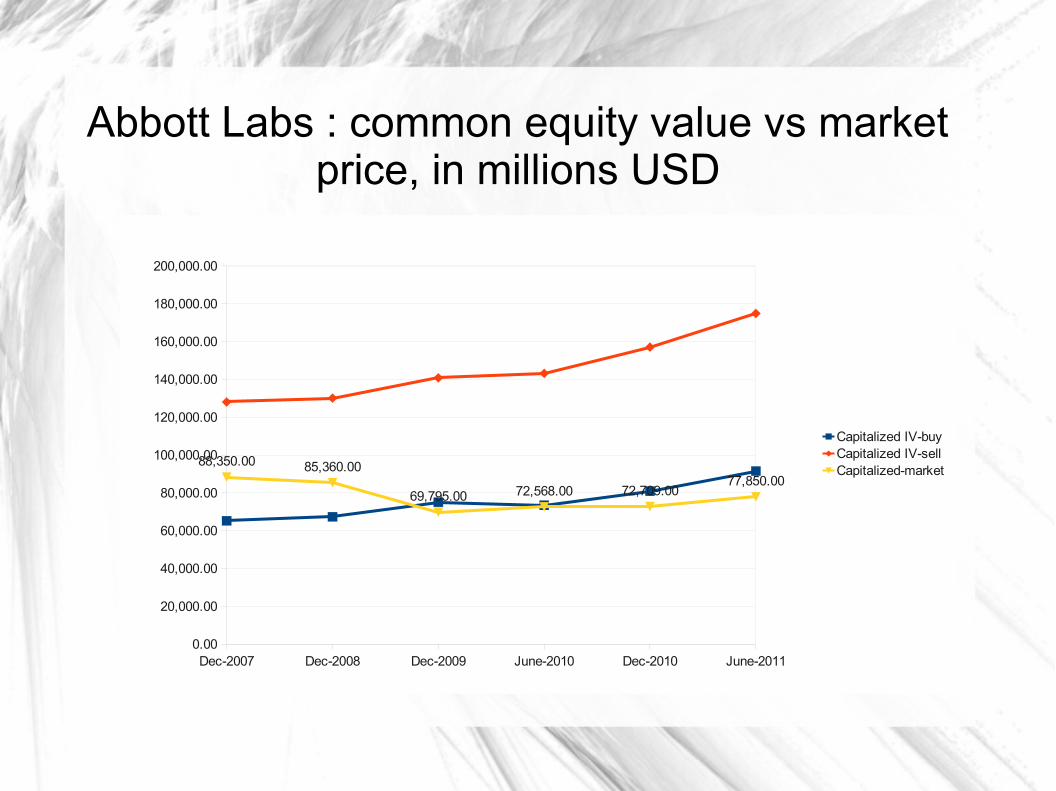
Abbott Labs : common equity value vs market price, in millions USD
Dec-2007 Dec-2008 Dec-2009 June-2010 Dec-2010 June-20110.00
20,000.00
40,000.00
60,000.00
80,000.00
100,000.00
120,000.00
140,000.00
160,000.00
180,000.00
200,000.00
88,350.00 85,360.00
69,795.00 72,568.00 72,709.0077,850.00
Capitalized IV-buyCapitalized IV-sellCapitalized-market
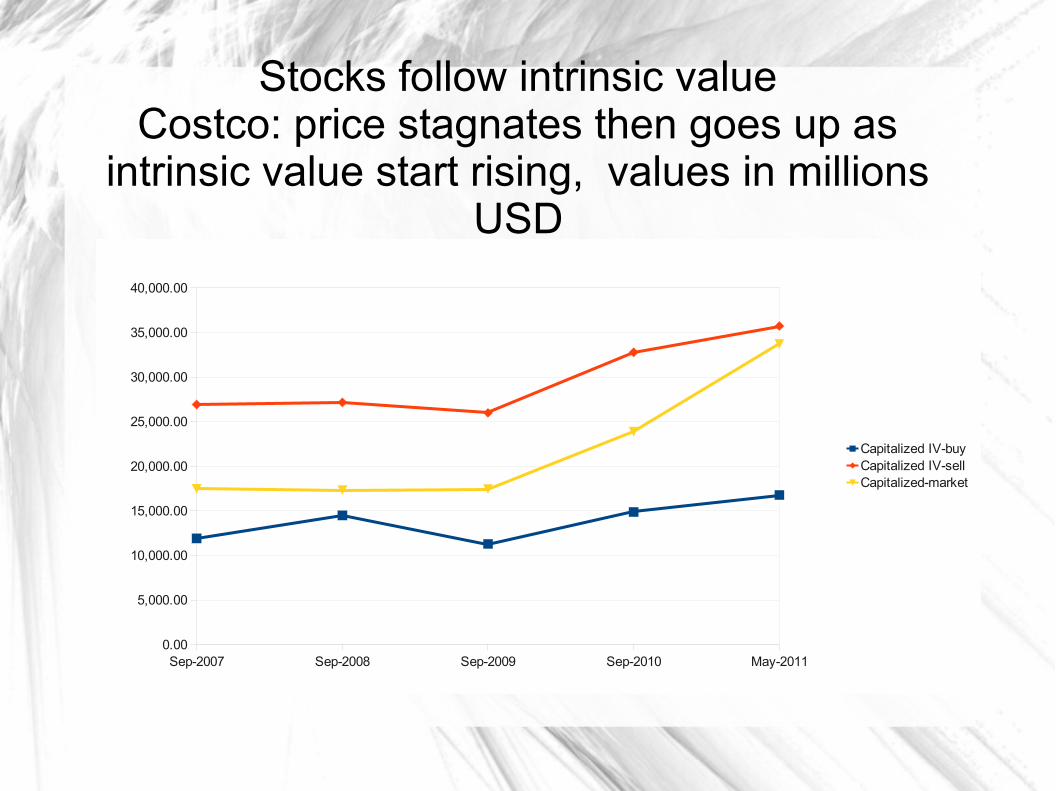
Stocks follow intrinsic valueCostco: price stagnates then goes up as
intrinsic value start rising, values in millions USD
Sep-2007 Sep-2008 Sep-2009 Sep-2010 May-20110.00
5,000.00
10,000.00
15,000.00
20,000.00
25,000.00
30,000.00
35,000.00
40,000.00
Capitalized IV-buyCapitalized IV-sellCapitalized-market
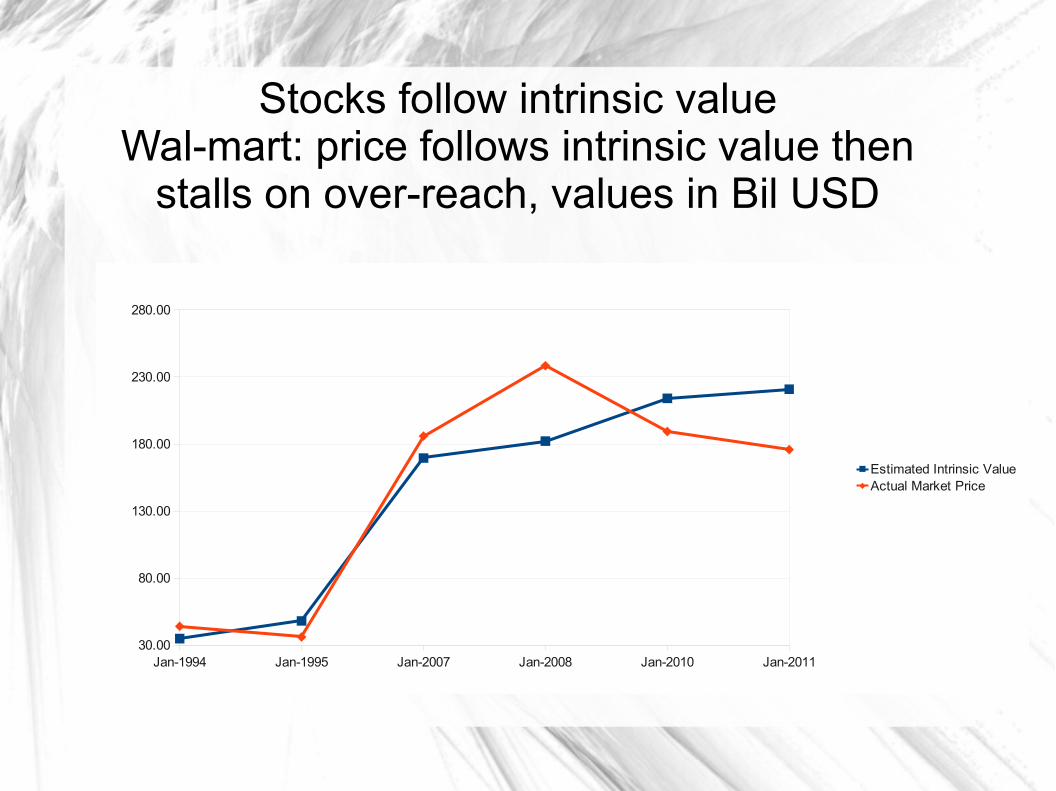
Stocks follow intrinsic valueWal-mart: price follows intrinsic value then
stalls on over-reach, values in Bil USD
Jan-1994 Jan-1995 Jan-2007 Jan-2008 Jan-2010 Jan-201130.00
80.00
130.00
180.00
230.00
280.00
Estimated Intrinsic ValueActual Market Price
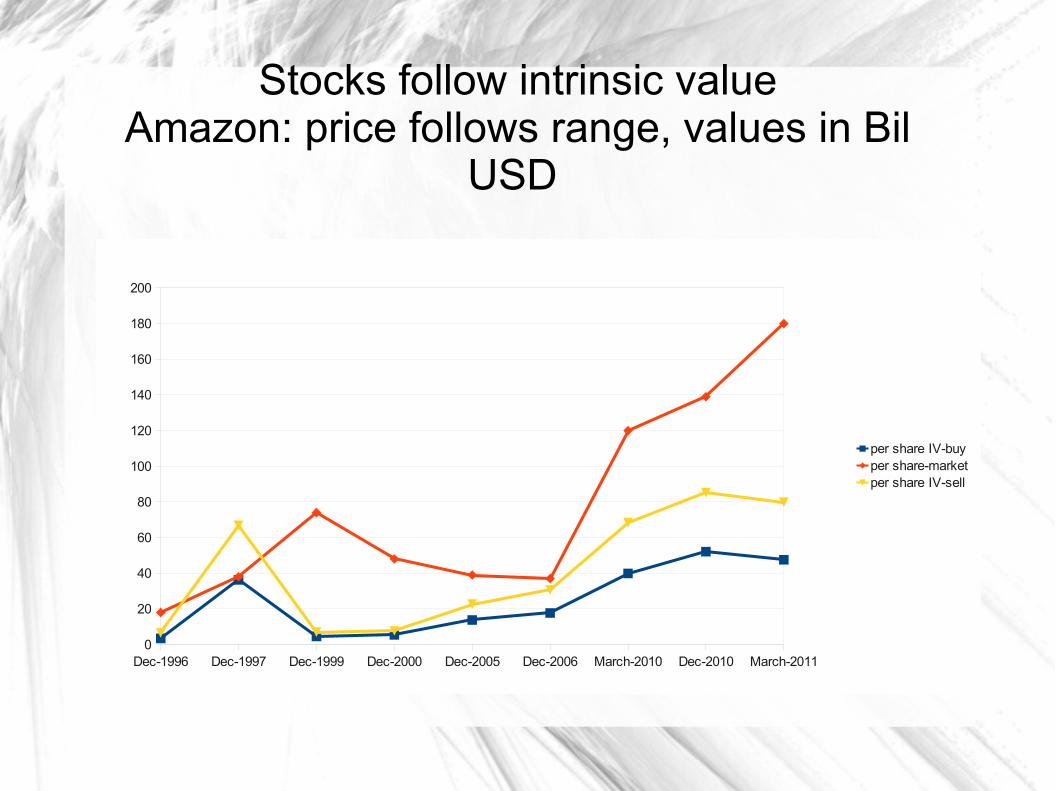
Stocks follow intrinsic valueAmazon: price follows range, values in Bil
USD
Dec-1996 Dec-1997 Dec-1999 Dec-2000 Dec-2005 Dec-2006 March-2010 Dec-2010 March-20110
20
40
60
80
100
120
140
160
180
200
per share IV-buyper share-marketper share IV-sell
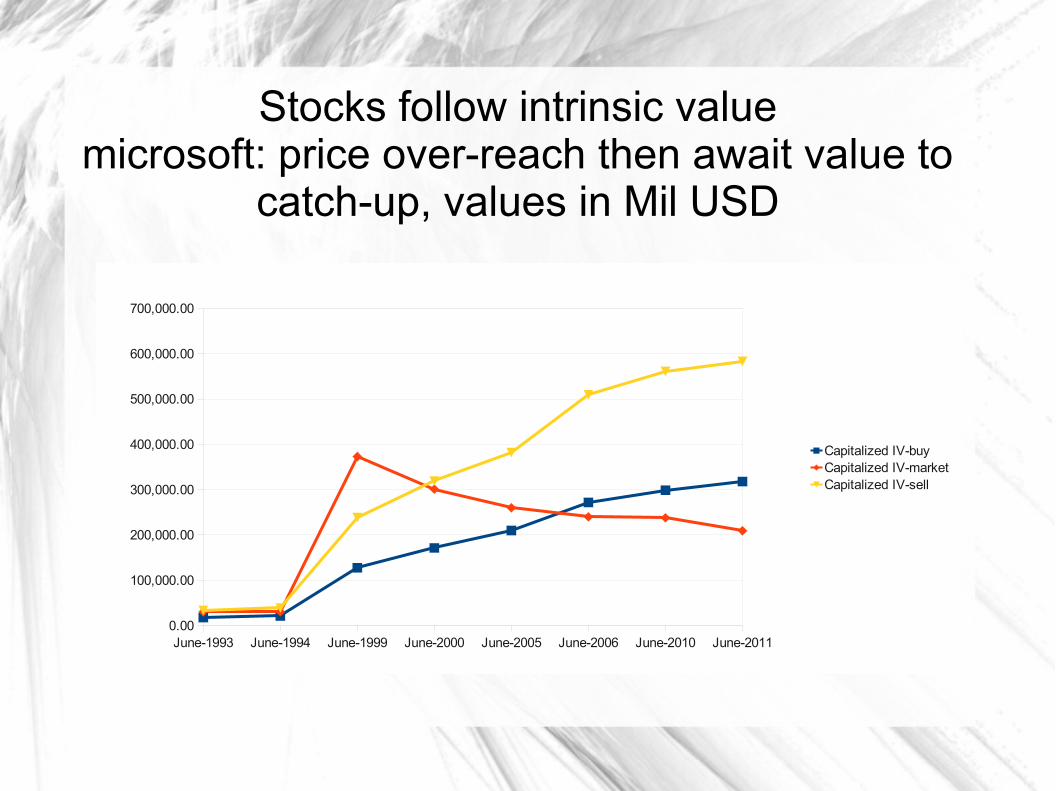
Stocks follow intrinsic valuemicrosoft: price over-reach then await value to
catch-up, values in Mil USD
June-1993 June-1994 June-1999 June-2000 June-2005 June-2006 June-2010 June-20110.00
100,000.00
200,000.00
300,000.00
400,000.00
500,000.00
600,000.00
700,000.00
Capitalized IV-buyCapitalized IV-marketCapitalized IV-sell
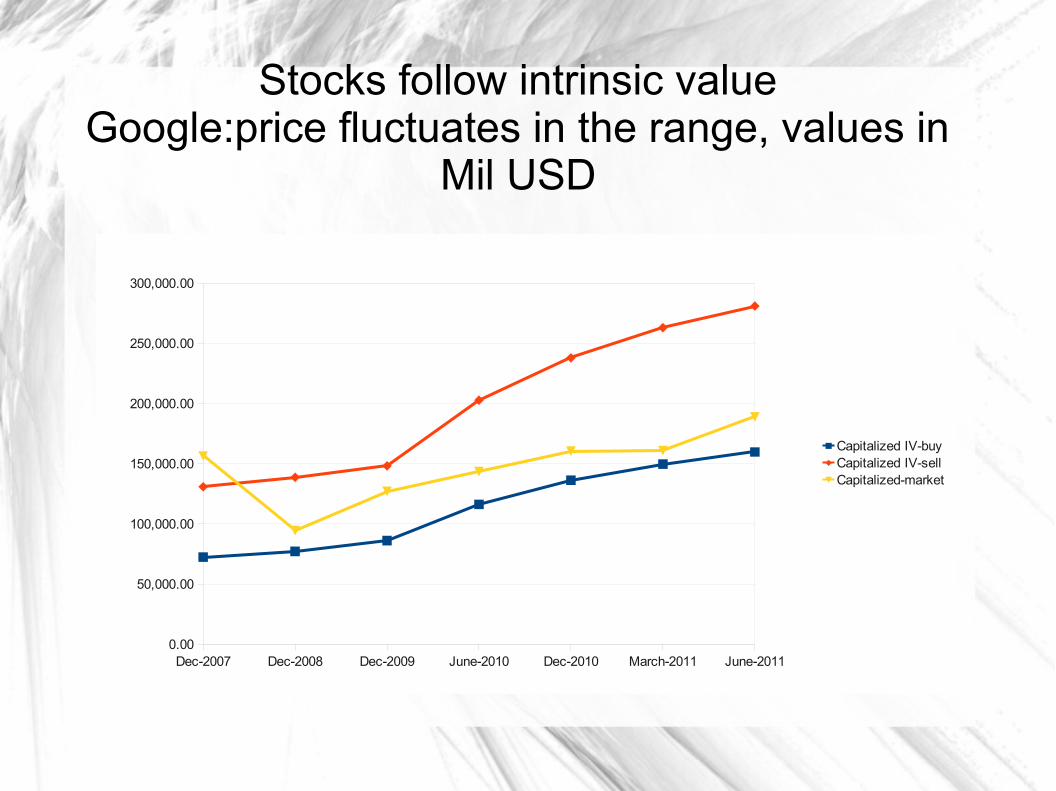
Stocks follow intrinsic valueGoogle:price fluctuates in the range, values in
Mil USD
Dec-2007 Dec-2008 Dec-2009 June-2010 Dec-2010 March-2011 June-20110.00
50,000.00
100,000.00
150,000.00
200,000.00
250,000.00
300,000.00
Capitalized IV-buyCapitalized IV-sellCapitalized-market

Stocks follow intrinsic value BestBuy : intrinsic value not increasing. Widening price/value
gap, values in Mil USD
Dec-2007 Feb-2007 Feb-2008 Feb-2009 May-2010 Feb-20110.00
5,000.00
10,000.00
15,000.00
20,000.00
25,000.00
30,000.00
35,000.00
40,000.00
45,000.00
50,000.00
23,709.50 22,883.6021,352.30 21,940.40 22,134.96
Capitalized IV-buyCapitalized IV-sellCapitalized-market
Efi Ben-Dor, 36, - professional experience
2007-2011 Cascade Management & Research, founder, equity research analyst global small companies, operation was sold.
2005-2007 Excellence Investment House, [public company] Quantitative Analyst, developing computer based algorithms for financial applications.
2001-2005 Harel insurance investments, [public company] E-business manager, leading the company web and intranet efforts
1999-2001 Walla! [public company], Manager, e-commerce, leading technological and commercial aspects of web properties.
1998-1999, Israeli Multimedia Forum, coordinating the activities of a nationwide business development network
1997-1998, NASDAQ:RRST, Business development, managing strategic relationships with satellite network carriers and broadcasters
Academic & professional training
2012, Level 2 CFA candidate
2005-2007, EMBA in banking from Hebrew University
2001-2004, BA (Cum laude) in finance from Ruppin College
2004, Israel Securities Authority, Licensed Portfolio Manager
1999, Microsoft Certified Engineer
Note
Notwithstanding the importance of per share intrinsic value, when total equity value is increasing slowly, share repurchase would not save the day: for example, total equity value is increasing at 3% pa. while the per share figure, due to stock repurchase, is increasing at 8% pa. (as is the case with many large US firms). However, best investment results were generated when there was a faster increase in intrinsic value then the rate possible by repurchase. That is why the charts are plotting total common equity value.