Embed Size (px)
Citation preview

i
Mapping Energy Usage in Casting Process
for Cylinder Head Production Using System Dynamic Modeling and Simulation
Tigist Fetene Adane
Supervisors: Professor Mihai Nicolescu
Master’s dissertation submitted in partial fulfillment of the requirements for the
degree of Master in Production Engineering and Management.
KTH Royal Institute of Technology
Department of Production Engineering
Stockholm, Sweden
June 2011

ii
iii
Abstract
Daily life of our societies is strongly linked with the usage of natural resources. However, the
vital resources of our planet especially energy is a limited resource. The energy consumption in
the manufacturing industry is increasing and becoming noticeable; moreover it is being
consumed in ways that can’t be sustained. There is great concern about minimizing the
consumption of energy usage in the manufacturing industry and sustaining the natural carrying
capacity of the ecosystem as well. This is one of the important challenges in today’s industrial
world.
This research work looks into one of the energy intensive manufacturing processes i.e. the
casting process in automotive industry. Here the casting process for cylinder head
manufacturing at one of the manufacturing plant in Europe is studied for identifying the most
energy intensive steps namely melting, holding and pouring. Parameters that influence these
steps and the relationships for energy consumption and dissipation have also been identified
through extensive literature survey. By applying system dynamics modeling and simulation
approach the interaction between each parameter in the overall process is analyzed in regard to
energy consumption. By varying values of the parameters that have the highest impact in the
process, the breakthrough opportunities that might dramatically reduce energy consumption
during melting and holding have been explored, and potentially energy-saving areas based on
the findings have also been identified. The output from this research work enables the company
to identify potential avenues to optimize energy usage in the production and hence sustain its
manufacturing.
Keywords: System dynamics (SD), metal casting, energy intensive parameters, energy –
consumption, energy saving, holding, casting.

iv
v
Preface
This thesis work is conducted in collaboration with Production Engineering & Management
Department and one the Manufacturing Industry in Europe, from 2010-05 to 2011-06. The
thesis report is submitted to Department of Production Engineering & Management, and to the
company. The report is one of the deliverable of my master’s thesis project, and conducted for
partial fulfillment of a Master’s of Science degree in Production Engineering & Management.

vi

vii
Acknowledgment
First of all I thank the Almighty Father, God, for giving me the divine insight, grace and wisdom
to do this Thesis work.
I would like to express my deepest gratitude towards my supervisor Professor Mihai Nicolescu
for giving the opportunity to work at the company and providing the necessary guidelines and
assistance in completing the project.
I would like to extend my sincere thanks to many individuals at the university Dr. Daniel
Tesfamariam, and Mr. Farazee M. A. Asif for their immense support, comments and direction in
completion of this project. My sincere thanks go to Dr. Amir Rashid for his advice and his time
to go through my report. My thanks also go to Mr. Lorenzo Daghini. I am also highly indebted to
the persons at manufacturing plant for giving me the detailed necessary information and data
regarding the project.
I would like to extend my heartfelt love and thanks to my family for their kind co-operation and
encouragement and to all well-wishers which help me in completion of this project.

viii

ix
Table of Contents
ABSTRACT .......................................................................................................................................................III
PREFACE ......................................................................................................................................................... V
ACKNOWLEDGMENT ..................................................................................................................................... VII
1 INTRODUCTION .................................................................................................................................... 1
1.1. BACKGROUND ................................................................................................................................................ 1
1.2. AIMS AND OBJECTIVES ..................................................................................................................................... 2
1.3. SCOPE OF THE PROJECT ..................................................................................................................................... 3
1.4. DELIMITATION ................................................................................................................................................ 3
2 METHODS AND MATERIALS .......................................................................................................................... 5
2.1. QUANTITATIVE AND QUALITATIVE METHODS .......................................................................................................... 5
2.2. WHAT IS SYSTEM DYNAMICS?............................................................................................................................. 5
1.1.1. How system dynamics works ........................................................................................................ 6
1.1.2. The Dynamic Modeling Process .................................................................................................... 6
1.1.3. Combining Mental Models with System Dynamics ...................................................................... 8
1.1.4. BUILDING BLOCKS OF SYSTEM DYNAMICS: STOCK, FLOWS, CONVERTORS AND FEEDBACK ........................................ 8
1.1.4.1. Identifying Stocks and Flows ........................................................................................................ 9
1.1.4.2. Four Characteristics of Stocks ....................................................................................................... 9
1.1.5. FEEDBACK............................................................................................................................................... 9
3 FOUNDRY PROCESS AND ENERGY IN THE SYSTEM ..................................................................................... 13
3.1. SAND CASTING ............................................................................................................................................. 13
3.2. THE MELTING PROCESS ................................................................................................................................... 14
3.3. FURNACES COMPONENT FOR MOLDING .............................................................................................................. 16
3.4. ENERGY IN THE MELTING INDUSTRY ‘’CASTING’’ .................................................................................................... 17
3.5. THE MELTING PROCESS ................................................................................................................................... 18
3.6. HEATING AND POURING................................................................................................................................... 18
3.6.1. ENERGY EFFICIENCY OF THE MELTING PROCESS ................................................................................................. 19
Factors affect the energy efficiency of a furnace ......................................................................................... 19
The following explains possible ways of losses during melting, pouring and holding of metal in the
production system: [17, 22] ......................................................................................................................... 19
3.7. THE POURING STAGE ....................................................................................................................................... 21
4 DISCUSSION ................................................................................................................................................ 25
4.1. MELTING THE METAL .............................................................................................................................. 25
4.2. FURNACE SCHEDULING AND LOADING - ENERGY .................................................................................... 26
4.3. ENERGY INPUT .................................................................................................................................. 26
4.4. HEAT LOSSES ..................................................................................................................................... 31
4.5. ENERGY USED - HOLDING MOLTEN METALS ...................................................................................... 38
4.6. ENERGY USED - TRANSPORTING MOLTEN METALS ............................................................................ 38

x
4.7. ENERGY LOSS DUE TO DELAY ............................................................................................................. 39
4.8. ENERGY RECOVERY WITH HEATED STRUCTURAL MATERIAL AS AN INPUT ........................................ 40
5 RESULT, CONCLUSION AND RECOMMENDATION ....................................................................................... 45
RESULT........................................................................................................................................................... 45
5.1. ENERGY INPUT, ACTUAL ENERGY USED AND POSSIBLE HEAT LOSSES ...................................................... 45
5.2. ENERGY OR HEAT LOSSES IN THE SYSTEM ............................................................................................... 46
5.3. POTENTIAL ENERGY SAVINGS.................................................................................................................. 47
5.3.1. ENERGY INPUT AND POTENTIAL ENERGY SAVING AS A FUNCTION OF TIME. ............................................................... 47
5.3.2. LOSSES THROUGH OPENING- VARYING OPENING TIME AND AREA OF OPENING .......................................................... 50
5.3.2.1. Varying opening time ...................................................................................................................... 50
5.3.2.2. Change area of opening i.e. diameter of opening ........................................................................... 51
5.4. ENERGY INPUT–HEATED STRUCTURAL MATERIAL AS AN INPUT.............................................................. 52
5.4.1. POSSIBLE ENERGY SAVING –VARYING SCRAP TEMPERATURE ................................................................................. 53
CONCLUSION ................................................................................................................................................. 55
RECOMMENDATION AND FUTURE WORK ...................................................................................................... 57
REFERENCES ................................................................................................................................................... 59
APPENDIX ...................................................................................................................................................... 61
APPENDIX 1 ................................................................................................................................................... 61
VALUES OF THE WALL (SURFACE), CEILING AND HEARTH SURFACE TEMPERATURE MEASURED AT THE
COMPANY FOUNDRY ..................................................................................................................................... 61
APPENDIX 2: DATA SHEET FORMAT PREPARED FOR THE COMPANY ............................................................. 64
APPENDIX 3: VALUE OF PARAMETERS – COMPANY FOUNDRY PROCESS ....................................................... 67

xi
List of Figures
Figure 1.1: D12 Cylinder Head........................................................................................................................................................... 1
Figure2. 1: A simple stock and flow structure…………………………………………………………………………………………….............................. 8 Figure2. 2: Generic causal loop diagram....................................................................................................................................... 8 Figure2.3: Overall nature and selected tests of formal model validation......................................................................... 11
Figure3. 1: Simple Casting processes.............................................................................................................................................. 13 Figure3. 2: General overview of the process 'Sand Mould Casting' for cylinder head production at company. 15 Figure3. 3: Energy consumption in percentage and influential parameters in each process in the production of cylinder head at the given plant..................................................................................................................................................
16
Figure3. 4: electric Arc Furnace........................................................................................................................................................ 17 Figure3. 5: Process energy in metal casting................................................................................................................................. 17 Figure3. 6: Energy Source in metal casting.................................................................................................................................. 18 Figure3.7: Pouring of iron in the mould........................................................................................................................................ 21 Figure3. 8: Heat flow to charge in melting furnaces (schematic): (a) hearth, (b) Rotary, (c) Crucible, (d) induction or immersion heated bath..............................................................................................................................................
22
Figure3. 9: flow chart of a typical complete foundry process- processes that uses gates, runners, and risers as an input to the system.....................................................................................................................................................................
23
Figure 4.1: Electric melting furnace......................................................................................................................................... 25
Figure4.2: Schematic representation of heat losses in a furnace......................................................................................... 25 Figure4.3: Stock and flow diagram (Left) energy input to melting (to melt the material); (Right) Energy input to superheat.............................................................................................................................................................................................
27
Figure4.4: Stock and flow diagram - total energy input to the system............................................................................... 27 Figure4.5: Stock and flow diagram - theoretical energy consumption in the system................................................... 29 Figure4.6: Stock and flow diagram - relationships between parameters to superheat the melt in the ladle…… 30 Figure4.7: Stock and flow diagram - parameters relationships and total energy consumption in the system… 30 Figure4.8: Possible ways of heat loss in a furnace (1, 2, 3...etc.).......................................................................................... 31 Figure4.9: Sankey diagrams- possible heat losses in industrial heating processes........................................................ 32 Figure4.10: Radiation factor for heat release through openings relative to the quality of heat release from perfect black body (BEE, 2005) .........................................................................................................................................................
33
Figure4.11: Flow diagram-heat loss through opening of furnace and its parameter relationships……………………… 34 Figure4.12: Relationships between black body radiations and temperature.................................................................. 34 Figure4.13: Heat loss through wall (a). And heat loss through opening (b)................................................................... 35 Figure4.14: Relations between Surface Temperature and Quantity of Heat Loss......................................................... 36 Figure4.15: Flow diagram: heat loss trough wall of a furnace and its parameter relationships……………………………. 37 Figure4.16: Left (a) Holding furnace; Right (b) Filling of iron in the ladle.......................................................................... 38 Figure4.17: heat losses due to delay of the metal in a ladle before pouring into the mould, and its parameter relationship.........................................................................................................................................................................
39
Figure4.18: Total heat loss in the system- loss trough furnace and ladle......................................................................... 40 Figure4.19: Energy difference between warm scrap and cooled scarp for structural material…………………………….. 41 Figure4.20: Comparison of energy required to melt structural material (for cooled scrap and warm scrap) and their parameters relationship...................................................................................................................................................
42
Figure4.21: Stock-flow diagram: - energy input, energy consumption and possible heat losses…………………………. 43 Figure4.22: Stock-flow diagram:-energy input, energy consumption, possible heat losses and energy for structural material..................................................................................................................................................................................
44
Figure5. 1: Total energy input, actual energy consumption and possible heat losses in the system………………….. 45 Figure5. 2: Possible ways of heat losses in the system: losses in the system: loss through opening, wall or surface loss, heat losses due to delay. Blue heat losses trough opening; Red: Losses through wall or skin of furnace; and Green: heat losses due to delay..............................................................................................................................
46

xii
Figure5. 3: Potential energy saving (energy input and potential energy saving as a function of time)………………. 47 Figure5. 4: Heat losses due to delay of the melt in the ladle with different values of holding time as a function of time.......................................................................................................................................................................................
49
Figure5. 5: Heat losses due to opening of furnace with different values of opening times……………………………………. 50 Figure5. 6: Heat losses due to delay of the melt in the ladle with different values of opening diameter…………. 51 Figure5.7: Energy input for warmed (pre-heated - red) 1150.8KWh and cooled (rose) scrap 1260.4KWh………. 52 Figure5. 8: Possible energy saving with varying scrap temperature (Blue at 300 OC)……………………………………………… 53 Figure 5.9: An example of complete System Dynamics Modelling for a product manufacturing…………………………. 56 Figure5.10: Temperature time graph of melting of material in the furnace………………………………………………………………… 58

xiii
List of Tables
Table 2.1: System thinking and modeling process……………………………………………………………………………………………………….
7
Table 3.1: Some Typical Thermal Conductivity values……………………………………………………………………………………………… 20
Table5.1: Relationships between types of material and their heat requirement for metal melting… 48

xiv

1
1 Introduction
1.1. Background
Energy is essential to economic and social development, and improving quality of life. However,
much of the world's energy is currently produced and consumed in ways that could not be
sustained, if technology were to remain unchanged and if overall quantities were to increase
substantially. The need to control atmospheric emissions of greenhouse and other gases and
substances will increasingly need to be based on efficiency in energy production, transmission,
distribution and consumption, and on growing reliance on environmentally sound energy systems,
particularly new and renewable sources of energy. All energy sources will need to be used in ways
that respect the atmosphere, human health and the environment as a whole.
The European Union (EU) addresses the major energy challenges facing today, i.e. the strain on
energy resources and access for all users to affordable, secure energy. The EU is putting in place an
ambitious energy policy - covering the full range of energy sources from fossil fuels (oil, gas and
coal) to nuclear energy and renewables (solar, wind, biomass, geothermal, hydro-electric and tidal)
- in a bid to spark a new industrial revolution that will deliver a low-energy economy, whilst making
the energy we do consume more secure, competitive and sustainable. [24, 25]
There are always extenuating circumstances and specific explanations for the differences in energy
usage among individual companies and plants, raw resources, fuel types, kiln capacity, technology
and general operating practices. For example, improving energy usage, however, is important to the
industry and society, and it deserves more attention.
The energy challenge is one of the greatest tests faced by Europe today. Increasing energy prices
and increasing dependence on energy imports/ consequences jeopardize the security and
competitiveness (24, 25).
Since foundry is an energy intensive process, energy accounting is necessary to determine where
and how energy is being consumed, and how efficient is the energy management system. An energy
accounting method should define the areas of high energy usage, energy wastage and should point
out areas in which energy saving can be accomplished. To arrive at the energy consumption, energy
pattern is the main part of the energy audit process. Energy pattern can be used to understand the
way energy is used in a foundry and helps to control energy cost by identifying areas where waste
can occur, and where scope for improvement may be possible. Energy management is very
important as it deals with adjusting and optimizing energy, using systems and procedures so as to
reduce energy requirements.
The metal casting process is one of the most energy-intensive manufacturing sectors with the
melting process accounting for over half (55%) of its energy consumption. The melting operation –
heating metals to convert them into liquids for pouring – is actually complex, involving a series of

2
steps that incur material and energy losses. These losses are attributable to several factors:
undesired conduction, radiation and convection, stack loss (flue gases), and metal loss [10, 14].
Although its high energy expenses have been a significant concern for metal casters, the industry
continues to use melting technologies with poor energy efficiency [10, 14, 17]. The purpose of this
study is to explore breakthrough opportunities that might dramatically reduce energy during
melting and to identify potentially energy-saving areas based on the findings.
1.2. Aims and Objectives
In a production of cylinder head at the selected manufacturing plant, in a Foundry department,
there is a huge amount of energy used at each process. Therefore, the research on ‘’ Mapping
Energy Usage in casting process for cylinder head production using system dynamic modeling and
simulation’’ is conducted to explore breakthrough opportunities that might dramatically point out
the steps in process that consumes highest amount of energy in the production, moreover to
identify potential energy-saving areas based on the findings. So far modeling of system dynamics
has been used to model at system level; it has been extensively used to model distribution systems,
supply chain, quality improvement, etc. However it has not been used to model interactions at
process level especially in a technical process like machining, casting (such as melting metal in
furnace, pouring). Hence, these reveal the novelty of this research work.
The type of cylinder heads that are being manufactured at the company are D12 and D16 CH, D12
XPI, D12 PDE, D12 HPI, but in this project only the production of D12 HPI is considered.
FIGURE 1.1: D12 CYLINDER HEAD [12]
The purpose of this model would not be to predict what the energy level would be for the coming
years, neither how much energy will be reduced or increased; but to reveal under what conditions
and manufacturing planning policies, the total energy consumption would be lowered, if and when
it would be higher, if and how it can be controlled and saved.

3
The aim and objectives of this thesis work comprises the following:
Understand the concept of System Dynamics and Modeling ;
Understand the concept of Stella software ;
Understand the process of Cylinder Head Production (CHP) –for sand mould casting,
Identify the process that consumes the highest amount of energy ,
Identify the parameters that affect the process or energy consumption;
Identify the relationship between parameters in the process;
Model stock and flow diagram;
Analyze the Model and observe the outcomes;
Analyze the outcomes by varying the parameters that have an influence on energy loss and
observe the percentage of energy loss change;
The study aims to provide a preliminary concept definition of “Grand Challenge” opportunities
in the context of melting technologies. It accomplishes its purpose by examining current and
emerging melting technologies and discussing their technical barriers to scale-up issues and
research needed to advance these technologies. It identifies potential avenues for improving
melting efficiency, lowering metal transfer heat loss, and reducing scrap and improving yield.
1.3. Scope of the project
The scope of the project is to model complex dynamics system for process of casting: - melting,
pouring and holding and then analyze possible ways for energy input, energy consumption, and
energy loss by varying the values of the parameters that affect the process using system dynamics
modeling and simulation approach;
Moreover, the possible ways to reduce energy loss in the system will be developed using system
Dynamics –Stella software Model.
1.4. Delimitation
For the overall model, the whole processing steps hasn’t taken into consideration. Only those
processes that consumes the highest amount of energy is chosen. So the energy input, usage,
output and waste analysis is more focused on few steps in the production processes.
Moreover, it is more focused on energy consumption though there are other issues which should be
considered in the analysis like environmental impacts, pollution, waste treatment, reuse etc.

4

5
2 Methods and Materials
2.1. Quantitative and qualitative methods
Literature review is conducted using resources from books, articles, journals, KTH theses and
conference proceedings from university and public library for both electronic and hardcover books
to research what has been done and to find the gap for the work. Internet will also be used as
information sourcing using reliable sites (web of science, Google scholar, science direct, Google
suggest…).
Stella Software is used for System Dynamics (SD) and simulation model analysis. The SD
methodology, which is adopted in this project, is a modeling and simulation technique specifically
designed for long-term, chronic and dynamic energy management problems. It focuses on
understanding how the physical processes, different parameters interact so as to create the
dynamics of the variables of interest. The totality of the relationships between these components
defines the “structure” of the system. Hence, it is said that the “structure” of the system, operating
over time, generates its “dynamic behavior patterns”. It is most crucial in SD that the model
structure provides a valid description of the real processes. [26]
2.2. What is System Dynamics?
System dynamics was created during the mid-1950s by Professor Jay W. Forrester of the
Massachusetts Institute of Technology. [1, 4, 5]
System dynamics is a powerful methodology and computer simulation modeling technique for
framing, understanding, and discussing complex issues and problems. Originally developed in the
1950s to help corporate managers improve their understanding of industrial processes, system
dynamics is currently being used throughout the public and private sector for policy analysis and
design. [4, 23]
System dynamics is a method for studying the world around us. Unlike other scientists, who study
the world by breaking it up into smaller pieces, system dynamicists look at things as a whole. The
central concept of system dynamics is to understand how all the objects in a system interact with
one another. A system can be anything from a steam engine, to a bank account, to a basketball
team. The objects and people in a system interact through "feedback" loops, where a change in one
variable affects other variables over time, which in turn affects the original variable, and so on. [1,
2, 4, 23]

6
The typical purpose of SD study is to understand how and why the dynamics of concern are
generated and then search for policies to further improve the system performance. Policies refer to
the long-term and macro-level decision rules used by upper management.
SD differs significantly from a traditional simulation method, such as discrete-event simulation
where the most important modeling issue is a point-by-point match between the model behavior
and the real behavior, i.e. an accurate forecast. Rather, for an SD model it is important to produce
the major “dynamic patterns” of concern (such as exponential growth, collapse, asymptotic growth,
S-shaped growth, damping or expanding oscillations, etc) [2, 23].
1.1.1. How system dynamics works
Models are simplifications of reality and (usually) help people to clarify their thinking and improve
their understanding of the world. Models can be used for experimentation. A computer model, for
instance, can compress time and space and allow many system changes to be tested in a fraction of
the time, it would take to test them in the real world. Further, testing changes on a model, rather
than on an actual system, is a good way to avoid "shooting yourself in the foot." That is, if a change
does not perform well in a model of a system, it is questionable as to whether it will perform well in
the actual system itself. In addition, experimenting on a model can prevent causing harm to an
actual system, even when the change being tested is successful. For example, testing a more
effective sprinkler system design does not require setting an actual building on fire, if the testing is
done on a model of the building. [3]
1.1.2. The Dynamic Modeling Process
According to Kambiz et al, 2007, the general approach in a system thinking and modeling
intervention involves five major phases: Problem structuring, causal loop modeling, Dynamic
modeling, Scenario planning and modeling and Implementation and organization learning. In this
research work it is focused more on dynamic modeling phase. In some cases, it may not be
necessary to follow all the steps in a particular dynamic modeling study.

7
Table 2.1: System thinking and modeling process
Phases Steps
1. Problem structuring 1. Identify problems or issues of concern to management and main stakeholders
2. Collect preliminary information and data 3. Conduct group sessions for creative problem structuring
2. Causal loop modeling 1. Identify main variables 2. Prepare behavior over time graphs (reference mode) 3. Develop causal loop diagram (influence diagram) 4. Analyze loop behavior over time 5. Identify system archetypes 6. Identify key leverage points 7. Develop intervention strategies
3. Dynamic modeling 1. Develop a system map or rich picture 2. Define variable types and construct stock-flow diagrams 3. Collect detailed information and data 4. Develop a simulation model 5. Simulate steady-state/stability conditions 6. Reproduce reference mode behavior (base case) 7. validate the model 8. Perform sensitivity analysis 9. Design and analyze policies 10. Develop and test strategies
4. Scenario planning and modeling 1. Plan general scope of scenarios 2. Identify key drivers of change and keynote uncertainties 3. Construct forced and learning scenarios 4. Simulate scenarios with the model 5. Evaluate robustness of the policies and strategies
5. Implementation and organization
learning
1. Prepare a report and presentation to management team 2. Communicate results and insights of proposed
intervention to stakeholders 3. Develop a micro world and learning lab based on the
simulation model 4. Use lab to examine mental models and facilitate learning
in the organisation
Albin et al., 1996, states that the Systems Dynamics modeling process involves four stages:
conceptualization, formulation, testing, and implementation. Conceptualization identifies the
purpose of the model, the model boundaries, and key variables. The modeler also develops
reference modes and feedback relationships during this stage. The formulation stage focuses on
converting influence diagrams into flow diagrams and setting values for parameters. The testing

8
stage begins the simulation process and analyzes how the model tracks to the dynamic behavior of
the real system. The implementation stage examines how the models use will influence policies that
affect the system and the new insights clients have on the system. The modeling process
theoretically is never complete because as the model is used to influence the system, the model is
updated to match the new behavior and again used to further influence the system.
1.1.3. Combining Mental Models with System Dynamics
Mental Model is flexible, rich in detail, and constructed from the most abundant and valuable
source of information in the world - experience "data" collected in brain. [4]
The solution to the "mental model problem," according to system dynamist’s, is to have decision
makers map-out their mental models on the computer via system dynamics simulation, and let the
machine trace through the inherent dynamics. Then, through interaction with the computer,
decision makers can improve their mental models and learn about the system they are trying to
understand and control. Indeed, in system dynamics modeling, the process of modeling is seen as
being more valuable than the model itself. [5, 23]
1.1.4. Building Blocks of system Dynamics: stock, flows, convertors and feedback
In system dynamics modeling, dynamic behavior is thought to arise due to the Principle of
Accumulation. More precisely, this principle states that all dynamic behavior in the world occurs
when flows accumulate in stocks.
FIGURE 2. 1: A SIMPLE STOCK AND FLOW STRUCTURE FIGURE 2. 2: GENERIC CAUSAL LOOP DIAGRAM
In terms of a metaphor, a stock can be thought of as a bathtub and a flow can be thought of as a
faucet and pipe assembly that fills or drains the stock as shown in Figure 1. The stock-flow structure
is the simplest dynamical system in the world. According to the principle of accumulation, dynamic
behavior arises when something flows through the pipe and faucet assembly and collects or
accumulates in the stock. In system dynamics modeling, both informational and non-informational
entities can move through flows and accumulate in stocks. [2, 10, 23]
In principle, a stock can have any number of inflows and outflows. In practice, however, a system
dynamics model usually contains stocks with no more than four-to-six inflows and/or outflows. The

9
principle of accumulation holds regardless of the number of inflows and outflows that work to
change the number of entities accumulating in a stock. [1]
1.1.4.1. Identifying Stocks and Flows
One of the fundamental skills a system dynamics modeler must learn is how to identify the stocks
and flows in the system experiencing the problem that he or she is trying to model. This is a
nontrivial task and one that people often find difficult. For example, it is not unusual at all for
people, not trained in system dynamics modeling, to confuse stocks and flows. They will say
"deficit" (a flow) when they mean "debt" (a stock), or they will say that "inflation (a flow into a
stock) is lower, therefore the general level of prices (a stock) is falling" In fact, decreasing inflation
to a lower value means that prices are rising but at a slower rate. [1]
In order to identify stocks and flows, a system dynamics modeler must determine which variables in
the system experiencing the problem; define its state (its stocks), and which variables define the
changes in its state (its flows). The following guidelines can be used to help identify stocks and
flows: [1, 23]
Stocks usually represent nouns and flows usually represent verbs.
Stocks do not disappear if time is (hypothetically) stopped (i.e., if a snapshot were taken of
the system); Flows do disappear if time is (hypothetically) stopped.
Stocks send out signals (information about the state of the system) to the rest of the
system.
1.1.4.2. Four Characteristics of Stocks
Stocks possess four characteristics that are crucial in determining the dynamic behavior of systems.
More specifically, stocks: (1) Have memory, (2) Change the time shape of flows, (3) Decouple flows,
and (4) Create delays. [5]
1.1.5. Feedback
Although stocks and flows are both necessary and sufficient for generating dynamic behavior, they
are not the only building blocks of dynamical systems. More precisely, the stocks and flows in real
world systems are part of feedback loops, and the feedback loops are often joined together by
nonlinear couplings that often cause counterintuitive behavior.
From a system dynamics point of view, a system can be classified as either "open" or "closed." Open
systems have outputs that respond to, but have no influence upon, their inputs. Closed systems, on
the other hand, have outputs that both respond to, and influence, their inputs. Closed systems are
thus aware of their own performance and influenced by their past behaviour, while open systems
are not.

10
Causal Loop Diagramming
In the field of system dynamics modelling, positive and negative feedback processes are often
described via a simple technique known as causal loop diagramming. Causal loop diagrams are
maps of cause and effect relationships between individual system variables, when linked form
closed loops as shown figure 2.2 above.
Positive and Negative Loops
Closed systems are controlled by two types of feedback loops: positive loops and negative loops.
Positive loops portray self-reinforcing processes wherein an action creates a result that generates
more of the action, and hence more of the result. Anything that can be described as a vicious or
virtuous circle can be classified as a positive feedback process. Generally speaking, positive
feedback processes destabilize systems and cause them to "run away" from their current position.
Thus, they are responsible for the growth or decline of systems, although they can occasionally
work to stabilize them.
Negative feedback loops, on the other hand, describe goal-seeking processes that generate actions
aimed at moving a system toward, or keeping a system at, a desired state. Generally speaking,
negative feedback processes stabilize systems, although they can occasionally destabilize them by
causing them to oscillate. [5]
Formal Model validation method
The ultimate objective of system dynamics model validation is to establish the validity of the
structure of the model. Accuracy of the model behavior’s reproduction of real behavior is also
evaluated, but this is meaningful only if we already have sufficient confidence in the structure of the
model. Thus, the general logical order of validation is, first to test the validity of the structure, and
then start testing the behavior accuracy, only after the structure of the model is perceived
adequate. This logical sequence is depicted in Figure 2.3.
1. Structure validity test :
i. Direct structure validity test: Direct structure tests assess the validity of the model structure, by direct comparison with knowledge about real system structure. This involves taking each relationship (mathematical equation or any form of logical relationship) individually and comparing it with available knowledge about the real system. There is no simulation involved. Forrester and Senge give examples of direct structure tests, such as, structure and parameter confirmation tests, direct extreme-conditions test and dimensional consistency test
ii. Structure - oriented behavior test: assess the validity of the structure indirectly, by applying certain behavior tests on model-generated behavior patterns. This test includes extreme-condition test, Behavior sensitivity test, Modified-behavior prediction, boundary adequacy, phase relationship test.

11
Structure-oriented behavior tests are strong behavior tests that can provide information on potential structural flaws. Their main advantage over direct structure tests is that they are much more suitable to formalize and quantify.
2. Behavior pattern tests: The emphasis of system dynamics model is on pattern prediction
(such as periods, frequencies, trends, phase lags, amplitudes), not event prediction.
However, behaviour pattern tests do not provide any added value on the validity of model
[5, 29]
Figure2.3: Overall nature and selected tests of formal model validation

12

13
3 Foundry Process and Energy in the system
3.1. Sand Casting
Sand casting, the most widely used casting process, utilizes expendable sand molds to form
complex metal parts that can be made of nearly any alloy. Because the sand mold must be
destroyed in order to remove the part, called the casting; sand casting typically has a
low production rate. The sand casting process involves the use of a furnace, metal, pattern, and
sand mold. The metal is melted in the furnace and then ladled and poured into the cavity of the
sand mold, which is formed by the pattern. The sand mold separates along a parting line and the
solidified casting can be removed. The steps in this process are described in greater detail in the
next section. [6, 20]
Castings, the products of the metal foundry industry, are manufactured in a single step from liquid
metal without intermediate operations of mechanical working such as rolling or forging. Shaped
castings are thus distinguished from ingots and other cast forms which are only at an intermediate
stage of their metallurgical life. This is the earliest and still the most commonly used, of all casting
processes.(8). The variety of technology problems encountered in metal casting arises largely from
differences in the physical properties and constitution of the alloys. [7]
Figure3. 1: Simple Casting processes [6]
Sand casting is used to produce a wide variety of metal components with complex geometries.
These parts can vary greatly in size and weight, ranging from a couple ounces to several tons. Some
smaller sand cast parts include components as gears, pulleys, crankshafts, connecting rods, and
propellers. Larger applications include housings for large equipment and heavy machine bases.
Sand casting is also common in producing automobile components, such as engine blocks, engine
manifolds, cylinder heads, and transmission cases. [6]

14
3.2. The melting process
The aim in melting is to achieve close control of metal composition, with low melting losses and the
avoidance of gas contamination and non-metallic inclusions. The choice of practice is governed
partly by the composition and quality requirements of the alloy and partly by the nature of the
materials forming the charge. [7]
The charge
The furnace charge may consist of pre-alloyed pig or ‘ingot’, virgin metals and ‘hardener’ alloys;
scrap from outside sources or from internal fettling and machine shops, or any mixture of these
materials. Externally purchased pig, ingot and alloy additions are normally supplied to certified
analysis, but certain materials, especially scrap, require sorting and analytical control for charges to
be calculated with accuracy. [10]
The task of melting depends on the state of division as well as the composition of the charge. Large
pieces, for example pigs and heavy scrap, have a small surface area and are therefore least
susceptible to melting losses and contamination. Finely divided bulky materials such as swarf or
turnings are much less satisfactory: they are most readily absorbed by feeding directly into a liquid
bath but this introduces dangers of gas contamination. [7]
Robert et al. explained the melting of any industrial metal used in manufacturing involves the
following steps:
1. Preparing the Metal and Loading – removing dirt and moisture and sometimes, preheating
the charge material, such as scrap metal or ingot; and introducing solid charge into the
furnace system;
2. Melting the Metal – supplying energy from combustion of fuels, electricity or other sources
to raise the metal temperature above its melting point to a pouring temperature;
3. Refining and Treating Molten Metal – introducing elements or materials to purify, adjust
molten bath composition to provide a specific alloy chemistry and/or affect nucleation and
growth during solidification;
4. Holding Molten Metal – maintaining the molten metal in molten state until it is ready for
tapping;
5. Tapping Molten Metal – transferring the molten metal from the furnace to transport ladle;
6. Transporting Molten Metal – moving the molten metal to the point of use and keeping the
metal in molten state until it is completely poured.
In this research work, the processes from loading till completely poured the molten metal in the
mould are considered.
Material and energy losses during these processing steps represent inefficiencies in the production
that result energy waste and increase the costs of melting operations. Modifying the design and/or

15
operation of any step in the melting process may affect the subsequent steps. It is therefore
important to examine the impact of all proposed modifications over the entire melting process to
ensure that energy improvement in one step is not translating to energy burden in another step.
Cylinder head production: the general overview of the process ‘Sand Mould Casting’ for cylinder
head production for the selected manufacturing plant is depicted below.
Figure3. 2: General overview of the process 'Sand Mould Casting' for cylinder head production at the company
Energy intensive processes in casting and influential parameters
The processing step that consumes the highest amount of energy and parameters in each process
has shown below graph.
Core
manufacturing
Oven
Casting Cooling Shake
part out Clean
Surface
treatment
Put it in the
form
Dry
Paint core
(Blaze)
Forming
Sand forming
Crude iron Recycled
material/chips
))
Core sand
Binder
Amine
New sand
16
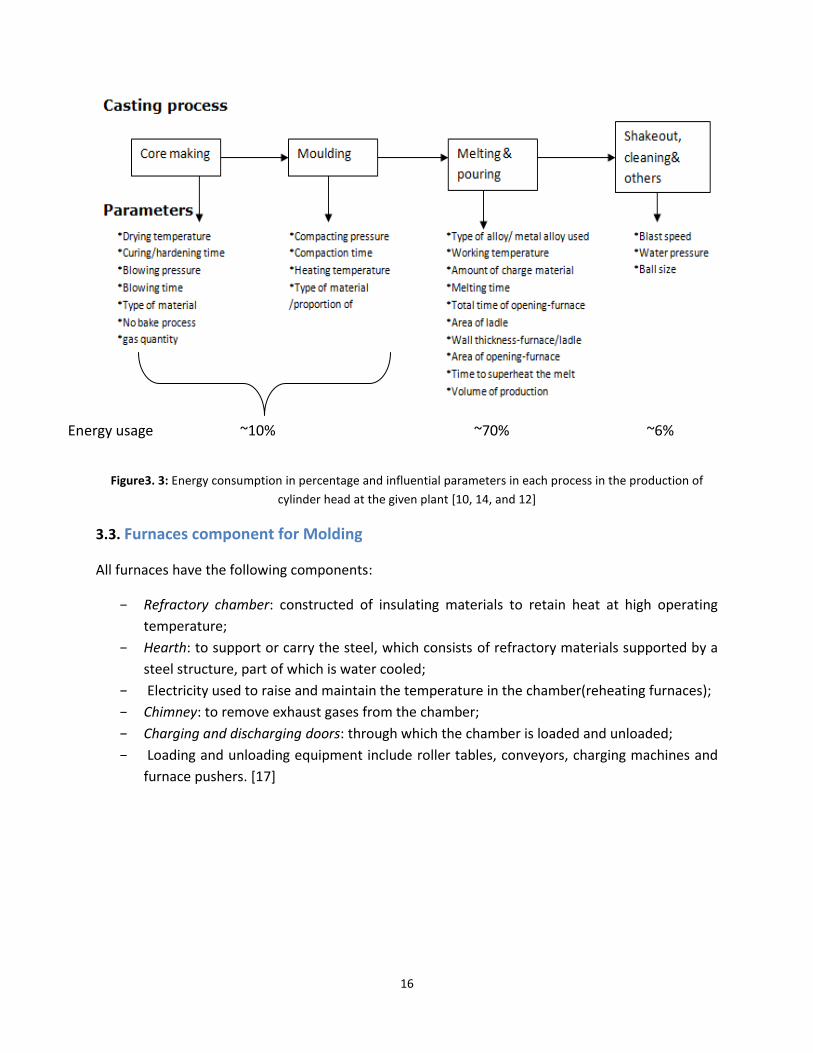
Figure3. 3: Energy consumption in percentage and influential parameters in each process in the production of
cylinder head at the given plant [10, 14, and 12]
3.3. Furnaces component for Molding
All furnaces have the following components:
− Refractory chamber: constructed of insulating materials to retain heat at high operating
temperature;
− Hearth: to support or carry the steel, which consists of refractory materials supported by a
steel structure, part of which is water cooled;
− Electricity used to raise and maintain the temperature in the chamber(reheating furnaces);
− Chimney: to remove exhaust gases from the chamber;
− Charging and discharging doors: through which the chamber is loaded and unloaded;
− Loading and unloading equipment include roller tables, conveyors, charging machines and
furnace pushers. [17]
Energy usage ~10% ~70% ~6%

17
Figure3. 4: Electric Arc Furnace: (source: www.substech.com)
3.4. Energy in the melting industry ‘’casting’’
The energy efficiency of any foundry largely rides on the efficiency of the melting process – a multi-
step operation where the metal is heated, treated, alloyed, and transported into die or mold
cavities to form a casting. The melting process is not only responsible for the energy consumption
and cost-effectiveness of producing the castings, but it is also critical to the control of quality,
composition, and the physical and chemical properties of the final product.
As it can be seen in the figure below, melting is the most energy-intensive operation in metal
casting industry, accounting for about 55% of the total energy use in foundries.
Figure3. 5: Process energy in metal casting; source: 2004 metal Costing Annual Report [10]

18
3.5. The Melting Process
Melting being highly energy intensive, the metal casting industry is one of largest spenders on
energy in the manufacturing sector. Although the energy consumption in the melting process has
been a significant concern in foundry operations, the industry continues to use melting technologies
with low energy efficiencies. Studies have shown that by implementing best practice technologies,
iron and aluminum melting can save approximately1.2 and 3 million Btu per ton respectively.
Considering that iron and aluminum casting tonnages comprise more than 85% of the total casting
tonnage, potential savings in melting these metals are substantial. Striving to reduce energy
consumption in melting ferrous and non-ferrous metals shows a promising path to lowering
operating costs in foundries and, in turn, cutting down the production costs for the entire
manufacturing sector. (10)
Source: 2004 Metal Casting Annual Report *The amount of electricity represents delivered energy
Figure3. 6: Energy Source in metal casting [10];
3.6. Heating and Pouring
Heat sources: Provision of heat for melting and superheating has undergone a shift away from solid
and liquid fuels to successively more controllable forms of heating with gas and electric power,
which offer many technical advantages, whilst environmental factors are also increasingly
important in the choice of melting plant and practice.[7, 14]
The total heat required in the system is estimated as the sum of (i) heat to raise the temperature to
the melting point; (ii) heat of fusion; and (iii) heat to raise the molten metal temperature to the
temperature of pouring (superheat). The pouring temperature must be above the melting point for
two reasons, (a) to prevent the preliminary freezing of the material in the ladle (i.e. to ensure that
the material is still in a liquid phase when it is poured into the mold), and (b) to improve the fluidity
of the molten metal. But the pouring temperature should not be too high to reduce both the

19
possibility for thermal damage to the mold and the energy required for heating the material. [13,
14]
3.6.1. Energy Efficiency of the Melting Process
The energy efficiency of the melting process is calculated by dividing the amount of theoretical
energy needed to melt a metal and raise it to its pouring temperature by the actual amount of
energy consumed in melting, treating, holding and handling the material.
Factors affect the energy efficiency of a furnace
The following explains possible ways of losses during melting, pouring and holding of metal in the
production system: [17, 22]
1. Metal Loss: The surface of the molten metal can oxidize leading to substantial metal loss in
the form of “slag” (term associated with ferrous alloys such as steel) or “dross” (in case of
non-ferrous alloys such as aluminum). This lost metal must be replaced by new metal. The
extent of the metal loss depends upon the affinity of the molten constituents for oxygen
and the melting method. These losses are the highest in aluminum-magnesium alloys.
Molten metal loss is a serious issue when considering a furnace design. If the metal losses
are high, the overall operation would be inherently inefficient and uneconomical;
2. Radiation Losses: These occur as energy emitted from hot furnace and enclosure surfaces.
When the furnace lid or door is opened for charging and tapping, radiation heat losses
increase significantly. Radiation losses from an uncovered bath can reach up to130 kWh/hr
(0.44 MBtu/hr) for an iron furnace with a 10-ton capacity. Heat radiation is the main cause
of heat loss from a hot surface (metal or inner ladle) and is given by the following equation:
………………………..1
Whereε is the emissivity of the radiating body, σ the Stefan-Boltzmann constant (5.67·10-8
W/m2K4), the temperature of the radiating body (K), and the temperature of the
receiving body (K) (15, 21, 22)
3. Conduction and Convection Losses: heat losses comprise conduction heat transfer through
refractory linings. It can be seen that heat losses by conduction from ladle furnace cover and
bottom and by radiation from ladle furnace top have significant values from the viewpoint
of consumed energy in the iron-steel units. (15, 21)
Conduction heat transfer is governed by Fourier’s law of conduction:
……………………2

20
Where Q is the heat transfer per unit area (W/m2), k the thermal conductivity (W/mK),
the temperature of the hot surface (K), the temperature of the cold surface (K), and L the
refractory thickness (m),
Thermal conductivity varies between different refractory materials, and with temperature,
as indicated by Table 3.1 below.
Table 3.1: Some Typical Thermal Conductivity values
Material T[°C] k [W/mK]
Al2O3- SiO2
Refractories
Low Al2O3 600- 800 0.8- 1.00
High Al2O3 700- 1000 1.20- 1.25
Silicon carbide, 90% SiC 1000 1.30- 1.40
Insulating brick 200- 700 0.30- 1.40
Ceramic fiber board 100- 500 0.30- 0.80
Steel 50- 250 0.04- 1.06
These losses can be controlled by using suitable refractory materials and maintaining a tight
fit between the lid and the furnace body. [18, 19, 22]
4. Slag/Dross Removal: This can also contribute to energy loss. The extent depends on the
temperature, the composition of the slag/dross, the technique used and how long the
furnace is left open to remove the slag/dross. This loss is not substantial to affect the overall
furnace efficiency, unless huge amounts of slag/dross are removed.
The extent of these energy losses vary depending on the furnace design, operating practices, metals
being melted and the source of energy being used.
Furnaces vary in efficiency, so melting time varies. Experience should give a good idea of how long
the metal will take to melt. Thus it can be planned the movement of a foundry crew. It goes without
saying that the second and subsequent melts will be quicker than the first because of the furnace
warm-up time. [9]
The casting industry as a whole has witnessed a marked increase in the importance of electric
furnaces, not only because of the high degree of control and flexibility of operation, but because of
the cleanliness and reduced levels of pollution in the absence of fuel combustion. Arc and induction
furnaces account for most of the tonnage produced, but resistance furnaces are also widely used,
including some operating on the immersion heating principle. [7]
21
3.7. The pouring stage
The organization of pouring might be regarded as the crucial step in foundry, since it is possible to
nullify the accumulated results of all the earlier work by a single error. Systematic gating and
feeding techniques, moreover, often depend for their full effect upon close control of metal
temperature and pouring conditions. Since little time is usually available for casting operations,
careful forward planning is needed with respect to mould casting sequence, individual mould
requirements and the handling of the metal supply; the operations themselves require firm
direction and a capacity for quick decision. [7]
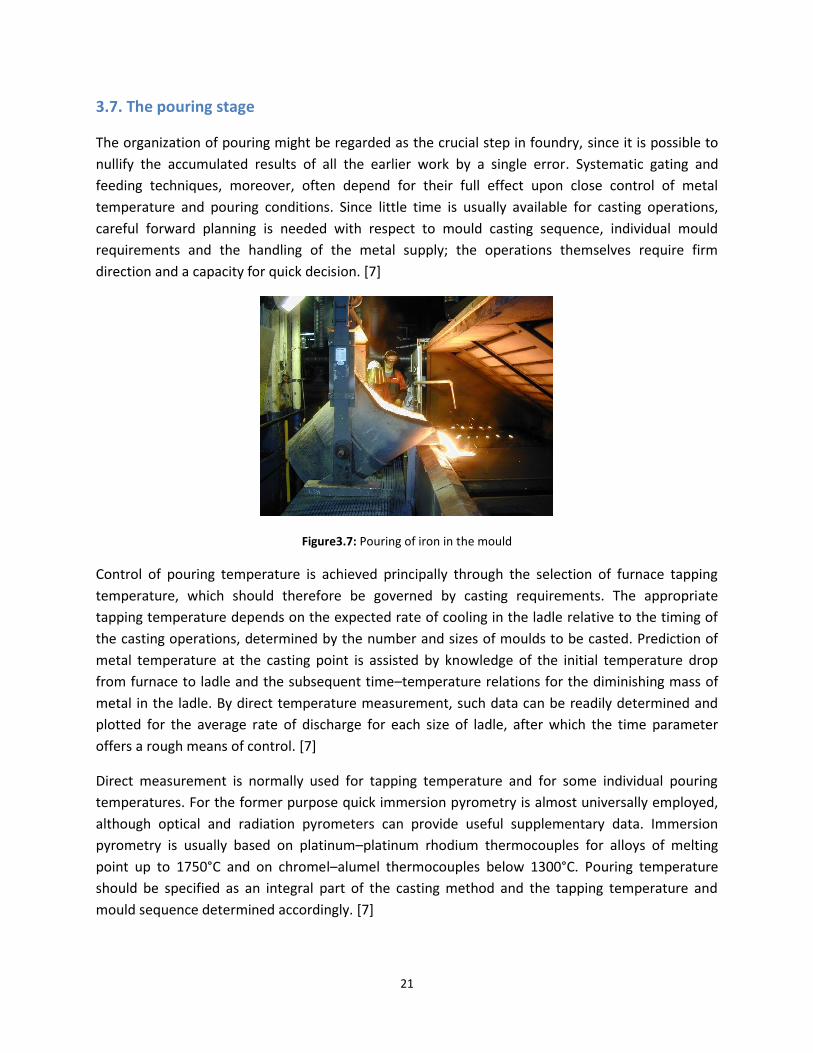
Figure3.7: Pouring of iron in the mould
Control of pouring temperature is achieved principally through the selection of furnace tapping
temperature, which should therefore be governed by casting requirements. The appropriate
tapping temperature depends on the expected rate of cooling in the ladle relative to the timing of
the casting operations, determined by the number and sizes of moulds to be casted. Prediction of
metal temperature at the casting point is assisted by knowledge of the initial temperature drop
from furnace to ladle and the subsequent time–temperature relations for the diminishing mass of
metal in the ladle. By direct temperature measurement, such data can be readily determined and
plotted for the average rate of discharge for each size of ladle, after which the time parameter
offers a rough means of control. [7]
Direct measurement is normally used for tapping temperature and for some individual pouring
temperatures. For the former purpose quick immersion pyrometry is almost universally employed,
although optical and radiation pyrometers can provide useful supplementary data. Immersion
pyrometry is usually based on platinum–platinum rhodium thermocouples for alloys of melting
point up to 1750°C and on chromel–alumel thermocouples below 1300°C. Pouring temperature
should be specified as an integral part of the casting method and the tapping temperature and
mould sequence determined accordingly. [7]

22
Factors that influence melting and pouring include energy availability and costs. Process flexibility
and melt rates, types of charge materials available, refractory’s in use and environmental controls
required also must be carefully weighed. [13]
Figure3.8: Heat flow to charge in melting furnaces (schematic): (a) hearth, (b) Rotary, (c) Crucible, (d) induction or
immersion heated bath. [10]

23
Figure3.9: Flow chart of a typical complete foundry process- processes that uses gates, runners, and risers as an
input to the system.

24

25
4 Discussion
4.1. Melting the Metal
Based on the heat generation method furnaces are broadly classified into two types: combustion
furnaces that use fuels (like oil, gas, coal, etc.), and electric furnaces that use electricity. Figure 4.1
shows the electric melting furnace at the given manufacturing plant. Furnaces operate in aggressive
environments, where several components—molten metals, furnace linings, atmospheric gases, and
products from combustion of fuels—coexist at extremely high temperatures. Several factors come
into play besides the core ingredients of heat and metal as illustrated in figure 4.2.
Figure 4.1: Electric melting furnace [12]
Ideally, all heat added to the furnaces should be used to heat up the load or stock. In practice,
however, a lot of heat is lost in several ways due to several reasons as shown below.
Figure4. 2: Schematic representation of heat losses in a furnace
In figure 4.2 the inputs to the system (Melting Furnace) are energy (derives its heat from natural
gas, fuel, electricity, and coke), air, fluxes & alloy elements and base metals. Through melting, heat
losses via conduction, convection and radiation. The outputs are molten metal, dross or slag, fuel
gas.

26
A melting furnace gets its heat from solid fuels (coke and breeze), natural gas, electricity, or other
sources of energy. Furnaces vary in design, geometry, capacity, productivity (melting rates),
construction materials, and mode of operation (batch or continuous). Other factors related to the
energy source also affect the furnace design, which include how the energy is transferred to the
molten material, how combustion gases are removed, what refining and treating equipment must
enter the furnace, how long the holding periods are, and how the molten metal will be tapped. The
operating temperatures required in the furnace depend on the melting and pouring temperature of
the materials being melted. They can range from about 350°C (650°F) for zinc alloys to 1,700°C
(3,100°F) for alloy steels. [10]
4.2. Furnace scheduling and loading - Energy
A commonly overlooked factor in energy efficiency is scheduling and loading of the furnace.
“Loading” refers to the amount of material processed through the furnace or oven in a given period
of time. It can have a significant effect on the furnace's energy consumption when measured as
energy used per unit of production.
4.3. Energy Input
Energy input is the energy supplied to the system, like natural gas, fuel, electricity, coke as shown in
figure 4.2. It is the energy needed to melt and superheat charged material in the furnace. The total
energy in the system is energy input to melting and energy to superheat the melt.
Energy input to melting: depends on the parameters
− Power supplied: it is also managed through working temperature;
− Melting time;
− Amount of material charge.
The relationship between parameters in energy input are expressed in following formula
1 1 1
Energy input to superheat the melt: depends on
− Power supplied to superheat the melt: power supplied is also managed through superheat
temperature of the melt;
− Amount of material ;
− Time to superheat the melt.
2 2 2
Where: P = power supplied, t = melting time, M = amount of charge material

27
The relationships between parameters are shown in the stock and flow diagram below figure 4.3.
Figure 4.3: Stock and flow diagram (Left) energy input to melting (to melt the material); (Right) Energy input to
superheat
Figure4.4: Stock and flow diagram - total energy input to the system
Energy Consumption/Energy in the stock:
It is the theoretical, consumed energy used in the furnace during production of casting. The
quantity of heat (Q) that will outflow from the stock can be calculated with the equation below:
System
System System

28
………………………………………1
Where: m=amount of charge material, =specific heat capacity of material, = working &
ambient temperature respectively
Energy consumption in the system can be:
1. Energy consumption to melt the material;
2. Energy consumption to superheat the melt.
Actual energy consumption: It is the product of theoretical energy consumption and the allowance
to the actual energy consumption i.e. performance factor theoretical energy consumption.
Energy consumption to melt the material
To know the energy required in the stock to melt a given amount of steel in a furnace, first the
sensible heat and latent heat values used for a given material must be determined. Hence, energy
to melt will be the sum of sensible and latent heat.
When an object is heated, its temperature rises as heat is added. The increase in heat is called
sensible heat. Similarly, when heat is removed from an object and its temperature falls, the heat
removed is also called sensible heat. Heat that causes a change in temperature in an object is called
sensible heat. Latent heat is the heat absorbed or given off by a metal while it is changing its
physical state. The heat absorbed or given off does not result in a temperature change in the
substance- the heat is latent or hidden. [28]
1. Sensible heat the heat required is affected by the parameters: Specific heat of material,
Melting point of material and ambient temperature.
2. Latent heat used is managed thorough the parameters: Latent heat for melting of material
and amount of charge material.
29
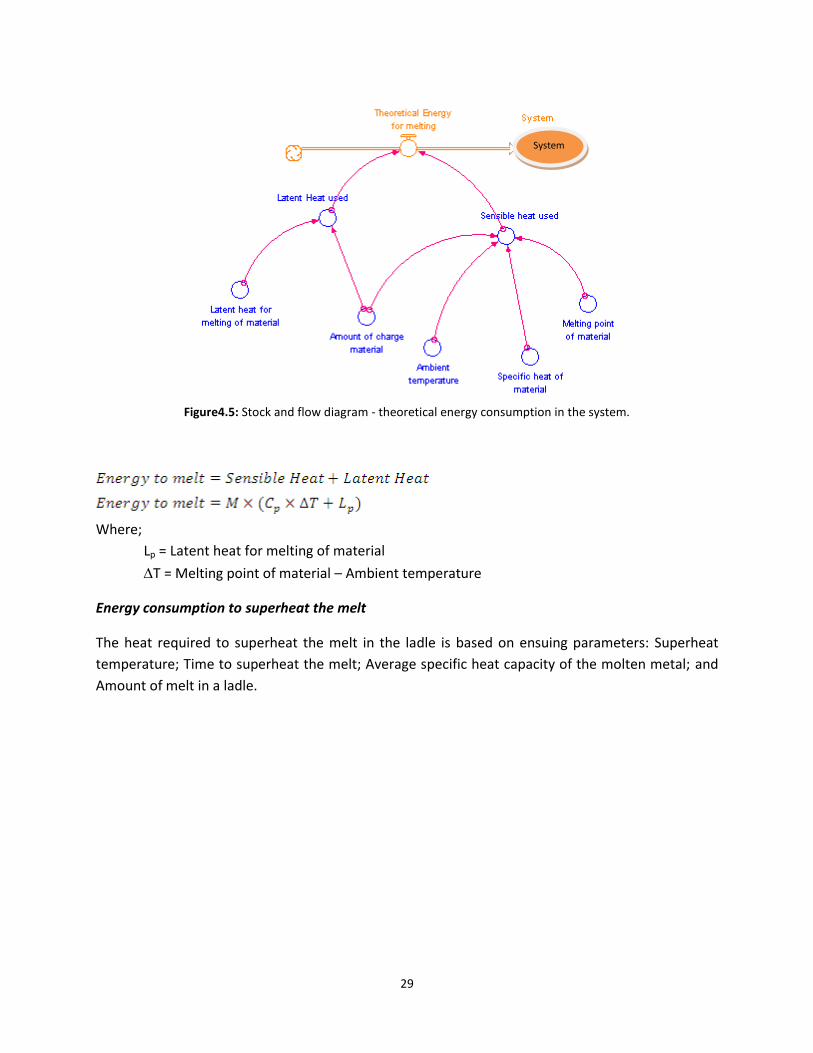
Figure4.5: Stock and flow diagram - theoretical energy consumption in the system.
Where;
Lp = Latent heat for melting of material
T = Melting point of material – Ambient temperature
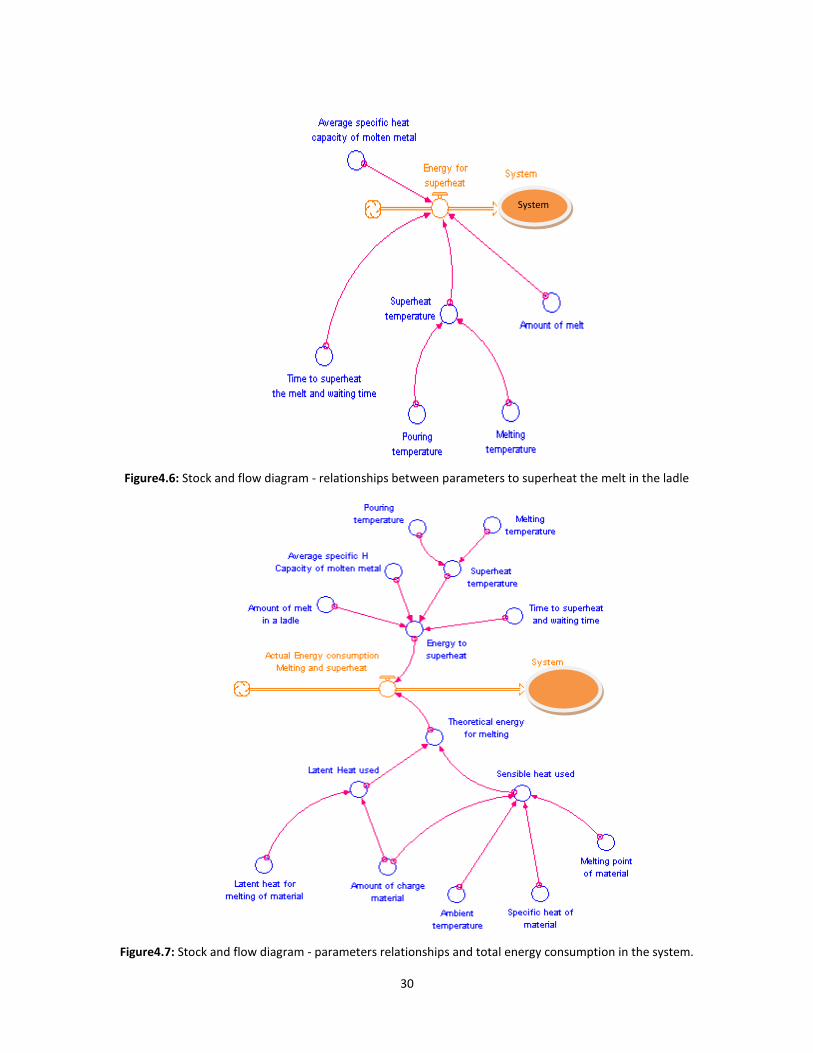
Energy consumption to superheat the melt
The heat required to superheat the melt in the ladle is based on ensuing parameters: Superheat
temperature; Time to superheat the melt; Average specific heat capacity of the molten metal; and
Amount of melt in a ladle.
System
30
Figure4.6: Stock and flow diagram - relationships between parameters to superheat the melt in the ladle
Figure4.7: Stock and flow diagram - parameters relationships and total energy consumption in the system.
System

31
Energy in the system in figure 4.7 = (energy to melt the material + energy to superheat the melt) x
PF; where: PF=performance factor; it is a factor for the actual energy consumption relative to the
theoretical energy consumption.
4.4. Heat losses
Ideally, all heat added to the furnaces should be used to heat the load or stock. In practice,
however, a lot of heat is lost in several ways as shown in figure 4.8. Certain furnace losses (like wall,
storage, conveyor and radiation) are essentially constant regardless of production volume;
therefore, at reduced throughputs, each unit of production has to carry a higher burden of these
fixed losses.
Figure4.8: Possible ways of heat loss in a furnace (1, 2, 3...etc.)
Of the 100% energy supplied how many percent goes to consumption and how many will be lost?
The following Sankey diagram shows the possible ways of energy losses in the system, from the
total energy input i.e. gross input only small percentage of heat is used to melt the material i.e.
useful output (called heat to load).
Heat
input
Furnace Heat in
stock
1
2 3 4 5 6 7

32
Figure4.9: Sankey diagrams- possible heat losses in industrial heating processes.
Heat losses associated with the furnace includes:
− Heat storage in the furnace structure;
− Losses from the furnace outside walls or structure;
− Heat transported out of the furnace by the load conveyors, fixtures, trays, etc;
− Radiation losses from openings, hot exposed parts, etc;
− Heat carried by the cold air infiltration into the furnace [14, 17]
Possible heat losses associated with the furnace are described below; however from undesrtanding
through the literature servey and during visiting of the working place at the plant, in this research ,
only the losses through wall and losses through opening during melting are considered.
1. Losses through opening in the furnace: radiation losses occur when there are openings in
the furnace enclosure, and these losses can be significant, especially for furnaces operating
at temperatures above 540°C. A second loss is through air infiltration, because the drafts of
furnace stacks or chimneys cause a negative pressure inside the furnace, drawing in air
through leaks or cracks or whenever the furnace doors are opened. Heat can be lost by
direct radiation through opening in the furnace, such as the Charging inlet, extracting outlet
and the peephole in the wall or ceiling. [17]
Hot surfaces radiate energy to nearby colder surfaces, and the rate of heat transfer increases with
the fourth power of the surface's absolute temperature. [14]

33
The heat loss through opening in the furnace is based on the parameters below:
− Total time of opening in the furnace during melting;
− Factor of radiation (its value is depends on the wall thickness and door width or diameter of
the furnace). Its value can be read from figure 4.9, below with regard to proportion of the
ratio between diameters (or least width) to thickness of wall, by considering shape of
opening (For the studied plant the shape of the opening is round);
− Black body radiation (depends on the operating temperature of the melting process). Its
value can be referred from standard figure 4.12 below;
− Area of opening in the furnace enclosure (depends on door width and diameter of furnace
opening);
− Emissivity of material;
− Amount of charge materials in the furnace.
Figure4.10: Radiation factor for heat release through openings relative to the quality of heat release from perfect
black body [14, 17]
The factor of radiation through opening can be obtained from standard graph shown in Figure 4.10
above. Its value depends on (a) shape of furnace opening (i.e. round or cylindrical, rectangular,
square, very long slot), and (b) ratio of diameter of the least width to thickness of wall.

34
Figure4.11: Flow diagram-heat loss through opening of furnace and its parameter relationships.
Figure4.12: Relationships between black body radiations and temperature. [14, 17]
2. Furnace skin / surface losses (also called wall losses): while temperatures inside the
furnace are high, heat is conducted through the roof, floor and walls, and emitted to the
ambient air once it reaches the furnace skin or surface.

35
The extent of the wall losses depend on following parameters: Emissivity of wall; Thermal
conductivity of refractories; Wall thickness; and whether the furnace operated continuously or
intermittently.
Additional heat losses take place while the furnace is in production. Wall or transmission losses are
caused by the conduction of heat through the walls, roof, and floor of the heating device, as shown
in Figure 4.13(a). Once the heat reaches the outer skin of the furnace, and radiates to the
surrounding area or is carried away by air currents, it must be replaced by an equal amount of heat
taken from the electric supply (combustion gases). This process continues as long as the furnace is
at an elevated temperature. [14, 17]
Loss through natural convection: Average surface temperature is the temperature measured at the
wall (surface), or ceiling or at the hearth (lower part of a blast furnace, cupola in which the molten
metal collects, and from which it is tapped)
(a) (b)
Figure4.13: (a) Heat loss through wall and (b) Radiation heat loss through opening
The quantity (Q) of heat loss from the furnace skin is the sum of natural convection and thermal
radiation.
.............................2
Where;
Q = Quantity of heat released (kCal/hr.)
a = factor regarding direction of the surface of natural convection ceiling = 2.8, side walls =
2.2, hearth = 1.5;
tl = temperature of external wall surface of the furnace (°C), based on the average of as
many measurements as possible to reduce the error margin;
t2 = temperature of air around the furnace (°C);
E = emissivity of external wall surface of the furnace [17, 22]

36
Radiation: heat is lost from openings, hot exposed parts, etc. Furnaces and ovens operating at
temperatures above 540°C might have significant radiation losses, as shown in Figure 4.13(b). Hot
surfaces radiate energy to nearby colder surfaces, and the rate of heat transfer increases with the
fourth power of the surface's absolute temperature. Anywhere or anytime there is an opening in
the furnace enclosure, heat is lost by radiation, often at a rapid rate.
Figure 4.14: Relations between Surface Temperature and Quantity of Heat Loss. [14, 17]
The first part of equation (2) gives the heat loss through natural convection and the second part is
heat loss through radiation. Figure 4.14 above shows the relation between the temperature of
external wall surface and the quantity of heat release calculated with this formula.
37
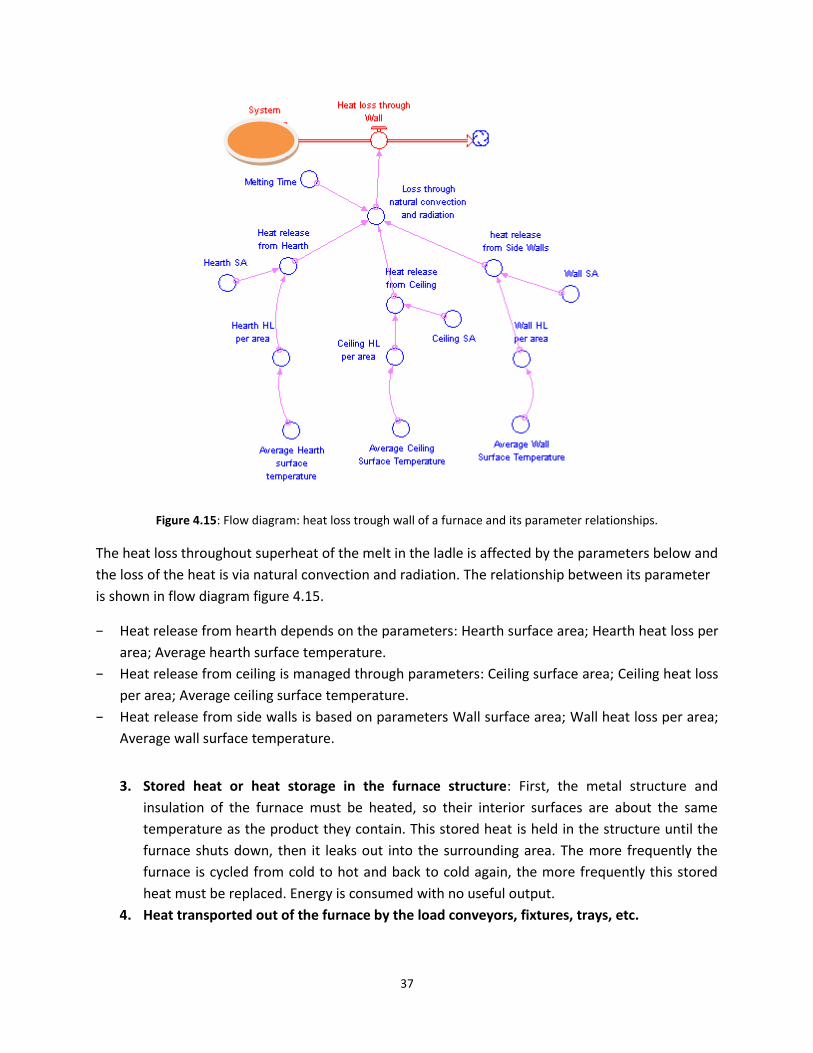
Figure 4.15: Flow diagram: heat loss trough wall of a furnace and its parameter relationships.
The heat loss throughout superheat of the melt in the ladle is affected by the parameters below and
the loss of the heat is via natural convection and radiation. The relationship between its parameter
is shown in flow diagram figure 4.15.
− Heat release from hearth depends on the parameters: Hearth surface area; Hearth heat loss per
area; Average hearth surface temperature.
− Heat release from ceiling is managed through parameters: Ceiling surface area; Ceiling heat loss
per area; Average ceiling surface temperature.
− Heat release from side walls is based on parameters Wall surface area; Wall heat loss per area;
Average wall surface temperature.
3. Stored heat or heat storage in the furnace structure: First, the metal structure and
insulation of the furnace must be heated, so their interior surfaces are about the same
temperature as the product they contain. This stored heat is held in the structure until the
furnace shuts down, then it leaks out into the surrounding area. The more frequently the
furnace is cycled from cold to hot and back to cold again, the more frequently this stored
heat must be replaced. Energy is consumed with no useful output.
4. Heat transported out of the furnace by the load conveyors, fixtures, trays, etc.

38
5. Heat carried by the cold air infiltration into the furnace: Excess air does not necessarily
enter the furnace as part of the combustion air supply. It can also infiltrate from the
surrounding room, if there is a negative pressure in the furnace. Because of the draft effect
of hot furnace stacks, negative pressures are fairly common, and cold air slips past leaky
door seals, cracks and other openings in the furnace. Figure 4.13 illustrates air infiltration
from outside the furnace. When the door is opened, considerable amount of heat is lost.
6. Material handling loss.
4.5. Energy used - Holding Molten Metals
The molten metal is often held in a furnace before being poured or injected into molds to allow for
a continuous supply of molten metal from the melting furnace with consistent composition and
quality shown in figure 4.16(a). Holding furnaces also help casters take advantage of the off-peak
electricity hours to melt charges at reduced energy rates. However, the holding step in the melting
process adds to melting inefficiencies, because energy is used in holding the metal in its molten
state. An ideal melting operation would melt metal into its liquid state, and then transport that
metal directly to the pouring lines without any delay, eliminating the need to hold the molten bath
in a holding furnace.
Figure4.16: Left (a) Holding furnace; Right (b) Filling of iron in the ladle
4.6. Energy used - Transporting Molten Metals
After being tapped, the molten metal must be transported from the melting furnace to the holding
furnace or the pouring lines. Different types of ladles are used to pour the molten metal into the
mold cavities. These include bottom-pour, lip-pour, teapot, hand, bull, trolley, and crane. Ideally,
transfer ladles are preheated to maintain the required pouring temperature at the pouring station.
Some operations also practice “superheating” the melt, i.e., raising the temperature several
hundred degrees above the pouring temperature, to achieve the same result. The transfer ladle
capacities can range from 100 pounds to 35 tons, or higher depending on the foundry’s production
capacity [10, 21]. Transfer ladles consume significant energy because they require preheating

39
and/or superheating the melt to maintain the desired pouring temperature. Additionally,
substantial radiation loss can occur from the top and the sides of the ladle.
4.7. Energy Loss due to delay
The heat loss due to superheat the melt in the ladle is affected by the parameters below and the
parameter relationships is depicted in figure 4.17:
− Holding time of the melt in the ladle prior to pouring in to the mould;
− Amount of melt in a ladle;
Conduction heat transfer through refractory lining; it also is influenced by the parameters:
Refractory thickness of the ladle; Thermal conductivity of material; Area of ladle;
Temperature of cold surface; and Temperature of hot surface
− Heat radiation from hot surface this itself is managed through ensuing parameters: Area of
ladle; Temperature of cold surface; Temperature of hot surface and Emissivity of refractory
body
− Loss during superheating the melt
Figure4.17: heat losses due to delay of the metal in a ladle before pouring into the mould, and its parameter
relationship.
System

40
Figure 4.18: Total heat loss in the system- loss trough furnace and ladle.
4.8. Energy Recovery with heated structural material as an input
In this case it is assumed that the metal is poured in the mould and when the casting has solidified,
the mould is knocked out before cooling. Once removed, the casting will likely have some sand and
oxide layers adhered to the surface, and these are cleaned from the remaining sand. Then the
feeder and gating system (inlet) of the casting will be trimmed by some mechanism. These
warmed/hot/heated scrap materials that results from this trimming are reused as an input in the
sand casting process, and hence the scrap for the next cycle can be considered as preheated or
heated scrap.
System

41
At the given manufacturing plant, there is no mechanism to reuse the scrap before it has cooled
down, but assumed what will be the result or consequence if the scrap is reused keeping its highest
temperature compared to the cooled scrap re used before?
When the heated scrap is used in the furnace with crude iron and other raw material what will be
the change in the energy consumption compared to the cold scrap used before? In the model it is
seen that how the energy supplied will be affected. As information found from the company and
from different literatures, the scrap from the gate and inlet during casting of Cylinder Head
constitutes 40% of the total material used.
Parameters for energy input for structural material is the same as parameters for total theoretical
energy consumption, Figure 4.5.
Energy used to melt the heated structural material /scrap is affected by the parameters below:
− Latent heat for melting of scrap material;
− Amount of scrap material;
− Ambient temperature/ temperature of preheated scrap;
− Melting point of material;
− Specific heat of material;
− Time.
In this case ambient temperature is the initial temperature of scrap material. That is the
temperature of the scrap material when it is cast out from the mold. And we take this as an initial
temperature for the system.
Assume the scarp has a temperature in the interval between 300 -700 0C.
Figure4.19: Energy difference between warm scrap and cooled scarp for structural material.
From figure 4.19 above energy input for structural material is an input to the system Energy and
energy to melt structural material is an output. Accordingly, the value of energy will be the
difference between energy input for structural material and energy to melt structural material.
Only 60 % of the melt in the system is used for production of the strand or Cylinder Head. The
remaining 40 % is used as scrap (runner, gates, riser, etc...). Hence, energy input for structural
material will be 40% of the total energy used to melt the material in the furnace. Energy to melt
structural material can be calculated by the variables given in equation 1.

42
Figure4.20: Comparison of energy required to melt structural material (for cooled scrap and warm scrap) and their
parameters relationship.
When heated scrap is used, after simulation if the value of energy in the stock as shown in figure
4.20 is positive this shows there is a possibility to save energy supply for the subsequent process.
On the other hand, if it is negative there is a loss of energy when heated scrap is charged into the
furnace.
Overall model of Stock and flow diagram of energy input, energy output and energy losses is
described in figure 4.21 and Stock and flow diagram for energy with considering heated scrap as
input in the system is shown on figure 4.22 below.

43
Figure4.21: Stock-flow diagram: - energy input, energy consumption and possible heat losses.
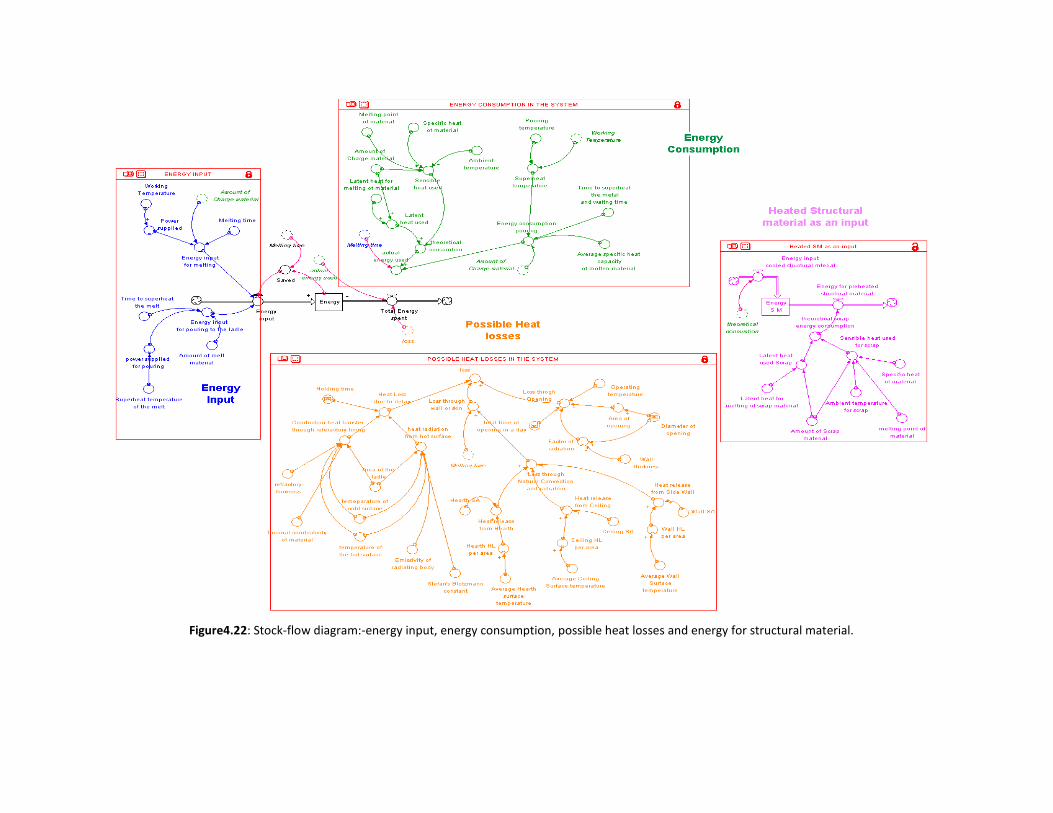
44
Figure4.22: Stock-flow diagram:-energy input, energy consumption, possible heat losses and energy for structural material.
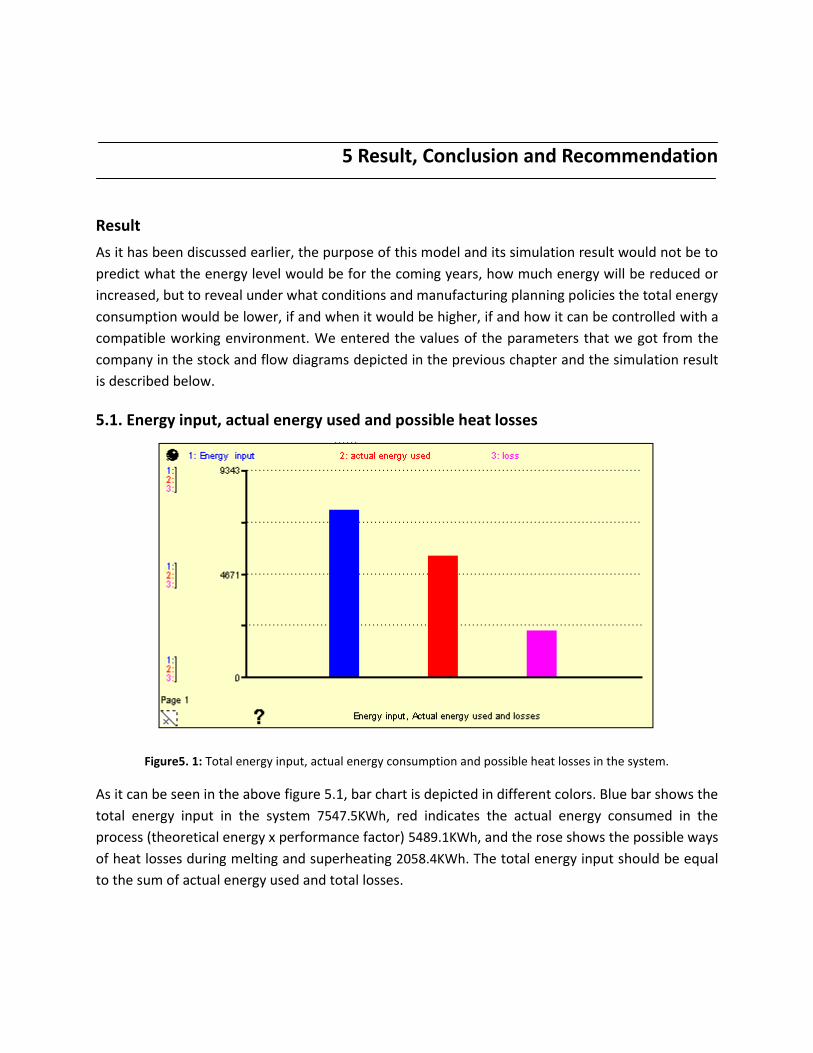
45
5 Result, Conclusion and Recommendation
Result
As it has been discussed earlier, the purpose of this model and its simulation result would not be to
predict what the energy level would be for the coming years, how much energy will be reduced or
increased, but to reveal under what conditions and manufacturing planning policies the total energy
consumption would be lower, if and when it would be higher, if and how it can be controlled with a
compatible working environment. We entered the values of the parameters that we got from the
company in the stock and flow diagrams depicted in the previous chapter and the simulation result
is described below.
5.1. Energy input, actual energy used and possible heat losses
Figure5. 1: Total energy input, actual energy consumption and possible heat losses in the system.
As it can be seen in the above figure 5.1, bar chart is depicted in different colors. Blue bar shows the
total energy input in the system 7547.5KWh, red indicates the actual energy consumed in the
process (theoretical energy x performance factor) 5489.1KWh, and the rose shows the possible ways
of heat losses during melting and superheating 2058.4KWh. The total energy input should be equal
to the sum of actual energy used and total losses.

46
As discussed earlier in section 4.5, the heat losses can be through opening of the furnace during
charging in raw material, during checking the elemental composition of the melt, due to delay of
the melt before pouring, through natural convection and radiation.
5.2. Energy or Heat losses in the system
Figure5. 2: Possible ways of heat losses in the system: losses in the system: loss through opening, wall or surface
loss, heat losses due to delay. Blue heat losses through opening; Red: Losses through wall or skin of furnace; and
Green: heat losses due to delay.
The simulation result depicted in above figure 5.2 shows the comparison of the different ways of
heat losses in the system. It can clearly be seen that heat losses due to delay, 1691.4KWh, is the
highest proportion of heat losses in the system. As compared to heat losses due to delay and heat
losses through opening in furnace (359.4KWh) the heat loss through wall is very small which is
7.6KWh; it can even be neglected. But if it stands alone, it will have a higher impact in the process.
The losses due to delay is the highest, and it is followed by losses through opening and losses
through natural convection and radiation.
To point out the parameters which have the highest impact on the heat losses in the process, we
will scrutinize the parameters of heat losses through delay and opening only. In the given scenario
its a reasonable approach as heat losses through wall or skin are almost negligible.

47
5.3. Potential Energy Savings
5.3.1. Energy input and potential energy saving as a function of time.
Figure 5. 3: Potential energy saving (energy input and potential energy saving as a function of time)
In repetitive simulation of the model under the same condition, the energy input in the next
simulation will be different from the earlier one unless a constant level (stability) is reached.
As it can be seen in the stock and flow diagram, figure 4.3, there is a relationship between amounts
of energy input and energy stored in the stock (system). In reality energy is not accumulated in a
container or reservoir, but in this research it is assumed an excess or shortage of energy
accumulated in the stock. Initially, energy input is power supplied*working time*mass. However
through repetitive simulation (continuous processing) the energy input for the next run is reduced
or increased by the amount of energy in the stock. That is the new energy input, Energy Input (N),
for the next simulation run is:
Energy Input (N) = Energy input to melting + Energy input to superheat the melt – saved energy;
Where Saved energy = Total energy in the Stock (i.e. excess energy in the stock; which is (Energy
input – Energy output).
Therefor power saved = (Energy input – energy output)/melting time
The blue line shows energy input which is a negative exponential behavior. This is the fact that in
the beginning the energy input is higher but through repetitive simulation it is decreased and
reaches stability at some point of time.

48
The red line shows possible saved energy which shows positive exponential behavior. In the
beginning of simulation it has zero value. Through repetitive simulation it is increased and reaches
stability at some point of time.
Change type of material
As discussed in section 4.3. Power supplied in the stock is managed through type of material used. If
type of material is changed, there is an opportunity to decrease or increase power supply in the
stock. For future, if the company has the possibility to change the type of material used for casting,
the energy required for melting can be reduced using materials that requires the lowest total heat
while keeping the quality of the product. Below table, Table 4.1 is the relationship between type of
material and the heat requirement for metal melting.
Table5. 1: Relationships between types of material and their heat requirement for metal melting (10, 17, 18, 19)

49
1. Reduce heat losses due to delay:- Varying holding time of the melt in a ladle before pouring
in a mould
Figure5.4: Heat losses due to delay of the melt in the ladle with different values of holding time as a function of
time.
On the very left top side of above figure 5.5 slider input device, displays one of the parameters that
have an influence on the working process. The change in the value of the parameter will make a
change in the process in aspect of energy input, output, and losses.
Following possible ways of potential energy saving in the system will be considered. As it is
discussed above system dynamics doesn’t tell us how much energy will be saved for next year or
the year after and so on but what if the company can reduce the holding time , then there will be a
potential energy saving. In other words if the holding time increases to a higher value there will be
higher heat losses in the system as clearly shown in the above figure.
As shown figure 5.5 the bar in blue color displays the simulation result with the given data i.e.
holding time (HT = 0.683hr) which is 1691.4KWh. When the holding time increases to 1 hour and to
1.25 hour, the simulation results are shown in the bar with green (2476.4KWh) and orange color
(3095.5KWh) respectively. Hence, it can easily be seen that the heat losses in the system is
increased by 40% and 83% correspondingly. In other words, when the holding time decline to 0.5
hour and to 0.4 hour the total heat losses in the system will be shown on the bar graph with red
(1238.2KWh) and rose color (990.6KWh) respectively. That is the heat loss will be reduced by 27%
and 42% respectively. If the company has the likelihood to change the holding time to a lower value
in the system, the heat losses will be reduced and this will be one of the potential energy saving
methods in the system.
From here, it can be conclude that the heat losses reduce linearly with holding time.

50
5.3.2. Losses through opening- varying opening time and area of opening
By varying the values of the parameters on opening time and area of opening independently in the
overall model, possible potential energy saving through opening of furnace in the system is
examined.
5.3.2.1. Varying opening time
Figure5. 5: Heat losses due to opening of furnace with different values of opening times
The first simulation bar, blue which is 359.4KWh, shows the simulation result with the given value
of opening time, 0.75 hour. As can be seen on green and orange bar, increasing the opening time of
the furnace during processing to 0.8 and to 1 hour, increase the heat loss by 6.7% (383.4KWh) and
33%(383.4KWh) respectively. On the other hand when the opening time of the furnace is reduced
to a lower value 0.65 hour and 0.5 hour the heat losses due to opening also decreases as shown in
red and pink bar 311.5KWh and 239.6KWh. That is the loss of heat is reduced by 13% and 33.3%
respectively according to figure 5.5.
Heat loss through opening with changing time of opening
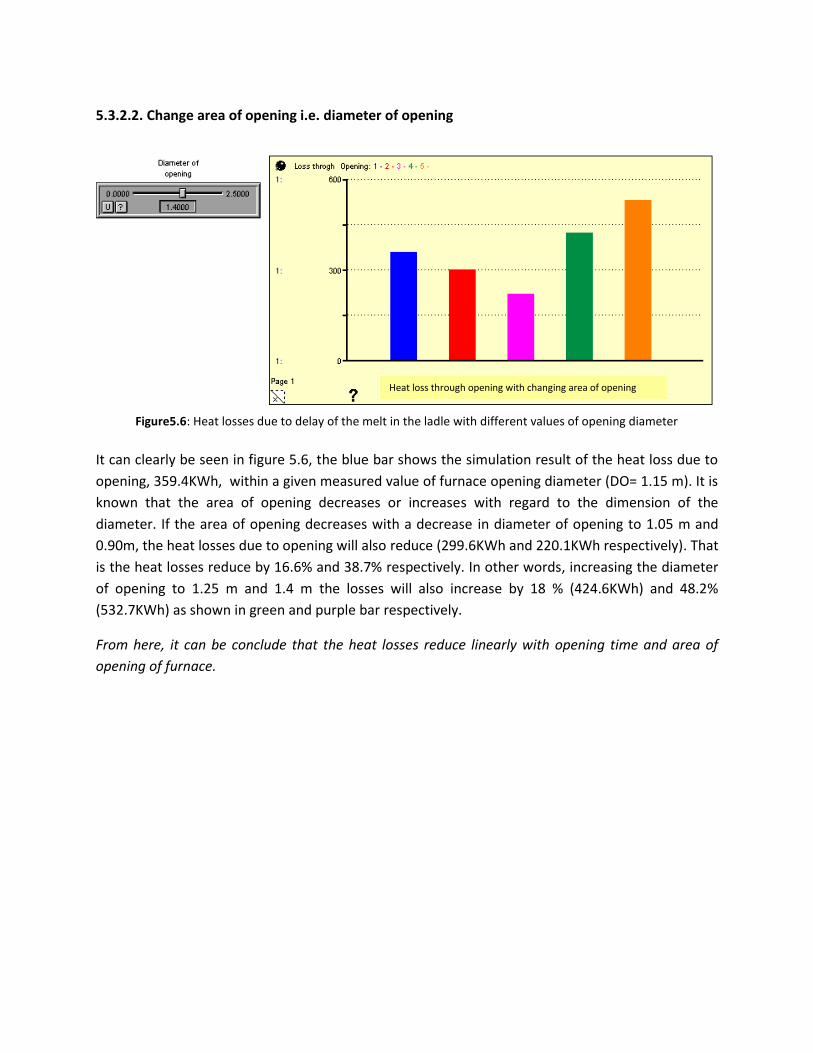
51
5.3.2.2. Change area of opening i.e. diameter of opening
Figure5.6: Heat losses due to delay of the melt in the ladle with different values of opening diameter
It can clearly be seen in figure 5.6, the blue bar shows the simulation result of the heat loss due to
opening, 359.4KWh, within a given measured value of furnace opening diameter (DO= 1.15 m). It is
known that the area of opening decreases or increases with regard to the dimension of the
diameter. If the area of opening decreases with a decrease in diameter of opening to 1.05 m and
0.90m, the heat losses due to opening will also reduce (299.6KWh and 220.1KWh respectively). That
is the heat losses reduce by 16.6% and 38.7% respectively. In other words, increasing the diameter
of opening to 1.25 m and 1.4 m the losses will also increase by 18 % (424.6KWh) and 48.2%
(532.7KWh) as shown in green and purple bar respectively.
From here, it can be conclude that the heat losses reduce linearly with opening time and area of
opening of furnace.
Heat loss through opening with changing area of opening

52
5.4. Energy input–heated structural material as an input
Figure5. 7: Energy input for warmed (pre-heated - red) 1150.8KWh and cooled (rose) scrap 1260.4KWh
Figure 5.7 above depict simulation result for the amount of energy needed to heat preheated and
cooled structural material as a function of time. As can been discussed earlier the structural
material used in the system is 40% of the total material charged in the furnace. From the simulation
result, the red bar shows the energy needed to heat the preheated structural material when the
temperature for heated scrap is 300 oC. While the bar in rose color shows the amount of energy
needed to heat the cooled structural material. From here, it can easily be seen that using the
preheated structural material has a higher probability to save energy than using cooled scrap.

53
5.4.1. Possible Energy saving –varying scrap temperature
Figure5. 8: Possible energy saving with varying scrap temperature (Blue at 300 0C)
According to figure 4.17, the stock ‘’Energy structural material’’ in a sub model of ‘’heated
structural material as an input’’ is the difference between the energy needed for cooled scrap and
preheated scrap. If the value of simulation result for ‘’Energy Structural Material’’ is positive and
higher, this implies there is a higher potential saving energy when the preheated scrap in the
system is used
The bar graph, figure 5.8, demonstrates the different possibilities of saving energy when the
temperature of preheated scraps is changed. The first simulation result in blue bar 2313.42KWh
shows the possible amount of energy saving when the preheated scrap temperature is 300 oC. If the
company keeps the scrap temperature higher there is also a higher potential of saving energy. The
simulation result in red bar shows when the scrap temperature is reduced to 250oC the potential
saving energy will decrease by 27.7%, which is 1670.8KWh. The next two consecutive simulation
results in rose and green color bar have a preheated scrap temperature of 550 and 700 oC
respectively and hence the potential saving energy will increase by 138.86% and 222% (5526.4 and
7454.2KWh) accordingly (again % comparison will be more useful)
From here it can be concluded that potential saving energy increase linearly with the heated scrap
temperature.

54
Model validation test
Some of the model validation tests have been performed on the model these are boundary adequacy,
parameter assessment, and extreme condition test.
− Boundary adequacy: the behavior of the model is not changed when the boundary is
changed.
− Parameter assessment: empirically or theoretically the model has been tested and it
shows the constants in the model agree to the real system.
− Extreme condition test: the model is tested using extreme condition test. The model
achieves similar behavior in an extreme condition.

55
Conclusion
System dynamics modeling and simulation is the technique for framing, understanding, and
discussing complex issues and problems and it is a potential tool for increasing the utilization of
systems.
The energy challenge is one of the greatest tests faced in the world today. But the energy which
most manufacturing companies consume should be more secure and sustainable. By using system
dynamics approach in this project areas of high energy usage are identified, energy wastage and
areas in which energy saving accomplished is also pointed out.
In this research work casting process for production of cylinder head is considered. The most energy
intensive processes which are melting and holding of metal before pouring have been chosen for
modelling. The model is focused on energy input, consumption and losses in the system.
Parameters in each process are identified and using Stella software their relationships are depicted
in the stock-flow diagram. Through modelling the most influential parameters that have an impact
on energy consumption and that offer possibility for improving energy efficiency are identified.
These are holding time of melt, furnace opening time during melting, furnace area of opening and
temperature of the scrap.
Among them ‘holding time (time delay) and ‘temperature of the scrap material (structure of the
mould after casted part is separated)’ has the highest impact on improving energy efficiency.
Almost 1/3 of the energy losses in the melting process are caused by the delay. For example, about
1321200 KJ energy is possible to save if the delay is reduced (current average delay is about 40
minutes) by 10 minutes. Similarly 60% of the volume of a mould accounts for cylinder head and
remaining 40 % is structure (gates, runners, risers, etc.) of the mould. Currently the mould is cooled
down to the ambient temperature and mould structure is separated from the cylinder head and
then recharged (after primary treatment and pre-heating) in the furnace for re-melting. If the
mould structure is separated from the cylinder head at higher temperature (not waiting until it
reaches to ambient temperature) substantial amount of energy could be saved. For instance, with
the current capacity of the melting process at the given plant, each 10° C of recovered heat can save
up to 460800KJ energy.
It is clear that the melting time for warmed scrap is smaller than that of cooled or unheated one.
Since the company hasn’t reused the scrap before completely cooling, it is not possible to get the
right figure for melting time to heat the warmed scrap. Due to this, to calculate the energy input for
structural material, in this project, the melting time hasn’t been taken into consideration. But, if the
melting time is taken into consideration there is also a greater possibility to save energy.
Though cost is not considered as a modeling parameter, however, it can be easily determined that
an increase in energy consumption will increase the cost and if energy is reduced cost will also be
reduced.

56
In this research work, the simulation result doesn’t show the behavior of system dynamics and
modelling which had been previously explained in section 2.2. But it is a system dynamics modeling
approach. However using system dynamics modeling and simulation approach the output from this
research work can be used as an input for the real simulation analysis to work out (analyze) on the
energy efficiency in the interaction with the whole system.
Process
Customers
Design Energy
Technology
Figure 5.9: An example of complete System Dynamics Modelling for a product manufacturing
For example to manufacture a product there is a manufacturing system which comprises different
interrelated functions. For example they can be process, design, customer, technology and
energy/environment. These functions or sub systems have interactions within and among themselves;
however they are stand-alone systems as well. To model the behavior of the whole system, first each
sub system should be modeled independently. However instead of modeling them as black boxes, they
can be modeled with a system dynamics approach. For example in this research work, a system
dynamics approach is used to come up with an output for energy/environment section. The output from
this research work can be an input to the system shown figure 5.9 above to make a complete SD model
for manufacturing.

57
Recommendation and Future Work
To know how much energy is used, lost or saved for a given product, it is recommended to go
through the whole processing steps from the raw material to the end products
In the future it is recommended to take into account most of the parameters and all processing
steps in the analysis to know exactly the energy loss in the system.
Figure5. 10: Temperature time graph of melting of material in the furnace.
As can be shown above figure 5.10, there is a huge energy waste when heating up and cooling
down of the furnace each day. Here, there is a great possibility to save energy if they work
continuously.
In area of time line t1, the metal structure and insulation of the furnace must be heated, so their
interior surfaces are about the same temperature as the product they contain. Hence to warm the
furnace from ambient temperature to working temperature heat is needed. In the time line t2 since
it reaches the working temperature almost constant amount of energy (heat) is needed to keep the
temperature of the furnace. This stored heat is held in the structure until the furnace shuts down.
At time line t3 the stored heat leaks out into the surrounding area to cool down the furnace, hence
heat will be lost. The more frequently the furnace is cycled from cold to hot and back to cold again,
the more frequently this stored heat must be replaced. Energy is consumed with no useful output.
This is what is going on in a daily operation. But if they are working continuously, 24 hrs, the heat
needed to heat up the furnace and the heat lost due to cooling down of the refractory lines in the
furnace will be saved.
ttransient ttransient tsteady

58
So the temperature time graph of our system will be only in the range of t2 unless some
uncertainties like failing of the machine, maintenance time, shift over of the machine.

59
References
1. Michael J. Radzicki & Robert A. Taylor, 1997, A Systems Approach to Understanding
Complex Policy Issues
2. Unknown, Retrieved on Nov 2011, System Dynamics. [Online].
http://sysdyn.clexchange.org/sd-intro/home.html
3. Foundations of System Dynamics Modeling, 1997, Retrieved November 2011 [Online]
http://www.systemdynamics.org/DL-IntroSysDyn/start.htm
4. Jay W. Forrester and the History of System Dynamics, Retrieved Nov 2011, Origin of System
Dynamics. [Online] http://www.systemdynamics.org/DL-IntroSysDyn/start.htm
5. John D. Sterman, 2000, Business Dynamics: System Thinking and Modeling for a Complex
World.
6. Unknown. Sand Casting, 2009, Retrieved Mar 2011. [Online]
http://www.custompartnet.com/wu/SandCasting
7. Peter Beeley, 1972, Foundry Technology. 2nd edition. A division of Reed Educational and
Professional Publishing Ltd.
8. H. Hoffman, 2002, Casting Metal Parts. Action Book publishers
9. Steve Hurst, 1996, Metal casting: Appropriate technology in the small foundry. Intermediate
Technology Publications Ltd;
10. Robert D. Naranjo, Ji-Yea Kwon, Rajita Majumdar, and William T. Choate, November 2005,
Advanced Melting Technology: Energy Saving Concepts and Opportunities for the Metal
Casting Industry. BSC, Incorporated,
11. Unknown. Sand Casting. Retrieved July 2010. [Online]
http://www.ider.herts.ac.uk/school/courseware/manufacture/casting/sand_casting.html
12. Confidential.
13. Unknown. Melting and pouring, Latest techniques and innovations in foundry processes and
equipment. Retrieved on March 2010 .[Online]
http://www.highbeam.com/doc/1G1-12624863.html
14. A Best practices Process Heating Technical Brief, Waste Heat Reduction and Recovery for
Improving Furnace Efficiency, Productivity and Emissions Performance. U.S. Department of
Energy. Retrieved on March 2010. [Online]
http://www1.eere.energy.gov/industry/bestpractices/pdfs/35876.pdf
15. Conduction, Convection, Radiation in Green Homes. Retrieved on March 2010 [Online]
http://cyberparent.com/green-building/heat-transfer-green-building.htm
16. Getting Ideas for Energy Management Opportunities. Retrieved on February 2010 [Online]
http://oee.nrcan.gc.ca/cipec/ieep/newscentre/foundry/2/2_3_6.cfm
17. Energy efficiency Guide for Industry in Asia. Retrieved on March 2010 [Online]
www.energyefficiencyasia.org ©UNEP 2006

60
18. Unknown. Source for Materials Information. Retrieved April 2011. [Online]
www.matweb.com
19. Unknown. Material properties from the Engineering ToolBox. Retrieved April 2011. [Online]
www.engineeringtoolbox.com
20. Hasse Fredriksson, Ulla Åkerlind. Material Processing during Casting. John Wiley & Sons, Ltd,
2006.
21. Unal Camdali , Murat. Tun, 2006. Steady State Heat Transfer of Ladle Furnace During Steel
Production Process; Journal of Iron and Steel Research, International.
22. Dr. E. G. Hoel, C. M. Ecob and D. S. White. Heat Conservation in Liquid Iron. Elkem Foundry
Products; Reviewed 2005-07-10[Online].
http://www.scribd.com/doc/31036568/Heat-Conservation-in-Liquid-Iron.pdf
23. Kambiz E. Maani, Robert Y. Cavana, 2007. System Thinking, System Dynamics: Managing
Changes and Complexity. Pearson Education, 2nd edt.
24. ‘Energy 2020 — A strategy for competitive, sustainable and secure energy’ (COM (2010) 639
final of 10 November 2010) and a foreword by Commissioner Günther Oettinger.
Publications Office of the European Union, 2011. ISBN 978-92-79-18869-5
25. European Commission. Retrieved on Feb 2011 [Online]
http://ec.europa.eu/index_en.htm
26. Dimitrios Vlachos∗, Patroklos Georgiadis, Eleftherios Iakovou. April 2006. A system dynamics
model for dynamic capacity planning of remanufacturing in closed-loop supply chains
27. Stephanie Albin, 1997. Building a System Dynamics Model: Conceptualization (D-4597),
System Dynamics in Education Project, System Dynamics Group, Sloan School of
Management, Massachusetts Institute of Technology June 30, 36 pp. [online]
28. Unknown. Engine Mechanics. Retrieved April 2011. [Online] www.tpub.com
29. Gary Linneusson, 2009. On System Dynamics as an approach for Manufacturing System
Development. Chalmers University of Technology, Göteborg, Sweden.

61
Appendix
Appendix 1
Values of the wall (surface), ceiling and hearth surface temperature measured at plant foundry
Figure: Left - Furnace bottom FLIR; Right- Furnace lid FLIR
Figure (Left) Furnace Lid FLIR2; Right – Furnace side FLIR

62
Figure: (left) Furnace Lid (right) Furnace lower part
Figure :( Left) Furnace upper part (right) Furnace with Lid

63

64
Appendix 2: Data sheet format prepared for the manufacturing company
No
Parameter
Interpretation of the term used in the model
Is relevant to the company
Data/Value
Comment
Yes No Known(put the value)
Unknown
1 Energy Input Type of furnace The type of furnace used in the system Capacity of furnace The maximum capacity of the furnace to hold the material (i.e., actual
capacity vs. utilized)
Total working time per day the total working time in a foundry per day (number of batches if relevant) Melting time per batch It is the time takes to melt the material from charging till pouring in one
batches
Power supplied per batch the power supplied in the system either per batch/ per day/ per moth/ per year
Working/operating temperature
operating temperature of the material in the process
Required output temperature The desired output temperature value of molten metal Type of material It is the type of material used for the production of CH in the process Amount of material per
furnace the amount of material to be charged in a furnace per batch
superheat temperature it is the difference bn working temperature and pouring temperature capacity of the ladle the maximum capacity of ladle that hold the melt poured from the
furnace
Amount of melt in the ladle amount of melt poured from the furnace in to the ladle to ready for superheat
time to superheat the melt in a ladle
the time used to superheat the melt in a ladle to ready for pouring in the mould
power supplied to superheat the power supplied to superheat the melt in a ladle per batch/ per day/ per moth/ per year
2 Energy Consumptions
Type of material the type of material used in the process
Performance factor difference between actual and theoretical energy consumption(allowance to the actual energy consumption)

65
3 Energy Losses/Losses through opening
Total time of opening per batch
the total time of opening during melting in a batch
Furnace wall thickness the thickness of the wall lining the furnace
Shape of Furnace the shape of the furnace door(either rectangular or circular)
If Rectangular/Square:
Furnace opening door width width of the door opening
Furnace Door wide length of the door opening
If Circular
Diameter of door the diameter of the opening door
Ambient temperature temperature of the working area or environment
Energy Losses/Losses through wall or skin or surface
Average hearth surface temperature
average measured surface temperature of the lower part of a blast furnace
Hearth surface area surface area of lower part of the furnace
Average ceiling surface temperature Ceiling average measured surface temperature of a blast furnace
Ceiling surface area Surface area of the ceiling
Average wall surface temperature Average measured surface temperature of the wall of a blast furnace
Wall surface area surface area of wall of the furnace
Shape of the ladle shape of the ladle that hold the melt before pouring into the mould
Area of the ladle width and length or diameter and height of the ladle
referactory thickness the thickness of refractory lining the ladle
holding time holding time of the melt in the ladle before it is pouring into the mould
Others
The time interval between batches the time delay between the charge of the material in batches
working day and time per week the number of working hours and days in a week
Average time to feed material
As you mentioned material is not feed at one time, we need to know what is the average time for feeding and either the feeding is continuously or in an interval.
Average working day and the number of working hours and days in a week

66
hour per week
Pouring Temperature
The maximum pouring temperature and desired temp. Of molten metal in the furnace
NB:
Performance factor: it is the difference between the actual and theoretical energy consumption. The theoretical/calculated value of energy consumption is known and
there should be an allowance added for the actual that will make the system safe, and in our case we call this allowance Performance factor
Q: Is the power supplied in the system influenced by the amount of material /when the furnace working in full capacity or below its capacity?
Please include in the following section other parameters which are not included in the model but according to you (company) important and relevant to improve the model
Parameter Interpretation of the term used in the model Data/Value
Known (put the value) Unknown

67
Appendix 3: Value of parameters – The manufacturing plant foundry process
No
Parameter
Interpretation of the term used in the model
1 Energy Input
Type of furnace The type of furnace used in the system
Capacity of furnace The maximum capacity of the furnace to hold the material (i.e., actual capacity vs. utilized)
Total working time per day the total working time in a foundry per day (number of batches if relevant)
Melting time per batch It is the time takes to melt the material from charging till pouring in one batches
Power supplied per batch the power supplied in the system either per batch/ per day/ per moth/ per year
Working/operating temperature
operating temperature of the material in the process
Required output temperature The desired output temperature value of molten metal
Type of material It is the type of material used for the production of CH in the process
Amount of material per furnace
the amount of material to be charged in a furnace per batch
superheat temperature it is the difference bn working temperature and pouring temperature
capacity of the ladle the maximum capacity of ladle that hold the melt poured from the furnace
Amount of melt in the ladle amount of melt poured from the furnace in to the ladle to ready for superheat
time to superheat the melt in a ladle
the time used to superheat the melt in a ladle to ready for pouring in the mould
power supplied to superheat the power supplied to superheat the melt in a ladle per batch/ per day/ per moth/ per year

68
2 Energy Consumptions
Type of material the type of material used in the process
Performance factor difference between actual and theoretical energy consumption(allowance to the actual energy consumption)
3 Energy Losses/Losses through opening
Total time of opening per batch
the total time of opening during melting in a batch
Furnace wall thickness the thickness of the wall lining the furnace
Shape of Furnace the shape of the furnace door(either rectangular or circular)
If Rectangular/Square:
Furnace opening door width width of the door opening
Furnace Door wide length of the door opening
If Circular
Diameter of door the diameter of the opening door
Ambient temperature temperature of the working area or environment
4 Energy Losses/Losses through wall or skin or surface
Average hearth surface temperature
average measured surface temperature of the lower part of a blast furnace
Hearth surface area surface area of lower part of the furnace
Average ceiling surface temperature
Ceiling average measured surface temperature of a blast furnace
Ceiling surface area Surface area of the ceiling
Average wall surface temperature
Average measured surface temperature of the wall of a blast furnace
Wall surface area surface area of wall of the furnace
Shape of the ladle shape of the ladle that hold the melt before pouring into the mould
Area of the ladle width and length or diameter and height of the ladle
refractory thickness the thickness of refractory lining the ladle
holding time holding time of the melt in the ladle before it is pouring into the mould

69
Others
The time interval between batches
the time delay between the charge of the material in batches
working day and time per week
the number of working hours and days in a week
Average time to feed material As you mentioned material is not feed at one time, we need to know what is the average time for feeding and either the feeding is continuously or in an interval.
Average working day and hour per week
the number of working hours and days in a week
Pouring Temperature The maximum pouring temperature and desired temp. Of molten metal in the furnace
Comments:
A. By superheat we mean the maximum temperature in the furnace over which need to pour. E.g. it superheats to 1500°C, then pour furnace to ladle when the
temperature in the furnace is 1470°C. The temperature in ladle after tapping is 1455°C and the liquids temperature is 1200°.
B. Performance factor is assumed to be 1.2