Embed Size (px)
Citation preview
Contents lists available at SciVerse ScienceDirect
Journal of the Mechanics and Physics of Solids
Journal of the Mechanics and Physics of Solids 60 (2012) 55–66
0022-50
doi:10.1
n Corrnn Cor
E-m
journal homepage: www.elsevier.com/locate/jmps
Mapping forces in a 3D elastic assembly of grains
Mohammad Saadatfar a,n, Adrian P. Sheppard a, Tim J. Senden a, Alexandre J. Kabla b,nn
a Research School of Physics and Engineering, The Australian National University, Canberra ACT 0200, Australiab Department of Engineering, University of Cambridge, Trumpington Street, CB2 1PZ Cambridge, UK
a r t i c l e i n f o
Article history:
Received 26 February 2011
Received in revised form
29 September 2011
Accepted 2 October 2011Available online 6 October 2011
Keywords:
Granular matter
Force measurement
3D image processing
Tomography
Segmentation
96/$ - see front matter Crown Copyright & 2
016/j.jmps.2011.10.001
esponding author. Fax: þ61 2 61250732.
responding author. Fax: þ44 1223 3 32662.
ail addresses: [email protected] (M
a b s t r a c t
Our understanding of the elasticity and rheology of disordered materials, such as
granular piles, foams, emulsions or dense suspensions relies on improving experimental
tools to characterise their behaviour at the particle scale. While 2D observations are
now routinely carried out in laboratories, 3D measurements remain a challenge. In this
paper, we use a simple model system, a packing of soft elastic spheres, to illustrate the
capability of X-ray microtomography to characterise the internal structure and local
behaviour of granular systems. Image analysis techniques can resolve grain positions,
shapes and contact areas; this is used to investigate the material’s microstructure and
its evolution upon strain. In addition to morphological measurements, we develop a
technique to quantify contact forces and estimate the internal stress tensor. As will be
illustrated in this paper, this opens the door to a broad array of static and dynamical
measurements in 3D disordered systems.
Crown Copyright & 2011 Published by Elsevier Ltd. All rights reserved.
1. Introduction
Despite the practical importance of macroscopic disordered materials such as soil, foams and emulsions the rules thatgovern their mechanical behaviour remain poorly understood. In the case of granular materials, these studies are essentialto the advancement of related industrial processes and also to the prediction of often catastrophic geological phenomena(avalanches of slurries, earthquakes). Although empirical constitutive equations are nowadays able to partly model theresponse of these systems, a unified multiscale framework does not exist yet. Over the past 20 years, foams and granularsystems have emerged as a model system for low temperature glasses (Langer and Liu, 2000). Many theories (Falk andLanger, 1998; Zhang and Makse, 2005; O’Hern et al., 2001), simulations (Lemaıtre, 2002) and experiments (Utter andBehringer, 2008) have been designed to address the relationship between the internal structure and macroscopicbehaviour of such systems. The overall effective mechanical properties of granular systems is intricately entangled withthe complex nature of interactions between their constituent particles. Consequently many studies attempt to usecomplex models that account for elastoplastic deformation and non-affine displacement at the grain scale to bridgebetween micro- and macro-scale (Falk and Langer, 1998; Lemaıtre, 2002; Majmudar and Behringer, 2005; Utter andBehringer, 2008). Some of these theories and models often use approaches derived from statistical physics. Although thebehaviour of foams seems today rather well understood (Weaire et al., 2010), the complexity of granular mattersbehaviour at the microscopic scale has prevented a proper physical model of granular systems.
011 Published by Elsevier Ltd. All rights reserved.
. Saadatfar), [email protected] (A.J. Kabla).

Fig. 1. Sketch of the compression cell and consecutive stages of compression.
M. Saadatfar et al. / J. Mech. Phys. Solids 60 (2012) 55–6656
A large part of the problem arises from the strongly nonlinear contact law between rigid bodies coupled with thedynamical nature of the contact network. In this context, the spatial distribution and temporal evolution of the forcenetwork has become a highly sought after quantity that expands from micro-scale (grain–grain contacts) to macro-scale(granular assembly).
Early simulations have provided important insights on the internal force distributions of a granular pile (Radjai et al.,1996; Coppersmith et al., 1996; Makse et al., 2000). Two-dimensional (2D) experiments managed to keep up with the paceof advancement in simulations (Drescher and de Josselin de Jong, 1972; Howell et al., 1999; Kolb et al., 2004; Zhang et al.,2010), 3D experiments, however, have been limited to measurements of the distribution of forces only at the boundaries ofthe containers (Brockbank et al., 1997; Mueth et al., 1998; Blair et al., 2001; Corwin et al., 2005). These experimentalmethods could not have access to the spatial arrangement of the contact force network in the bulk of granular assembly.Moreover they were unable to determine structural features such as force chains and arching which have been postulatedas the signature of jamming (Lois and Carlson, 2007).
In recent years, a range of tools have been developed to apprehend the 3D nature of bulk properties. X-ray or MRItechniques have allowed to study dynamic properties of granular systems such as flow profiles and shear banding, at amesoscopic scale (Mantle et al., 2001; Kabla et al., 2005; Kabla and Senden, 2009; Dijksman and van Hecke, 2010). 3Dreconstructions of compressed emulsion systems using confocal microscopy have provided the first measurements of thebulk force distributions (Brujic et al., 2003, 2005) by estimating the contact force from contact geometry. A similartechnique has also been used to characterise spatial correlations of forces inside 3D piles of frictionless liquid droplets(Zhou et al., 2006). Although these observations are very valuable, the systems used are significantly different from realgranular pile which has different contact laws and frictional properties.
X-ray computed tomography has been used for static characterisation of large packings of spherical grains (Silbert et al.,2002; Aste et al., 2005; Saadatfar, 2006). In this study, we apply this technique to a model system made of soft millimetric elasticbeads. In addition to the measurement of traditional structural quantities (packing fraction, coordination number, etc.), thecontact force is measured from the contact area between grains which can be integrated at a mesoscopic scale to estimate thelocal stress tensor in the pile. We then apply a series of external forces to our model system and investigate its response to thesestress controlled loadings. The experiment combined with imaging and image analysis as well as microstructural andmicromechanical characterisation provide an all-in-one methodology that allows probing into complex systems such asgranular assemblies. This approach delivers results consistent with the existing literature and is promising as a generic tool tostudy the local, nonlinear mechanics of granular assemblies.
2. Experiment and methodology
2.1. Experimental setup
The packing studied in this paper is made of relatively monodisperse spherical rubber balls of diameter 3.1070.05 mm.The grains are made of commercial rubber1 with a shear modulus estimated at 850 kPa.
A cylindrical PMMA container, with internal diameter of 44 mm is used as a compression cell (see Fig. 1). The inner wallof the cylinder is lubricated with canola oil to reduce the friction. Two thousand and twenty rubber elastic balls are thenpoured into this chamber. The latter is then closed at the top by a piston of diameter slightly smaller than the container; it
1 Styrene-Butadine-Rubber (SBR); purchases from Mid-Atlantic Rubber Co., USA.

Fig. 2. (a) Normalised X-ray density histogram of the full image volume of the rubber ball sample. (b) Gray scale X-ray density map of a slice of rubber
ball sample. (c) The same slices after phase separation. (d) Illustration of the effect of segmentation process on grain contact area. Cross section of two
binarised computer generated images with the same resolution as grains in this study (115 pixels in diameter). Top image: the grains when they are just
touching. Bottom image: the grains have a small overlap (penetration is 1% of the grain diameter). (e) Measured contact area on the computer generated
binarised images as a function of true contact area for a range of grain overlaps.
M. Saadatfar et al. / J. Mech. Phys. Solids 60 (2012) 55–66 57
can therefore move freely without touching the PMMA cylinder and without allowing beads to leave the container.A horizontal platform is rigidly connected by a shaft to the piston so that a load can be applied to the sample by placingweights on it. A pair of springs connecting the piston to the container is used to make sure that, in the absence of a load,the piston does not fall down due to its own weight.
The compression cell is attached to a motorised rotation stage located between a high-resolution microfocus X-ray source(80 kV accelerating voltage and 200 mA beam current and a CCD detector of the size 67 mm�67 mm, 2048�2048 pixels ofsize 33:6 mm each (Sakellariou et al., 2004a,b). The compression cell is rotated by about 0.1251 increments around its verticalaxis and a radiographic projection of the packing is taken after each rotation with an exposure time of 18 s. A total of 2880projections are taken for a complete rotation of the specimen. It takes approximately 15 h to scan the volume for each case.After the completion of each scan, tomographic cone beam reconstructions are performed on these 2880 projections using the(Feldkamp et al., 1984) algorithm. Tomograms of about 20003 voxels are obtained at 27 mm resolutions.
We have recorded and analysed the internal geometry of the packing under three different loading conditions.Stage0: Pre-compression stage with no extra loading; the piston is held in balance just above the top of the packing
without making contact with it (see Fig. 1). Rubber balls are at rest, only bearing their own weight (41.1 g). The combinedweight of the piston and the platform (600 g) is fully balanced by the pull of the springs so that at this point there is noexternal force being exerted onto the pile.
Stage1: The platform is loaded with 150 g (1.47 N). By taking into account the opposite force applied by the springs, anet weight of 115 g is applied to the packing, resulting in a compressive strain of e¼ 3:78%. We define the axial strains asthe ratio of the displacement of piston to the initial height of the packing (engineering strains).
Stage2: A total of 900 g (8.83 N) is placed on the platform resulting in a net 780 g weight onto the packing. The totalaxial strain at that stage is e¼ 7:83%.
2.2. 3D image analysis: segmentation and partitioning
The tomographic image consists of a cubic array of reconstructed linear X-ray attenuation coefficient values, eachcorresponding to a finite volume cube (voxel) of the sample. The first step in analysing this data is to differentiate the
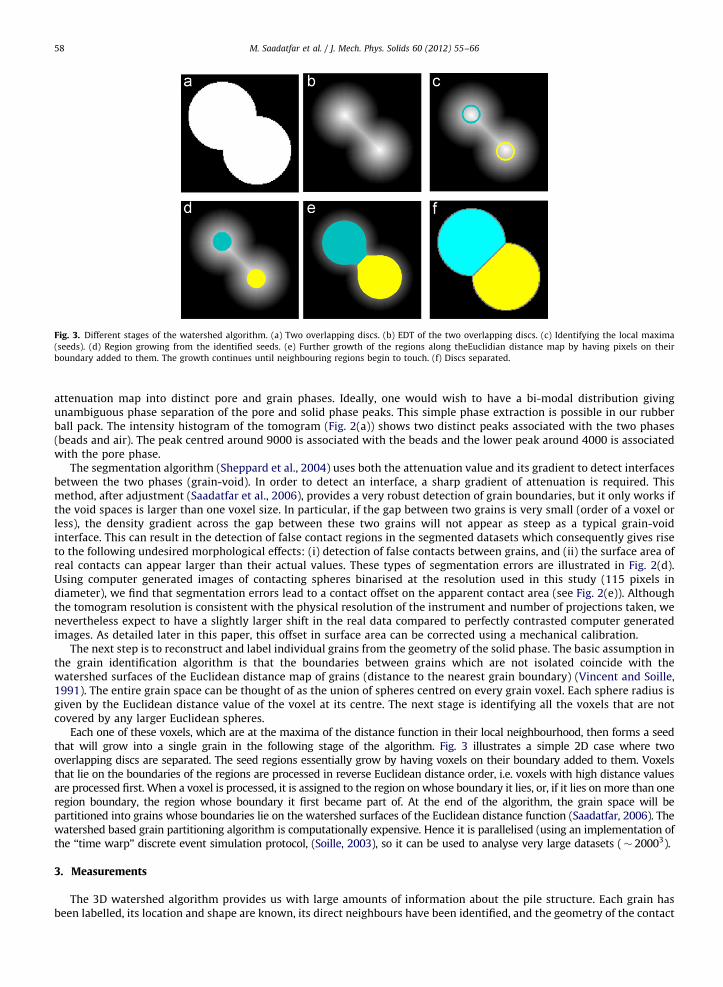
Fig. 3. Different stages of the watershed algorithm. (a) Two overlapping discs. (b) EDT of the two overlapping discs. (c) Identifying the local maxima
(seeds). (d) Region growing from the identified seeds. (e) Further growth of the regions along theEuclidian distance map by having pixels on their
boundary added to them. The growth continues until neighbouring regions begin to touch. (f) Discs separated.
M. Saadatfar et al. / J. Mech. Phys. Solids 60 (2012) 55–6658
attenuation map into distinct pore and grain phases. Ideally, one would wish to have a bi-modal distribution givingunambiguous phase separation of the pore and solid phase peaks. This simple phase extraction is possible in our rubberball pack. The intensity histogram of the tomogram (Fig. 2(a)) shows two distinct peaks associated with the two phases(beads and air). The peak centred around 9000 is associated with the beads and the lower peak around 4000 is associatedwith the pore phase.
The segmentation algorithm (Sheppard et al., 2004) uses both the attenuation value and its gradient to detect interfacesbetween the two phases (grain-void). In order to detect an interface, a sharp gradient of attenuation is required. Thismethod, after adjustment (Saadatfar et al., 2006), provides a very robust detection of grain boundaries, but it only works ifthe void spaces is larger than one voxel size. In particular, if the gap between two grains is very small (order of a voxel orless), the density gradient across the gap between these two grains will not appear as steep as a typical grain-voidinterface. This can result in the detection of false contact regions in the segmented datasets which consequently gives riseto the following undesired morphological effects: (i) detection of false contacts between grains, and (ii) the surface area ofreal contacts can appear larger than their actual values. These types of segmentation errors are illustrated in Fig. 2(d).Using computer generated images of contacting spheres binarised at the resolution used in this study (115 pixels indiameter), we find that segmentation errors lead to a contact offset on the apparent contact area (see Fig. 2(e)). Althoughthe tomogram resolution is consistent with the physical resolution of the instrument and number of projections taken, wenevertheless expect to have a slightly larger shift in the real data compared to perfectly contrasted computer generatedimages. As detailed later in this paper, this offset in surface area can be corrected using a mechanical calibration.
The next step is to reconstruct and label individual grains from the geometry of the solid phase. The basic assumption inthe grain identification algorithm is that the boundaries between grains which are not isolated coincide with thewatershed surfaces of the Euclidean distance map of grains (distance to the nearest grain boundary) (Vincent and Soille,1991). The entire grain space can be thought of as the union of spheres centred on every grain voxel. Each sphere radius isgiven by the Euclidean distance value of the voxel at its centre. The next stage is identifying all the voxels that are notcovered by any larger Euclidean spheres.
Each one of these voxels, which are at the maxima of the distance function in their local neighbourhood, then forms a seedthat will grow into a single grain in the following stage of the algorithm. Fig. 3 illustrates a simple 2D case where twooverlapping discs are separated. The seed regions essentially grow by having voxels on their boundary added to them. Voxelsthat lie on the boundaries of the regions are processed in reverse Euclidean distance order, i.e. voxels with high distance valuesare processed first. When a voxel is processed, it is assigned to the region on whose boundary it lies, or, if it lies on more than oneregion boundary, the region whose boundary it first became part of. At the end of the algorithm, the grain space will bepartitioned into grains whose boundaries lie on the watershed surfaces of the Euclidean distance function (Saadatfar, 2006). Thewatershed based grain partitioning algorithm is computationally expensive. Hence it is parallelised (using an implementation ofthe ‘‘time warp’’ discrete event simulation protocol, (Soille, 2003), so it can be used to analyse very large datasets (� 20003).
3. Measurements
The 3D watershed algorithm provides us with large amounts of information about the pile structure. Each grain hasbeen labelled, its location and shape are known, its direct neighbours have been identified, and the geometry of the contact

Table 1Details of the compression progression.
Compression stage 0 1 2
External loading (g) 0 115 780
Avg. vertical stress (szz) for top 1/3 of packing (Pa) 578 1021 4937
Strain (%) 0 3.78 7.83
Packing fraction 0.57 0.59 0.62
Avg. coord. no. raw 6.2871.64 6.6371.58 7.1371.49
Avg. coord. no. filtered 4.9971.80 5.3271.66 5.9271.56
Fig. 4. A sub-volume of the elastic ball compaction experiment. The contact zone between touching grains (dark patches) provides a measurement of
contact force.
M. Saadatfar et al. / J. Mech. Phys. Solids 60 (2012) 55–66 59
they share can be extracted as well. This data can now be processed to extract physical and mechanical properties. In thissection, we present a few methods implemented in the context of granular systems. These can be separated into structuralcharacteristics and mechanical measurements. The latter involves kinematic and force measurements that rely on priorknowledge of a contact law for individual grains.
3.1. Structural quantities
3.1.1. Packing fraction
One of the most readily measurable quantities from 3D images is the packing fraction. Packing fraction or apparentdensity is defined as the ratio of the volume of balls to the total volume. Table 1 summarises the packing fractionsmeasured directly from the digital images. The packing fractions we measure on the initial pile is 57%, which is in thelower end of the spectrum for monodisperse beads. Such a density is achievable in our system due to the large frictionalcoefficient of rubber–rubber contacts. As the loading is increased, the volume fraction increases up to 62%.
3.1.2. Radial distribution function
From the shapes of the individual grains calculated by the Watershed algorithm, the coordinates of each grain’s centreof mass can be accurately measured. This data is in particular required to characterise the microstructure of granularsystems and to calculate the autocorrelation function of the grain centres.
The radial distribution function (RDF) is a measure of the degree of separation of grain centres and their density at agiven distance. It is calculated by counting the number of grains N that are separated from a given sphere by a distance inthe interval ½r,rþdr�, where r is the distance between grain centres. For large r, the RDF represents the random spatialstructure of the packing and the number density of the grain centres found in the interval ½r,rþdr� approaches the averagedensity of grains in the packing, ð3=4pR3
Þr, where r is the packing fraction and R is the average grain radius. In ourcalculations, we normalise RDF by the average density, therefore for large r the RDF approaches unity. Fig. 5 shows the RDFin our packings throughout compression progression. The RDF of the system before insertion of any external force (stage 0)shows a prominent peak at r�Dg where Dg is the average grain diameter (Dg ¼ 2� R� 3� 10 mm). The second peakappears at r� 1:95Dg and a sub-peak approximately at r¼
ffiffiffi3p
Dg . As the vertical load increases (stages 1 and 2), the peaksof the RDF slightly widen and shift to the left due to the compression of touching spheres, hence shortening the centre–centre distance between them (see Fig. 5(left)).

0.8 0.85 0.9 0.95 1 1.05 1.1
peak=1.00peak=0.99peak=0.98
1.0 1.5 2.0 2.5 3.0 3.5r/Dg
0.00
2.00
4.00
6.00
8.00
10.00
C(r
)
stage 2stage 1stage 0
1.6 1.8 2 2.2 2.4 2.6
Fig. 5. Radial distribution function of the packing at different stages of compression normalised by the volume of a single grain and the packing fraction.
Note the shift in the peaks as the pressure increases.
M. Saadatfar et al. / J. Mech. Phys. Solids 60 (2012) 55–6660
We have compared the width of the sub-peaks around r¼ffiffiffi3p
Dg and 1:95Dg with previous experiment (Aste et al., 2005)and simulations (Martin and Bordia, 2008) of hard sphere packing. The comparison reveals that the peaks in our RDF are widerthan their equivalent in these studies. This is due to the fact that grains in our experiment are deformable, and therefore thegeometry of local tetrahedral configuration is not as constrained as it is in the case of hard sphere packing. Another contributingfactor is related to the relatively low packing fraction of our granular assembly which is mainly due to high friction betweenrubber balls. As a result of this low packing fraction, the packing structure tends to be more disordered. As a result, the localstructural motifs are not as pronounced as high density packings of hard spheres. It is noteworthy that in our calculations ofRDF, we exclude the boundary grains therefore removing the effect of highly ordered border grains.
The magnitude of the shift is about 1% and 2% for stages 1 and 2. This is to be compared with the macroscopic axialstrain which is of the other of 4% and 8% without any deformation along the order directions. This suggests that theinternal compression is more isotropic than the loading.
3.1.3. Mean coordination
The grain partitioning also provides us with the list of contact areas between grains, from which it is possible to analysethe contact network of grains. Using first the raw data from the watershed algorithm, we have measured the coordination(number of contacts) of each grain and plotted its distribution for each stage of compression (see Fig. 6(a)). This plot showsa significant increase of grain coordination as the loading increases. It is notable that as pressure increases, thedistributions move to higher values and get slightly narrower (see Table 1). This increase in the coordination number isachieved by re-organisation of grains in the packing when they are compressed and also grain compression/deformationprocess which reduces the overall grain–grain distance. A relatively large number of grains lose their contacts with some oftheir immediate neighbours while almost the same amount gain new contacts as the compression progresses. We haveshown the histogram of lost/gained contacts in the inset of Fig. 6. Negative values on the horizontal axis represent lostcontacts while positive values show the number of newly gained contacts. Nearly 50% of grains retain their coordinationnumber during the compression without any changes.
As discussed in Section 2.2, the inherent finite resolution of the CT leads to systematic bias in fine details such as graincontacts (Marmottant et al., 2008); if the gap between two grains is in the order of, or less than, the voxel size, grains will appearto be in contact in the segmented data. To correct for this intrinsic resolution limitation, we offset all the contact areas by a smallamount, which essentially corresponds to the apparent contact area of two touching perfectly spherical grains (see Section 3.2.3for detailed discussion). All contacts whose apparent surface area is below this threshold, are therefore discarded. Fig. 6(b) showsa re-plot of Fig. 6(a) after applying the offset. The isostatic limit for mechanically stable packing of spheres in 3D suggests aconnectivity of 4 for frictional and 6 for frictionless systems. In our measurements, the average coordination number is C5 forstage 0 (see Fig. 6(b)) which is in agreement with previous measurements (Bernal and Mason, 1960; Aste et al., 2005).
3.2. Kinematics and dynamics
3.2.1. Displacement fields
Next we calculate the coordinates of the centroid of the grains for all three scans and then track each individual grainthroughout the experiment. As an illustration, we render the 3D vector field derived from tracking grains during thecompression for both stages of compression, see Fig. 7(a, b).

2 4 6 8 10 12 14 16 180
100
200
300
400
500stage 2stage 1stage 0
-4 -2 0 2 4lost/gained contacts
0
200
400
600
800
1000
0 2 4 6 8 10 12 14 16 18 20
coordination numbercoordination number
0
100
200
300
400
500stage 2stage 1stage 0
-4 -2 0 2 4lost/gained contacts
0
200
400
600
800
1000
Fig. 6. Histogram of coordination number as a function of loading for different threshold values: (a) No threshold is applied (using the raw data after
watershed algorithm). (b) After a threshold value of 0.25 mm2 is subtracted from all contact surface areas. As a result the average coordination number is
reduced in all three stages.
M. Saadatfar et al. / J. Mech. Phys. Solids 60 (2012) 55–66 61
To gain a qualitative insight into the displacement field, we measure the average displacement of grain centres in bothlongitudinal and radial directions. Fig. 8(a) demonstrates such displacement along the loading axis. As expected, gradientof displacement from top to bottom shows that the system is under vertical compression. The decrease of the slope withdepth also indicates that part of this stress is screened by the time it reaches the bottom. A standard explanation of this isthe Janssen effect (Janssen and Zeitschr, 1895), suggesting that friction on the lateral walls might be significant. To confirmthis, we studied the vertical displacement profile in the radial direction (Fig. 8(b)) which confirms that grain movementscloser to the outer region of cylinder are smaller than that of the central region. Therefore a shear component in the (z, r)direction is expected. Another feature of the displacement field is the weak but noticeable radial displacement of the graintowards the boundary (see Fig. 8(c)). This radial displacement can be clearly seen in Fig. 7(a).
3.2.2. Contact mechanics
In addition to the direct measurement of individual grain displacements, a number of other mechanically relevantfeatures can be extracted from the tomogram. Upon compression, we observed that the distance between grains varies, aswell as shape and contact areas between them. These quantities can a priori be used to quantify the force transmittedbetween the grains. In this section, we describe the implementation of a contact model that is suitable for stresscalculations from 3D images.
Contact mechanics between solid objects have been studied for over a century. The seminal works of Hertz (1882) andMindlin (1949) about the contact mechanics of solid bodies have provided analytical solutions for idealised cases,summarised in Johnson (1987). The contact force between two elastic spheres can be calculated from the nonlinear Hertz–Mindlin model. The expression of the normal force between two contacting elastic spherical grains m and n with
Fig. 7. Displacement field presented as vector fields (velocity fields) for stage 1 (a) and 2 (b) of the experiment.

0distance from the bottom of packing [mm]
0
0.5
1
1.5
2
2.5
aver
age
verti
cal d
ispl
acem
ent [
mm
] combined displacement of stage 1&2stage 1
0 5 10 15 20radial distance from the center of packing [mm]
0
0.5
1
1.5
2
aver
age
verti
cal d
ispl
acem
ent [
mm
] combined displacement of stage 1&2stage 1
0 5 10 15 20radial distance from the center of packing [mm]
0
0.1
0.2
0.3
0.4
0.5
aver
age
radi
al d
ispl
acem
ent [
mm
] combined displacement of stage 1&2stage 1
10 20 30
Fig. 8. Displacement field along the loading axis. (a) The overall vertical displacement field is represented very well by an exponential equation. For
visual convenience every 30 data points is shown. (b) Longitudinal displacement for the 1st stage and the overall displacement. Here we choose a bin size
of 0.4 mm for averaging. (c) Average radial displacement of grains measured from the distance between the centre of packing its outer boundary.
M. Saadatfar et al. / J. Mech. Phys. Solids 60 (2012) 55–6662
uncompressed radii Rm and Rn, made of the same material, is given by
f mn ¼2
3
4G
1�nR1=2x3=2
mn , ð1Þ
where R is the geometric mean of Rm and Rn, R¼ 2RmRn=ðRmþRnÞ, xmn is the normal overlap, or penetration length, asdepicted in Fig. 9a, G is the shear modulus and n the Poisson ratio of the grains, equal to 0.5 for rubber (Zhang and Makse,2005).
We have tested the mechanical response of our grains by compressing a few individual grains between two steel platesand measuring the force required as a function of the gap between the plates (Fig. 9). The response of the grains isconsistent with the Hertz model, and we have extracted from these graphs the value of the grains shear modulus, 850 kPa,which is a reasonable value for a commercial rubber.
The Hertz–Mindlin theory therefore provides us with a suitable model to calculate the contact force from the graingeometry, as long as we have a good estimate of the normal overlap x for each contact. Two options can be considered atthis stage. (i) The normal overlap can be estimated from the distance between grain centres. If the grains are located atpositions rm and rn, assuming grains remain spherical, xmn ¼
12 ½RmþRn�9rm�rn9�. The autocorrelation function shows that
we expect this quantity to be of the order of a few percent of the grain diameter. Although the grain location is determinedaccurately, calculation of x can be fairly inaccurate due to the anisotropy of the imposed strain causing the grains todeviate significantly from a spherical shape into more ellipsoidal geometries. The centre–centre distance is therefore not agood approach to estimate the contact geometry. (ii) Our image processing protocols deliver a sensitive measurement ofthe contact area (Fig. 4), which provides us with a more reliable method to calculate the forces independently of thecentre–centre distances. The contact area ðsmnÞ, between grains labelled by m and n, is related with the normal overlapxmn by
xmn ¼smn
2pR: ð2Þ

R
rc
Fig. 9. Response of a single rubber ball to loading.
M. Saadatfar et al. / J. Mech. Phys. Solids 60 (2012) 55–66 63
This purely local measurement of the force can be applied to any grain geometry, as long as the local curvature of the grainnear the contact point can be estimated as well.
3.2.3. Force distribution and stress field
As illustrated in Fig. 2(e), the finite resolution of the CT causes a systematic increase of the contact areas that needs tobe carefully compensated for. Essentially, two surfaces will appear in contact if they are separated by less than a distance d,depending on the instrument precision but typically of the order of the voxel size. Assuming that the grains look d=2 largerthan what they actually are, the corresponding effect on the contact area is, according to formula 2, a simple additive offsetsoff ¼ pRd, consistent with Fig. 2(e). However, even if we estimate d to be of the order of a voxel, obtaining a more accuratevalue is important and requires an additional calibration of our measurements.
The mean stress in the vertical direction at the vicinity of the upper interface can be estimated in two independentways for each loading step; either from the knowledge of the loading mass and geometry of the setup or by using thecontact forces to calculate the stress tensor in the bulk of the pile. We consider a sub-volume dv of the size4 mm�4mm�12 mm containing � 13 grains. Each contact contained in this volume bears a force denoted f mn,measured from the contact area smn between grains indexed by m and n. The centre to centre vector is noted lm,n. Thecomponents of the stress tensor, indexed by i and j, are then obtained from the following expression (Thornton andAntony, 1998):
sij ¼1
dv
X
m,n
f imnljmn, ð3Þ
where the sum is over all contacting pairs of grains in the volume dv.In order to measure the contact area offset soff required to compensate for the segmentation error, we have calculated,
using the upper third of the sample, the mean vertical stress szz we would obtain for a range of values of soff (Fig. 10).A suitable choice should provide the value of the normal stress consistent with the loading applied on the sample(i.e. where the solid line intersects the dotted line in Fig. 10). Based on this graph, we find that a good choice of surfaceoffset is between 0.2 mm2 and 0.3 mm2, and select soff ¼ 0.25 mm2 in what follows. This value provides a reasonablereading of the normal stress for the highest load value (stage 2), for which the calibration is the most reliable due to thelarge values of the force and increased number of contacts (see Table 1). For stage 0, the overall mean stress appearshowever to be overestimated for any reasonable values of the offset. The contact area offset is, as expected, larger than butcomparable with the estimate obtained from computer generated data (see Fig. 2(e)). Using formula (2), we find that thisvalue corresponds to an additional overlap d=2¼ 0:02 mm, consistent with the size of a single voxel.
Once this tool is calibrated, it can be used to probe a number of statistical quantities in the pile. Fig. 11 shows thedistribution of normal forces in the pile for the three different loads studied here. The 3D bulk measurement of the contactnormal forces exhibit a number of features that are characteristic of granular systems. In particular, a salient feature of

Fig. 10. Solid lines: the mean vertical stress as a function of contact area offset. Dotted lines: the applied load, 740 Pa for stage 1, and 5000 Pa for stage 2
(see Table 1).
M. Saadatfar et al. / J. Mech. Phys. Solids 60 (2012) 55–6664
force measurement presented in this study is that the distributions are primarily exponential for large forces. This is inagreement with earlier measurements in 2D piles (Coppersmith, 1997; Liu et al., 1995) or at a 3D interface (Brujic et al.,2005) and also the numerical studies of dynamics of granulated systems (Radjai et al., 1996). Another feature oftenreported in granular dynamics studies (O’Hern et al., 2001; Majmudar and Behringer, 2005) is the presence of a peak or aplateau at low forces. However, this region of the distribution is also where the forces are the most sensitive to imageresolution, segmentation and thresholding. We believe a much higher spatial resolution is required before conclusions canbe made about the precise shape of the force distribution in the region of low forces, in particular since the mean stresscould not be adjusted.
The stress field in the pile is represented by a series of colour maps in Fig. 12 where each square is the cross section of asub-volume of 4 mm�4 mm�12 mm. These sub-volumes contain � 13 grains or � 75 contacts which are used for stresscalculations. These stress maps confirm a number of expected results. In the absence of any loading (stage 0), we observe aslight increase of the stress from top to bottom, in agreement with the fact that only the weight of the grains themselvesacts at this stage. The same pattern is observed in all directions. The vertical component of the stress tensor shows anincrease with the loading, as well as the radial and azimuthal components. The magnitude of the vertical component isabout twice as large as the other two. Another finding of interest concerns the existence of the shear component (r, z). It isalso notable that both vertical and radial components of the stress tensor have larger values near the boundary of theconfining cylindrical cell at the 2nd stage of compression. Grains at the centre experience a reduced compression, due totheir ability to move slightly towards the sides. Lateral grains are however under stronger radial and vertical displacementgradients. These maps are therefore in full agreement with the displacement field measured from the tracking of grains forhigh loadings (Fig. 8).
0 0.025 0.05 0.075 0.1contact force [N]
0
150
300
450
600stage 2stage 1stage 0
0 0.025 0.05 0.075 0.11
10
100
1000
Fig. 11. Histograms of normal forces in the sample for all three loading stages.

Fig. 12. Stress fields in a plane section of the sample for various loads. From top to bottom, (i) cartoons showing the location of the section in the sample,
along a diameter, and various stress components reported, (ii) the stress map in the azimuthal direction syy, in the radial direction srr , in the vertical
direction szz , and shear stress srz . The fluctuation in the stress maps is due to the limited number of contacts (� 75) in each sub-volumes dv.
M. Saadatfar et al. / J. Mech. Phys. Solids 60 (2012) 55–66 65
4. Conclusion
We have presented in this paper the first measurements of internal stresses in a dry granular system resolved at thesingle grain scale. We have used here a simple geometry that allows us to calibrate and validate our measurements.In particular, we are now able to quantify, for the same pile, a number of characteristic features. They include mainly theevolution of the coordination number, the 2-point correlation function, the internal displacement fields, force distributionsand stress fields, all as a function of loading. Taken together, all these measurements will enable us to better unravel themicromechanical behaviour of granular systems, in particular in quasistatic regimes. It is worth pointing out as well thatby measuring the force based on the contact geometry, we are able to deal with non-symmetric and polydisperse grains.
Although we have proven that these measurements are realistic and achievable, a number of improvements are stillrequired in order to study more complex cases. We need in particular to increase both the spatial statistics (number ofgrains) and the resolution at the contact scale; this will provide a better calibration of contact area extraction and thereforea more accurate measurement of forces and stress tensors within the pile. Increased image resolution will as a resultimprove the quantification of the coordination number and other geometric quantities and allow the use of stiffer grainsand smaller loads, therefore widening the range of suitable materials to use for the grains. The accuracy of the forcemeasurement can be further improved by refining the contact model to take into account tangential forces, that can beestimated from the orientation of the contact zone with respect to the centre-to-centre line. These technical advances,combined with the analysis tools presented here, will contribute to the understanding of a number of open problems.Internal force distribution can now be studied in the bulk, reaching the low force region of the distribution. The mechanicsof the material and in particular its mechanical stability rely on the internal organisation of the grain contacts and also theforce network. These are quantities that can be directly analysed in 3D, not only statically, but also dynamically bymonitoring how an applied load affects each individual grain contact.

M. Saadatfar et al. / J. Mech. Phys. Solids 60 (2012) 55–6666
The kinematic study of the material can also be qualitatively and quantitatively extended. Not only the local strain canbe measured, but the non-affine part of the displacement field is also directly accessible. The latter is increasingly thoughtto be related with the bulk material properties, in particular when the system is at the onset of rigidity (Wyart et al., 2008;Utter and Behringer, 2008). How such ideas can apply to 3D frictional granular systems remains to be investigated. Inparticular, answering such questions will require an extension to our current method so that we can study grain rotation.This would allow us to test the importance of micropolar elasticity in the mechanics of granular systems.
Acknowledgements
The authors wish to thank for the technical support of ANU’s X-ray tomography team. We thank ANU SupercomputerFacility and NCI for their generous allocation of compute time. We also thank Ajay Limay and Jose Maoricio for assistingwith some of the visualisations in this paper. M.S. acknowledges useful discussions with Nicolas Francois and Tomaso Aste.Financial support for this work through a grant from Australian Research Council, Project DP0881458, is gratefullyacknowledged.
References
Aste, T., Saadatfar, M., Senden, T.J., 2005. Phys. Rev. E 71 (6), 061302, doi:10.1103/PhysRevE.71.061302.Bernal, J.D., Mason, J., 1960. Nature 188, 910, doi:10.1038/188910a0.Blair, D.L., Mueggenburg, N.W., Marshall, A.H., Jaeger, H.M., Nagel, S.R., 2001. Phys. Rev. E 63 (4), 041304, doi:10.1103/PhysRevE.63.041304.Brockbank, R., Huntley, J.M., Ball, R.C., 1997. J. Phys. I 7 (10), 1521.Brujic, J., Edwards, S.F., Grinev, D.V., Hopkinson, I., Brujic, D., Makse, H.A., 2003. Faraday Discuss. 123, 207, doi:10.1039/b204414c.Brujic, J., Wang, P., Song, C., Johnson, D.L., Sindt, O., Makse, H.A., 2005. Phys. Rev. Lett. 95 (12), 128001, doi:10.1103/PhysRevLett.95.128001.Coppersmith, S.N., 1997. Physica D: Nonlinear Phenom. 107 (2–4), 183 16th Annual International Conference of the Center for Nonlinear Studies.Coppersmith, S.N., Liu, C.h., Majumdar, S., Narayan, O., Witten, T.A., 1996. Phys. Rev. E 53 (5), 4673, doi:10.1103/PhysRevE.53.4673.Corwin, E.I., Jaeger, H.M., Nagel, S.R., 2005. Nature 435 (7045), 1075.Dijksman, A.J., van Hecke, M., 2010. Soft Matter 6 (13), 2901, doi:10.1039/b925110c.Drescher, A., de Josselin de Jong, G., 1972. J. Mech. Phys. Solids 20 (5), 337, doi:10.1016/0022-5096(72)90029-4.Falk, M., Langer, J., 1998. Phys. Rev. E 57 (6), 7192.Feldkamp, L.A., Davis, L.C., Kress, J.W., 1984. J. Opt. Soc. Am. A 1, 612.Hertz, H., 1882. J. Reine Angew. Math. 92, 156.Howell, D., Behringer, R.P., Veje, C., 1999. Phys. Rev. Lett. 82 (26), 5241, doi:10.1103/PhysRevLett.82.5241.Janssen, H.A., 1895. Z. Ver. Dtsch. Ing. 39 (35), 1045.Johnson, K.L., 1987. Contact Mechanics. Cambridge University Press ISBN-13: 978-0521347969.Kabla, A.J., Senden, T.J., 2009. Phys. Rev. Lett. 102 (22), 228301, doi:10.1103/PhysRevLett.102.228301.Kabla, A., Debregeas, G., di Meglio, J.M., Senden, T.J., 2005. Europhys. Lett. 71 (6), 932.Kolb, E., Cviklinski, J., Lanuza, J., Claudin, P., Clement, E., 2004. Phys. Rev. E 69 (3), 031306, doi:10.1103/PhysRevE.69.031306.Langer, S.A., Liu, A.J., 2000. Europhys. Lett. 49 (1), 68.Lemaıtre, A., 2002. Phys. Rev. Lett. 89 (6), 64303.Liu, C.h., Nagel, S.R., Schecter, D.A., Coppersmith, S.N., Majumdar, S., Narayan, O., Witten, T.A., 1995. Science 269, 513, doi:10.1126/science.269.5223.513.Lois, G., Carlson, J.M., 2007. Europhys. Lett. 80, 5800, doi:10.1209/0295-5075/80/58001.Majmudar, S., Behringer, R.P., 2005. Nature 435, 1079, doi:10.1038/nature03805.Makse, H.A., Johnson, D.L., Schwartz, L.M., 2000. Phys. Rev. Lett. 84 (18), 4160, doi:10.1103/PhysRevLett.84.4160.Mantle, M.D., Sederman, A.J., Gladden, L.F., 2001. Chem. Eng. Sci. 56 (2), 523, doi:10.1016/S0009-2509(00)00256-6.Marmottant, A., Salvo, L., Martin, C., Mortensen, A., 2008. J. Eur. Ceram. Soc. 28 (13), 2441.Martin, C., Bordia, R., 2008. Phys. Rev. E 77 (3), 031307.Mindlin, R., 1949. Trans. ASME 71, A.Mueth, D.M., Jaeger, H.M., Nagel, S.R., 1998. Phys. Rev. E 57 (3), 3164, doi:10.1103/PhysRevE.57.3164.O’Hern, C.S., Langer, S.A., Liu, A.J., Nagel, S.R., 2001. Phys. Rev. Lett. 86 (1), 111, doi:10.1103/PhysRevLett.86.111.Radjai, F., Jean, M., Moreau, J., Roux, S., 1996. Phys. Rev. Lett. 77, 274.Saadatfar, M., 2006. Morphological and Mechanical Characterisation of Microstructured Materials. Ph.D. Thesis, The Australian National University.Saadatfar, M., Sheppard, A., Knackstedt, M.A., 2006. Advances in X-ray Tomography for Geomaterials, ISBN 1-905209-60-6, p. 269.Sakellariou, A., Sawkins, T.J., Senden, T.J., Limaye, A., 2004a. Physica A 339, 152.Sakellariou, A., Senden, T.J., Sawkins, T.J., Knackstedt, M.A., Turner, M.L., Jones, A.C., Saadatfar, M., Roberts, R.J., Limaye, A., Arns, C.H., Sheppard, A.P., Sok,
R.M., 2004b. In: SPIE Annual Meeting 2004, August.Sheppard, A.P., Sok, R.M., Averdunk, H., 2004. Physica A 339, 145.Silbert, L.E., Ertas, D., Grest, G.S., Halsey, T.C., Levine, D., 2002. Phys. Rev. E 65, 031304.Soille, P., 2003. Morphological Image Analysis: Principles and Applications. Springer-Verlag ISBN:3540429883.Thornton, C., Antony, S., 1998. Philos. Trans. Math. Phys. Eng. Sci. 356 (1747), 2763.Utter, B., Behringer, R., 2008. Phys. Rev. Lett. 100 (20), 208302.Vincent, L., Soille, P., 1991. IEEE Trans. Pattern Anal. Mach. Intell. 13, 583.Weaire, D., Barry, J.D., Hutzler, S., 2010. J. Phys.: Condens. Matter 22 (19), 193101.Wyart, M., Liang, H., Kabla, A., Mahadevan, L., 2008. Phys. Rev. Lett. 101 (21), 215501, doi:10.1103/PhysRevLett.101.215501.Zhang, H.P., Makse, H.A., 2005. Phys. Rev. E 72 (1), 011301, doi:10.1103/PhysRevE.72.011301.Zhang, J., Majmudar, T., Tordesillas, A., Behringer, R., 2010. Granular Matter 12 (2), 159.Zhou, J., Long, S., Wang, Q., Dinsmore, A.D., 2006. Science 312 (5780), 1631, doi:10.1126/science.1125151.