Embed Size (px)
Citation preview
L697: Information Visualization
K. Borner 1
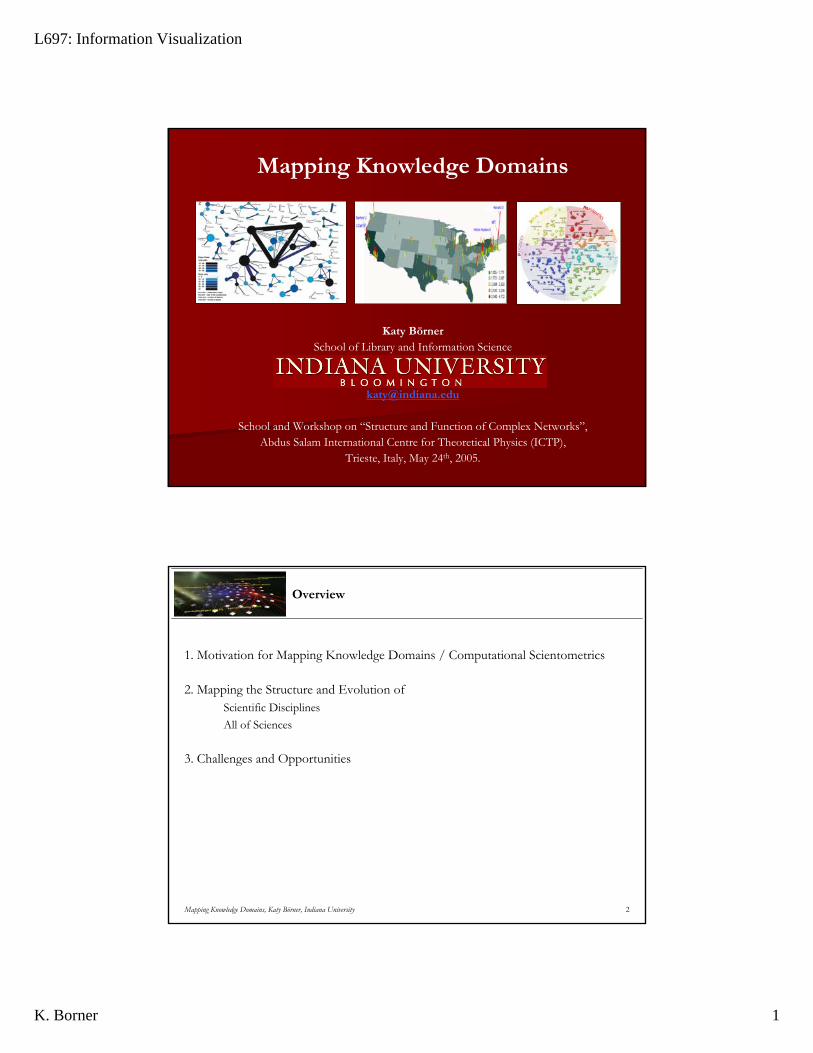
Mapping Knowledge Domains
Katy BörnerSchool of Library and Information Science
School and Workshop on “Structure and Function of Complex Networks”,Abdus Salam International Centre for Theoretical Physics (ICTP),
Trieste, Italy, May 24th, 2005.
Mapping Knowledge Domains, Katy Börner, Indiana University 2
Overview
1. Motivation for Mapping Knowledge Domains / Computational Scientometrics
2. Mapping the Structure and Evolution of Scientific DisciplinesAll of Sciences
3. Challenges and Opportunities
L697: Information Visualization
K. Borner 2
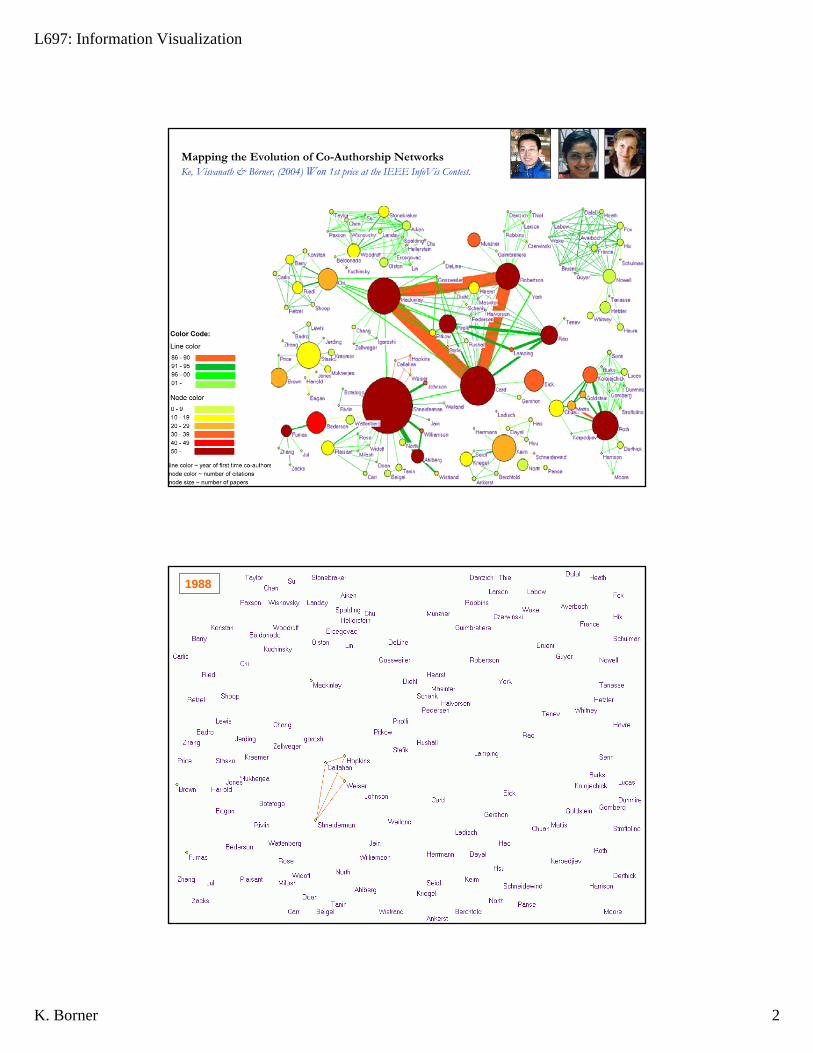
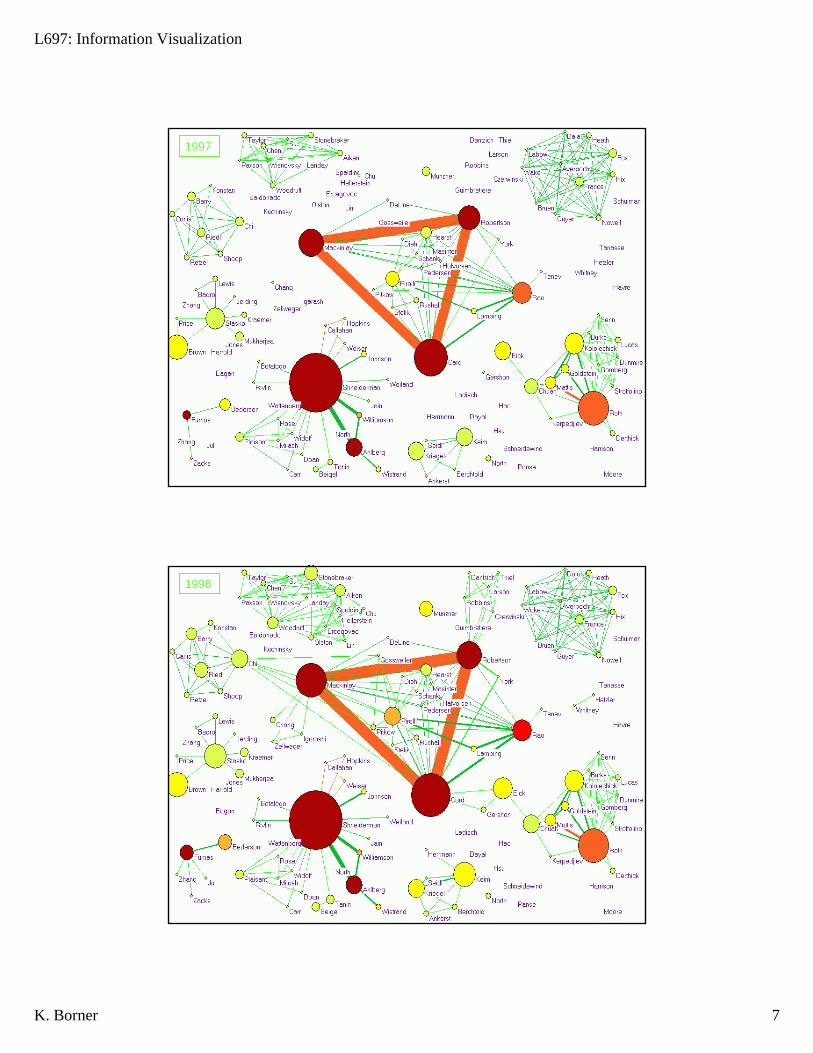
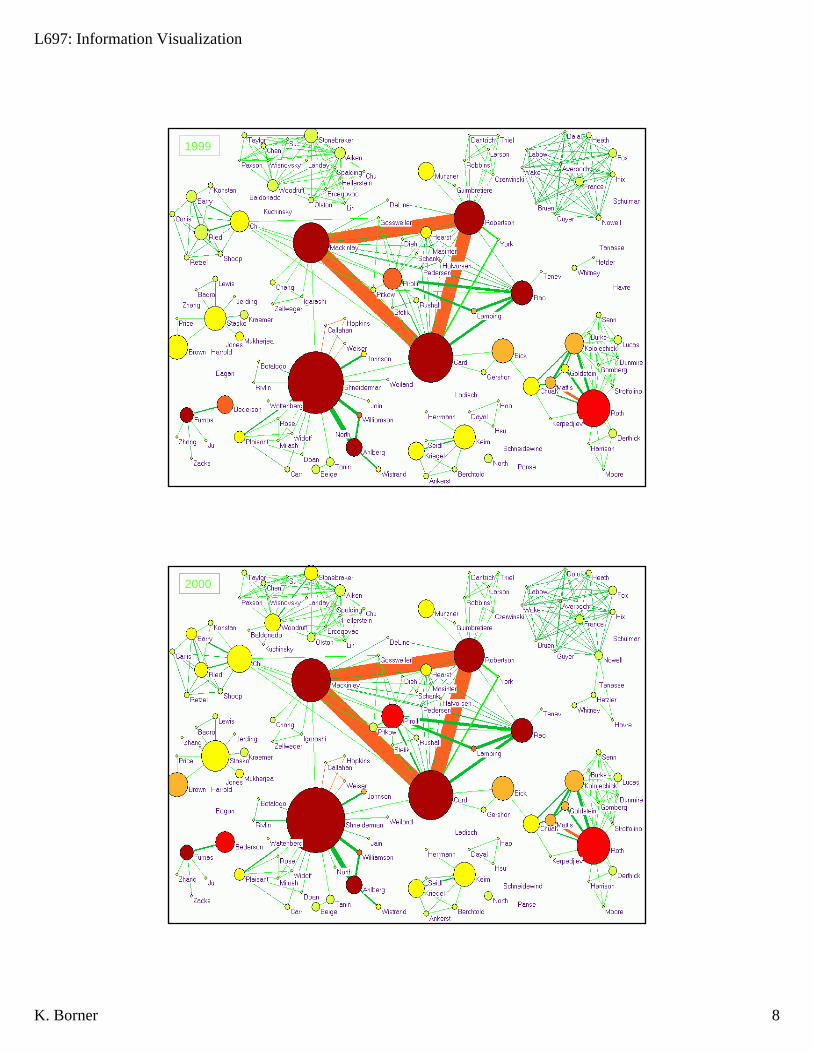
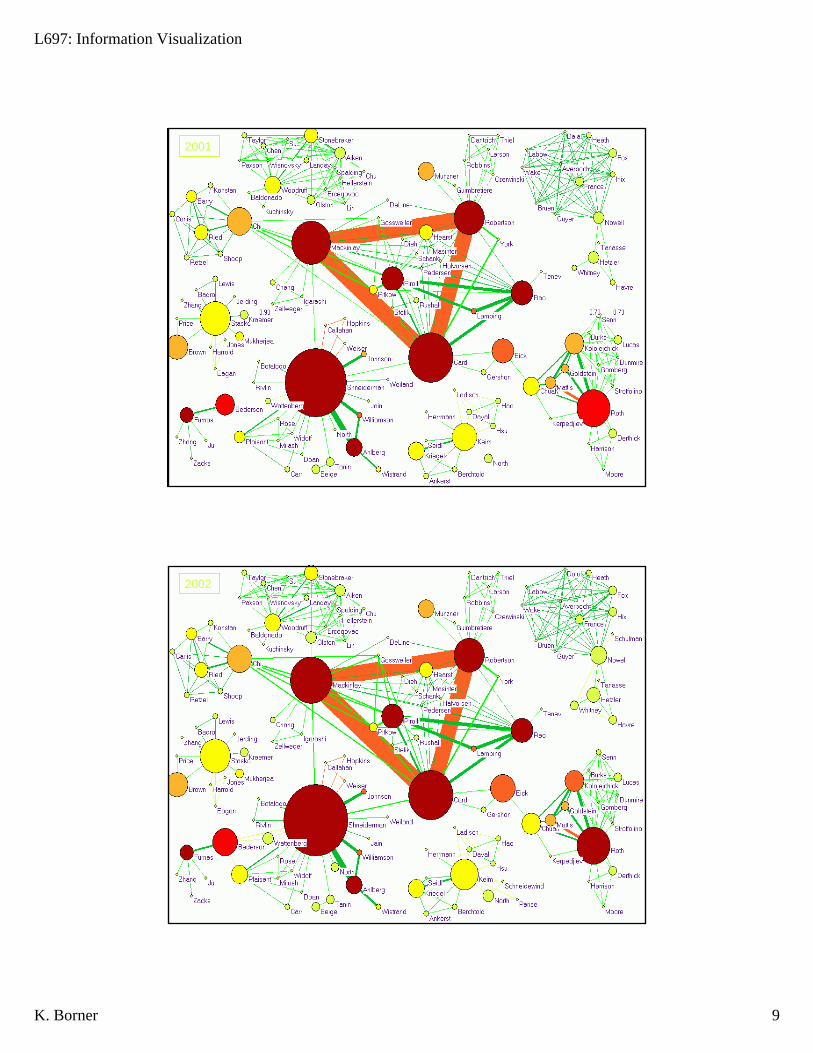
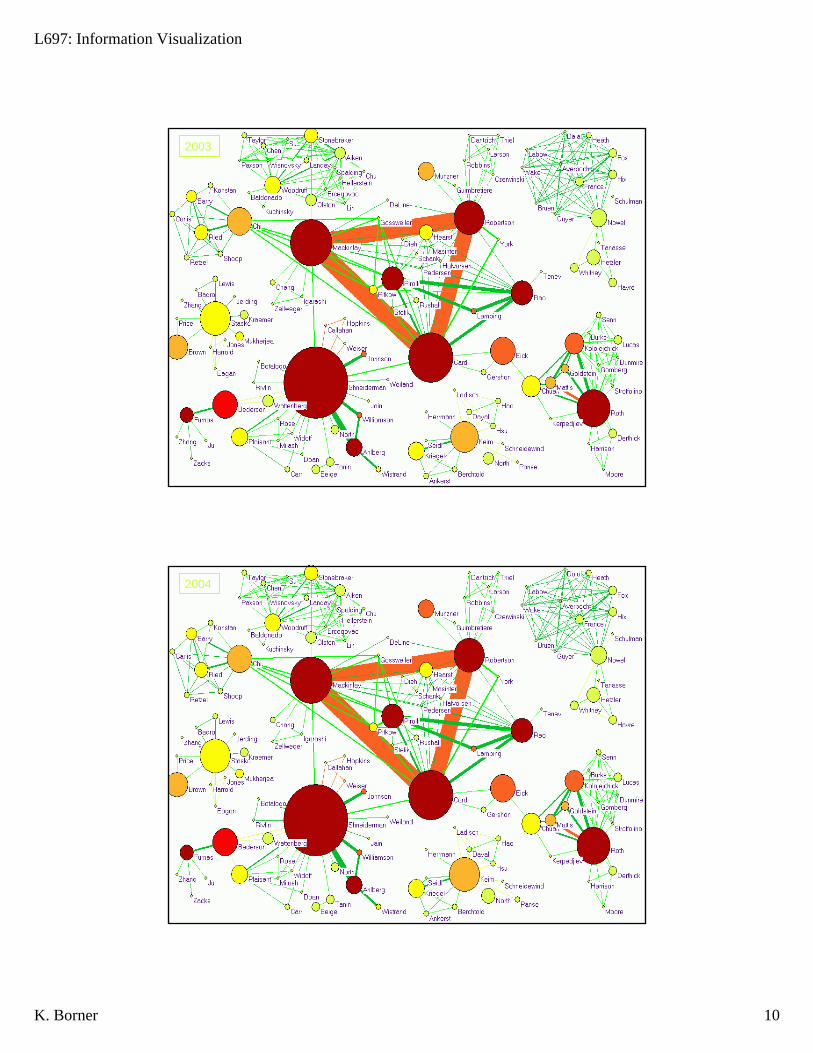
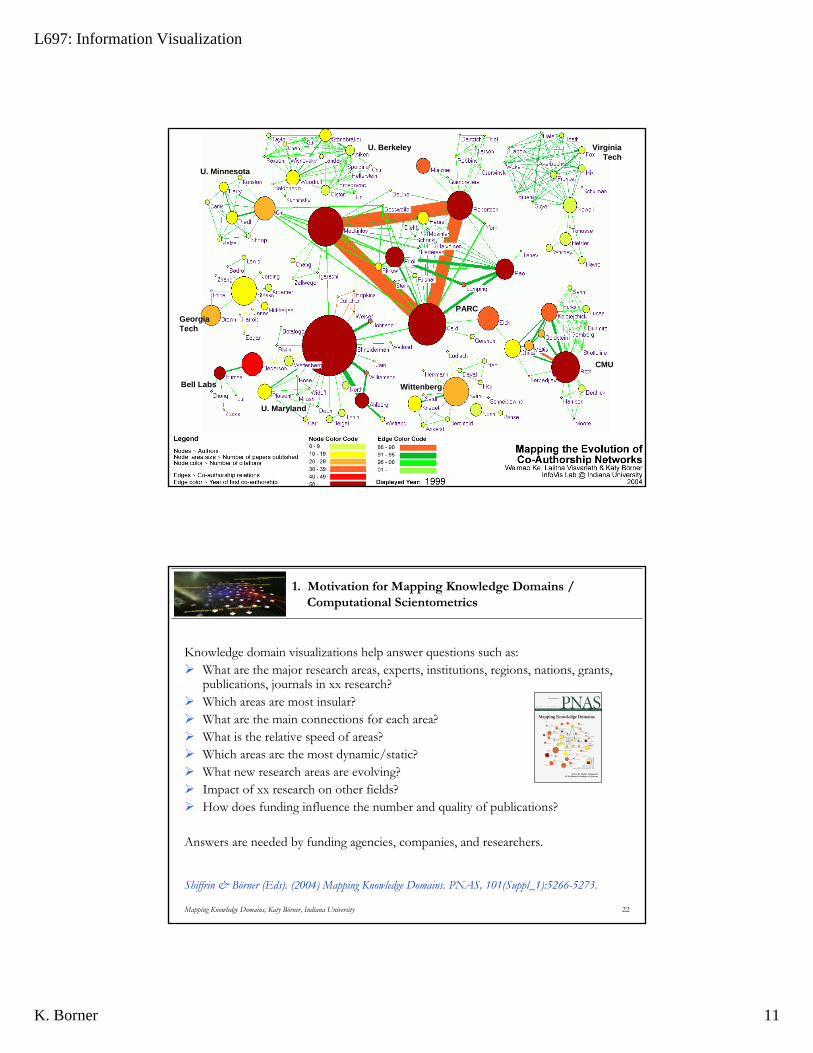
Mapping the Evolution of Co-Authorship Networks Ke, Visvanath & Börner, (2004) Won 1st price at the IEEE InfoVis Contest.
1988

L697: Information Visualization
K. Borner 3
1989
1990
L697: Information Visualization
K. Borner 4
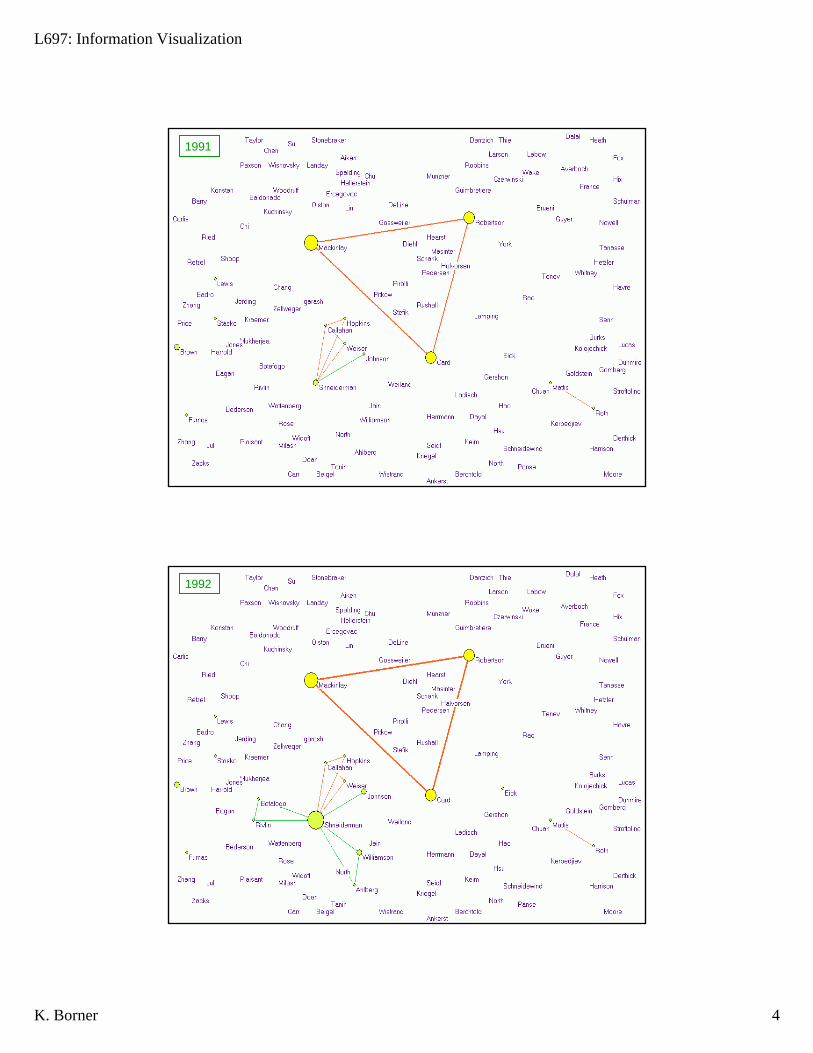
1991
1992
L697: Information Visualization
K. Borner 5
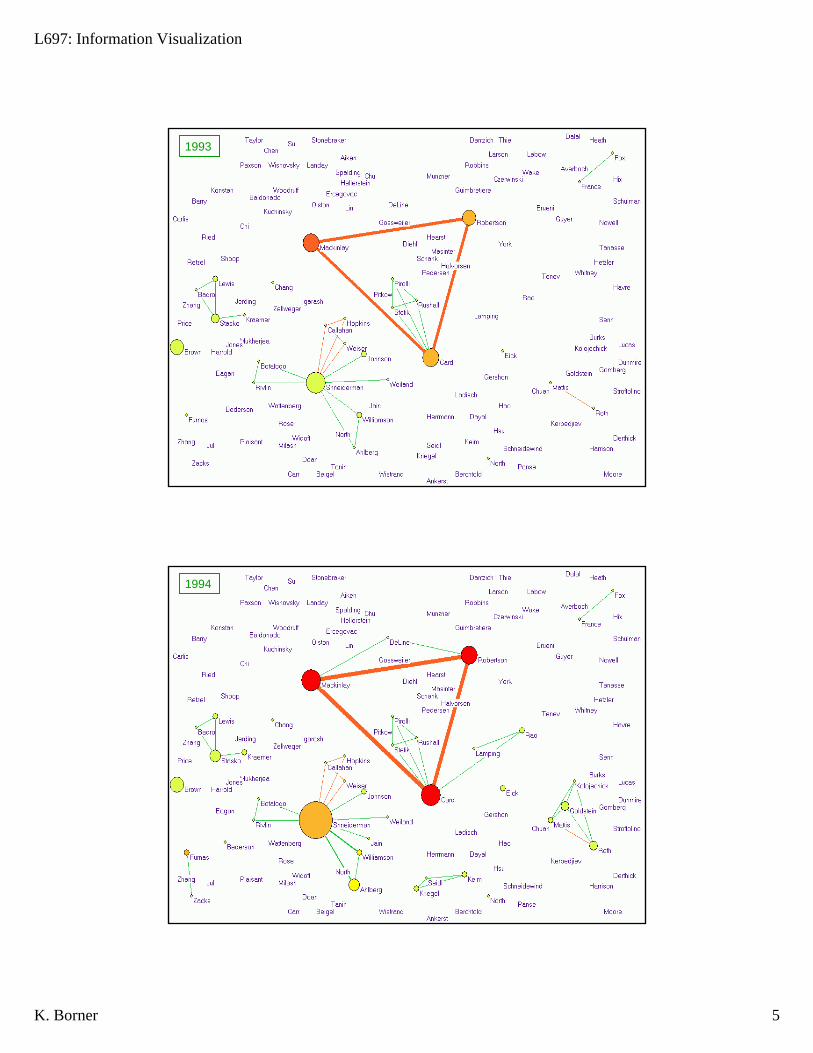
1993
1994
L697: Information Visualization
K. Borner 6
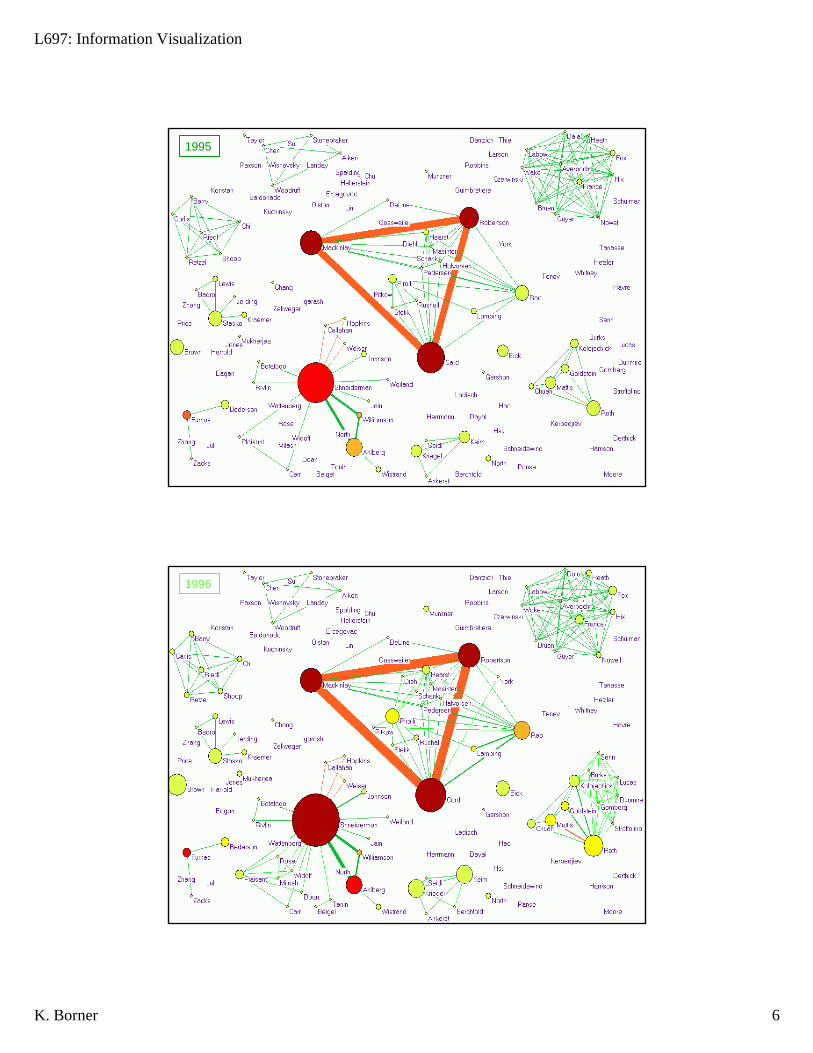
1995
1996
L697: Information Visualization
K. Borner 7
1997
1998
L697: Information Visualization
K. Borner 8
1999
2000
L697: Information Visualization
K. Borner 9
2001
2002
L697: Information Visualization
K. Borner 10
2003
2004
L697: Information Visualization
K. Borner 11
U. Berkeley
CMU
PARC
U. Minnesota
WittenbergBell Labs
VirginiaTech
U. Maryland
Georgia Tech
Mapping Knowledge Domains, Katy Börner, Indiana University 22
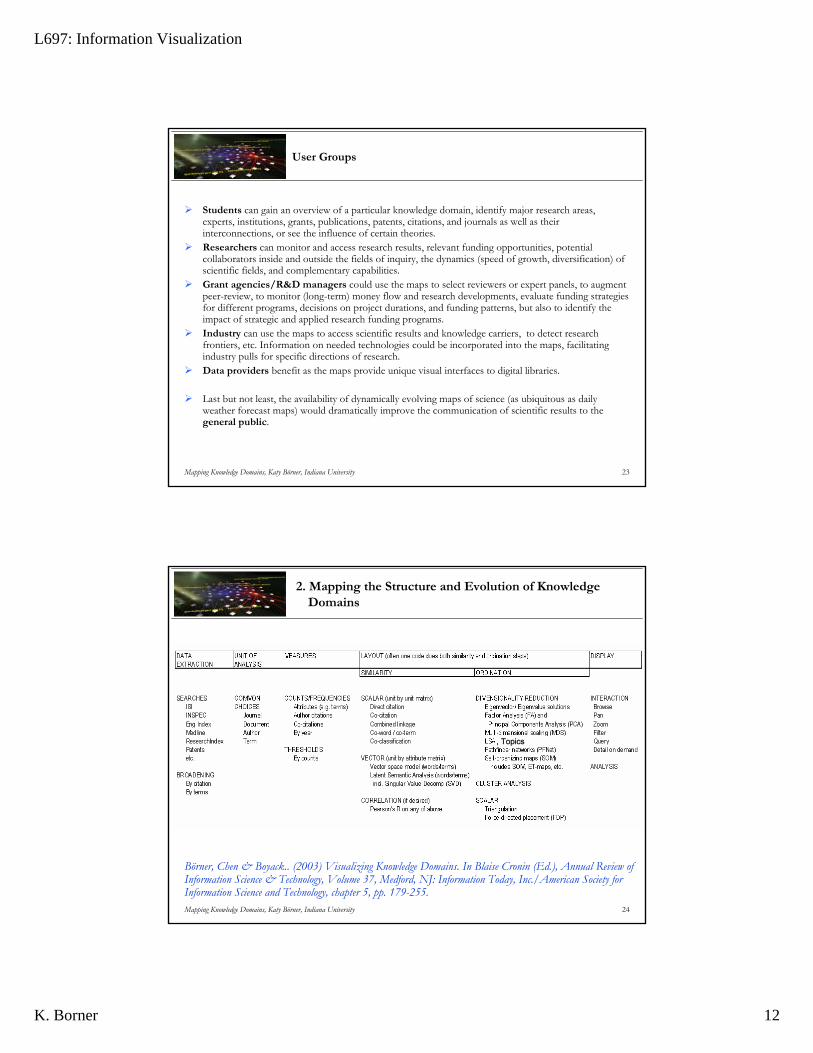
1. Motivation for Mapping Knowledge Domains / Computational Scientometrics
Knowledge domain visualizations help answer questions such as:What are the major research areas, experts, institutions, regions, nations, grants, publications, journals in xx research?Which areas are most insular?What are the main connections for each area?What is the relative speed of areas? Which areas are the most dynamic/static?What new research areas are evolving?Impact of xx research on other fields?How does funding influence the number and quality of publications?
Answers are needed by funding agencies, companies, and researchers.
Shiffrin & Börner (Eds). (2004) Mapping Knowledge Domains. PNAS, 101(Suppl_1):5266-5273.
L697: Information Visualization
K. Borner 12
Mapping Knowledge Domains, Katy Börner, Indiana University 23
User Groups
Students can gain an overview of a particular knowledge domain, identify major research areas, experts, institutions, grants, publications, patents, citations, and journals as well as their interconnections, or see the influence of certain theories. Researchers can monitor and access research results, relevant funding opportunities, potential collaborators inside and outside the fields of inquiry, the dynamics (speed of growth, diversification) of scientific fields, and complementary capabilities. Grant agencies/R&D managers could use the maps to select reviewers or expert panels, to augment peer-review, to monitor (long-term) money flow and research developments, evaluate funding strategies for different programs, decisions on project durations, and funding patterns, but also to identify the impact of strategic and applied research funding programs. Industry can use the maps to access scientific results and knowledge carriers, to detect research frontiers, etc. Information on needed technologies could be incorporated into the maps, facilitating industry pulls for specific directions of research. Data providers benefit as the maps provide unique visual interfaces to digital libraries.
Last but not least, the availability of dynamically evolving maps of science (as ubiquitous as daily weather forecast maps) would dramatically improve the communication of scientific results to the general public.
Mapping Knowledge Domains, Katy Börner, Indiana University 24
2. Mapping the Structure and Evolution of Knowledge Domains
Börner, Chen & Boyack.. (2003) Visualizing Knowledge Domains. In Blaise Cronin (Ed.), Annual Review of Information Science & Technology, Volume 37, Medford, NJ: Information Today, Inc./American Society for Information Science and Technology, chapter 5, pp. 179-255.
, Topics
L697: Information Visualization
K. Borner 13
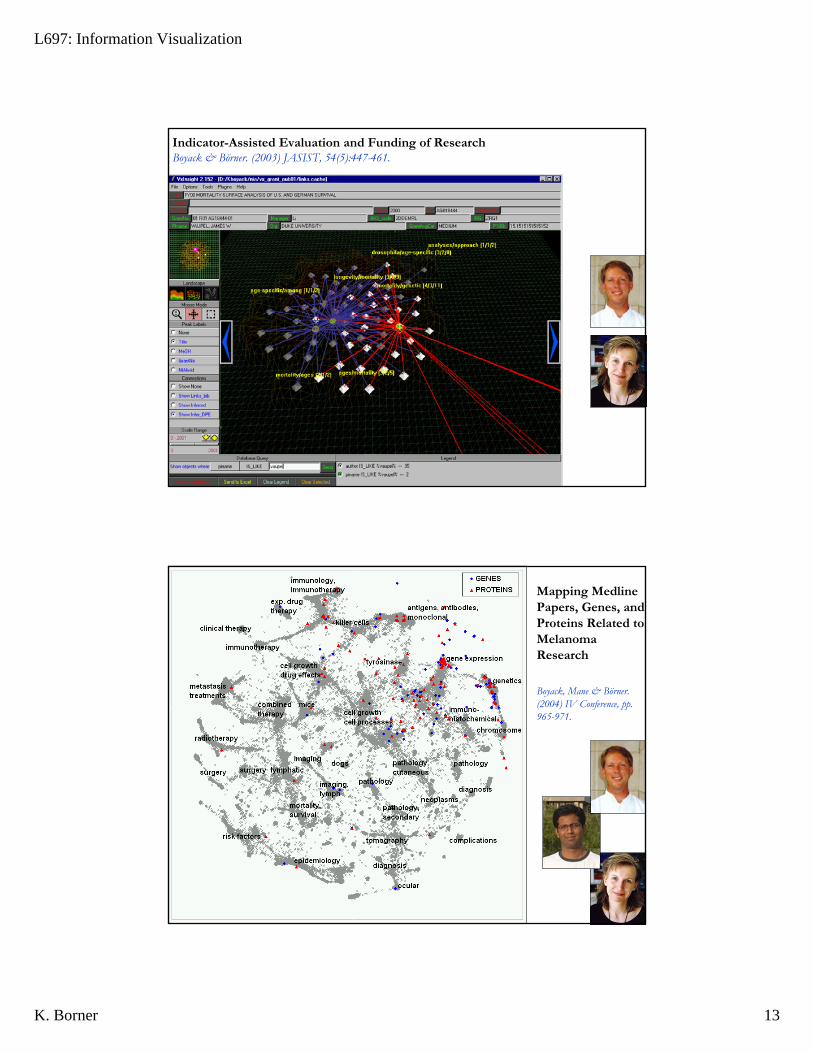
Indicator-Assisted Evaluation and Funding of ResearchBoyack & Börner. (2003) JASIST, 54(5):447-461.
Mapping Medline Papers, Genes, and Proteins Related to Melanoma Research
Boyack, Mane & Börner. (2004) IV Conference, pp. 965-971.
L697: Information Visualization
K. Borner 14
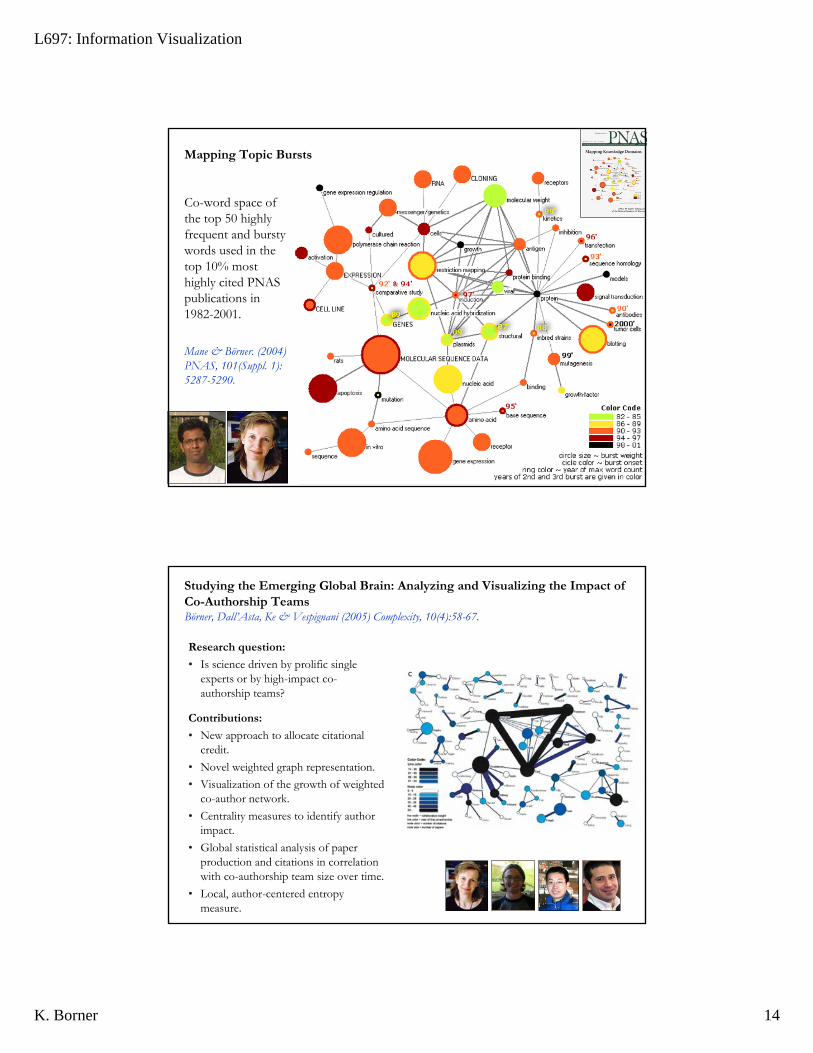
Co-word space of the top 50 highly frequent and burstywords used in the top 10% most highly cited PNAS publications in 1982-2001.
Mane & Börner. (2004) PNAS, 101(Suppl. 1):5287-5290.
Mapping Topic Bursts
Research question:
• Is science driven by prolific single experts or by high-impact co-authorship teams?
Contributions:
• New approach to allocate citationalcredit.
• Novel weighted graph representation.• Visualization of the growth of weighted
co-author network. • Centrality measures to identify author
impact.• Global statistical analysis of paper
production and citations in correlation with co-authorship team size over time.
• Local, author-centered entropy measure.
Studying the Emerging Global Brain: Analyzing and Visualizing the Impact of Co-Authorship Teams Börner, Dall’Asta, Ke & Vespignani (2005) Complexity, 10(4):58-67.

L697: Information Visualization
K. Borner 15
Does Internet lead to more global citation patterns, i.e., more citation links between papers produced at geographically distant research instructions? Analysis of top 500 most highly cited U.S. institutions.Each institution is assumed to produce and consume information.
γ82-86 = 1.94 (R2=91.5%) γ87-91 = 2.11 (R2=93.5%)γ92-96 = 2.01 (R2=90.8%)γ97-01 = 2.01 (R2=90.7%)
Spatio-Temporal Information Production and Consumption of Major U.S. Research Institutions Börner & Penumarthy. (2005) ScientometricsConference.
Mapping all of Sciences
(in English speaking domain, based on available data)
Subsequent slides are based on• Boyack, K.W., Klavans, R., & Börner, K. (2005, in press). Mapping the backbone of science.
Scientometrics.
L697: Information Visualization
K. Borner 16
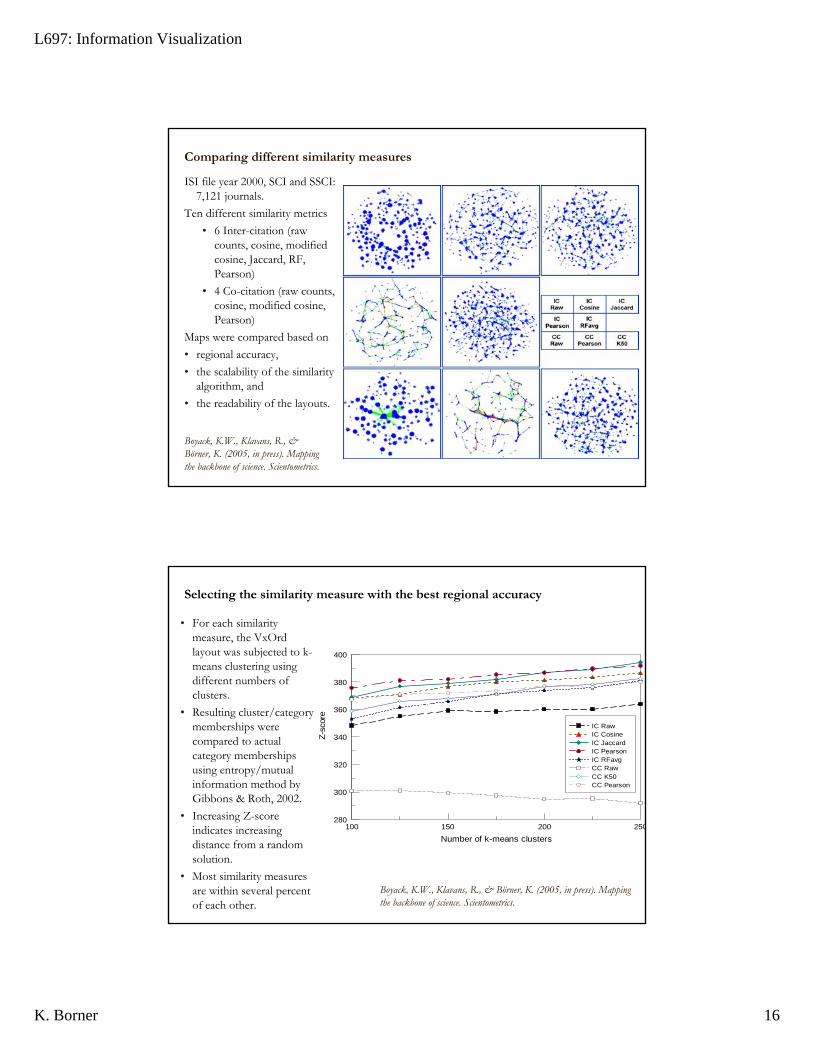
Comparing different similarity measures
ISI file year 2000, SCI and SSCI: 7,121 journals.
Ten different similarity metrics• 6 Inter-citation (raw
counts, cosine, modified cosine, Jaccard, RF, Pearson)
• 4 Co-citation (raw counts, cosine, modified cosine, Pearson)
Maps were compared based on • regional accuracy, • the scalability of the similarity
algorithm, and • the readability of the layouts.
Boyack, K.W., Klavans, R., & Börner, K. (2005, in press). Mapping the backbone of science. Scientometrics.
• For each similarity measure, the VxOrdlayout was subjected to k-means clustering using different numbers of clusters.
• Resulting cluster/category memberships were compared to actual category memberships using entropy/mutual information method by Gibbons & Roth, 2002.
• Increasing Z-score indicates increasing distance from a random solution.
• Most similarity measures are within several percent of each other.
Number of k-means clusters100 150 200 250
Z-sc
ore
280
300
320
340
360
380
400
IC RawIC CosineIC JaccardIC PearsonIC RFavgCC RawCC K50CC Pearson
Selecting the similarity measure with the best regional accuracy
Boyack, K.W., Klavans, R., & Börner, K. (2005, in press). Mapping the backbone of science. Scientometrics.
L697: Information Visualization
K. Borner 17
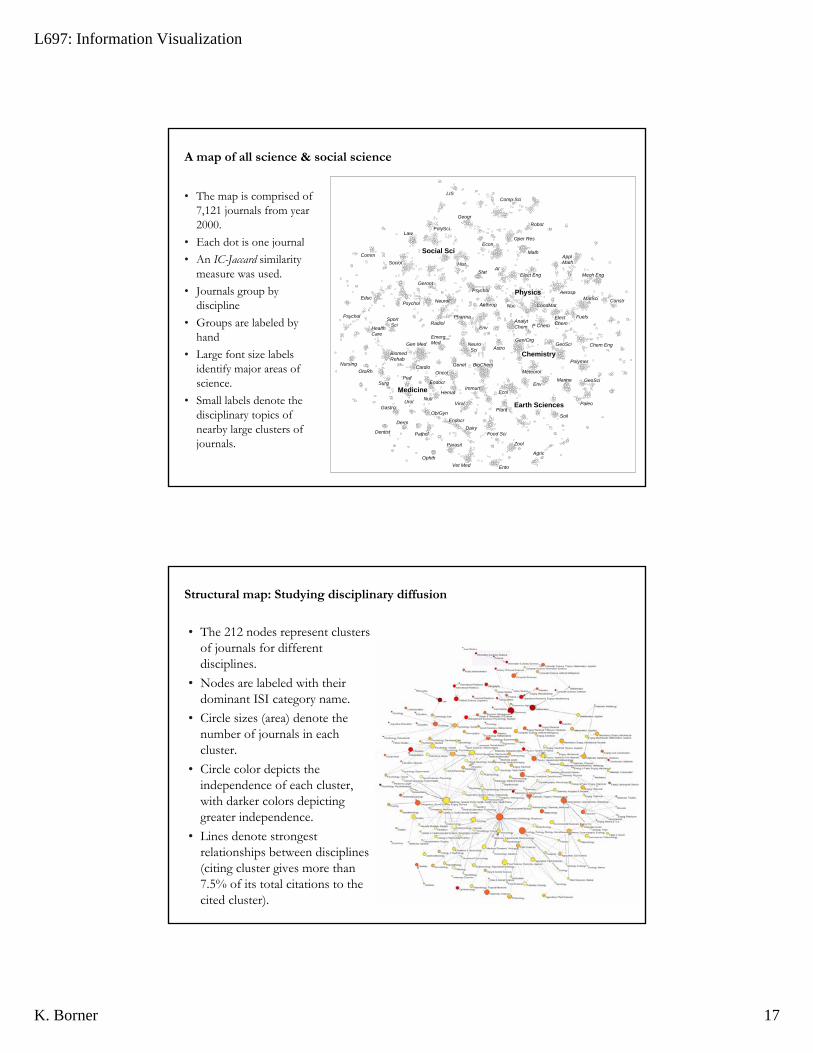
A map of all science & social science
• The map is comprised of 7,121 journals from year 2000.
• Each dot is one journal• An IC-Jaccard similarity
measure was used. • Journals group by
discipline• Groups are labeled by
hand• Large font size labels
identify major areas of science.
• Small labels denote the disciplinary topics of nearby large clusters of journals.
Comp Sci
PolySciLaw
LIS
Geogr
Hist
Econ
Sociol
Nursing
Educ
Comm
Psychol
Geront
Neurol
RadiolSport Sci
Oper Res
Math
Robot
AIStat
Psychol
Anthrop
Elect Eng
Physics
Mech Eng
ConstrMatSci
FuelsElectChemP Chem
Chemistry
AnalytChem
Astro
Env
Pharma
Neuro Sci
Chem Eng
Polymer
GeoSci
GeoSci
Paleo
Meteorol
EnvMarine
Social Sci
SoilPlant
Ecol
Agric
Earth Sciences
Psychol
OtoRh
HealthCare
BiomedRehab
Gen Med
GenetCardio
Ped
Food Sci
Zool
EntoVet Med
Parasit
Ophth
DairyEndocr
Ob/Gyn
Virol
Hemat
Oncol
Immun
BioChem
Nutr
Endocr
Urol
Dentist
Derm
Pathol
Gastro
SurgMedicine
ApplMath
Aerosp
CondMatNuc
EmergMed Gen/Org
• The 212 nodes represent clusters of journals for different disciplines.
• Nodes are labeled with their dominant ISI category name.
• Circle sizes (area) denote the number of journals in each cluster.
• Circle color depicts the independence of each cluster, with darker colors depicting greater independence.
• Lines denote strongest relationships between disciplines (citing cluster gives more than 7.5% of its total citations to the cited cluster).
Structural map: Studying disciplinary diffusion

L697: Information Visualization
K. Borner 18
• Clusters of journals denote disciplines.
• Lines denote strongest relationships between journals
Zoom into structural map
L697: Information Visualization
K. Borner 19
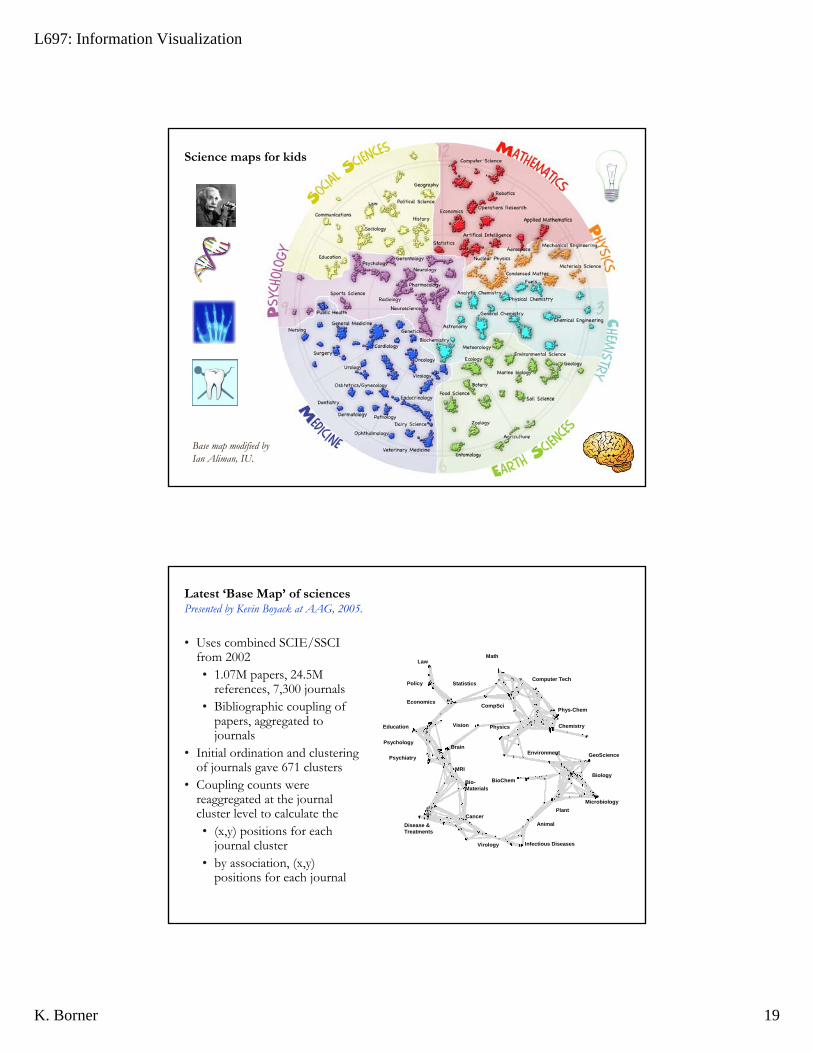
Base map modified by Ian Aliman, IU.
Science maps for kids
Latest ‘Base Map’ of sciencesPresented by Kevin Boyack at AAG, 2005.
• Uses combined SCIE/SSCI from 2002• 1.07M papers, 24.5M
references, 7,300 journals• Bibliographic coupling of
papers, aggregated to journals
• Initial ordination and clustering of journals gave 671 clusters
• Coupling counts were reaggregated at the journal cluster level to calculate the • (x,y) positions for each
journal cluster• by association, (x,y)
positions for each journal
Policy
Economics
Statistics
Math
CompSci
Physics
Biology
GeoScience
Microbiology
BioChem
Brain
PsychiatryEnvironment
Vision
Virology Infectious Diseases
CancerDisease &Treatments
MRI
Bio-Materials
Law
Plant
Animal
Phys-Chem
Chemistry
Psychology
Education
Computer Tech
L697: Information Visualization
K. Borner 20
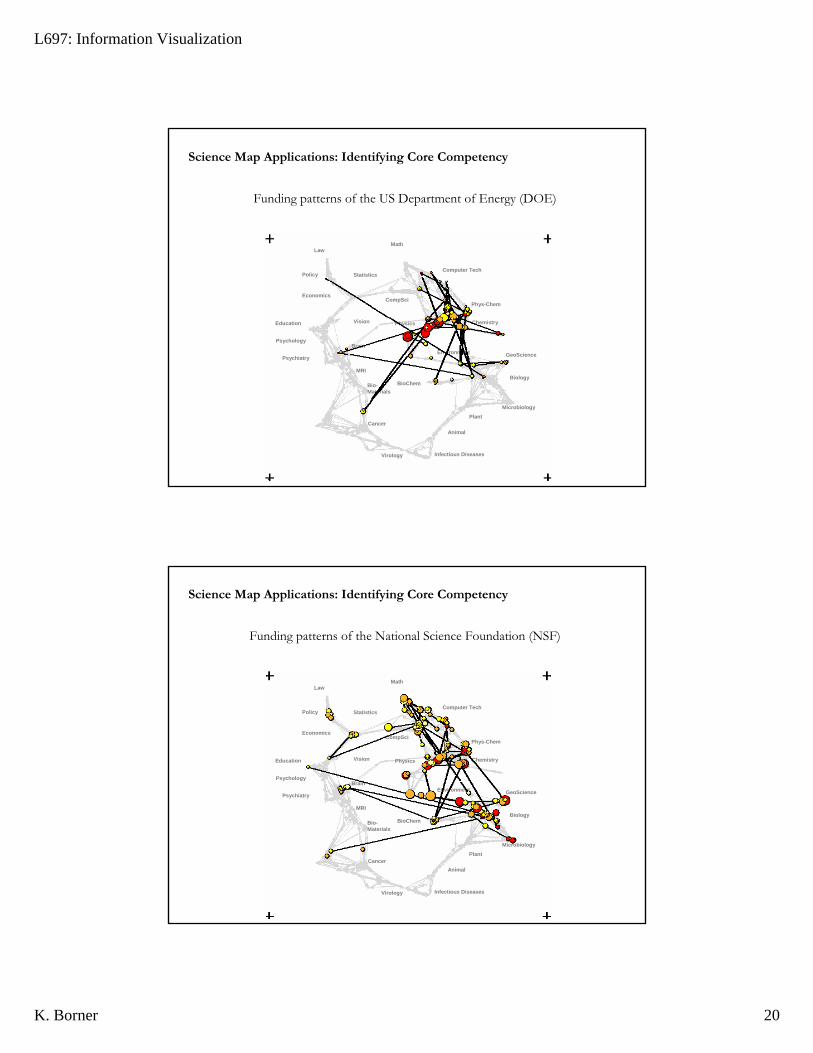
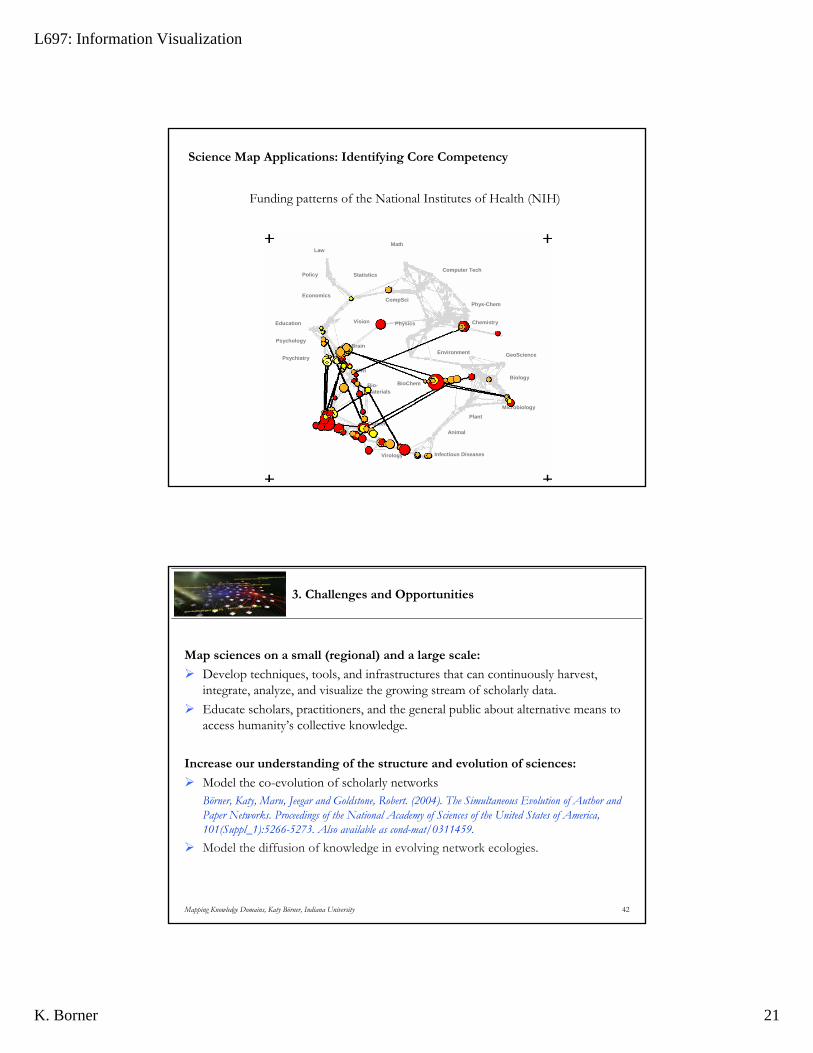
Science Map Applications: Identifying Core Competency
Policy
Economics
Statistics
Math
CompSci
Physics
Biology
GeoScience
Microbiology
BioChem
Brain
PsychiatryEnvironment
Vision
Virology Infectious Diseases
Cancer
MRI
Bio-Materials
Law
Plant
Animal
Phys-Chem
Chemistry
Psychology
Education
Computer Tech
GI
Funding patterns of the US Department of Energy (DOE)
Policy
Economics
Statistics
Math
CompSci
Physics
Biology
GeoScience
Microbiology
BioChem
Brain
PsychiatryEnvironment
Vision
Virology Infectious Diseases
Cancer
MRI
Bio-Materials
Law
Plant
Animal
Phys-Chem
Chemistry
Psychology
Education
Computer Tech
GI
Funding patterns of the National Science Foundation (NSF)
Science Map Applications: Identifying Core Competency
L697: Information Visualization
K. Borner 21
Policy
Economics
Statistics
Math
CompSci
Physics
Biology
GeoScience
Microbiology
BioChem
Brain
PsychiatryEnvironment
Vision
Virology Infectious Diseases
Cancer
MRI
Bio-Materials
Law
Plant
Animal
Phys-Chem
Chemistry
Psychology
Education
Computer Tech
GI
Funding patterns of the National Institutes of Health (NIH)
Science Map Applications: Identifying Core Competency
Mapping Knowledge Domains, Katy Börner, Indiana University 42
3. Challenges and Opportunities
Map sciences on a small (regional) and a large scale:
Develop techniques, tools, and infrastructures that can continuously harvest, integrate, analyze, and visualize the growing stream of scholarly data.Educate scholars, practitioners, and the general public about alternative means to access humanity’s collective knowledge.
Increase our understanding of the structure and evolution of sciences:
Model the co-evolution of scholarly networksBörner, Katy, Maru, Jeegar and Goldstone, Robert. (2004). The Simultaneous Evolution of Author and Paper Networks. Proceedings of the National Academy of Sciences of the United States of America, 101(Suppl_1):5266-5273. Also available as cond-mat/0311459. Model the diffusion of knowledge in evolving network ecologies.
L697: Information Visualization
K. Borner 22
Mapping Knowledge Domains, Katy Börner, Indiana University 43
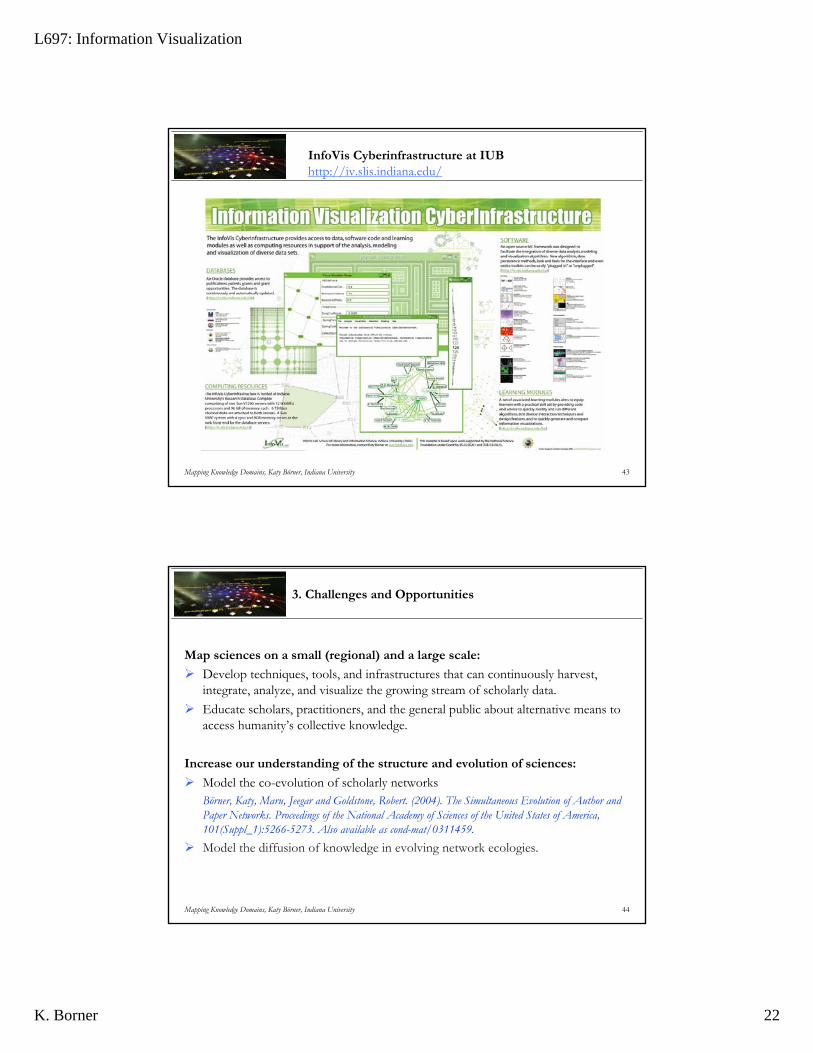
InfoVis Cyberinfrastructure at IUBhttp://iv.slis.indiana.edu/
Mapping Knowledge Domains, Katy Börner, Indiana University 44
3. Challenges and Opportunities
Map sciences on a small (regional) and a large scale:
Develop techniques, tools, and infrastructures that can continuously harvest, integrate, analyze, and visualize the growing stream of scholarly data.Educate scholars, practitioners, and the general public about alternative means to access humanity’s collective knowledge.
Increase our understanding of the structure and evolution of sciences:
Model the co-evolution of scholarly networksBörner, Katy, Maru, Jeegar and Goldstone, Robert. (2004). The Simultaneous Evolution of Author and Paper Networks. Proceedings of the National Academy of Sciences of the United States of America, 101(Suppl_1):5266-5273. Also available as cond-mat/0311459. Model the diffusion of knowledge in evolving network ecologies.
L697: Information Visualization
K. Borner 23
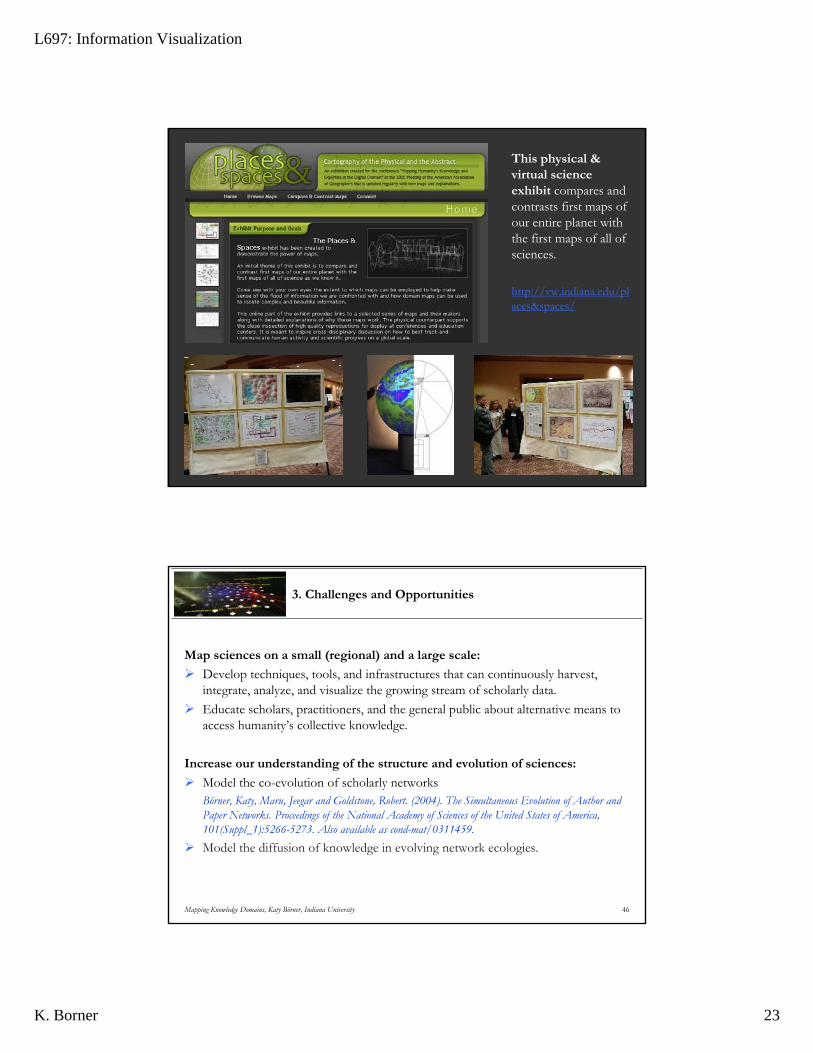
This physical & virtual science exhibit compares and contrasts first maps of our entire planet with the first maps of all of sciences.
http://vw.indiana.edu/places&spaces/
Mapping Knowledge Domains, Katy Börner, Indiana University 46
3. Challenges and Opportunities
Map sciences on a small (regional) and a large scale:
Develop techniques, tools, and infrastructures that can continuously harvest, integrate, analyze, and visualize the growing stream of scholarly data.Educate scholars, practitioners, and the general public about alternative means to access humanity’s collective knowledge.
Increase our understanding of the structure and evolution of sciences:
Model the co-evolution of scholarly networksBörner, Katy, Maru, Jeegar and Goldstone, Robert. (2004). The Simultaneous Evolution of Author and Paper Networks. Proceedings of the National Academy of Sciences of the United States of America, 101(Suppl_1):5266-5273. Also available as cond-mat/0311459. Model the diffusion of knowledge in evolving network ecologies.
L697: Information Visualization
K. Borner 24
Mapping Knowledge Domains, Katy Börner, Indiana University 47
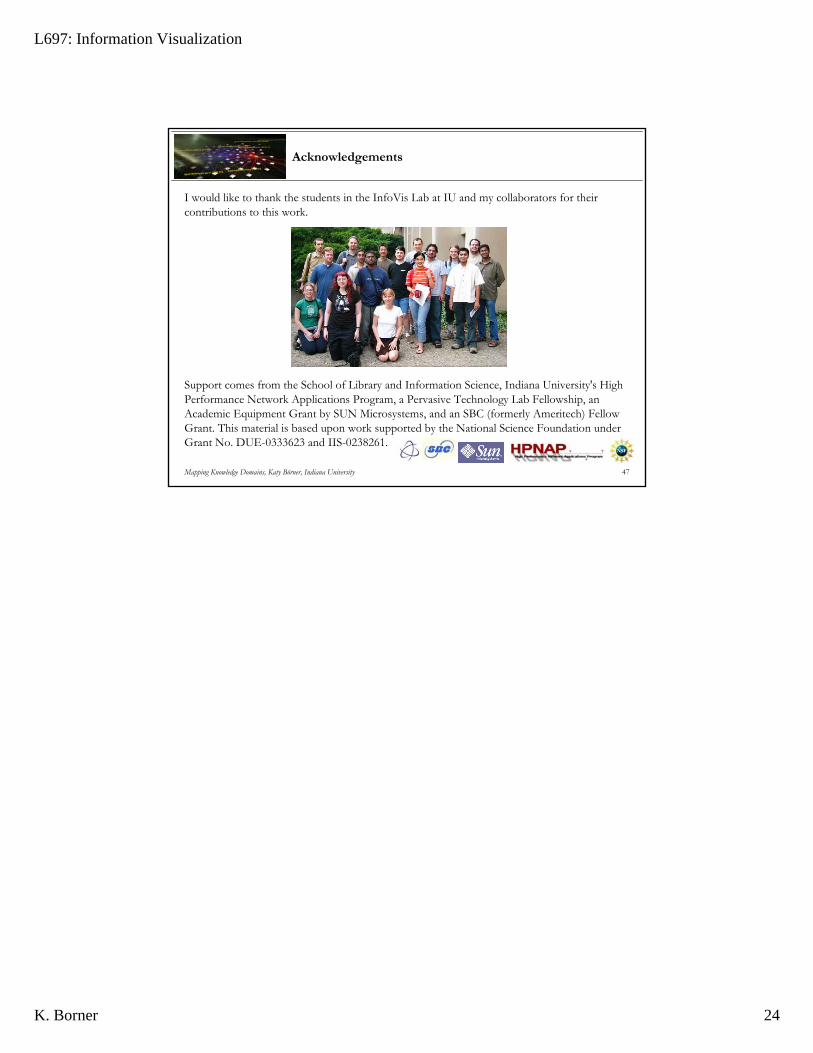
Acknowledgements
I would like to thank the students in the InfoVis Lab at IU and my collaborators for their contributions to this work.
Support comes from the School of Library and Information Science, Indiana University's High Performance Network Applications Program, a Pervasive Technology Lab Fellowship, an Academic Equipment Grant by SUN Microsystems, and an SBC (formerly Ameritech) Fellow Grant. This material is based upon work supported by the National Science Foundation under Grant No. DUE-0333623 and IIS-0238261.