Embed Size (px)
Citation preview

Mapping Known and Potential Mineral Occurrences and Host Rocks in the Bonnifield Mining District Using Minimal Cloud- and Snow-Cover ASTER Data
By Bernard E. Hubbard, Cynthia Dusel-Bacon, Lawrence C. Rowan, and Robert G. Eppinger
Chapter E ofRecent U.S. Geological Survey Studies in the Tintina Gold Province, Alaska, United States, and Yukon, Canada—Results of a 5-Year ProjectEdited by Larry P. Gough and Warren C. Day
Scientific Investigations Report 2007–5289–E
U.S. Department of the InteriorU.S. Geological Survey


iii
Contents
Abstract ........................................................................................................................................................ E1Introduction ................................................................................................................................................. E1Geologic Setting ......................................................................................................................................... E1Background, Methodology, and Relevance .......................................................................................... E3Results ......................................................................................................................................................... E3
Host-Rock Mapping Using ASTER TIR Decorrelation Stretch Data .......................................... E3Alteration Mineral Maps of Known and Undiscovered VMS and Porphyry Deposits ........... E3
Conclusions ................................................................................................................................................. E7References Cited......................................................................................................................................... E7
Figures E1. Map showing locations of the Bonnifield mining district south of Fairbanks,
Alaska .......................................................................................................................................... E2 E2. ASTER thermal-infrared decorrelation stretch image (ASTER bands 13, 12 and 10,
displayed as red, green, and blue, respectively) covering a portion of the Healy quadrangle .................................................................................................................................. E4
E3. ASTER-derived mineral maps of portions of the 1:250,000-scale Healy quadrangle, Alaska .......................................................................................................................................... E5
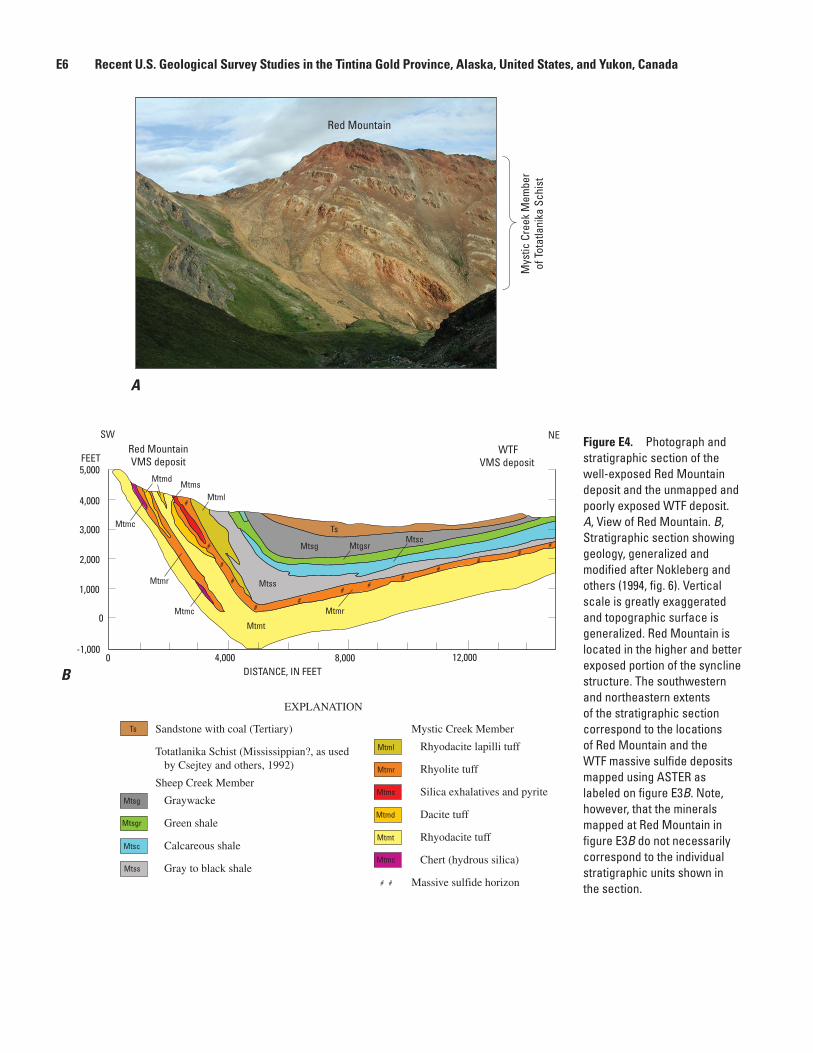
E4. Photograph and stratigraphic section of the well-exposed Red Mountain deposit and the unmapped and poorly exposed WTF deposit ......................................................... E6


Mapping Known and Potential Mineral Occurrences and Host Rocks in the Bonnifield Mining District Using Minimal Cloud- and Snow-Cover ASTER Data
By Bernard E. Hubbard,1 Cynthia Dusel-Bacon,1 Lawrence C. Rowan,1 and Robert G. Eppinger1
1U.S. Geological Survey.
AbstractOn July 8, 2003, the Advanced Spaceborne Thermal
Emission and Reflection Radiometer (ASTER) sensor acquired satellite imagery of a 60-kilometer-wide swath covering a portion of the Bonnifield mining district within the southernmost part of the Tintina Gold Province, Alaska, under unusually favorable conditions of minimal cloud and snow cover. Although rocks from more than eight different lithotectonic terranes are exposed within the extended swath of data, we focus on volcanogenic massive sulfides (VMS) and porphyry deposits within the Yukon-Tanana terrane (YTT), the largest Mesozoic accretionary terrane exposed between the Denali fault system to the south of Fairbanks and the Tintina fault system to the north of Fairbanks.
Comparison of thermal-infrared region (TIR) decorrelation stretch data to available geologic maps indicates that rocks from the YTT contain a wide range of rock types ranging in composition from mafic metavolcanic rocks to felsic rock types such as metarhyolites, pelitic schists, and quartzites. The nine-band ASTER visible-near-infrared region–short-wave infrared region (VNIR-SWIR) reflectance data and spectral matched-filter processing were used to map hydrothermal alteration patterns associated with VMS and porphyry deposit types. In particular, smectite, kaolinite, opaline silica, jarosite and (or) other ferric iron minerals defined narrow (less than 250-meter diameter) zonal patterns around Red Mountain and other potential VMS targets. Using ASTER we identified some of the known mineral deposits in the region, as well as mineralogically similar targets that may represent potential undiscovered deposits. Some known deposits were not identified and may have been obscured by vegetation or snow cover or were too small to be resolved.
Introduction On July 8, 2003, the Advanced Spaceborne
Thermal Emission and Reflection Radiometer (ASTER) sensor aboard the TERRA satellite acquired a 60-kilometer (km)-wide orbital swath of data covering parts of the 1:250,000-scale Healy quadrangle in east-central Alaska (fig. E1). The orbital swath of data continues on to include parts of the Talkeetna Mountains 1:250,000-scale quad-rangle (see Hubbard and others, 2007) and areas to the south of Anchorage and the populated Matanuska Valley. Figure E1 illustrates the Healy and Bonnifield mining district portion of the ASTER data coverage used in this study, which was acquired under unusually low cloud- and snow-cover conditions (see also fig. 1 of Editors’ Preface and Overview).
Mineral resource exploration throughout much of the State has been hampered by the large geographic distances, lack of roads, and paucity of detailed geologic maps at 1:63,360 scale or less. This leaves a large part of the State with possible undiscovered metallogenic resources. The purpose of this paper is to show the utility of ASTER for lithologic mapping of mineral deposit host rocks that define permissive tracts and for targeting hydrothermal alteration zones indicative of potential undiscovered occurrences.
Geologic Setting Several important volcanogenic massive sulfide
(VMS) deposits are located within the Yukon-Tanana terrane (YTT), and their metallogenesis is discussed by Nokleberg and others (1994) and Newberry and others (1997). The Healy quadrangle (fig. E1) contains a variety of rocks ranging from mafic metavolcanic rocks to felsic metavolcanic rocks with a range of intermediate composi-tions (Csejtey and others, 1986, 1992, and references therein). Felsic metavolcanic and metavolcaniclastic rocks are important host rocks for Kuroko-type VMS deposits (Lydon, 1984; Cox and Singer, 1986–deposit model

E2 Recent U.S. Geological Survey Studies in the Tintina Gold Province, Alaska, United States, and Yukon, Canada
Hines Creek strand(Denali fault)
McKinley strand(Denali fault)
Yukon-Tananaterrane
Healy
McKinleyPark
Cantwell
Paxson
Richardson
Fairbanks
To Talkeetnaand Anchorage
To Kantishna
To Valdez
Alaska HighwayTo Yukon
Delta Junction64°147°
64°150°
150°63°
63°
147°0 45 KILOMETERS
EXPLANATION
Approximate boundary of Bonnifield mining district
Approximate boundary of Healy quadrangle
FaultRoad
Pacif ic Ocean
CANADA
UNITED STATESHealy
quadrangle
Alaska
Yukon
NorthwestTerritories
BritishColumbia
Location map
Figure E1. Map showing locations of the Bonnifield mining district south of Fairbanks, Alaska, and the 1:250,000-scale Healy quadrangle boundary. Also shown are the Hines Creek and McKinley strands of the Denali fault system and a false-color image (ASTER bands 6, 3 and 1, displayed as red, green, and blue respectively) showing the extent of minimal cloud- and snow-cover ASTER data for the area.

Mapping Known and Potential Mineral Occurrences and Host Rocks Using ASTER Data E3
28a). Mafic metavolcanic and metavolcaniclastic rocks typically host Besshi-type VMS deposits (Cox and Singer, 1986–deposit model 24b), which are distinct from the Cyprus-type VMS deposits associated with ophiolites (Cox and Singer, 1986–deposit model 24a). Several of the VMS deposits mapped using ASTER are associated with greenschist-facies metamorphic host rocks (Dusel-Bacon and others, 1993; Hubbard and others, 2007; Dusel-Bacon and others, this vol-ume, chap. B). Differences in host rock composition and meta-morphic grade lead to differences in the phyllosilicate mineral assemblages associated with VMS deposits, potentially providing a remote sensing basis for their discrimination. For instance, greenschist-grade metamorphic rocks show enhanced crystallinity of clay minerals, both associated with hydrothermal alteration, and within the groundmass (for example, McLeod and Stanton, 1984; McLeod, 1985, 1987; McLeod and others, 1987). Higher metamorphic grades, such as amphibolite facies, will destroy clay minerals, such as kaolinite, unless these clay minerals are replenished through supergene alteration processes.
Background, Methodology, and Relevance
ASTER measures reflected radiation in the three wavelength bands between 0.520 and 0.860 micrometers (mm) (visible-near-infrared region, or VNIR) and in six bands from 1.00 to 2.43 mm (short-wave infrared region, or SWIR), with 15-m and 30-m spatial resolution, respectively (Fujisada, 1995). In addition, ASTER measures emitted thermal radiation in five bands in the 8.125- to 11.650-mm wavelength region (thermal-infrared region, or TIR) at 90-m resolution (Fujisada, 1995). Both standard calibrated ASTER data products (VNIR-SWIR reflectance, TIR emissivity, and TIR decorrelation stretch) and (or) their equivalents were used in this study (see Rowan and others, 2003; Rowan and Mars, 2003). Briefly, hydrothermal alteration minerals were mapped based on image spectral endmembers derived through principal component analysis (for example, Green and others, 1988; Boardman and others, 1995) of the nine ASTER VNIR-SWIR bands. These spectral endmembers (for example, Hubbard and others, 2007) were used as refer-ence spectra in subsequent matched-filter image classifica-tion procedures (Harsanyi and Chang, 1994). The standard decorrelation stretch image product (fig. E2) shows ASTER TIR bands 10, 12, and 13 displayed as blue, green and red, respectively. Decorrelation stretch images are used to enhance the brightness variations between TIR bands related to compositional differences and emissivity, while suppressing correlated interchannel brightness values dominated by radiant temperature (Gillespie and others, 1986). Further processing details are discussed by Hubbard and others (2007).
Results
Host-Rock Mapping Using ASTER TIR Decorrelation Stretch Data
Within YTT and rocks south of the Hines Creek strand of the Denali fault, linear enhancement of the TIR decorrelation stretch data shows a variety of lithologic compositions ranging from the mostly mafic, such as the labeled Chute Creek Member of the Totatlanika Schist (of Csejtey and others, 1992; blue shades, fig. E2), intermediate (mixed red-blue, or purple through magenta shades, fig. E2), and quartz-rich rocks such as granitic intrusions and prominent quartzite exposures (red shades, fig. E2). Several of these rock types are grouped together into formations at a scale of 1:250,000 (such as the Totatlanika Schist) but also are shown as distinct lithological members in the more detailed 1:63,360 geologic maps (for example, from oldest to youngest, the Moose Creek, California Creek, Chute Creek, Mystic Creek, and Sheep Creek Members of the Totatlanika Schist; Wahrhaftig, 1970a,b; Gilbert, 1977). In particular, the metarhyolite-dominated Mystic Creek Member hosts the Red Mountain and WTF VMS prospects (figs. E3, E4). Spectral analysis of sampled ground truth areas is discussed in greater detail by Hubbard and others (2007).
Alteration Mineral Maps of Known and Undiscovered VMS and Porphyry Deposits
Figure E3 shows the resulting mineral maps generated using nine-band ASTER VNIR-SWIR data and spectral matched-filtering methods. Large areas of the upper two scenes of the ASTER mosaic (fig. E3A) were classified as containing zones of ferric-iron-rich minerals, chlorite and (or) epidote, and muscovite and (or) illite. Chlorite and (or) epidote are Fe,Mg-OH minerals that commonly occur in the predominantly greenschist and prehnite-pumpellyite facies of metamorphic rocks throughout the area. Muscovite and (or) illite can occur either as primary minerals in the groundmass of igneous and metamorphic rocks, within sericitic hydrothermal alteration zones, or as the weathering product of potassium-rich rocks.
Spectral analysis of fine-grained rock and soil samples collected at Red Mountain contain kaolinite, illite-muscovite, smectite, and goethite. These minerals were all mapped as distinct zoning patterns using ASTER data (fig. E3B, C). In addition, a variety of ferric-iron and aluminum oxy-hydroxide and sulfate mineral precipitates are found in and around the streams draining the mountain, reflecting natural acid-rock drainage conditions within the pristine (unmined) Red Mountain VMS deposit (Eppinger and others, this volume, chap. I).
Alteration mineral zones were mapped at a more detailed scale for the Red Mountain deposit and the location

E4 Recent U.S. Geological Survey Studies in the Tintina Gold Province, Alaska, United States, and Yukon, Canada
of the WTF massive sulfide deposit (fig. E3B), the Anderson Mountain massive sulfide deposits (fig. E3C), and an area of possible alunite occurrence at Nenana Mountain in rocks mapped as Tertiary granites and Quaternary Nenana Glacier lateral moraines (fig. E3D). The Nenana Mountain and Nenana Glacier distribution could represent argillic and propylitic alteration zones of a porphyry copper deposit which can extend from 1 to 4 km (Lowell and Guilbert, 1970; Cox and Singer, 1986–deposit model 17). This distribution differs in scale and mineralogy from what is expected in hydrothermal alteration zones associated with VMS deposits such as Red Mountain, which generally extends for less than a few hundred meters (Lydon, 1984). The red, orange, and yellow colors (fig. E4A) and related mineralogy (fig. E3B) displayed by the Red Mountain deposit are due mostly to supergene alteration
of pyrite and other massive sulfide layers (figs. E4B, C), and exposed silica exhalite and chert deposits (figs. E4B, C).
Nearly 200 potential VMS deposits were mapped by Hubbard and others (2007) in portions of the Healy and Talkeetna Mountains quadrangles covered by ASTER. Their identification was based on small-scale (about 100–200-m diameter) mineral zoning patterns between hydrous silica, jarosite, kaolinite, and smectite, which graded into background rocks dominated by ferric iron, chlorite, and sericite. Potential porphyry deposits such as at Nenana Mountain and the Nenana Glacier are defined by larger scale (greater than 1 km diameter) argillic and propylitic alteration zones.
64°
147°
0 20 KILOMETERS
Chute Creek Member (maficmetavolcanic schist)
Clouds
Glacial snow andice (masked priorto decorrelationstretching)
Yukon-Tananaterrane rocks
Boundary of Healyquadrangle
Hines Creek strand of the Denali faultsystem
Quartzite, siliceousschists and otherquartz-rich rocks at or above Hines Creek fault contact
Pingstonterrane rocks
McKinleyterrane rocks
Figure E2. ASTER thermal-infrared decorrelation stretch image (ASTER bands 13, 12 and 10, displayed as red, green, and blue, respectively) covering the portion of the Healy quadrangle shown in figure E1, including maximum exposure of rocks from the Yukon-Tanana terrane. Snow and ice fields of glaciers south of the Denali fault have been masked prior to contrast stretching and appear
as darkest shades to almost black. Vegetation appears mostly lighter green. Clouds and cloud shadows appear yellow. Red areas are exposed rocks that are more silicic in composition and blue areas depict rocks that are more mafic in composition. Colors in between (for example, purple, magenta, and cyan) represent mixtures of the aforementioned materials.

Mapping Known and Potential Mineral Occurrences and Host Rocks Using ASTER Data E5
Red MountainAndersonMountain
NenanaMountain
Boundary of Healy quadrangle
B
C
D
B C
D
Location of unmapped WTF depositwithin the tundra vegetation
30 KILOMETERS0 15
64°147°64°
150°
150° 63°63°
147°
Nenana Glacierlateral moraine
A
EXPLANATION (for parts A–D)
Ferric-iron minerals
Chlorite or epidote
Muscovite or illite
Alunite
Smectite clays
Kaolinite
Hydrous silica minerals
Limit of ASTER image swath
Figure E3. ASTER-derived images of portions of the 1:250,000-scale Healy quadrangle, Alaska, showing the distribution of host rocks and glacial sediments containing the three most abundant minerals. A, Overview map of a major portion of the Healy quadrangle showing locations of detailed hydrothermal alteration mineral zonation maps (B, C, and D). Shaded-relief base image was generated from U.S. Geological Survey digital elevation model dataset. B, Red Mountain and WTF massive sulfide deposits, with approximate northeastern (NE) and southwestern (SW) extents of profile shown in figure E4B. C, Anderson Mountain massive sulfide deposits. D, Area of possible alunite occurrence at Nenana Mountain in the McKinley terrane.
E6 Recent U.S. Geological Survey Studies in the Tintina Gold Province, Alaska, United States, and Yukon, Canada
EXPLANATION
Sandstone with coal (Tertiary)
Totatlanika Schist (Mississippian?, as used by Csejtey and others, 1992)
Sheep Creek Member
Graywacke
Green shale
Calcareous shale
Gray to black shale
Mystic Creek Member
Rhyodacite lapilli tuff
Rhyolite tuff
Silica exhalatives and pyrite
Dacite tuff
Rhyodacite tuff
Chert (hydrous silica)
Massive sulfide horizon
B
Mtsg
Ts
Mtsgr
Mtsc
MtssMtmc
Mtmt
Mtmd
Mtms
Mtmr
Mtml
Ts
Mtsg MtgsrMtsc
Mtmt
Mtmc
MtmdMtms
Mtml
Mtmr Mtss
Mtmr
Mtmc
##
##
#
#
#
#
#
##
##
# #
DISTANCE, IN FEET
Red MountainVMS deposit
WTFVMS deposit
1,000
-1,000
2,000
3,000
4,000
5,000
SW NE
0
0
12,0004,000 8,000
FEET
A
Red Mountain
Mys
tic C
reek
Mem
ber
of T
otat
lani
ka S
chis
t
Figure E4. Photograph and stratigraphic section of the well-exposed Red Mountain deposit and the unmapped and poorly exposed WTF deposit. A, View of Red Mountain. B, Stratigraphic section showing geology, generalized and modified after Nokleberg and others (1994, fig. 6). Vertical scale is greatly exaggerated and topographic surface is generalized. Red Mountain is located in the higher and better exposed portion of the syncline structure. The southwestern and northeastern extents of the stratigraphic section correspond to the locations of Red Mountain and the WTF massive sulfide deposits mapped using ASTER as labeled on figure E3B. Note, however, that the minerals mapped at Red Mountain in figure E3B do not necessarily correspond to the individual stratigraphic units shown in the section.

Mapping Known and Potential Mineral Occurrences and Host Rocks Using ASTER Data E7
Conclusions We show in this study the utility of ASTER as an
exploration tool for mapping potential occurrences of VMS and porphyry deposit types based on the deposit model characteristics such as host rock lithology and weathering characteristics, deposit size and scale, and hydrothermal alteration zonation patterns as described in Cox and Singer (1986). The results of this study show the utility of remote sensing, and in particular ASTER, for use in future mineral resource assessments. For example, such data are useful for the recognition of unknown deposits, definition of favorable or permissive tracts, and for providing basic rock composition data in geologically poorly known areas.
References Cited
Boardman, J.W., Kruse, F.A., and Green, R.O., 1995, Mapping target signatures via partial unmixing of AVIRIS data, in Proceedings of the Fifth JPL Airborne Earth Science Workshop, Jet Propulsion Laboratory, Pasadena, Calif., January 23–26, 1995: JPL Publication 95–01, p. 23–26.
Cox, D.P., and Singer, D.A., eds., 1986, Mineral deposit models: U.S. Geological Survey Bulletin 1693, 379 p.
Csejtey, Béla, Jr., Mullen, M.W., Cox, D.P., Gilbert, W.G., Yeend, W.E., Smith, T.E., Wahrhaftig, Clyde, Craddock, Campbell, Brewer, W.M., Sherwood, K.W., Hickman, R.G., Stricker, G.D., St. Aubin, D.R., and Goerz, D.J., III, 1986, Geology and geochronology of the Healy quadrangle, Alaska: U.S. Geological Survey Open-File Report 86–396, including 1:250,000-scale map (superseded by Csejtey and others, 1992). (Also available online at http://pubs.er.usgs.gov/usgspubs/ofr/ofr86396/.)
Csejtey, Béla, Jr., Mullen, M.W., Cox, D.P., and Stricker, G.D., 1992, Geology and geochronol-ogy of the Healy quadrangle, south-central Alaska: U.S. Geological Survey Miscellaneous Investigations Series Map I–1961, 63 p., 2 sheets, scale 1:250,000.
Dusel-Bacon, Cynthia, Csejtey, Béla, Jr., Foster, H.L., Doyle, E.O., Nokleberg, W.J., and Plafker, George, 1993, Distribution, facies, ages, and proposed tectonic associations of regionally metamorphosed rocks in east- and south-central Alaska: U.S. Geological Survey Professional Paper 1497–C, 73 p., 2 sheets, scale 1:1,000,000. (Also available online at http://pubs.er.usgs.gov/usgspubs/pp/pp1497C.)
Eppinger, R.G., Briggs, P.H., Dusel-Bacon, Cynthia, Giles, S.A., Gough, L.P., Hammarstrom, J.M., and Hubbard, B.E., 2007, Environmental geochemistry at Red Mountain, an unmined volcanogenic massive sulphide deposit in the Bonnifield district, Alaska Range, east-central Alaska: Geochemistry: Exploration, Environment, Analysis, v. 7, no. 3, p. 207-223.
Fujisada, Hiroyuki, 1995, Design and performance of ASTER instrument, in Fujisada, Hiroyuki, and Sweeting, M.N., eds., Advanced and next generation satellites, Proceedings of SPIE, December 15, 1995: International Society for Optical Engineering, v. 2583, p. 16–25.
Gilbert, W.G., 1977, General geology of the Healy D–1 and southern Fairbanks A–1 quadrangles and vicinity, Alaska: Alaska Division of Geological and Geophysical Surveys Open-File Report 105, 13 p., 2 sheets, scale 1:63,360.
Gillespie, A.R., Kahle, A.B., and Walker, R.E., 1986, Color enhancement of highly correlated images. I. Decorrelation and HSI contrast stretches: Remote Sensing of Environment, v. 20, no. 3, p. 209–235.
Green, A.A., Berman, M., Switzer, B., and Craig, M.D., 1988, A transformation for ordering multispectral data in terms of image quality and implications for noise removal: IEEE Transactions on Geoscience and Remote Sensing, v. 26, no. 1, p. 65–74.
Harsanyi, J.C., and Chang, C.I., 1994, Hyperspectral image classification and dimensionality reduction; An orthogonal subspace projection approach: IEEE Transactions on Geoscience and Remote Sensing, v. 32, no. 4, p. 779–785.
Hubbard, B.E., Rowan, L.C., Dusel-Bacon, Cynthia, and Eppinger, R.G., 2007, Geologic mapping and mineral resource assessment of the Healy and Talkeetna Mountains quadrangles, Alaska using minimal cloud- and snow-cover ASTER data: U.S. Geological Survey Open-File Report 2007–1046, 22 p. (Also available online at http://pubs.usgs.gov/of/2007/1046/.)
Lowell, J.D., and Guilbert, J.M., 1970, Lateral and vertical alteration-mineralization zoning in porphyry ore deposits: Economic Geology, v. 65, p. 373–408.
Lydon, J.W., 1984, Volcanogenic massive sulphide deposits, Part 1, A descriptive model: Geoscience Canada, v. 11, no. 4, p. 195–202.
McLeod, R.L., 1985, Preliminary observations of kaolinite in a volcanogenic massive sulphide deposit of Permian age: TMPM Tschermaks Mineralogische und Petrographische Mitteilungen, v. 34, no. 3–4, p. 261–269.

E8 Recent U.S. Geological Survey Studies in the Tintina Gold Province, Alaska, United States, and Yukon, Canada
McLeod, R.L., 1987, Alteration associated with volcanogenic sulphide ores at Mount Chambers, Queensland, Austra-lia: Institution of Mining and Metallurgy, Transactions (sect. B: Applied Earth Science), v. 96, p. B117–B127.
McLeod, R.L., and Stanton, R.L., 1984, Phyllosilicates and associated minerals in some Paleozoic stratiform sulfide deposits of southeastern Australia: Economic Geology, v. 79, no. 1, p. 1–22.
McLeod, R.L., Gabell, A.R., Green, A.A., and Gardavsky, V., 1987, Chlorite infrared spectral data as proximity indicators of volcanogenic massive sulphide mineralization, in Proceedings, Pacific Rim Congress 87, Gold Coast, Queensland, Australia, August 26–29, 1987: Parkville, Victoria, Australia, Australasian Institute of Mining and Metallurgy, p. 321–324.
Newberry, R.J., Crafford, T.C., Newkirk, S.R., Young, L.E., Nelson, S.W., and Duke, N.A., 1997, Volcanogenic massive sulfide deposits of Alaska: Economic Geology Monograph 9, p. 120–150.
Nokleberg, W.J., and others, 1994, Metallogeny and major mineral deposits of Alaska, in Plafker, George and Berg, H.C., eds., The geology of Alaska, chapter G–1 of The geology of North America: Boulder, Colo., Geological Society of America, p. 855–903.
Rowan, L.C., Hook, S.J., Abrams, M.J., and Mars, J.C., 2003, Mapping hydrothermally altered rocks at Cuprite, Nevada, using the Advanced Spaceborne Thermal Emission and Reflection Radiometer (ASTER), a new satellite-imaging system: Economic Geology, v. 98, no. 5, p. 1019–027.
Rowan, L.C., and Mars, J.C., 2003, Lithologic mapping in the Mountain Pass, California area using Advanced Spaceborne Thermal Emission and Reflection Radiometer (ASTER) data: Remote Sensing of Environment, v. 84, no. 3, p. 350–366.
Wahrhaftig, Clyde, 1970a, Geologic map of the Healy D–2 quadrangle, Alaska: U.S. Geological Survey Geologic Quadrangle Map GQ–804, scale 1:63,360.
Wahrhaftig, Clyde, 1970b, Geologic map of the Healy D–3 quadrangle, Alaska: U.S. Geological Survey Geologic Quadrangle Map GQ–805, scale 1:63,360.


![Delineation of Gold Mineral Potential Zone Using High ... · authors have studied the gold mineralization in Nigeria and the host rocks [2,3]. The most occurrences of such gold minerilization](https://img.pdfslide.net/doc/110x75/60634cd9b1e1b74dfa472282/delineation-of-gold-mineral-potential-zone-using-high-authors-have-studied-the.jpg)