Embed Size (px)
Citation preview

!Mapping Landscape Change!
DORNOCH POINT!!!13th February 2015!!!!EXECUTIVE SUMMARY!!!The purpose of this project was to assess the landscape change at Dornoch Point, Scotland. Landscape change over different time-scales up to 2010 was analysed and an overall sediment budget was produced for the Dornoch study area. This was done with the use of available Google Earth imagery, Ordnance Survey mapping and academic fieldwork data from the University of Glasgow. Data used included georeferenced Google Earth imagery, Ordnance Survey MasterMap, Ordnance Survey Historical Mapping, SOCETSET Photogrammetric data, Orthophotos, Global Navigation Satellite System and Terrestrial Laser Scan point data. All data was spatially referenced to the British National Grid.!!High water lines, edges of vegetation, digital terrain modelling, areas of gain and loss, height change and volume change were generated using Esri ArcMap and used to assess landscape change at Dornoch Point.!!Study outputs included digitised high water lines, edges of vegetation, areas of gain and loss, digital terrain models, height change maps, volume change maps, and an overall sediment budget for the Dornoch Point study area.!!Key findings of the study included the considerable change in shape and overall growth over time of Dornoch Point.!!This report is comprised of a full list of the utilised data, the processes utilised in the study, results, Esri ArcMap layouts, and challenges.!!
0806514� | �1 22MLC - DORNOCH POINT
! DATA LIST!!This section details the new layers that were created within the GIS to analyse the landscape change, the imaging and historical map data that was used as base layers and the tabular data that was used to form surface models for landscape change analysis.
0806514� | �2 22MLC - DORNOCH POINT
Imagery
DATA FILE TYPE FILE NAME DATE INPUT METHOD
Google Earth Imagery JPEG Dornoch Area 2010 Add Data
Google Earth Imagery JPEG Study Area 2010 Add Data
Google Earth Imagery JPEG Dornoch Area 2009 Add Data
Google Earth Imagery JPEG Study Area 2009 Add Data
Orthophoto TIFF & TFW ortho2000_east 2000 Add Data
Orthophoto TIFF & TFW ortho70_point 1970 Add Data
Orthophoto TIFF & TFW ortho70_west 1970 Add Data
Tabular
DATA DATA TYPE FILE NAME TAB NAME DATE DESCRIPTION INPUT METHOD
Terrestrial Laser Scanned Data
Point TLS_2009 2009 Terrestrial Laser Scan survey data
Import XY Data
GNSS Data Point GPS_2009_2 Dornoch Wed 2009 Systematic sampling in strips using Quad Bike along exposed end of spit
A S C I I t o Raster Tool
GNSS Data Point GPS_2009_2 Dornoch Thur 2009 Selective sampling along vegetation edge and some random points in study area
A S C I I t o Raster Tool
GNSS Data Point GPS_2009_2 Sheet 3 2009 Selective sampling along vegetation line
A S C I I t o Raster Tool
GNSS Data Point GPS_2007 Dor28thQuad 2007 Selective sampling along beach, high water line and vegeta t ion edge , fu l l length of study area coast
A S C I I t o Raster Tool
SOCET Data ASCII revised_2000 2000 Photogrammetric data Import XY Data
SOCET Data ASCII west70 1970 Photogrammetric data Import XY Data
!!!!!
0806514� | �3 22MLC - DORNOCH POINT
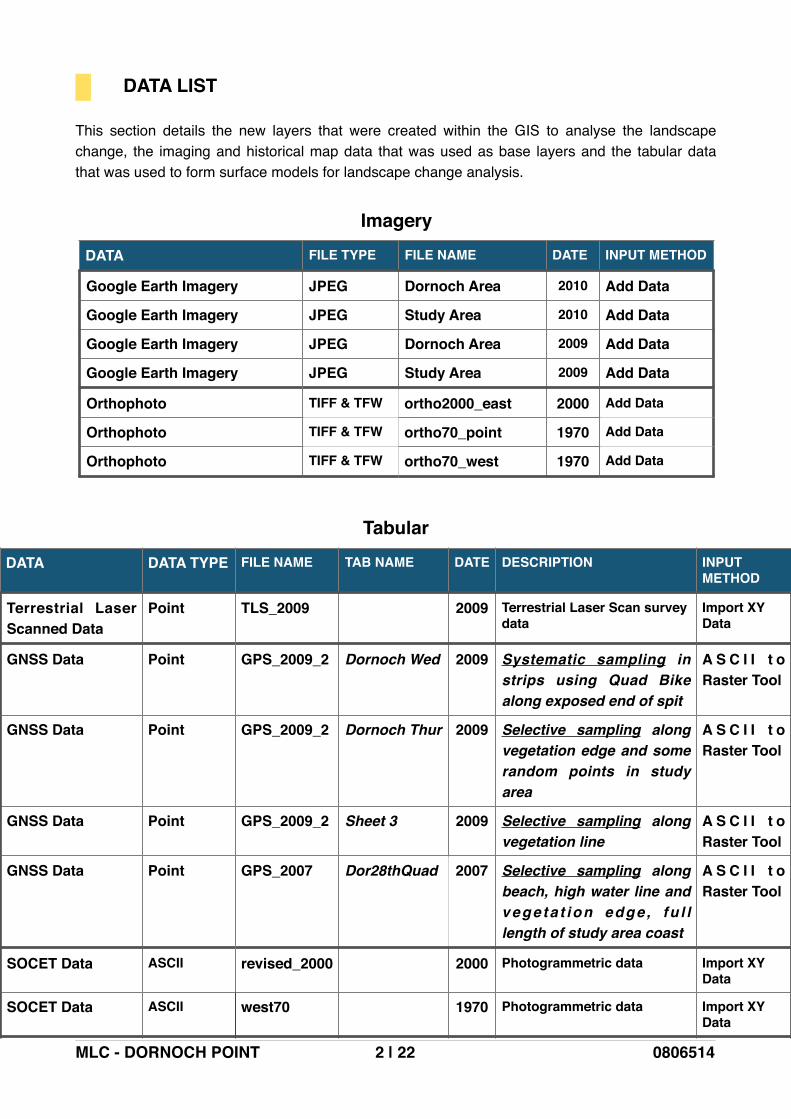
Maps
DATA DATA TYPE FILE NAME COUNTY PUBLISHED DATE
OS DATING INPUT METHOD
MasterMap - 1:10k Raster TIFF & MAPINFO MasterMap June 2013 Current Add Data
D o r n o c h H i s t o r i c a l National Grid:
TIFF & MAPINFO 1st Imperial Edition
1959-1960 1948-1981 Add Data
D o r n o c h H i s t o r i c a l National Grid:
TIFF & MAPINFO 3rd Revision National Grid
Suth 1950 1922-1969 Add Data
D o r n o c h H i s t o r i c a l National Grid:
TIFF & MAPINFO 1st Revision National Grid
Suth 1907 1888-1914 Add Data
D o r n o c h H i s t o r i c a l National Grid:
TIFF & MAPINFO 1st Edit ion National Grid
Suth 1879 1849-1899 Add Data
D o r n o c h H i s t o r i c a l National Grid:
TIFF & MAPINFO 1st Revision National Grid
Ross 1907 1888-1914 Add Data
D o r n o c h H i s t o r i c a l National Grid:
TIFF & MAPINFO 1st Edit ion National Grid
Ross 1881 1849-1899 Add Data
Dornoch Historical - 1:10560 County Series:
TIFF & MAPINFO 3rd Revision Sheet
Suth 1950 1922-1969 Add Data
Dornoch Historical - 1:10560 County Series:
TIFF & MAPINFO 1st Revision Sheet
Suth 1907 1888-1914 Add Data
Dornoch Historical - 1:10560 County Series:
TIFF & MAPINFO 1st Edit ion Sheet
Suth 1879 1849-1899 Add Data
Dornoch Historical - 1:10560 County Series:
TIFF & MAPINFO 1st Revision Sheet
Ross 1907 1888-1914 Add Data
Dornoch Historical - 1:10560 County Series:
TIFF & MAPINFO 1st Edit ion Sheet
Ross 1881 1849-1899 Add Data
Dornoch Historical - 1:10000 County Series:
TIFF & MAPINFO L a t e s t National Grid
1976-1980 Add Data
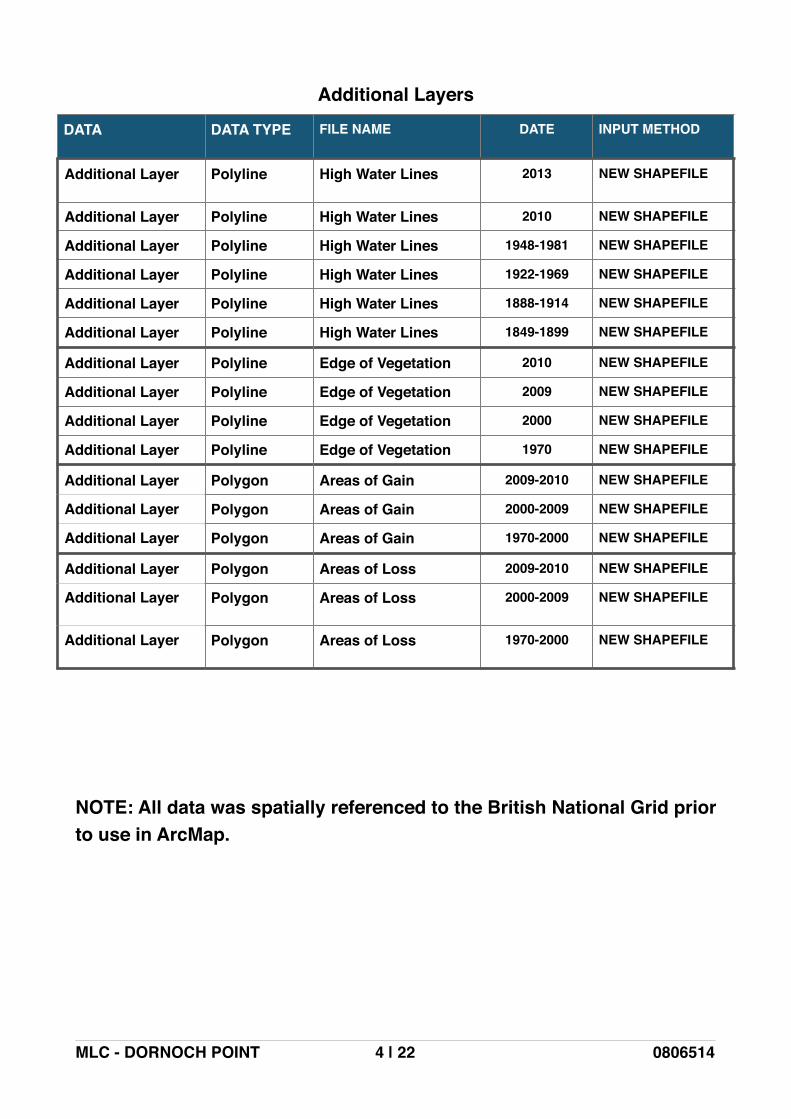
!!!!NOTE: All data was spatially referenced to the British National Grid prior to use in ArcMap.
0806514� | �4 22MLC - DORNOCH POINT
Additional Layers
DATA DATA TYPE FILE NAME DATE INPUT METHOD
Additional Layer Polyline High Water Lines 2013 NEW SHAPEFILE
Additional Layer Polyline High Water Lines 2010 NEW SHAPEFILE
Additional Layer Polyline High Water Lines 1948-1981 NEW SHAPEFILE
Additional Layer Polyline High Water Lines 1922-1969 NEW SHAPEFILE
Additional Layer Polyline High Water Lines 1888-1914 NEW SHAPEFILE
Additional Layer Polyline High Water Lines 1849-1899 NEW SHAPEFILE
Additional Layer Polyline Edge of Vegetation 2010 NEW SHAPEFILE
Additional Layer Polyline Edge of Vegetation 2009 NEW SHAPEFILE
Additional Layer Polyline Edge of Vegetation 2000 NEW SHAPEFILE
Additional Layer Polyline Edge of Vegetation 1970 NEW SHAPEFILE
Additional Layer Polygon Areas of Gain 2009-2010 NEW SHAPEFILE
Additional Layer Polygon Areas of Gain 2000-2009 NEW SHAPEFILE
Additional Layer Polygon Areas of Gain 1970-2000 NEW SHAPEFILE
Additional Layer Polygon Areas of Loss 2009-2010 NEW SHAPEFILE
Additional Layer Polygon Areas of Loss 2000-2009 NEW SHAPEFILE
Additional Layer Polygon Areas of Loss 1970-2000 NEW SHAPEFILE
! DATA QUALITY AND ERROR ESTIMATION!!Earlier mapping quality may not have had to adhere to the same standards as today and therefore may not be as accurate as more recent mapping. For example the county mapping that was made to fit due to the use of different projections - the Ross and Sutherland counties may have been a part of this. Therefore, some of the earlier mapping may be unreliable, up to and including the 1st Imperial Edition National Grid map.!!The 1st Imperial Edition National Grid map (1948-1981) also seems to be of poorer quality than the other maps as it is not as well annotated. This may have been a map that was created quickly to put at least something in place as the Ordnance Survey were fixing the county errors.!!Survey techniques and technology have advanced vastly since the earlier maps were produced and with it accuracy and mapping technology. The change from paper mapping to digital may also have introduced minor error as maps were scanned in as digital copies. Paper maps deform over time if stored in poor conditions, scanning these maps in may also introduce slight error but probably not enough to affect the result of a project of this scale.!!It also appears that the coastline has not been re-surveyed between some map publications. For example the current MasterMap (2013) MHWL has not been revised since the 1976-1980 mapping, 37 years. Similarly, the Point was not resurveyed between 1888-1914 and 1922-1969.!!Accuracy of Terrestrial Laser Scanning (TLS) can depend on the range being surveyed as the further away the less accurate it can be. Despite this, TLS is the most accurate of the surveying techniques as it can achieve millimetre (mm) accuracy.!!RTK GNSS accuracy can be dependent on a number of factors in the data capture and whether or not good post-processing methods are applied to the dataset. Poor setup (centring and levelling) of the base station can lead to poor quality data capture output from the rover as coordinates obtained by the rover are referenced to the base station. Post-processing can help improve the positioning solution by setting precise ephemeris, ionospheric model, tropospheric model, and cut-off angle parameters etc.!!The acquisition of Google Earth imagery should be assumed to be of high quality as it is presented by a professional organisation but there is always the possibility that it may not be. Error is most likely in the georeferencing stage where the accuracy is dependent on operator competency when selecting control points. Image resolution can also impact accuracy at this stage as control point selection on a low resolution image can be much more difficult than on a high resolution image.!!Error may exist in the Photogrammetric SOCET data and Orthophotos if not properly accounted for and removed. For example; the effect of tilt, relief distortion, sun angle and topography, and atmospheric conditions can introduce error into the dataset (Lillesand et al., 2008). The orthophotos were black & white making digitising difficult when trying to locate the vegetation edge.!!This project assumes that more recent data collection and mapping techniques have produced more correct and accurate maps.
0806514� | �5 22MLC - DORNOCH POINT
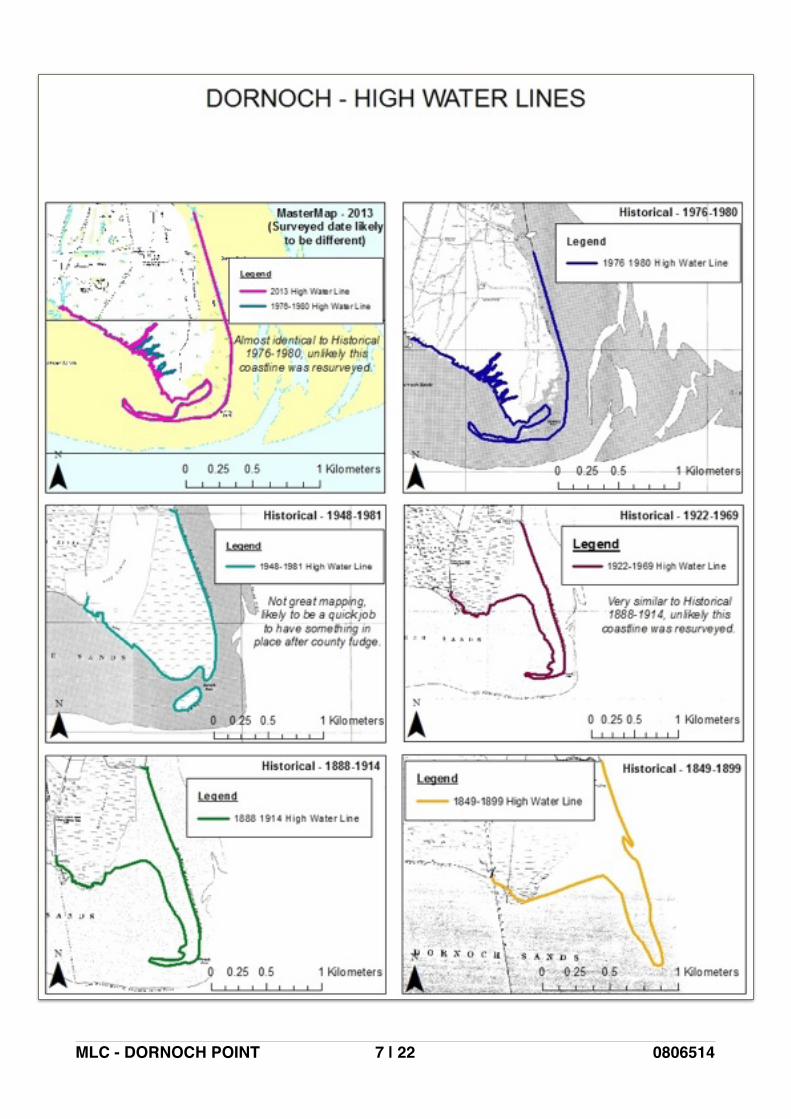
1! HIGH WATER LINES!!!DATA SOURCES: OS Historical Maps and Current OS MasterMap!!!DIGITISING:!The current MasterMap, dated June 2013, was imported into ArcMap and the high water line was digitised on top of the mapped HWL. Historical National Grid and 1:10560 Ross and Sutherland County Series Sheet maps of the Dornoch Point were selected and downloaded from the EDINA Digimap online resource, found at: http://digimap.edina.ac.uk/webhelp/resources/ !!High water lines were digitised on top of the historical maps for each available time-frame and compared on one ArcMap layout using several data frames.!!!ANALYSIS:!From the layout below it is clear that the mean high water lines have changed significantly over time. The HWL from historical map 1849-1899 is straight but appears to curve at the tip over time. This looks to be due to deposition at the tip in the westwards direction. The curve is visible in the 1888-1914 and 1922-1969 historical maps. It is difficult to be certain that this was a change or if the 1849-1899 mapping required only a rough outline of the coastline that was then corrected by the 1922-1969 mapping.!!It appears that over time the beach to the west has filled in to form a large headland consisting of dune and beach which is visible on the 1976-1980 historical map and 2013 MasterMap. As the HWL on the current (2013) MasterMap seems to match the 1976-1980 historical map it is likely that 1976-1980 was the last time the coastline was surveyed by the Ordnance Survey. The digitised HWLs are visible on the layout overleaf.
0806514� | �6 22MLC - DORNOCH POINT
!
0806514� | �7 22MLC - DORNOCH POINT
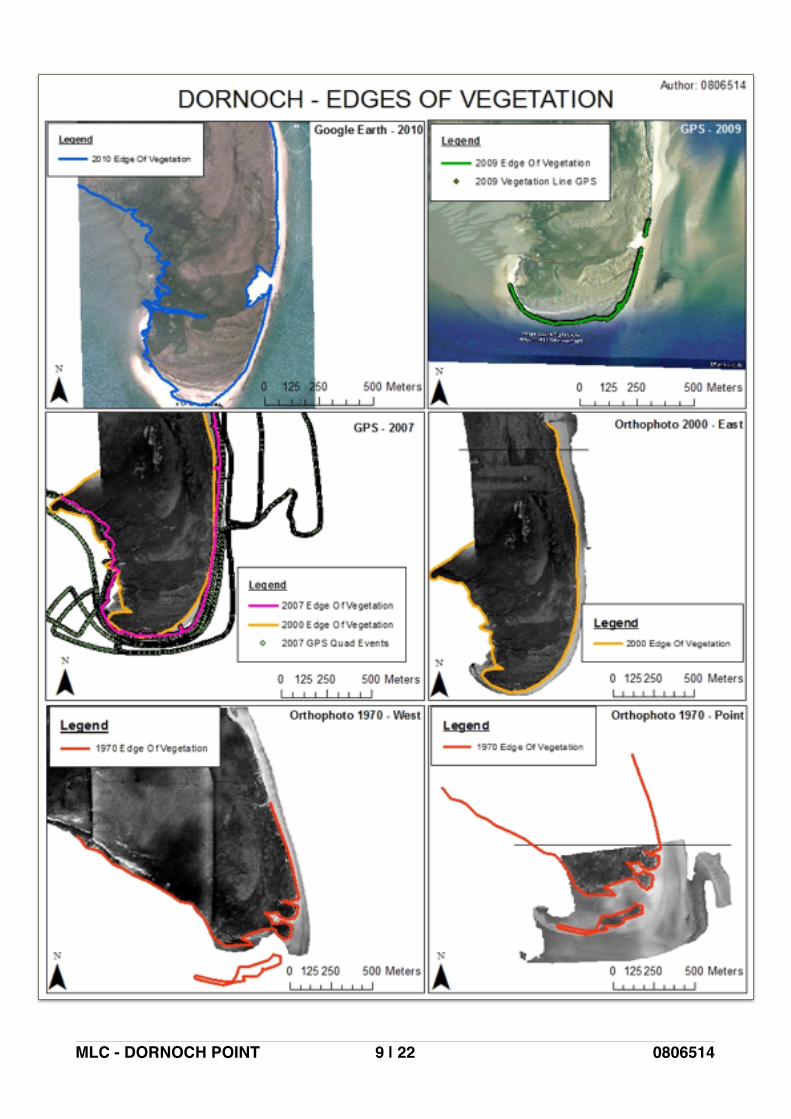
2! EDGES OF VEGETATION!!!DATA SOURCES: Orthophotos, Google Images, GNSS Point Data!!!DIGITISING:!Edges of vegetation were digitised in Esri ArcMap as polyline datasets along the line that the dune met the beach, the crest of the sand dune. This was done for 1970, 2000, 2007, 2009 and 2010. Edges of vegetation are compared on one ArcMap layout overleaf using several data frames. Data source is noted at the top-right of each data frame.!!!• Two orthophotos for 1970, one for the West and one for the Point, were imported into ArcMap.
The edge of vegetation was digitised onto the West orthophoto first to outline the larger covered area and then the outlying section of vegetation on the southern-facing beach was digitised from the Point orthophoto. This is shown as two separate data frames at the bottom left and right of the ArcMap layout below.!!
• The 2000 orthophoto was brought into ArcMap and the edge of vegetation was digitised using similar extents as the 1970 orthophotos to aid comparison.!!
• The 2007 GNSS point data was added into ArcMap using the ‘Add XY data’ function. The upper limit of the data was used as the edge of vegetation and digitised to similar extents as the 1970 and 2000 orthophotos. As there was not an available 2007 base map the 2000 orthophoto is shown in the ArcMap layout below. This was done to give visual context and compare with the 2000 orthophoto edge of vegetation to show the change in vegetation line over the 2000-2007 time period.!!
• The 2009 GNSS point data was gathered by walking along the intertidal area with some data coded as the edge of vegetation. This edge of vegetation data was added into ArcMap as a separate layer using the ‘Add XY data’ function. This was digitised as the edge of vegetation for 2009. This was a smaller dataset than the others so was not comparable to the same extents.!!
• The 2010 edge of vegetation was obtained using Google Earth imagery for Dornoch Point. Tilt was removed from the photograph and the image was georeferenced to the OS MasterMap using a minimum of 4 control points with residuals ±5 from zero. Most control points were much closer to zero.!!!!
0806514� | �8 22MLC - DORNOCH POINT
0806514� | �9 22MLC - DORNOCH POINT
ANALYSIS:!!It appears that between 1970 and 2010 Dornoch Point has extended further southwards as more sediment has been deposited on the Eastern and Southern beaches. The dune has stabilised these areas of additional beach as shown by the migration of the edge of vegetation Southwards over time.!!The orthophotos for 1970 show Dornoch Point to consist of a large dune with an outlying section of vegetation separated by beach. Between 1970 and 2000 the dune expanded southwards. Between 2000 and 2007 the dune continued to expand southwards and eastwards but retracted on the western side.!!Between 2007 and 2009 the edge of vegetation moved southwards as more sediment was deposited on the tip of the Point and the dune claimed more of the beach.!!It appears on the 2009 Google imagery that the Eastern beach suffered erosion near the tip (in the are near the gap between the GNSS data).!!In the 2010 Google imagery this section appears to have eroded further into the dune. However, between 2009 and 2010 additional sediment seems to have been deposited on the tip of the Point as the edge of vegetation has extended further southwards in 2010.!!
0806514� | �10 22MLC - DORNOCH POINT
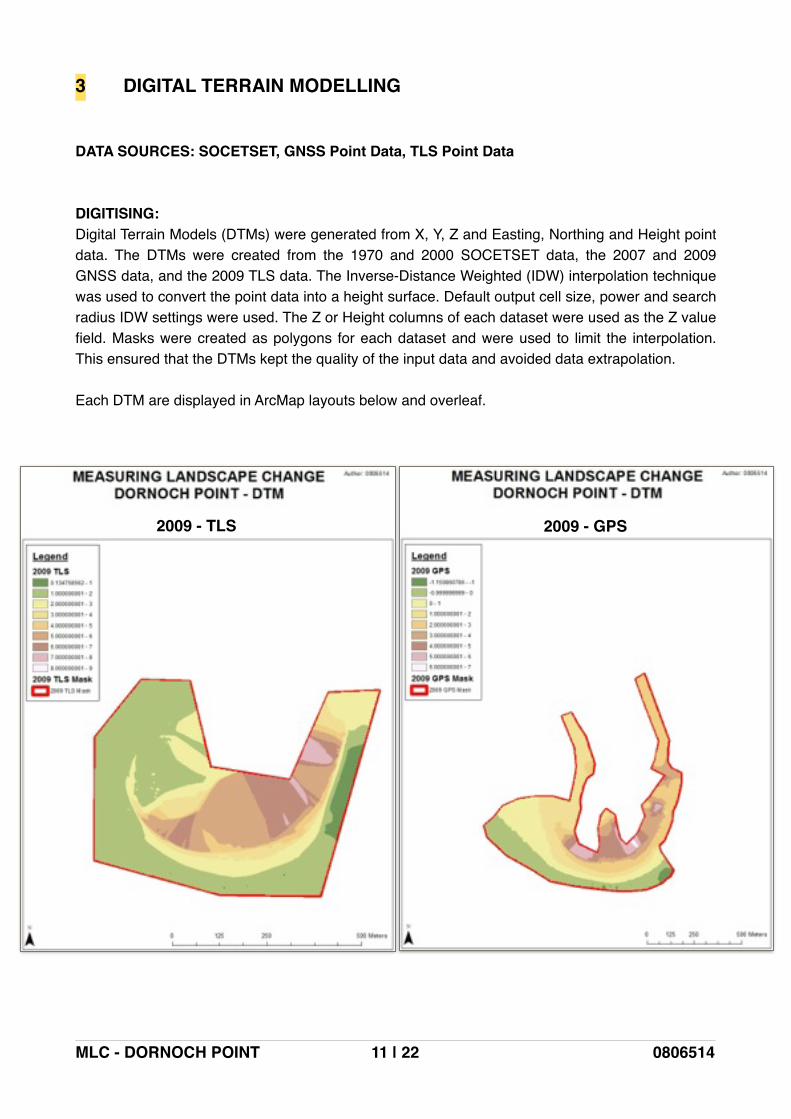
3! DIGITAL TERRAIN MODELLING!!!DATA SOURCES: SOCETSET, GNSS Point Data, TLS Point Data!!!DIGITISING:!Digital Terrain Models (DTMs) were generated from X, Y, Z and Easting, Northing and Height point data. The DTMs were created from the 1970 and 2000 SOCETSET data, the 2007 and 2009 GNSS data, and the 2009 TLS data. The Inverse-Distance Weighted (IDW) interpolation technique was used to convert the point data into a height surface. Default output cell size, power and search radius IDW settings were used. The Z or Height columns of each dataset were used as the Z value field. Masks were created as polygons for each dataset and were used to limit the interpolation. This ensured that the DTMs kept the quality of the input data and avoided data extrapolation.!!Each DTM are displayed in ArcMap layouts below and overleaf.!
0806514� | �11 22MLC - DORNOCH POINT
2009 - TLS 2009 - GPS
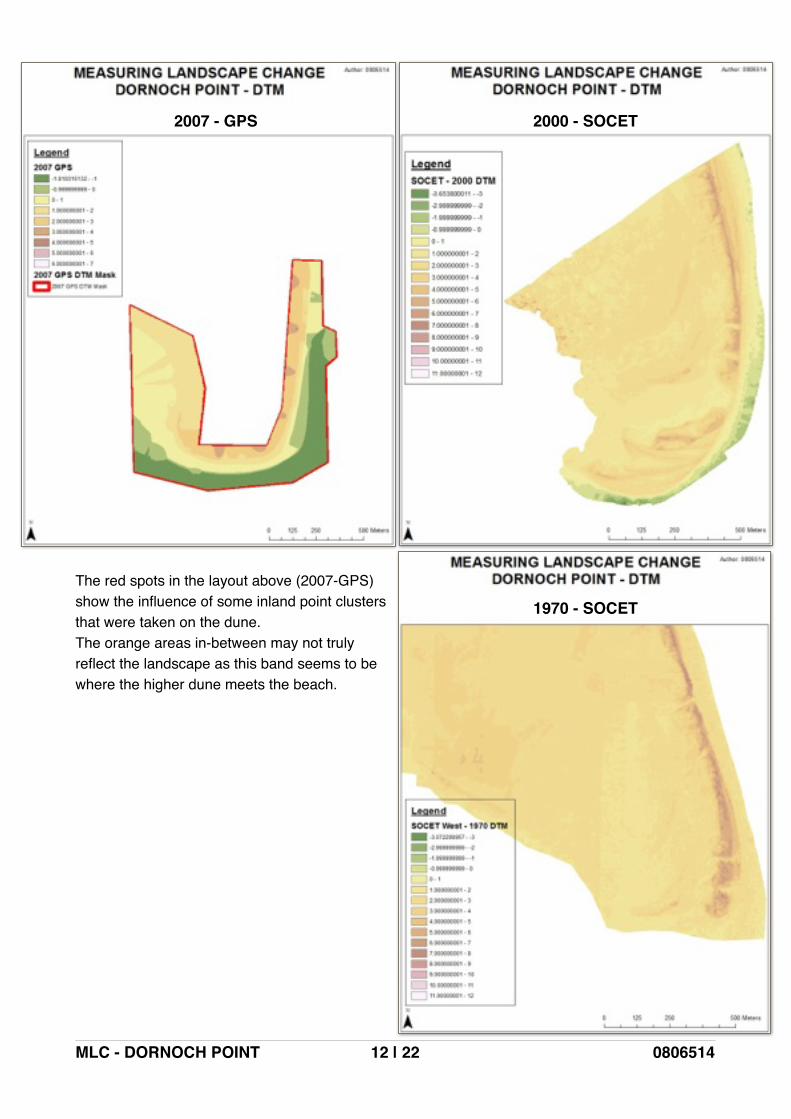
!!!!!!!!!!!!!!!!!!!!!!!!The red spots in the layout above (2007-GPS)!show the influence of some inland point clusters!that were taken on the dune.!The orange areas in-between may not truly!reflect the landscape as this band seems to be!where the higher dune meets the beach.
0806514� | �12 22MLC - DORNOCH POINT
2007 - GPS 2000 - SOCET
1970 - SOCET
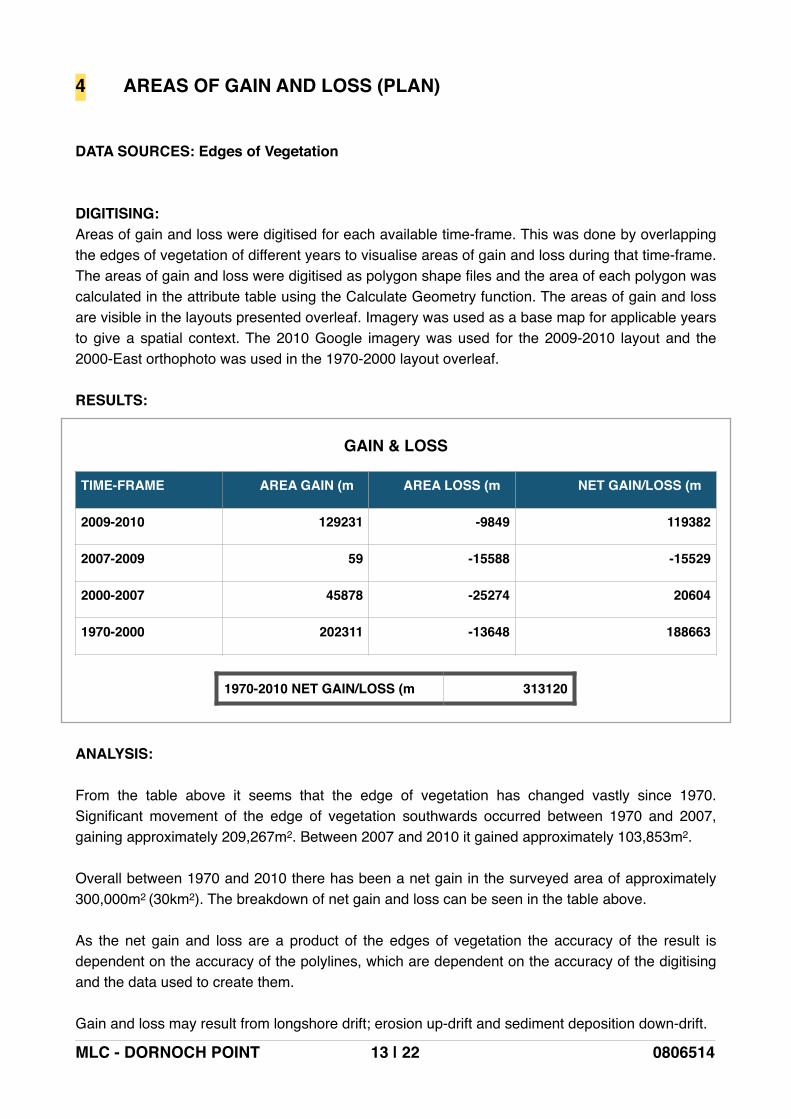
4! AREAS OF GAIN AND LOSS (PLAN)!!!DATA SOURCES: Edges of Vegetation!!!DIGITISING:!Areas of gain and loss were digitised for each available time-frame. This was done by overlapping the edges of vegetation of different years to visualise areas of gain and loss during that time-frame. The areas of gain and loss were digitised as polygon shape files and the area of each polygon was calculated in the attribute table using the Calculate Geometry function. The areas of gain and loss are visible in the layouts presented overleaf. Imagery was used as a base map for applicable years to give a spatial context. The 2010 Google imagery was used for the 2009-2010 layout and the 2000-East orthophoto was used in the 1970-2000 layout overleaf.!!RESULTS:!!!!!!!!!!!!
!ANALYSIS:!!From the table above it seems that the edge of vegetation has changed vastly since 1970. Significant movement of the edge of vegetation southwards occurred between 1970 and 2007, gaining approximately 209,267m2. Between 2007 and 2010 it gained approximately 103,853m2.!!Overall between 1970 and 2010 there has been a net gain in the surveyed area of approximately 300,000m2 (30km2). The breakdown of net gain and loss can be seen in the table above.!!As the net gain and loss are a product of the edges of vegetation the accuracy of the result is dependent on the accuracy of the polylines, which are dependent on the accuracy of the digitising and the data used to create them.!!Gain and loss may result from longshore drift; erosion up-drift and sediment deposition down-drift.
0806514� | �13 22MLC - DORNOCH POINT
GAIN & LOSS
TIME-FRAME AREA GAIN (m AREA LOSS (m NET GAIN/LOSS (m
2009-2010 129231 -9849 119382
2007-2009 59 -15588 -15529
2000-2007 45878 -25274 20604
1970-2000 202311 -13648 188663
1970-2010 NET GAIN/LOSS (m 313120
0806514� | �14 22MLC - DORNOCH POINT
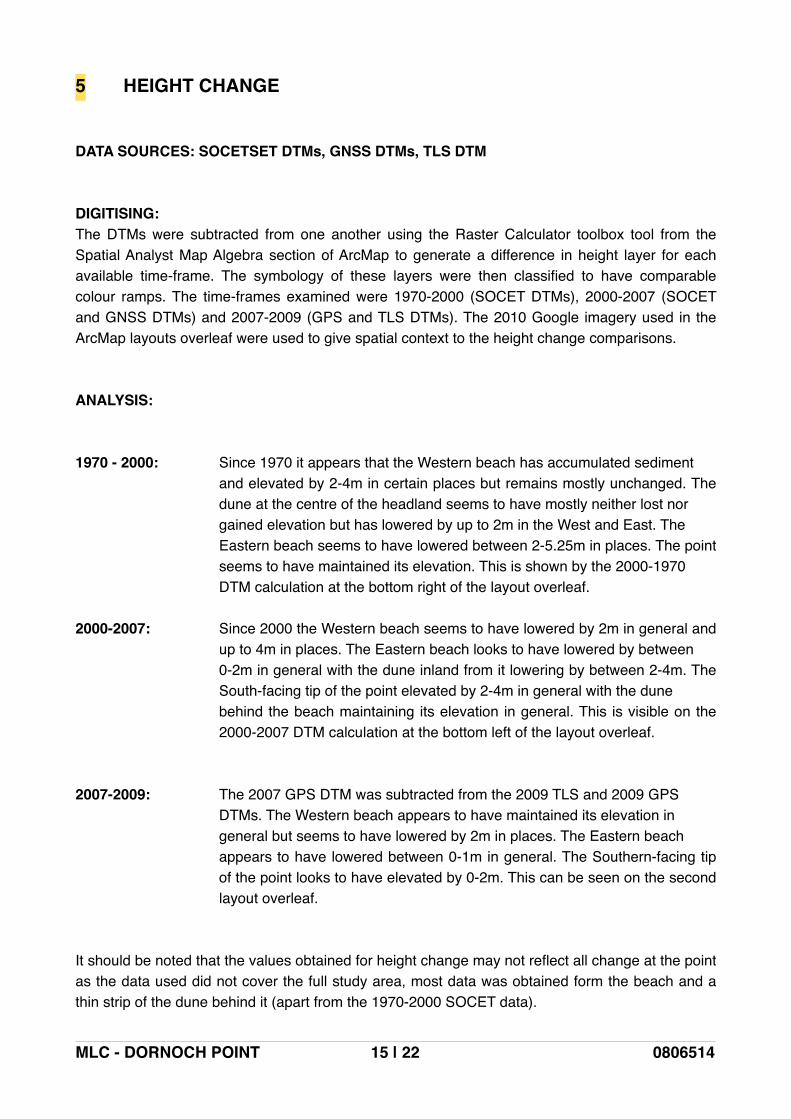
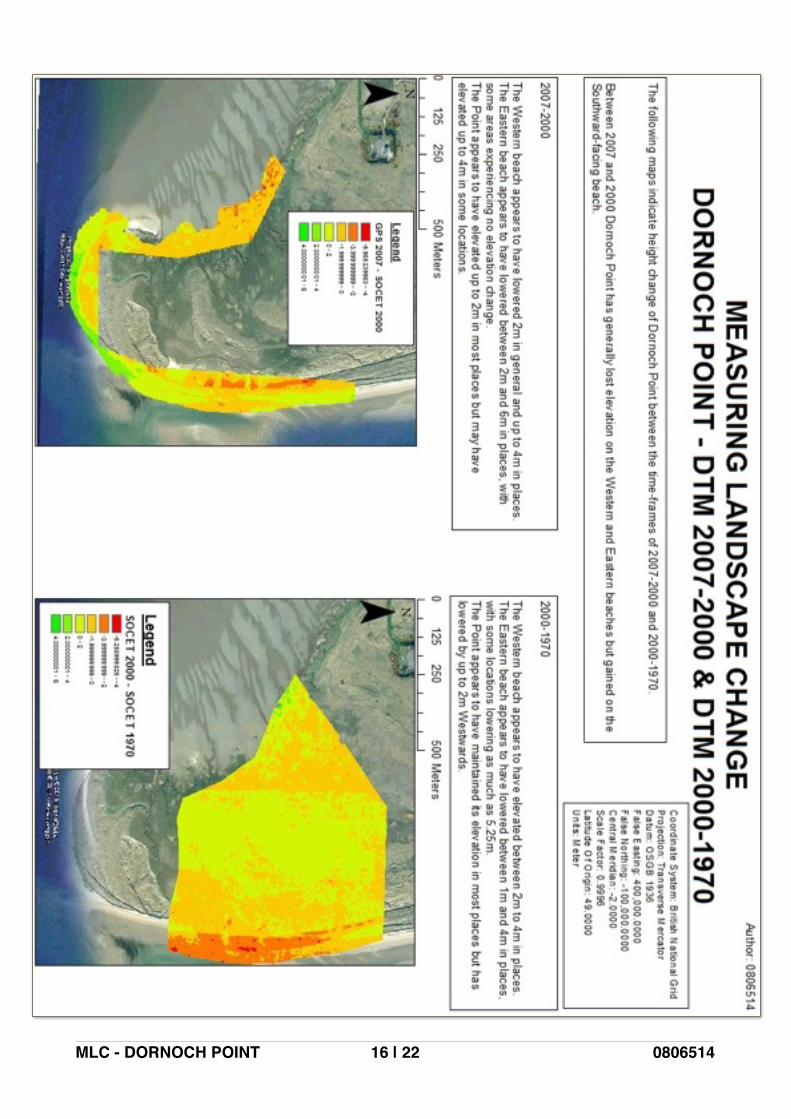
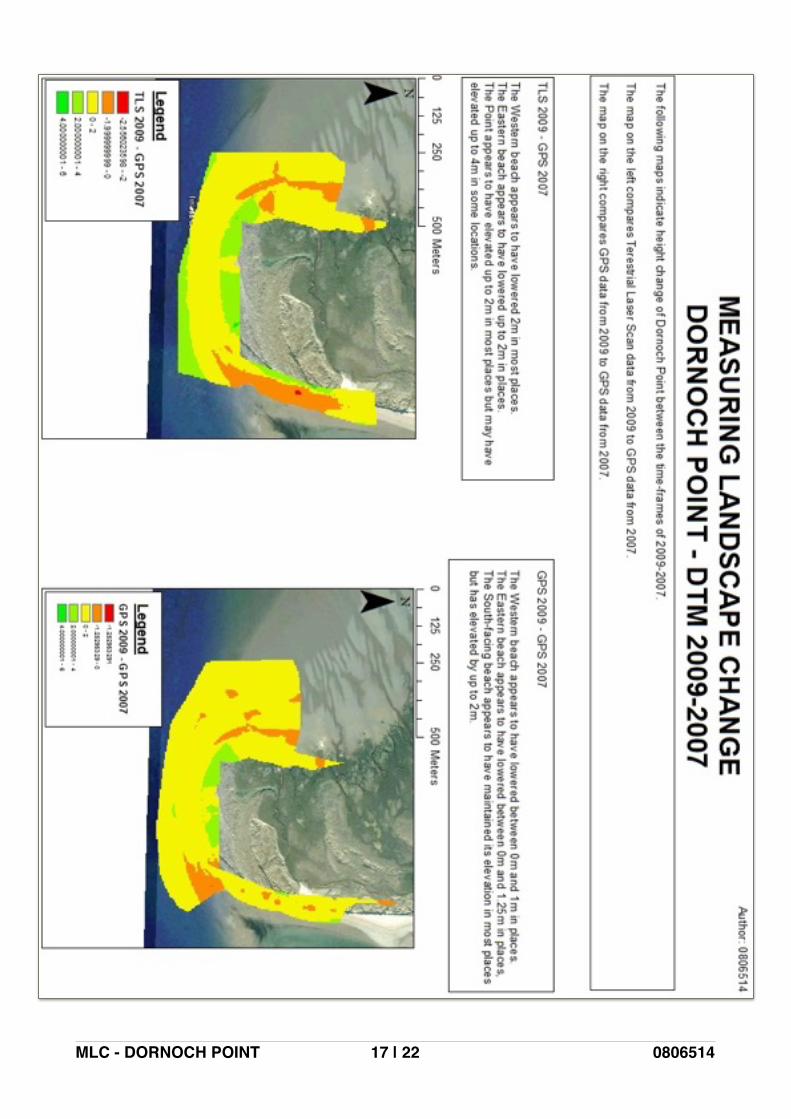
5! HEIGHT CHANGE!!!DATA SOURCES: SOCETSET DTMs, GNSS DTMs, TLS DTM!!!DIGITISING:!The DTMs were subtracted from one another using the Raster Calculator toolbox tool from the Spatial Analyst Map Algebra section of ArcMap to generate a difference in height layer for each available time-frame. The symbology of these layers were then classified to have comparable colour ramps. The time-frames examined were 1970-2000 (SOCET DTMs), 2000-2007 (SOCET and GNSS DTMs) and 2007-2009 (GPS and TLS DTMs). The 2010 Google imagery used in the ArcMap layouts overleaf were used to give spatial context to the height change comparisons.!!!ANALYSIS:!!!1970 - 2000:! ! Since 1970 it appears that the Western beach has accumulated sediment !! ! ! and elevated by 2-4m in certain places but remains mostly unchanged. The ! ! ! dune at the centre of the headland seems to have mostly neither lost nor !! ! ! gained elevation but has lowered by up to 2m in the West and East. The !! ! ! Eastern beach seems to have lowered between 2-5.25m in places. The point ! ! ! seems to have maintained its elevation. This is shown by the 2000-1970 !! ! ! DTM calculation at the bottom right of the layout overleaf.!!2000-2007:! ! Since 2000 the Western beach seems to have lowered by 2m in general and ! ! ! up to 4m in places. The Eastern beach looks to have lowered by between !! ! ! 0-2m in general with the dune inland from it lowering by between 2-4m. The ! ! ! South-facing tip of the point elevated by 2-4m in general with the dune !! ! ! behind the beach maintaining its elevation in general. This is visible on the ! ! ! 2000-2007 DTM calculation at the bottom left of the layout overleaf.!!!2007-2009:! ! The 2007 GPS DTM was subtracted from the 2009 TLS and 2009 GPS !! ! ! DTMs. The Western beach appears to have maintained its elevation in !! ! ! general but seems to have lowered by 2m in places. The Eastern beach !! ! ! appears to have lowered between 0-1m in general. The Southern-facing tip ! ! ! of the point looks to have elevated by 0-2m. This can be seen on the second ! ! ! layout overleaf.!!!It should be noted that the values obtained for height change may not reflect all change at the point as the data used did not cover the full study area, most data was obtained form the beach and a thin strip of the dune behind it (apart from the 1970-2000 SOCET data).
0806514� | �15 22MLC - DORNOCH POINT
0806514� | �16 22MLC - DORNOCH POINT
0806514� | �17 22MLC - DORNOCH POINT
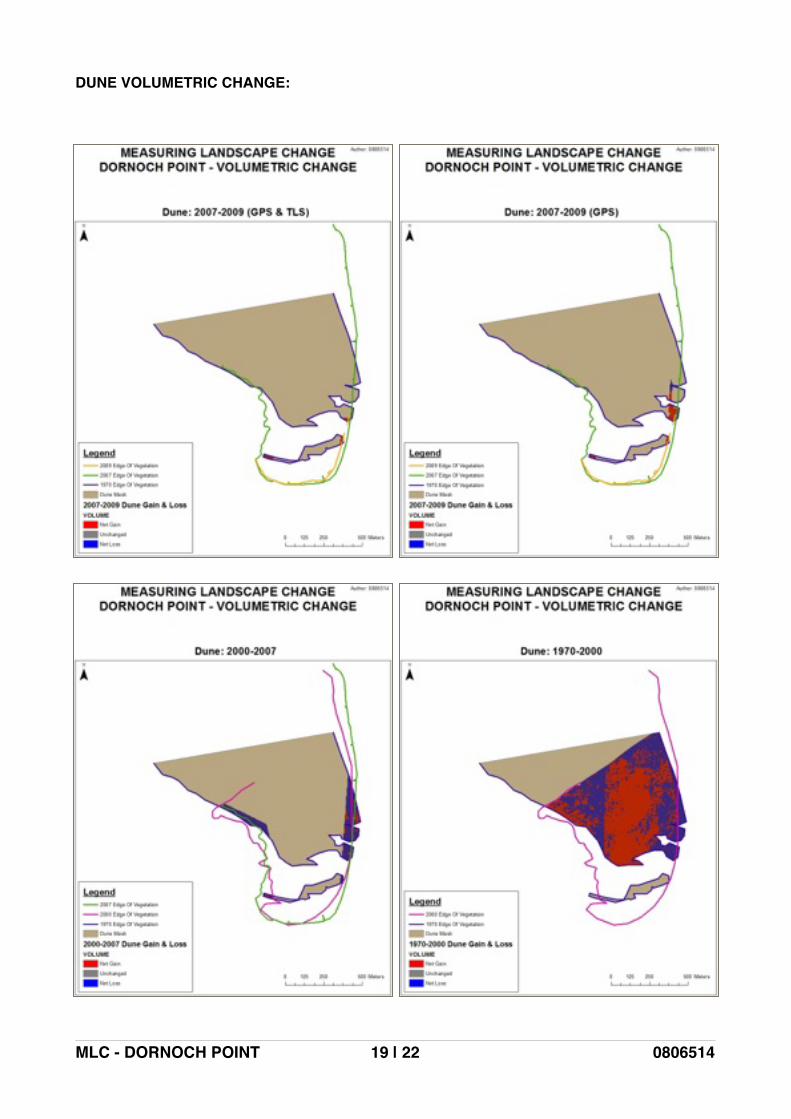
6! VOLUME CHANGE!!DATA SOURCES: Edges of Vegetation, DTMs!!!DIGITISING: !Masks were created for the beach and dune areas of overlap for the available time-frames. The Cut/Fill tool was used with beach and dune masks to calculate the volume change between time-frames. In the legend, gain was displayed in red and loss was displayed in blue, unchanged is shown as grey. However, when investigated in the attribute table it appeared that gain in volume is actually displayed by blue and loss in red, unchanged is still grey. This may be due to a bug in ArcMap.!!The mask polygon for dune was created from the interior of the 1970 edge of vegetation and the mask polygon for beach was created from the 1970 edge of vegetation to the edge of the DTMs. This was done to show the volume change of beach and dune from the 1970 baseline. Cut and fill was carried out on each time frame; 1970-2000, 2000-2007, 2007-2009 (GPS-GPS) and 2007-2009 (GPS-TLS).!!!ANALYSIS:!!DUNE:!!The Dune layout overleaf shows the areas of gain and loss for the dunes. The dune mask was used to limit the gain and loss calculation to the dune area, using 1970 as the baseline.!!!!!!!!!!As shown in the table above it appears that the dunes have lost approximately 82,500m3 between 1970 and 2007. Between 2007 and 2009 the dunes gained between 3,000m3 and 6,500m3. The different data collection methods used between 2007 and 2009 have resulted in a vastly different net gain/loss, this is most likely due to the different accuracies of the methods used and the different data coverages. As TLS is more accurate than GPS the value of 3,167m3 may be closer to the true value of net gain/loss for 2007-2009.!!Between 1970 and 2009 the dune lost an estimated total of between 76,000m3 and 79,000m3.
0806514� | �18 22MLC - DORNOCH POINT
Time-Frame Data Type Location Volume Gained (m Volume Lost (m Net Gain/Lost (m
2009-2007 TLS & GPS DUNE 3180 13 3167
2009-2007 GPS DUNE 7275 613 6662
2007-2000 GPS & SOCET DUNE 2165 61015 -58850
2000-1970 SOCET DUNE 89464 113029 -23565
DUNE VOLUMETRIC CHANGE:!!!
0806514� | �19 22MLC - DORNOCH POINT
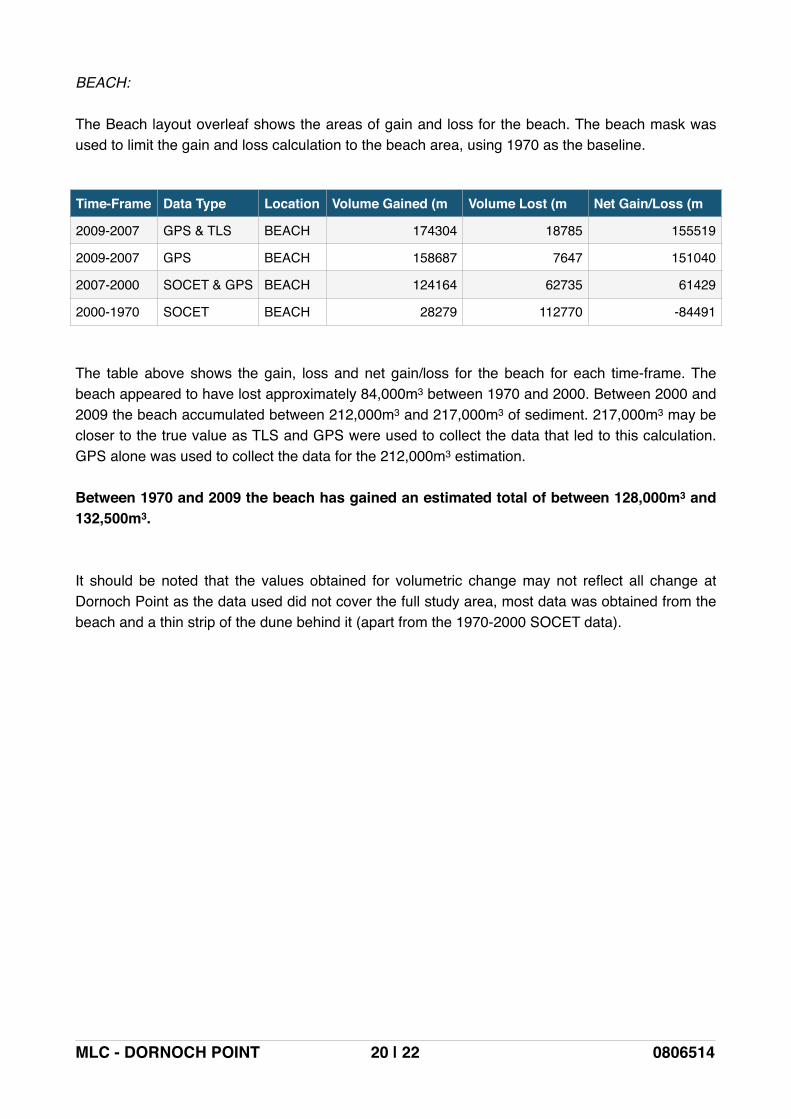
BEACH:!!The Beach layout overleaf shows the areas of gain and loss for the beach. The beach mask was used to limit the gain and loss calculation to the beach area, using 1970 as the baseline.!!!!!!!!!!!The table above shows the gain, loss and net gain/loss for the beach for each time-frame. The beach appeared to have lost approximately 84,000m3 between 1970 and 2000. Between 2000 and 2009 the beach accumulated between 212,000m3 and 217,000m3 of sediment. 217,000m3 may be closer to the true value as TLS and GPS were used to collect the data that led to this calculation. GPS alone was used to collect the data for the 212,000m3 estimation.!!Between 1970 and 2009 the beach has gained an estimated total of between 128,000m3 and 132,500m3.!!!It should be noted that the values obtained for volumetric change may not reflect all change at Dornoch Point as the data used did not cover the full study area, most data was obtained from the beach and a thin strip of the dune behind it (apart from the 1970-2000 SOCET data).
0806514� | �20 22MLC - DORNOCH POINT
Time-Frame Data Type Location Volume Gained (m Volume Lost (m Net Gain/Loss (m
2009-2007 GPS & TLS BEACH 174304 18785 155519
2009-2007 GPS BEACH 158687 7647 151040
2007-2000 SOCET & GPS BEACH 124164 62735 61429
2000-1970 SOCET BEACH 28279 112770 -84491
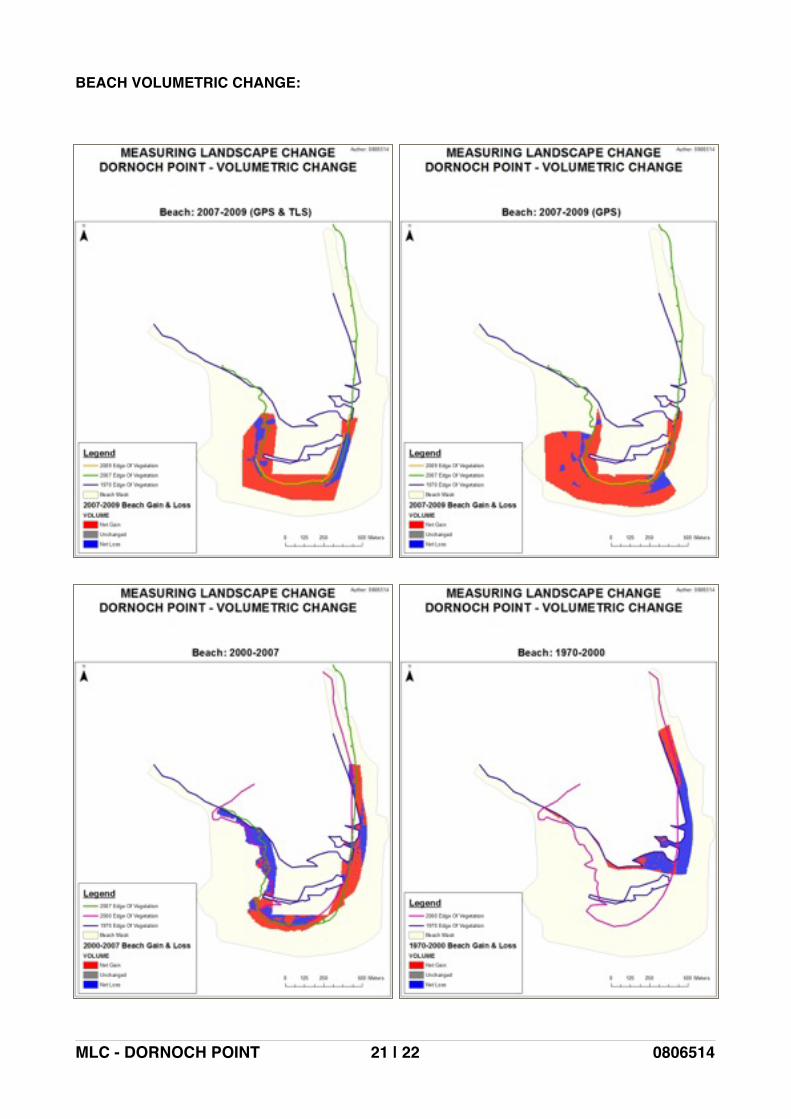
BEACH VOLUMETRIC CHANGE:!!!!
0806514� | �21 22MLC - DORNOCH POINT

! PROJECT ISSUES AND LIMITATIONS!!• Software:! ArcGIS 10.1 (ArcMap 10.1 & ArcCatalog 10.1)!
- Software issues included ArcMap frequently crashing and shutting down without warning involving data loss. Frequent saving of the document was used to minimise the affect. Having to re-load and re-do any changes to the document was inconvenient, frustrating and hindered progress.!!
• The vast amount of data created an organisational challenge that was overcome by ordering and grouping layers within ArcMap to keep the data manageable. Keeping a full data list also helped to keep track of the data and the dates of each dataset.!!
• The lack of overlapping data in places made it difficult to carry out full comparisons between different years. This may have been due to the size of the area and focus of the data collection, for example there was more data for the beach areas than the dune for most years apart from the 1970-2000 SOCET data that covered a much larger area. Also, it may not have been viable to survey the landscape every few years and in this time the area may have changed a vast amount that prevented overlap of data.!!
• It is possible that the survey and mapping technology, equipment, techniques, and survey standards of the time for historic mapping may not have produced a product that would be seen as acceptable by todays standards.!!
• The quality of the georeferencing and digitising may be influenced by a range of factors including image resolution, control point identification and image colour. For example, black and white photography made identifying the edge of vegetation difficult because the sand of the beach can blend into the sand and vegetation of the dune area. Also, the dune area may be perceived as different from the vegetated area. For this project vegetated areas and dune were both classed as dune, with predominantly sandy areas as beach.
0806514� | �22 22MLC - DORNOCH POINT