Embed Size (px)
Citation preview

Blandy Experimental Farm Education Programs Boyce Va 540-837-1758 www.virginia.edu/blandy Copyright 2016
Page | 1
Mapping Migration
Investigative Question: What species of bird migrate? How far and through what geographic areas and features do bird migrate?
Goal: Understand that a wide variety of birds migrate and migration routes differ among species. Determine the differences between and among bird species route distances.
Objectives
Knowledge: Students learn that many types of birds migrate to a variety of places depending on adaptations and needs. Students will examine migratory routes of a specific species on a map of North and South America.
Skills: Students use non‐standard and standard forms of measurement to calculate a migration route on the map to the nearest foot, yard, and meter. Students will use math skills to find equivalent periods of time for migration. (Hours into days; days into months).
Values: Students develop an appreciation for the bird migration and the difficulty of migrating.
Virginia SOL: Math (2016) 3.1, 3.4, 3.7, 4.1, 4.4, 4.8, 5.4, 5.8, 5.17, 6.2, 6.8, 6.11
Science (2018)- 3.4, 3.5, 3.8, 4.2, 4.3, 4.8, 4.5, 6.7, 6.8, 6.9
Social Studies- USI.1g, WG.1a, US1,2a, VS.2a, VS.2c, USI. 2c, USII.2c, US1.2b, WG.4
Materials:
‐ Migration game (Signs, dice, cups, arm bands, tape, clip boards, pencils, migratory bird information sheet, &
Mapping Migration bird data sheets) ‐ Wet erase markers and wet wipes ‐ Colored string (5 different colors, one for each bird route in varying sizes) ‐ Measuring devices (meter tape, meter stick and rulers) ‐ Large Maps (shower curtain world maps) ‐ Conversion sheet
Instructional Strategy:
1. Students will participate in the migration game (Flying Wild activity) as 5 different migratory birds.Once they have done this, each group completed data sheet .
2. After all students have experienced one round of a bird migration and discussed their migrationjourney, students examine the large world maps. Ask students: What is this a map of? What do yousee on the map? Is this map missing anything? (Title, Legend, Equator, Compass Rose)
3. Instruct students to find their bird’s migratory path on the large map. Each bird has a correspondingcolor. These colors are found on their bird species information sheets.

Blandy Experimental Farm Education Programs Boyce Va 540-837-1758 www.virginia.edu/blandy Copyright 2016
Page | 2
4. Students estimate the distance of their bird’s migratory route using context clues.(This can be doneby using the map scale option 2: estimating the distance from east coast to west coast in miles ‐‐‐hint‐ the conversion sheet helps with estimation.)
5. Ask students: how can you determine the distance of the migration route? Ask: If you did not haveany measurement devices (ruler) available, what are other ways you can measure? (Instruct studentsto consider various was to solve this problem and to explain their reasoning. This is an investigation:there is no one correct way).
6. Once the migration distances are determined, provide each group with a datasheet to explore thelandscape and geographic areas the birds flew over. Ask: Carefully examine your bird’s path ofmigration. What terrain did the bird either pass over or stop in? Encourage students to extrapolatethe potential hazards the birds faced related to the landscape. Such as mountains, rain, pollutionfrom a water body (near a city), lack of food. Etc.
7. Conclusion: Once the groups have completed their data sheet, ask each group to share their birdspecies and one interesting fact they learned about the migration of their bird species.
Possible Extensions-
1. Place the string over their bird’s migratory path on the large laminated map. **Students or teachersmay have to select one path to examine due to some birds having multiple paths**Have them look atthe scale provided on the map (1 in: 205 miles) and determine the approximate distance of theirmigratory route.(1 inch on the map = 205 miles (1:205). If the measurement of the route is 4 inches then the distance ofmigratory route is 820 miles)• 4 multiplied by 205, or four groups of 205. You can also ask students to estimate (ex.
Round 205 to 200.)2. Students use rulers to calculate the distance (to the nearest inch, inch, foot, yard, centimeter, and
meter) traveled using the scale on the map.a. As time allows, students can convert the final measurement from U.S Customary to metric
system.3. Ask students which form of measurement was easier (the string estimate or ruler measurement)?
Which form of measurement was more accurate?• With the information given on each of the bird information sheets, students can convert their
bird’s total length of migration into equivalent time periods: days, months, hours if possible (ex.15 days= ½ month, 2 months = 60 days). This may be total migration or a portion of their bird’smigratory route
4. Overlay the longitude and latitude lines on your larger map. Students can identify coordinates alongthe bird’s route.
5. Students analyze and compare the migratory patterns and distances of each species of birda. What is the sum of all of the distances combined? Estimate the sum of all migratory distances
of the same species.

Blandy Experimental Farm Education Programs Boyce Va 540-837-1758 www.virginia.edu/blandy Copyright 2016
Page | 3
Tracking information can be found at The Center for Conservation Biology http://www.ccbbirds.org/what‐we‐do/research/bird‐migration/
6.
7.
Have students research what birds need in a migration flyway (flight used in bird migration) (what type of habitat)? Students examine the migration route and make a predictions as to why they stopped at specific locations. Research different areas of the migration route. Students can then make a prediction as to where the bird may fly next.
8. Students create a large number line/migration line down a hallway at school. Online resources areavailable to track a current bird’s migration by The Center for Conservation of Biology and Wildlifetracking. http://www.ccbbirds.org/what‐we‐do/research/bird‐migration/a. Options include: How far does a bird travel in a day and move a bird along a migration line.
Compare the findings to how far you would travel on a family vacation. Remember to factor inmileage, hours of driving, cost of gas, etc.
9. Determine the scales of various maps and/or globes when the scale is not provided.a. This can be done by determining a distance from one place to another, then dividing by the
length on the mapi. Example: length of east coast to west coast in miles approximately 2514 miles. Divide by
measuring east to west coast with a ruler ‐‐ 12 inches. 2514/12 = 210.1. 1 inch on our map is equal to 205 miles. This is written as 1:210
b. How long would your bird take to fly halfway around the world?c. What is the perimeter and area of the Globe?
10. Overlay the longitude and latitude lines on your larger map. Have students identify coordinates alongthe bird’s route.
11. Researching weather data (fronts, maps) and correlate this data to a specific bird migration route.a. Analyzing multiple years of migration data. How do temperature, fronts, systems and humidity
affect a birds flight?http://www.hpc.ncep.noaa.gov/dailywxmap/index_20140102.html
12. Compare historical data of wetlands, estuaries and river systems to current stopover sites.
Engineering and Technology
Have students use technology to research satellite transmitters and their specific use of tracking. Useengineering design principles to build/design a transmitter model. In what ways can the originaltransmitters be improved?
Higher Level Thinking Extension/ Abstract thinking
Have students compare their bird migratory path with a globe. How does the path change based off ofthe Earth’s structure? Does a bird fly in a straight line? How do birds compare to airplanes?
Blandy Experimental Farm Education Programs Boyce Va 540-837-1758 www.virginia.edu/blandy Copyright 2016
Page | 4
Teacher Background Information
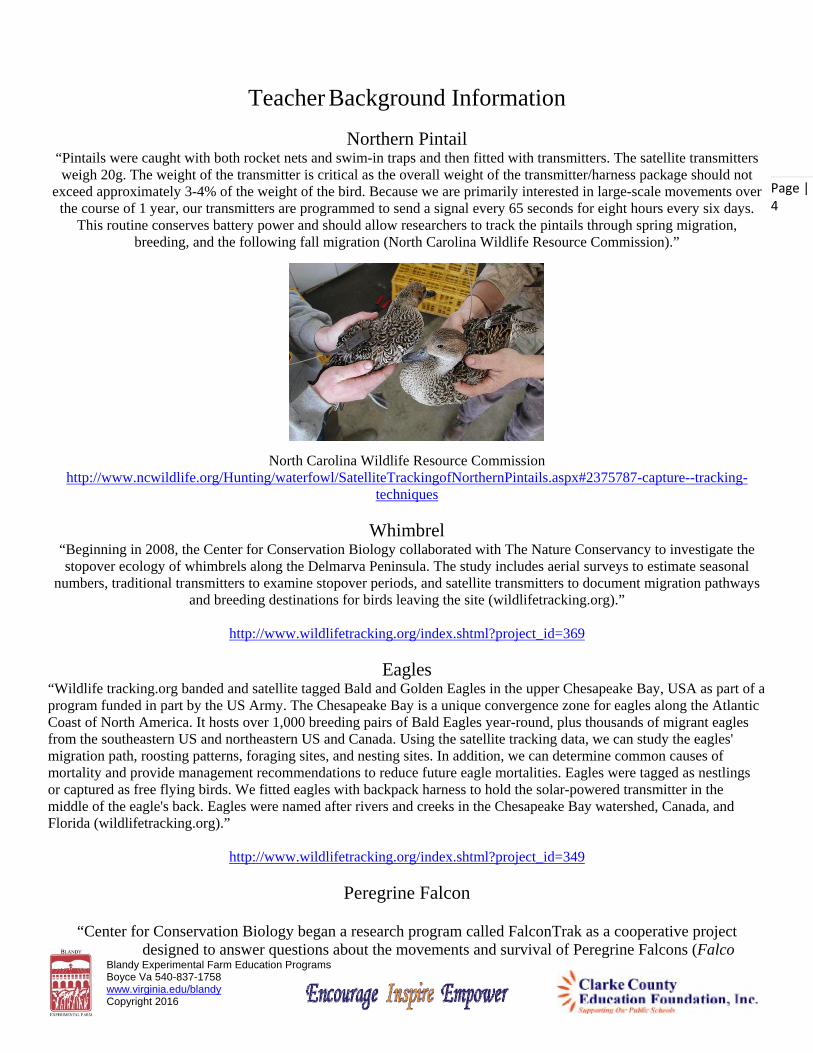
Northern Pintail “Pintails were caught with both rocket nets and swim-in traps and then fitted with transmitters. The satellite transmitters weigh 20g. The weight of the transmitter is critical as the overall weight of the transmitter/harness package should not
exceed approximately 3-4% of the weight of the bird. Because we are primarily interested in large-scale movements over the course of 1 year, our transmitters are programmed to send a signal every 65 seconds for eight hours every six days.
This routine conserves battery power and should allow researchers to track the pintails through spring migration, breeding, and the following fall migration (North Carolina Wildlife Resource Commission).”
North Carolina Wildlife Resource Commission http://www.ncwildlife.org/Hunting/waterfowl/SatelliteTrackingofNorthernPintails.aspx#2375787-capture--tracking-
techniques
Whimbrel “Beginning in 2008, the Center for Conservation Biology collaborated with The Nature Conservancy to investigate the stopover ecology of whimbrels along the Delmarva Peninsula. The study includes aerial surveys to estimate seasonal
numbers, traditional transmitters to examine stopover periods, and satellite transmitters to document migration pathways and breeding destinations for birds leaving the site (wildlifetracking.org).”
http://www.wildlifetracking.org/index.shtml?project_id=369
Eagles “Wildlife tracking.org banded and satellite tagged Bald and Golden Eagles in the upper Chesapeake Bay, USA as part of a program funded in part by the US Army. The Chesapeake Bay is a unique convergence zone for eagles along the Atlantic Coast of North America. It hosts over 1,000 breeding pairs of Bald Eagles year-round, plus thousands of migrant eagles from the southeastern US and northeastern US and Canada. Using the satellite tracking data, we can study the eagles' migration path, roosting patterns, foraging sites, and nesting sites. In addition, we can determine common causes of mortality and provide management recommendations to reduce future eagle mortalities. Eagles were tagged as nestlings or captured as free flying birds. We fitted eagles with backpack harness to hold the solar-powered transmitter in the middle of the eagle's back. Eagles were named after rivers and creeks in the Chesapeake Bay watershed, Canada, and Florida (wildlifetracking.org).”
http://www.wildlifetracking.org/index.shtml?project_id=349
Peregrine Falcon
“Center for Conservation Biology began a research program called FalconTrak as a cooperative project designed to answer questions about the movements and survival of Peregrine Falcons (Falco

Blandy Experimental Farm Education Programs Boyce Va 540-837-1758 www.virginia.edu/blandy Copyright 2016
Page | 5
peregrinus) within the mid-Atlantic region of North America. Sixty-one falcons were tracked between 2001 and 2012 with solar-powered, satellite transmitters to investigate the spatial dynamics of their annual cycle and to
identify causes of mortality (The Center for Conservation Biology).”
http://www.ccbbirds.org/what-we-do/research/tracking/
Northern Harrier Avian Research and Conservation Institute
“During the fall of 2010 and again in 2012, we deployed satellite transmitters on a total of five Northern Harriers (Circus cyaneus) migrating through the westernmost reaches of the Florida Keys. This study was a first attempt at identifying pathways, stopover sites, and wintering destinations for this long-distance migrant (Avian Research and Conservation Institute).”
http://arcinst.org/arci-tracking-studies
Engineering and Technology
Students can research the technology used to track birds. Use engineering design principles tobuild/design a transmitter model. In what ways can the original transmitters be improved?
Higher Level Thinking Extension/ Abstract thinking
Students compare the bird’s migration pathway on a globe. How does the Earth’s structure affect theirbird’s path? Does a bird fly in a straight line?
How do birds compare to airplanes?
5th Grade Extensions Students analyze and compare the migratory patterns and distances of each species of bird. What is the sum of all of the distances combined? Estimate the sum of all migratory distances. (Math SOL 5.16 c) Find the mean, median, mode and range for other individuals of the same species. Tracking information can be found at The Center for Conservation Biology http://www.ccbbirds.org/what‐we‐do/research/bird‐migration/
Have students look at different locations of their bird’s migration and make a prediction as to why they stopped at that specific location. Research different areas of the migration route. Students can then make a prediction as to where the bird may fly next.
What is the perimeter and area of the Globe? Does a 2‐D Map when folded, a similar geometric shape as a globe? Does the newly formed (the cylinder) have the same perimeter?

Blandy Experimental Farm Education Programs Boyce Va 540-837-1758 www.virginia.edu/blandy Copyright 2016
Page | 6
Southern Hemisphere
Atlantic Ocean
Northern Hemisphere
Pacific Ocean
North and South America
Equator
Compass Rose
Legend Green‐ Whimbrel Black‐ Northern Pintail Blue‐ Northern Harrier Red‐ Peregrine Falcon Yellow‐ Bald Eagle
Extra Country Names
State Names

Blandy Experimental Farm Education Programs Boyce Va 540-837-1758 www.virginia.edu/blandy Copyright 2016
Page | 7
Bird Species ___________________
YES!NO
What was one significant event in your migration?
Was this significant event caused by living or non living things?
LIVING How did humans have an impact upon your species
survival?
NON‐LIVINGDid humans play a role with
your significant event? Why or why not?
Cause of death
Living thing or Non‐living thing?
LivingHow did humans have an impact
upon your species survival?
Non LivingDid humans play a role with your
significant event? Why or why not?
Did you successfully complete your migration?

Blandy Experimental Farm Education Programs Boyce Va 540-837-1758 www.virginia.edu/blandy Copyright 2016
Page | 8
Conversion Sheet The United States
*This map is not to scale
Inches Miles Kilometers1in 205 1 mile = 1.6km
East Coast to West Coast inches
E. Coast to W. CoastKilometers
12 1/4'” 2,514 330 km
2,514 miles
(1 mile = 1.6 kilometers )

205 milesX How long did it take for your
bird to complete their
journey?
Map Scale: 1 inch equals
How many inches on the map
was your bird’s journey?
YEARS MONTHS
WEEKS
DAYS
Migration Distance
Type of Bird ______________________________
Total number of miles during
migration

Look at the migration map for your bird.
Mark the most northern point of the migration on your map.
Mark the most southern point of the migration on your map.
What is the geographic region at this point?
What are the characteristics of this region?
Trace the path of the bird. What geographic region(s) did it move through?
What are some differences in the environment of these regions?
Think‐ What places could the bird stopover in to get food (read‘Diet and Habitat’ on the bird sheet)?
Based on the migration game you played and the bird’s path, What are any potential dangers along the way?
What are dangers in an urban place (cities)? What are dangers in rural places?

North America Geographic Regions
A. Coastal Plain– Low in elevation,– Marshes, swamps, and
many riversB. Appalachian
Highlands– Old, eroded mountains– Ridges and valleys,
forestsC. Canadian Shield
– glaciers– Dotted with small lakes,
very little soilD. Interior Lowlands
– many rivers, rivervalleys, grassy hills andsome open grassland
E. Great Plains– Flat lands that
gradually increase inelevation westwardgrasslands, prairie,steppes
F. Rocky Mountains– Rugged Mountains
G. Basin and Range– isolated mountain
ranges and DeathValley, the lowest pointin North America
H. Coastal Range– Rugged mountains and
fertile valleys