Embed Size (px)
Citation preview
ENDANGERED SPECIES RESEARCHEndang Species Res
Vol. 7: 29–38, 2009doi: 10.3354/esr00185
Printed May 2009Published online April 8, 2009
INTRODUCTION
Information on species distribution patterns is crucialfor effective conservation and management of bio-diversity (Margules & Pressey 2000). Given the alarmingsituation of extreme habitat alterations due to human ac-tivities, it is important to accurately assess the distri-bution and conservation status of threatened speciesto prevent future loss of global biodiversity. Substantialemphasis has been given to developing an objectivequantitative framework to help managers and decisionmakers estimate and contain the rate of biodiversity lossby 2010 (Balmford et al. 2005). In order to meet suchchallenges, the IUCN Red List was used as an importanttool to assess the status of global biodiversity (Baillie
et al. 2004). It is argued that the Red List index canbe used as a guide to judge whether or not the 2010 tar-gets will be met (Butchart et al. 2004). However, some9.4% or 3580 species could not be assessed accuratelybecause of insufficient information (Baillie et al. 2004).For species allocated to this data deficient category, itis important to generate information on their distribu-tion, abundance, habitat requirements and associatedthreats so that a manageable conservation strategy isidentified before they reach the brink of extinction.
Assessing the status and patterns of distribution of ar-boreal mammals is a challenge, especially when theyare cryptic, shy, nocturnal, lesser-known, secretive and,therefore, difficult to detect. However, it is essential tomore precisely determine the distribution of these spe-
© Inter-Research 2009 · www.int-res.com*Corresponding author. Email: [email protected]
Mapping potential distribution of slender lorissubspecies in peninsular India
Honnavalli N. Kumara1, Mohammed Irfan-Ullah2, 4,*, Shanthala Kumar3
1National Institute of Advanced Studies, Bengaluru (Bangalore), Karnataka, India2Ecoinformatics Centre, Ashoka Trust for Research in Ecology and the Environment (ATREE), 659, 5th-A Main Road, Hebbal,
Bengaluru (Bangalore), Karnataka, 560 024, India3Kumaragiri, Lakshmisha Nagara, Main Road, Chikmagalur 577 101, India
4Present address: Risk Management Solutions Inc. (RMSI), A-7 Sector 16, Noida, Uttar Pradesh 201 301, India
ABSTRACT: The present study mapped the potential geographic distribution of subspecies of slen-der loris Loris lydekkerianus from peninsular India. We utilized occurrence records of more than 300confirmed sightings of slender lorises to model the species’ potential geographic distribution byapplying an ecological niche modeling (ENM) framework using a desktop genetic algorithm for rule-set prediction (GARP) algorithm. Results indicate that the modeled potential distribution of a morpho-logically different and hitherto undescribed subspecies of slender loris is noticeably different in geo-graphic space from the 2 known subspecies found within peninsular India. The potential geographicdistribution of this subspecies appears to occupy a distinct and intermediate climate region runningalong the eastern fringe of the southern Western Ghats. Among the 2 known subspecies, the modeledpotential distribution of L. l. lydekkerianus corresponds with a relatively drier climate, largely occu-pying deciduous and open-scrub forest types, whereas the modeled potential distribution of L. l. mal-abaricus corresponds with wetter climates, ranging from deciduous to evergreen forest types. Thepresence of an undescribed subspecies of slender loris demonstrates an urgent need for a detailedexploration within the range modeled by the present study.
KEY WORDS: Ecological niche modeling · Loris lydekkerianus lydekkerianus · Loris lydekkerianusmalabaricus · Primates · Western Ghats · Desktop GARP
Resale or republication not permitted without written consent of the publisher
OPENPEN ACCESSCCESS
Endang Species Res 7: 29–38, 2009
cies in the wild, particularly when they are threatenedby deforestation, habitat fragmentation and exploita-tion (Kinnaird et al. 2003, Linkie et al. 2006). Slenderlorises constitute one such group of lesser-known arbo-real mammals. Slender (Loris) and slow (Nycticebus)lorises are the only 2 known strepsirrhine primate gen-era reported from India. Slow lorises are known to oc-cur in northeast India and parts of southeast Asia, whileslender lorises are restricted to southern India and SriLanka (Roonwal & Mohnot 1977, Nekaris & Bearder2007). Slender lorises are small, often solitary and noc-turnal and, consequently, poorly studied until the late1990s, when research became more common; see, forexample, studies of their distribution (Singh et al. 1999,2000, Kumar et al. 2002, 2006, in press), behavior(Nekaris 2001, 2003, Radhakrishna & Singh 2002a,b,c,2004a,b) and ecology (Nekaris & Rusmussen 2003, Ku-mara 2005). The slender lorises of India (Loris lydekke-rianus lydekkerianus and L. l. malabaricus) are ac-corded the status of near threatened in the IUCN RedList of threatened species, and at the national level theyhave been assigned the highest level of protection un-der Schedule I, Part I of the Indian Wildlife ProtectionAct, 1972. The current classification of slender lorises(Groves 2001) includes 2 species and 6 subspecies;among them only 1 species (L. lydekkerianus) with 2subspecies (L. l. lydekkerianus and L. l. malabaricus) isreported from India. In contrast, in Sri Lanka L. ly-dekkerianus is represented by a further 2 subspecies(L. l. grandis and L. l. nordicus) and a second species isalso present with 2 subspecies (L. tardigradus tardi-gradus and L. t. nycticeboides).
Loris lydekkerianus lydekkerianus is known to occurin drier forests of Eastern Ghats, south of the RiverGodavari, and L. l. malabaricus is reported from thewetter forests of Western Ghats, south of the RiverTapti (Roonwal & Mohnot 1977, Groves 2001, Nekaris& Bearder 2007). Schulze & Meier (1995) constructedan approximate distribution map for slender loris sub-species in southern India based on the origins ofmuseum specimens collected between 1889 and 1929(Jenkins 1987), sight records, animal collection records(Blandford 1888, Ryley 1913, Wroughton 1917,Ramaswami & Kumar 1962, Seth 1963, Swayamprabha& Kadam 1980, Devaraj Sarkar et al. 1981, Johnson1984, Manjula 1984, Sarma & Kadam 1984, Rao 1994)and the area estimations of Osman-Hill (1933) andFiedler (1956). No lorises were recorded from the loca-tions reported by Devaraj Sarkar et al. (1981) duringthe repeat surveys conducted by Kumara et al. (2006).Kumara et al. (2006) discovered significant variationbetween the observed and the reported distribution,possibly due to the loss of natural habitat under grow-ing anthropogenic pressure in recent times (Kumara &Singh 2004, Schulze et al. 2005, Kumara 2007).
The results of Kumara et al. (2006) elicited the needfor a renewed effort to map slender loris distribution.Mapping the distribution in its entirety by means ofground surveys remains a prohibitively expensive andtime-consuming task. The conventional approachesare also subjective and biased towards accessible orwell-sampled areas, and could rarely be extended toremote and poorly known locations. Modern attemptsas applied in the US gap analysis program (Csuti 1996)are data intensive, difficult to implement, heteroge-neous and unreliable in the absence of extensive fieldchecks (Peterson 2005). We therefore used the alterna-tives proposed by Peterson et al. (2003), Peterson &Kluza (2003), and Peterson (2005), combining theknown occurrence records from extensive field sur-veys and the construction of ecological niche models(ENM) to establish the potential distribution of slenderlorises.
The ecological niche of a species is defined as the setof ecological conditions within which it is able to main-tain populations without immigration (Grinnell 1917,Holt & Gaines 1992). Several approaches have beenused to approximate ecological niches (Nix 1986,Austin et al. 1990, Walker & Cocks 1991, Manel et al.1999b, Berry et al. 2002, Scott et al. 2002, Phillips et al.2004); of these, one that has been widely tested in abroad range of applications is the genetic algorithm forrule-set prediction (GARP), which includes severalinferential approaches in an iterative, evolutionary-computing environment (Stockwell & Peters 1999).ENMs have been useful in various ecological applica-tions (Miller 1994, Csuti 1996, Tucker et al. 1997, Got-tfried et al. 1999, Manel et al. 1999a,b), includingrecent applications to gap analysis (Peterson & Kluza2003, Peterson 2005).
Here we attempt to produce potential distributionmaps of different subspecies of Loris lydekkerianususing an ENM framework for planning future surveysfor systematic scientific sampling. These maps providevaluable biogeographical information that may helptargeting surveys to accelerate the discovery ofunknown populations and species (Raxworthy et al.2003, Bourg et al. 2005). It is important to note thatthese maps identify regions that have similar environ-mental conditions where the species currently main-tain populations, and should not be interpreted as theactual limits of the range of a species.
MATERIALS AND METHODS
The present study is an attempt to predict the poten-tial distribution of different subspecies of slender lorisin India using the DesktopGarp (www.nhm.ku.edu/desktopgarp/) implementation within the openMod-
30
Kumara et al.: Mapping slender loris distribution in India
eller Desktop (http://openmodeller.sourceforge.net/),a user-friendly interface to the GARP algorithm (Stock-well & Noble 1992) for modeling the potential distribu-tion of slender loris subspecies. We used 64 uniqueoccurrence points of Loris lydekkerianus malabaricus,58 of L. l. lydekkerianus and all 13 of the undescribedsubspecies L. l. ssp. ? obtained using equivalent meth-ods within the states of Karnataka, Andhra Pradesh,Tamil Nadu and Kerala (Kumara 2005, 2007, Kumaraet al. 2006).
There have been attempts (Stockwell & Peterson2002, Hernandez et al. 2006, Pearson et al. 2007) toestablish the minimum sample size necessary for pro-ducing meaningful results using the ENM approach.The issue of sample size assumes greater importanceespecially in the case of rare species that suffer datadeficiency by virtue of them being rare. Hernandez etal. (2006) found that accuracy of models was greater forspecies with small geographic ranges and limited envi-ronmental tolerances, which are the ecological charac-teristics of many rare species. Their results indicatedthat reasonable models could be made for some rarespecies, and they encouraged conservationists toresort to distribution modeling as a primary tool. Oneof the important reasons for modeling species distribu-tions is to overcome the handicap of data deficiency,and ENM is particularly useful in such cases. A samplesize of about 10 occurrence points could produce anaverage success rate of about 90% of the maximumsuccess achieved by the best model; such models con-
tribute to improved understanding of the species bio-geography in the absence of first-hand sightings(Stockwell & Peterson 2002, Hernandez et al. 2006,Pearson et al. 2007).
We used the monthly maximum normalized differ-ence vegetation index (NDVI) 16 d composite images(2003) from the advanced very high resolutionradiometer (AVHRR) satellite (Eidenshink & Faundeen1994). In addition, we noted elevation, slope, aspectand the compound topographic index (CTI) from theHydro-1K dataset (USGS 2001) and included 19 bio-climatic variables (Hijmans et al. 2005) (P1 to P19,Table 1).
Sets of 100 model runs were developed for eachanalysis. In general, 25% of available occurrences wereused for rule development (training data), 25% for ruleselection and refinement (intrinsic testing data) and theremaining 50% occurrence points were set aside for anindependent test and filter of the highest quality mod-els (extrinsic testing data). To choose the best modelsfrom among the 100 replicates, we filtered models onthe basis of omission and commission error estimatesfollowing recent recommendations (Anderson et al.2003). Specifically, given the high quality occurrencedata available, we selected 20 models presenting 0%omission based on the extrinsic testing data, and ofthese 20, models falling in the central 50% of commis-sion values were taken as the 10 best models.
To provide an independent validation of model per-formance, we prepared 4 replicates by randomly
31
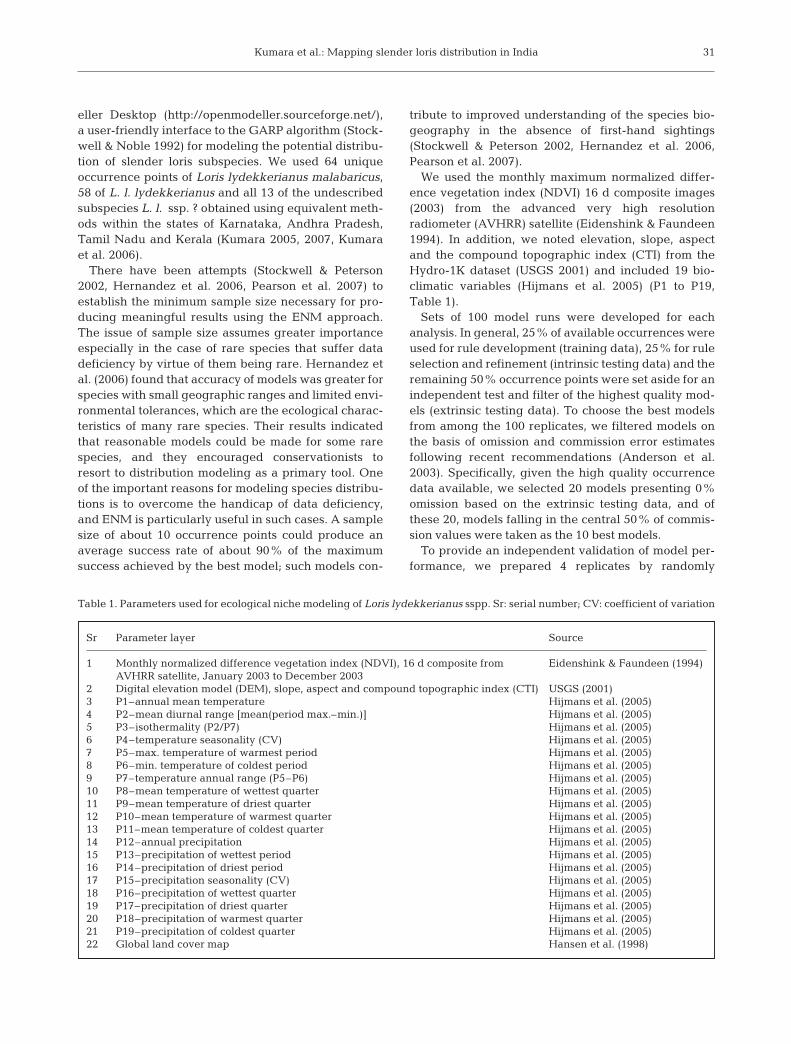
Sr Parameter layer Source
1 Monthly normalized difference vegetation index (NDVI), 16 d composite from Eidenshink & Faundeen (1994)AVHRR satellite, January 2003 to December 2003
2 Digital elevation model (DEM), slope, aspect and compound topographic index (CTI) USGS (2001) 3 P1–annual mean temperature Hijmans et al. (2005) 4 P2–mean diurnal range [mean(period max.–min.)] Hijmans et al. (2005)5 P3–isothermality (P2/P7) Hijmans et al. (2005)6 P4–temperature seasonality (CV) Hijmans et al. (2005) 7 P5–max. temperature of warmest period Hijmans et al. (2005) 8 P6–min. temperature of coldest period Hijmans et al. (2005) 9 P7–temperature annual range (P5–P6) Hijmans et al. (2005) 10 P8–mean temperature of wettest quarter Hijmans et al. (2005) 11 P9–mean temperature of driest quarter Hijmans et al. (2005) 12 P10–mean temperature of warmest quarter Hijmans et al. (2005) 13 P11–mean temperature of coldest quarter Hijmans et al. (2005) 14 P12–annual precipitation Hijmans et al. (2005) 15 P13–precipitation of wettest period Hijmans et al. (2005) 16 P14–precipitation of driest period Hijmans et al. (2005) 17 P15–precipitation seasonality (CV) Hijmans et al. (2005) 18 P16–precipitation of wettest quarter Hijmans et al. (2005) 19 P17–precipitation of driest quarter Hijmans et al. (2005) 20 P18–precipitation of warmest quarter Hijmans et al. (2005) 21 P19–precipitation of coldest quarter Hijmans et al. (2005) 22 Global land cover map Hansen et al. (1998)
Table 1. Parameters used for ecological niche modeling of Loris lydekkerianus sspp. Sr: serial number; CV: coefficient of variation
Endang Species Res 7: 29–38, 2009
selecting a proportion of 75% occurrence points, set-ting aside the remaining 25% as validation points ineach replicate for a completely independent test ofpredictive accuracy. Coincidence between indepen-dent testing points and model predictions was used asa measure of the model’s predictive ability. Binomialtests based on the proportional area predicted andnumbers of successfully and unsuccessfully predictedindependent test points were used to compareobserved predictive success with that expected underrandom (null) models of no association between pre-dictions and test points. As model results are cumula-tive (in the form of a ramp of model agreement) from 0(all models predict absence) to 10 (all models predictpresence), we repeated tests across all thresholds (pre-diction levels 1 to 10).
We geographically intersected maps of potentialdistribution with environmental grids containing thespatial and temporal distribution of precipitation, tem-perature and elevation data to understand the par-tially sampled ecological niche within the regions ofmodeled distribution for each subspecies of slenderloris.
We attempted to compare the forest type characteris-tics extracted from the locations known to be occupiedby slender lorises and from the modeled potential dis-tributions with the existing knowledge of the foresttypes described by Kumara et al. (2006). We geograph-ically intersected the known locations and maps ofpotential distribution of slender loris subspecies withfreely available global land cover maps (Hansen et al.1998, 2000) and extracted information about the differ-ent land cover types (Table 1). For convenience, weprovide the names of the land cover classes with theirequivalents following the widely used descriptions ofthe forest types in India by Champion & Seth (1968)(see Table 3). Finally, maps of the potential distribu-tions of slender loris subspecies were compared withoverlays of the protected area boundaries.
RESULTS
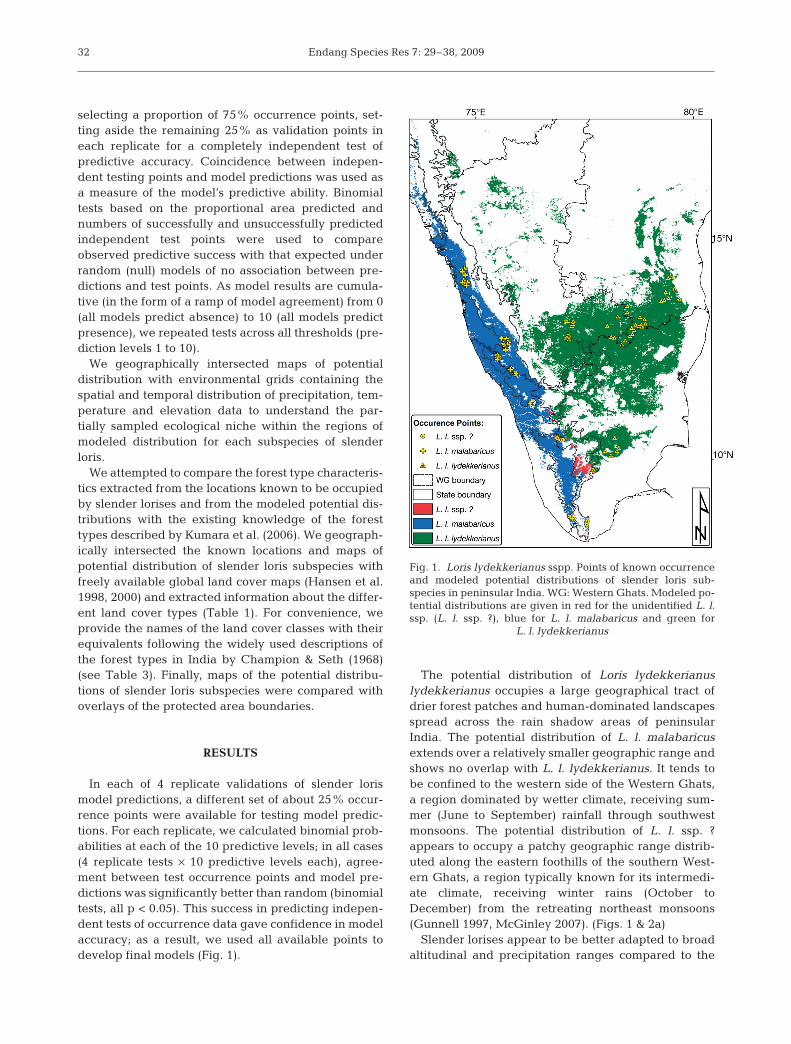
In each of 4 replicate validations of slender lorismodel predictions, a different set of about 25% occur-rence points were available for testing model predic-tions. For each replicate, we calculated binomial prob-abilities at each of the 10 predictive levels; in all cases(4 replicate tests × 10 predictive levels each), agree-ment between test occurrence points and model pre-dictions was significantly better than random (binomialtests, all p < 0.05). This success in predicting indepen-dent tests of occurrence data gave confidence in modelaccuracy; as a result, we used all available points todevelop final models (Fig. 1).
The potential distribution of Loris lydekkerianuslydekkerianus occupies a large geographical tract ofdrier forest patches and human-dominated landscapesspread across the rain shadow areas of peninsularIndia. The potential distribution of L. l. malabaricusextends over a relatively smaller geographic range andshows no overlap with L. l. lydekkerianus. It tends tobe confined to the western side of the Western Ghats,a region dominated by wetter climate, receiving sum-mer (June to September) rainfall through southwestmonsoons. The potential distribution of L. l. ssp. ?appears to occupy a patchy geographic range distrib-uted along the eastern foothills of the southern West-ern Ghats, a region typically known for its intermedi-ate climate, receiving winter rains (October toDecember) from the retreating northeast monsoons(Gunnell 1997, McGinley 2007). (Figs. 1 & 2a)
Slender lorises appear to be better adapted to broadaltitudinal and precipitation ranges compared to the
32
Fig. 1. Loris lydekkerianus sspp. Points of known occurrenceand modeled potential distributions of slender loris sub-species in peninsular India. WG: Western Ghats. Modeled po-tential distributions are given in red for the unidentified L. l.ssp. (L. l. ssp. ?), blue for L. l. malabaricus and green for
L. l. lydekkerianus
Kumara et al.: Mapping slender loris distribution in India
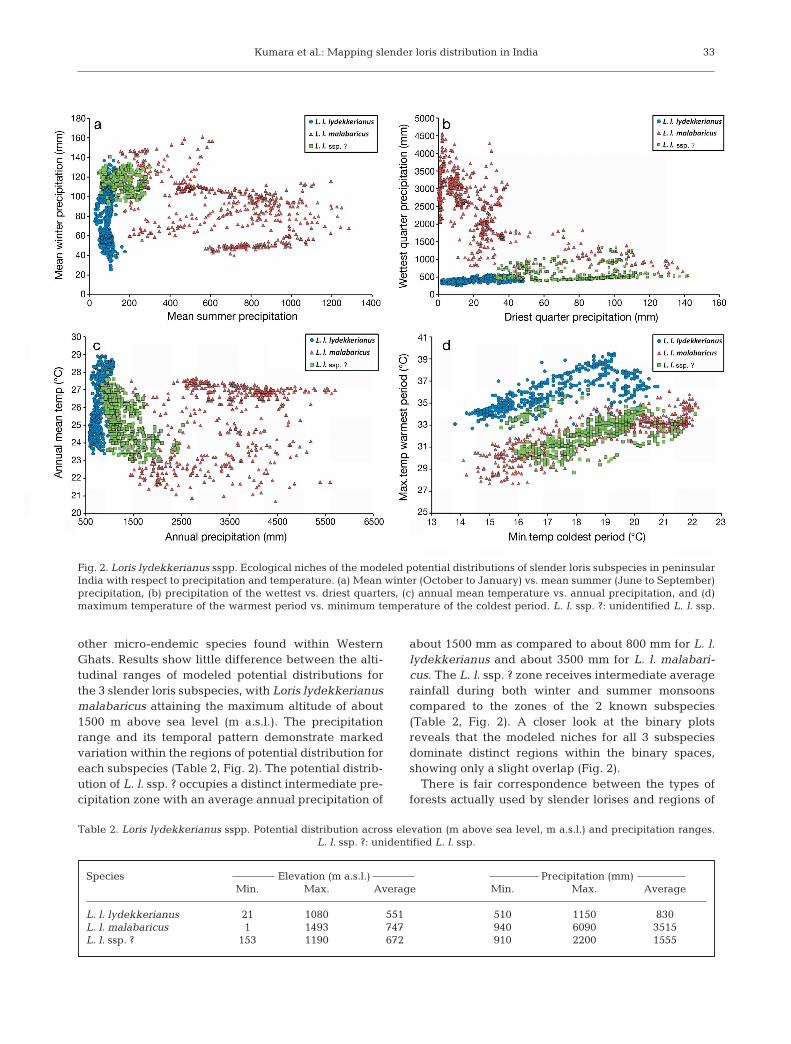
other micro-endemic species found within WesternGhats. Results show little difference between the alti-tudinal ranges of modeled potential distributions forthe 3 slender loris subspecies, with Loris lydekkerianusmalabaricus attaining the maximum altitude of about1500 m above sea level (m a.s.l.). The precipitationrange and its temporal pattern demonstrate markedvariation within the regions of potential distribution foreach subspecies (Table 2, Fig. 2). The potential distrib-ution of L. l. ssp. ? occupies a distinct intermediate pre-cipitation zone with an average annual precipitation of
about 1500 mm as compared to about 800 mm for L. l.lydekkerianus and about 3500 mm for L. l. malabari-cus. The L. l. ssp. ? zone receives intermediate averagerainfall during both winter and summer monsoonscompared to the zones of the 2 known subspecies(Table 2, Fig. 2). A closer look at the binary plotsreveals that the modeled niches for all 3 subspeciesdominate distinct regions within the binary spaces,showing only a slight overlap (Fig. 2).
There is fair correspondence between the types offorests actually used by slender lorises and regions of
33
Fig. 2. Loris lydekkerianus sspp. Ecological niches of the modeled potential distributions of slender loris subspecies in peninsularIndia with respect to precipitation and temperature. (a) Mean winter (October to January) vs. mean summer (June to September)precipitation, (b) precipitation of the wettest vs. driest quarters, (c) annual mean temperature vs. annual precipitation, and (d)maximum temperature of the warmest period vs. minimum temperature of the coldest period. L. l. ssp. ?: unidentified L. l. ssp.
Species Elevation (m a.s.l.) Precipitation (mm)Min. Max. Average Min. Max. Average
L. l. lydekkerianus 21 1080 551 510 1150 830L. l. malabaricus 1 1493 747 940 6090 3515L. l. ssp. ? 153 1190 672 910 2200 1555
Table 2. Loris lydekkerianus sspp. Potential distribution across elevation (m above sea level, m a.s.l.) and precipitation ranges.L. l. ssp. ?: unidentified L. l. ssp.
Endang Species Res 7: 29–38, 2009
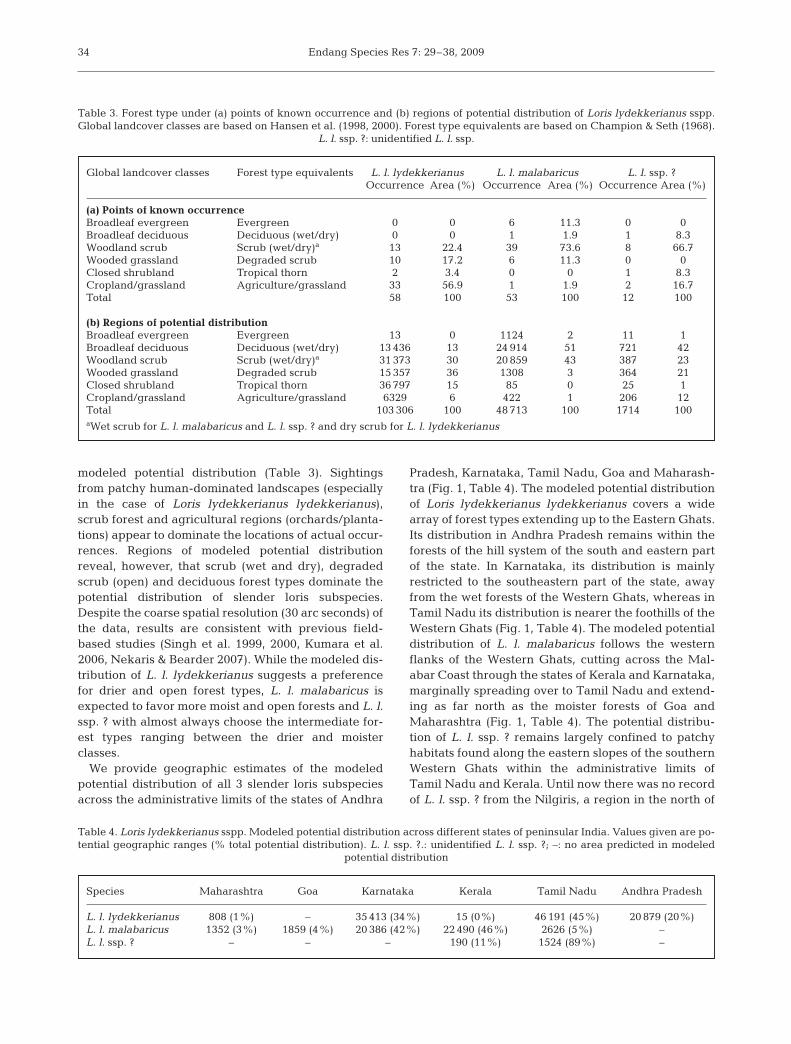
modeled potential distribution (Table 3). Sightingsfrom patchy human-dominated landscapes (especiallyin the case of Loris lydekkerianus lydekkerianus),scrub forest and agricultural regions (orchards/planta-tions) appear to dominate the locations of actual occur-rences. Regions of modeled potential distributionreveal, however, that scrub (wet and dry), degradedscrub (open) and deciduous forest types dominate thepotential distribution of slender loris subspecies.Despite the coarse spatial resolution (30 arc seconds) ofthe data, results are consistent with previous field-based studies (Singh et al. 1999, 2000, Kumara et al.2006, Nekaris & Bearder 2007). While the modeled dis-tribution of L. l. lydekkerianus suggests a preferencefor drier and open forest types, L. l. malabaricus isexpected to favor more moist and open forests and L. l.ssp. ? with almost always choose the intermediate for-est types ranging between the drier and moisterclasses.
We provide geographic estimates of the modeledpotential distribution of all 3 slender loris subspeciesacross the administrative limits of the states of Andhra
Pradesh, Karnataka, Tamil Nadu, Goa and Maharash-tra (Fig. 1, Table 4). The modeled potential distributionof Loris lydekkerianus lydekkerianus covers a widearray of forest types extending up to the Eastern Ghats.Its distribution in Andhra Pradesh remains within theforests of the hill system of the south and eastern partof the state. In Karnataka, its distribution is mainlyrestricted to the southeastern part of the state, awayfrom the wet forests of the Western Ghats, whereas inTamil Nadu its distribution is nearer the foothills of theWestern Ghats (Fig. 1, Table 4). The modeled potentialdistribution of L. l. malabaricus follows the westernflanks of the Western Ghats, cutting across the Mal-abar Coast through the states of Kerala and Karnataka,marginally spreading over to Tamil Nadu and extend-ing as far north as the moister forests of Goa andMaharashtra (Fig. 1, Table 4). The potential distribu-tion of L. l. ssp. ? remains largely confined to patchyhabitats found along the eastern slopes of the southernWestern Ghats within the administrative limits ofTamil Nadu and Kerala. Until now there was no recordof L. l. ssp. ? from the Nilgiris, a region in the north of
34
Global landcover classes Forest type equivalents L. l. lydekkerianus L. l. malabaricus L. l. ssp. ?Occurrence Area (%) Occurrence Area (%) Occurrence Area (%)
(a) Points of known occurrenceBroadleaf evergreen Evergreen 0 0 6 11.3 0 0Broadleaf deciduous Deciduous (wet/dry) 0 0 1 1.9 1 8.3Woodland scrub Scrub (wet/dry)a 13 22.4 39 73.6 8 66.7Wooded grassland Degraded scrub 10 17.2 6 11.3 0 0Closed shrubland Tropical thorn 2 3.4 0 0 1 8.3Cropland/grassland Agriculture/grassland 33 56.9 1 1.9 2 16.7Total 58 100 53 100 12 100
(b) Regions of potential distribution Broadleaf evergreen Evergreen 13 0 1124 2 11 1Broadleaf deciduous Deciduous (wet/dry) 13 436 13 24 914 51 721 42Woodland scrub Scrub (wet/dry)a 31 373 30 20 859 43 387 23Wooded grassland Degraded scrub 15 357 36 1308 3 364 21Closed shrubland Tropical thorn 36 797 15 85 0 25 1Cropland/grassland Agriculture/grassland 6329 6 422 1 206 12Total 103 306 100 48 713 100 1714 100aWet scrub for L. l. malabaricus and L. l. ssp. ? and dry scrub for L. l. lydekkerianus
Table 3. Forest type under (a) points of known occurrence and (b) regions of potential distribution of Loris lydekkerianus sspp.Global landcover classes are based on Hansen et al. (1998, 2000). Forest type equivalents are based on Champion & Seth (1968).
L. l. ssp. ?: unidentified L. l. ssp.
Species Maharashtra Goa Karnataka Kerala Tamil Nadu Andhra Pradesh
L. l. lydekkerianus 808 (1%) – 35 413 (34%) 15 (0%) 46 191 (45%) 20 879 (20%)L. l. malabaricus 1352 (3%) 1859 (4%) 20 386 (42%) 22 490 (46%) 2626 (5%) –L. l. ssp. ? – – – 190 (11%) 1524 (89%) –
Table 4. Loris lydekkerianus sspp. Modeled potential distribution across different states of peninsular India. Values given are po-tential geographic ranges (% total potential distribution). L. l. ssp. ?.: unidentified L. l. ssp. ?; –: no area predicted in modeled
potential distribution
Kumara et al.: Mapping slender loris distribution in India
Palghat Gap, but our model predicts a strong potentialfor it to occur in this region; further investigation of thedistribution of this undescribed subspecies is thereforewarranted.
DISCUSSION
The classification of slender lorises has been conven-tionally based on the comparison of museum speci-mens (Bearder 1999), which has remained a difficulttask owing to the small number of available samples.The distribution maps of such species, preparedmainly from the descriptions of the locations foundwith the museum specimens, also remain crude. Long-term and detailed studies on species within primategroups including Tarsiiformes, Lemuriformes, Galagi-nae and Aoutidae have revealed that the actual num-bers of these species are highly underestimated, whichhas led to wide-spread acceptance of newer speciesand/or subspecies and frequent taxonomic rearrange-ments (Masters 1988, Zimmermann et al. 1988,Bearder et al. 1995, Martin 1995, Hafen et al. 1998,Nietsch 1999, Pastorini et al. 2003, Nekaris & Jaffe2007). Many of these species, formerly thought to bebroadly distributed, are now considered to be confinedto more restricted ranges (Ganzhorn et al. 1997).Nekaris & Bearder (2007) suspect similar trends for theLorisinae, the lorises of Asia. Due to insufficient knowl-edge regarding the morphological differences be-tween many species and/or subspecies of Lorisinae(e.g. species belonging to Nycticebus in Sundaland;Nekaris & Jaffe 2007), we expect a similar situation insouthern India. For example, Loris lydekkerianus mal-abaricus was distinguished from other subspeciesbased on only 4 specimens including 2 immature ani-mals. Osman-Hill (1933) also noted some confusionregarding the localities of collected specimens andtheir taxonomic status; no recent attempts have beenmade to collect L. l. malabaricus specimens and verifytheir taxonomic status. L. l. malabaricus was thought tobe distributed throughout the forests of the entireWestern Ghats (Devaraj Sarkar et al. 1981, Schulze &Meier 1995), a distribution questioned by Kumara et al.(2006) based on recently extended surveys (Kumar etal. 2002, 2006). The modeled potential distributionfrom the present study, using all the available knownlocations, further indicates that this subspecies’ distrib-ution may not be as extensive as once thought.
The known populations and modeled potential dis-tributions of Loris lydekkerianus lydekkerianus and L.l. malabaricus do not overlap, and there is <0.1% over-lap of the 2 known subspecies with the modeled poten-tial distribution of L. l. ssp. ?, indicating a clear differ-ence in their modeled ecological niches (Fig. 1). This
reinforces the doubts (Nekaris & Jaffe 2007) raisedabout earlier projections of slender loris distribution insouth India. The present study supports the distinctionof a third population of slender loris that is distinct inmorphology and habitat requirements from the 2known subspecies. The fact that L. l. ssp. ? is found inthe rain shadow areas along the eastern slopes of theWestern Ghats prompted us to attempt a separatemodeling effort for this subspecies with a clear inten-tion to investigate if its current ecological conditionsoverlapped with the other 2 known subspecies. Therain shadow areas along the eastern sides of the Nil-giris and the southern Western Ghats are character-ized by a prevailing dry climate and dominated bydeciduous and, at times, scrub forests (Pascal 1988).Results indicate that L. l. ssp. ? occupies a narrow, geo-graphically restricted niche, largely within the drierforests, yet it has little overlap with the 2 known sub-species. It is important to note that almost the whole ofits modeled niche (about 99%) falls within the limits ofthe Western Ghats.
Our survey (Kumara et al. 2006) did not detect slen-der lorises in the northern and central plains of Kar-nataka, despite model predictions showing environ-mental conditions in those areas similar to otherlocations with known occurrences of slender lorises.Further investigation is required to discover whetherslender lorises historically occurred in these regions ofpotential distribution. There is a possibility that, despitethe availability of suitable environmental conditions,slender lorises may not be present as a result of variousfactors that might be affecting their presence in timeand space (Prasad et al. 1978, Karanth 1986, Ceballos &Brown 1995, Kumara et al. 2006, Kumara & Raj 2007).
The limited records of actual species distributionmay neither fully capture the species’ ecological nichenor their realized niches. This could result in a possibleunder-representation of the actual distribution or,equally, an over-prediction of the part of the ecologicalniche not utilized by the species. Modeled distributionsreconstructed from known occurrences thus fall some-where between the true ecological niche and the real-ized niche (Singh et al. 1999, 2000, Kumar et al. 2002,2006, 2009), and point to possible areas for furtherexploration to fill the gap in our knowledge of speciesdistributions.
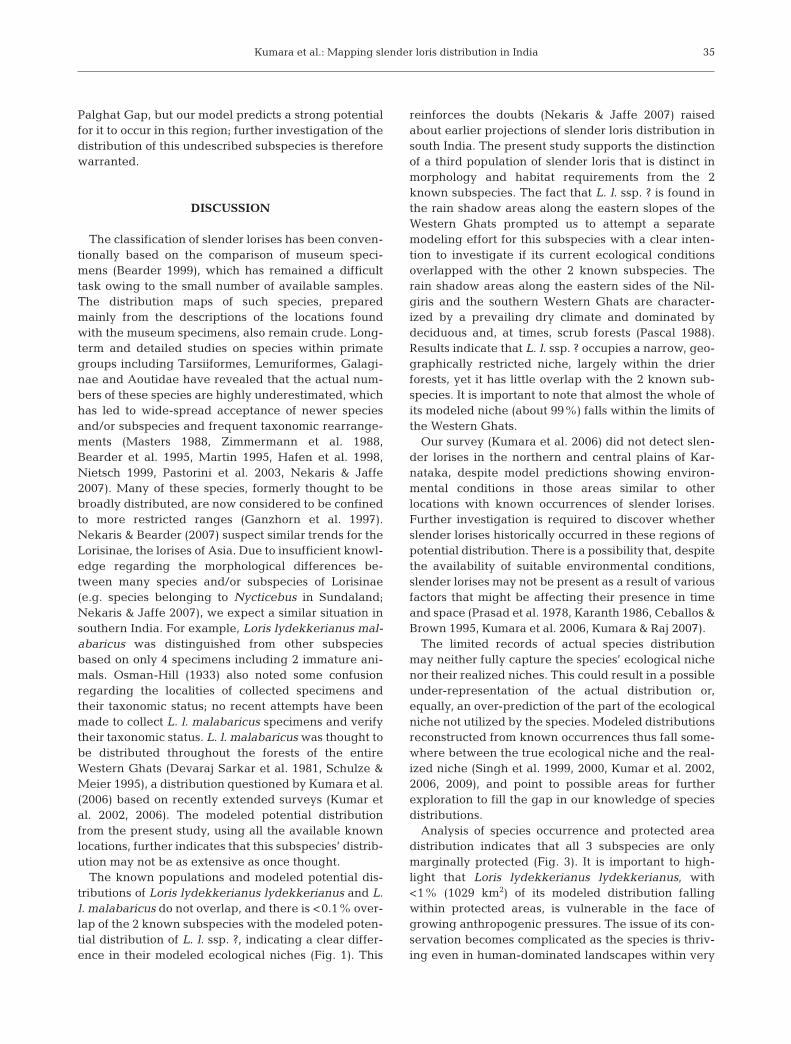
Analysis of species occurrence and protected areadistribution indicates that all 3 subspecies are onlymarginally protected (Fig. 3). It is important to high-light that Loris lydekkerianus lydekkerianus, with<1% (1029 km2) of its modeled distribution fallingwithin protected areas, is vulnerable in the face ofgrowing anthropogenic pressures. The issue of its con-servation becomes complicated as the species is thriv-ing even in human-dominated landscapes within very
35
Endang Species Res 7: 29–38, 2009
small islands of habitat or within plantations that maynot qualify as proper refuge for the species to ensureits future survival. About 12% (6032 km2) of the mod-eled distributions of L. l. malabaricus and about 23%(398 km2) of L. l. ssp. ? appear to occur within the con-fines of protected areas, which may be insufficient forthe long-term conservation of the species, despite itsability to survive within disturbed landscapes (Singh etal. 1999, 2000, Nekaris 2000, Kumara et al. 2006).
CONCLUSIONS
This is the first attempt to model the potential distri-bution of stealthy, hard to detect and extremely shysubspecies of slender lorises reported from southernpeninsular India. It has been possible to produce arational and objective map of their potential distribu-tion that indicates a hitherto undescribed subspecies.Our motivation was to develop a model-based frame-work for future sampling and to assess the conserva-tion status of distinct populations to help plan system-atic conservation strategies in the face of growing
threats from urbanization-linked land cover changesand habitat loss. Our results of modeled potentialniches point to a morphologically distinct new sub-species occupying an area with different vegetationand environmental conditions compared to the 2known subspecies. Based on the results of the presentstudy, we recommend a systematic molecular study atthe population level to establish the status of the differ-ent morphotypes. One of the main contributions of thepresent study is the generation of the first map detail-ing the modeled potential distributions of the slenderloris subspecies based on objective criteria, which canbe dynamically updated with growing knowledge.
Acknowledgements. The authors thank Prof. M. Singh, M.Chaitra, A. Singh, N. Lele and K. A. Subramaniam for helpfulcomments, discussion and support at various stages of thiswork. The authors also acknowledge the significant contribu-tion from the anonymous reviewer in improving the text.Financial support for fieldwork was provided by the RuffordMaurice Laing Foundation, the American Society of Primatol-ogists and the Department of Science and Technology, Gov-ernment of India. The Ashoka Trust for Research in Ecologyand Environment (ATREE, www.atree.org), the Indo-US Sci-ence and Technology Forum and the JRS Foundation pro-vided support for the modeling effort.
LITERATURE CITED
Anderson RP, Lew D, Peterson AT (2003) Evaluating predic-tive models of species distributions: criteria for selectingoptimal models. Ecol Model 162:211–232
Austin MP, Nicholls AO, Margules CR (1990) Measurement ofthe realized qualitative niche: environmental niches offive Eucalyptus species. Ecol Monogr 60:161–177
Baillie JEM, Hilton-Taylor C, Stuart SN (eds) (2004) 2004IUCN Red List of Threatened Species. A global speciesassessment. IUCN, Gland and Cambridge
Balmford A, Crane P, Dobson AP, Green RE, Mace GM (2005)2010 challenge: data availability, information needs andextraterrestrial rights. Philos Trans R Soc Lond B Biol Sci360:221–228
Bearder SK (1999) Physical and social diversity among noctur-nal primates: a new view based on long-term research.Primates 40:267–282
Bearder SK, Honess PE, Ambrose L (1995) Species diversityamong galagos with special reference to mate recognition.In: Alterman L, Doyle GA, Izard MK (ed) Creatures ofthe dark: the nocturnal prosimians. Plenum, New York,p 331–352
Berry PM, Dawson TP, Harrison PA, Pearson RG (2002) Mod-elling potential impacts of climate change on the biocli-matic envelope of species in Britain and Ireland. Glob EcolBiogeogr 11:453–462
Blandford WT (1888) Mammals of British India. Taylor &Francis, London
Bourg NA, McShea WJ, Gill DE (2005) Putting a CART beforethe search: successful habitat prediction for a rare forestherb. Ecology 86:2793–2804
Butchart SHM, Stattersfield AJ, Bennun LA, Shutes SM andothers (2004) Measuring global trends in the status of bio-diversity: Red List indices for birds. PLoS Biol 2:e383
36
Fig. 3. Protected area network and loris distribution
Kumara et al.: Mapping slender loris distribution in India
Ceballos G, Brown JH (1995) Global patterns of mammalian diver-sity, endemism, and endangerment. Conserv Biol 9: 559–568
Champion HG, Seth SK (1968) A revised classification of theforest types of India. Natraj Publishers, Dehradun
Csuti B (1996) Mapping animal distribution areas for gapanalysis. In: Scott JM, Tear TH, Davis FW (eds) Gap analy-sis: a landscape approach to land management issues.American Society of Photogrammetry and Remote Sens-ing, Bethesda, MD, p 135–145
Devaraj Sarkar HB, Murali S, Prasad DT, Shekarappa BM,Vijayalakshmi V (1981) The population and distribution ofthe slender loris (Loris tardigradus) in Karnataka State.Tigerpaper 8:7–10
Eidenshink JC, Faundeen JL (1994) The 1 km AVHRR globalland data set: first stages in implementation. Int J RemoteSens 15:3443–3462
Fiedler W (1956) Übersicht über das System der Primaten. In:Hofer H, Schulze AH, Starck D (eds) Primatologia 1.S. Karger Verlag, Basel, p 321–351
Ganzhorn JU, Rakotosamimanana B, Hannah L (1997) Priori-ties for biodiversity conservation in Madagascar. PrimateRep 48:1–81
Gottfried M, Pauli H, Reiter K, Grabherr G (1999) A fine-scaled predictive model for changes in species distributionpatterns of high mountain plants induced by climatewarming. Divers Distrib 5:241–251
Grinnell J (1917) Field tests of theories concerning distribu-tional control. Am Nat 51:115–128
Groves CP (2001) Primate taxonomy. Smithsonian InstitutionPress, Washington, DC
Gunnell Y (1997) Relief and climate in South Asia: the influ-ence of the Western Ghats on the current climate patternof peninsular India. Int J Climatol 17:1169–1182
Hafen T, Neveu H, Rumpler Y, Wilden I, Zimmerman E (1998)Acoustically dimorphic advertisement calls separate mor-phologically and genetically homogenous populations ofthe grey mouse lemur (Microcebus murinus). Folia Prima-tol 69:342–356
Hansen MC, DeFries RS, Townshend JRG, Sohlberg R (1998)1 km land cover classification derived from AVHRR, Ver-sion 1.0. The Global Land Cover Facility, University ofMaryland, College Park, MD
Hansen MC, DeFries RS, Townshend JRG, Sohlberg R (2000)Global land cover classification at 1 km resolution using adecision tree classifier. Int J Remote Sens 21:1331–1365
Hernandez PA, Graham CH, Master LL, Albert DL (2006) Theeffect of sample size and species characteristics on perfor-mance of different species distribution modeling methods.Ecography 29:773–785
Hijmans RJ, Cameron SE, Parra JL, Jones PG, Jarvis A (2005)Very high resolution interpolated climate surfaces forglobal land areas. Int J Climatol 25:1965–1978
Holt RD, Gaines MS (1992) Analysis of adaptation in hetero-geneous landscapes: implications for the evolution of fun-damental niches. Evol Ecol 6:433–447
Jenkins PD (1987) Catalogue of primates in the BritishMuseum (Natural History). Part IV. Suborder Strepsir-rhini. British Museum (Natural History), London
Johnson JM (1984) Diurnal activities of the slender loris, Loristardigradus, in the Mundanthurai Sanctuary, Tamil Nadu(India). In: Roonwal ML, Mohnot SM, Rathore NS (eds)Current primate researches. University of Jodhpur Press,Jodhpur, p 389–395
Karanth KU (1986) Status of wildlife and habitat conservationin Karnataka. J Bombay Nat Hist Soc 83:166–179
Kinnaird MF, Sanderson EW, O’Brien TG, Wibisono HT,Woolmer G (2003) Deforestation trends in a tropical land-
scape and implications for endangered large mammals.Conserv Biol 17:245–257
Kumar MA, Singh M, Srivastava S, Udhayan A, Kumara HN,Sharma AK (2002) Distribution and management of wildmammals in Indira Gandhi Wildlife Sanctuary, TamilNadu, India. J Bombay Nat Hist Soc 99:184–210
Kumara HN (2005) An ecological assessment of mammals innon-sanctuary areas of Karnataka. University of Mysore,Mysore
Kumara HN (2007) Impact of local hunting on abundance oflarge mammals in three protected areas of the WesternGhats, Karnataka. Final Technical Report. National Insti-tute of Advance Studies, Bangalore
Kumara HN, Raj VVM (2007) The great Indian bustard(Ardeotis nigriceps): Are they disappearing in Karnataka?J Bombay Nat Hist Soc 104:13–14
Kumara HN, Singh M (2004) The influence of differing hunt-ing practices on the relative abundance of mammals intwo rainforest areas of the Western Ghats, India. Oryx38:321–327
Kumara HN, Singh M, Kumar S (2006) Distribution, habitatcorrelates and conservation of slender loris (Loris lydekke-rianus) in Karnataka, India. Int J Primatol 27:941–969
Kumara HN, Singh M, Irfan-Ullah M, Kumar S (2009) Distrib-ution and conservation status of slender loris in Karnataka,India. Prosimians 2007, Ithala Game Reserve, Louwsberg,KwaZulu-Natal, South Africa, 15–19 Jul 2007 (in press)
Linkie M, Chapron G, Martyr DJ, Holden J, Leader-Williams N(2006) Assessing the viability of tiger subpopulations in afragmented landscape. J Appl Ecol 43:576–586
Manel S, Dias JM, Buckton ST, Ormerod SJ (1999a) Alterna-tive methods for predicting species distribution: an illustra-tion with Himalayan river birds. J Appl Ecol 36: 734–747
Manel S, Dias JM, Ormerod SJ (1999b) Comparing discrimi-nant analysis, neural networks and logistic regression forpredicting species distributions: a case study with aHimalayan river bird. Ecol Model 120:337–347
Manjula A (1984) Changes in levels of proteins in the malereproductive system of the slender loris (Loris tardigraduslydekkerianus). In: Roonwal ML, Mohnot SM, Rathore NS(eds) Current primate researches. University of JodhpurPress, Jodhpur, p 441–447
Margules CR, Pressey RL (2000) Systematic conservationplanning. Nature 405:243–253
Martin RD (1995) Prosimians: from obscurity to extinction. In:Alterman L, Doyle GA, Izard MK (eds) Creatures of thedark: the nocturnal prosimians. Plenum Press, New York,p 535–563
Masters JC (1988) Speciation in the greater galagos (Prosimii:Galaginae): a review and synthesis. Biol J Linn Soc 34:149–174
McGinley M (2007) South Western Ghats montane rainforests. In: Cutler JC (ed) Encyclopedia of Earth. Environ-mental Information Coalition, National Council for Sci-ence and the Environment, Washington, DC
Miller RI (1994) Mapping the diversity of nature. Chapman &Hall, London, p 218
Nekaris KAI (2000) The socioecology of the Mysore slenderloris (Loris tardigradus lydekkerianus) in Dindigul, TamilNadu, South India. Department of Anthropology, Wash-ington University, St. Louis, MO
Nekaris KAI (2001) Activity budget and positional behaviourof the Mysore slender loris: implications for slow climbinglocomotion. Folia Primatol 72:228–241
Nekaris KAI (2003) Spacing system of the Mysore slenderloris (Loris lydekkerianus lydekkerianus). Am J PhysAnthropol 121:86–96
37
Endang Species Res 7: 29–38, 2009
Nekaris KAI, Bearder SK (2007) The strepsirrhine primates ofAsia and mainland Africa: diversity shrouded in darkness.In: Campbell C, Fuentes A, MacKinnon K, Panger M,Bearder SK (eds) Primates in perspective. Oxford Univer-sity Press, Oxford, p 24–45
Nekaris KAI, Jaffe S (2007) Unexpected diversity of slowlorises (Nycticebus spp.) within the Javan pet trade: impli-cations for slow loris taxonomy. Contrib Zool 76:187–196
Nekaris KAI, Rusmussen DT (2003) The diet of the Mysoreslender loris (Loris tardigradus lydekkerianus). Int J Pri-matol 24:33–46
Nietsch A (1999) Duet vocalizations among different popula-tions of Sulawesi tarsiers. Int J Primatol 20:567–583
Nix HA (1986) A biogeographic analysis of Australian elapidsnakes. In: Longmore R (ed) Atlas of elapid snakes of Aus-tralia, Australian Government Publishing Service, Can-berra, p 415
Osman-Hill WC (1933) A monograph on the genus Loris, withan account of the external, cranial and dental characters ofthe genus: a revision of the known forms, and the descrip-tion of a new form from northern Ceylon. Ceylon J Sci SerB 18:89–132
Pascal JP (1988) Wet evergreen forests of the Western Ghatsof India: ecology, structure, floristic composition and suc-cession. Institut francais de Pondicherry, Pondicherry
Pastorini J, Thalmann U, Martin RD (2003) A molecularapproach to comparative phylogeography of extant Mala-gasy lemurs. Proc Natl Acad Sci USA 100:5879–5884
Pearson RG, Raxworthy C, Nakamura M, Peterson AT (2007)Predicting species’ distributions from small numbers ofoccurrence records: a test case using cryptic geckos inMadagascar. J Biogeogr 34:102–117
Peterson AT (2005) Kansas gap analysis: the importance ofvalidating distributional models before using them. South-west Nat 50:230–236
Peterson AT, Kluza DA (2003) New distributional modellingapproaches for gap analysis. Anim Conserv 6:47–54
Peterson A, Papes M, Kluza D (2003) Predicting the potentialinvasive distributions of four alien plant species in NorthAmerica. Weed Sci 51:863–868
Phillips SJ, Dudik M, Schapire RE (2004) A maximum entropyapproach to species distribution modeling. Proc 21st Cen-tury Int Conf Machine Learning, ACM Press, New York,p 655–662
Prasad SN, Nair VP, Sharathchandra H, Gadgil M (1978) Onfactors governing the distribution of wild mammals in Kar-nataka. J Bombay Nat Hist Soc 75:409–411
Radhakrishna S, Singh M (2002a) Activity schedule and habi-tat use of slender loris (Loris tardigradus lydekkerianus).J Bombay Nat Hist Soc 99:400–407
Radhakrishna S, Singh M (2002b) Home range and rangingpattern in the slender loris (Loris tardigradus lydekkeri-anus). Primates 43:237–248
Radhakrishna S, Singh M (2002c) Social behavior of slender loris(Loris tardigradus lydekkerianus). Folia Primatol 73:181–196
Radhakrishna S, Singh M (2004a) Infant development in theslender loris (Loris lydekkerianus lydekkerianus). Curr Sci86:1121–1127
Radhakrishna S, Singh M (2004b) Reproductive biology of theslender loris (Loris lydekkerianus lydekkerianus). FoliaPrimatol 75:1–13
Ramaswami LA, Kumar TCA (1962) Reproductive cycle of theslender loris. Naturwissenschaften 49:115–116
Rao P (1994) Occurrence of the slender loris (Loris tardi-gradus) in South Coastal Andhra Pradesh, India. J Bom-bay Nat Hist Soc 91:303
Raxworthy CJ, Martínez-Meyer E, Horning N, Nussbaum RA,Schneider GE, Ortega-Huerta MA, Peterson AT (2003)Predicting distributions of known and unknown reptilespecies in Madagascar. Nature 426:837–841
Roonwal ML, Mohnot SM (1977) Primates of South Asia: ecol-ogy, sociobiology and behavior. Harvard University Press,Cambridge, MA
Ryley KV (1913) Mammal survey of India: Loris lydekkeri-anus, Cabrera. The Mysore slender loris. J Bombay NatHist Soc 22:283–287
Sarma R, Kadam M (1984) Study of germ-cell morphology andthe spermatogenic cycle in the slender loris, Loris tardi-gradus lydekkerianus (Cabr.). In: Roonwal ML, Mohnot SM,Rathore NS (eds) Current primate researches. University ofJodhpur Press, Jodhpur, p 167–175
Schulze H, Meier B (1995) The subspecies of Loris tardigradusand their conservation status: a review. In: Alterman L,Doyle GA, Izard MK (eds) Creatures of the dark: the noc-turnal prosimians. Plenum Press, New York, p 193–210
Schulze H, Ramanathan A, Fitch-Snyder H, Nekaris KAI,Singh M, Kaumanns W (2005) Care of rescued southIndian lorises with guidelines for hand-rearing infants. In:Menon V, Ashraf NVK, Panda P, Mainkar K (eds) Back tothe wild: studies in wildlife rehabilitation. Wildlife Trust ofIndia, New Delhi, p 104–118
Scott JM, Heglund PJ, Haufler JB, Morrison M, Raphael MG,Wall WB, Samson F (2002) Predicting species occurrences:issues of accuracy and scale. Island Press, Washington, DC
Seth PK (1963) Preliminary observations on slender lorises.Anthropologist 7:45–51
Singh M, Lindburg DG, Udhayan A, Kumar MA, Kumara HN(1999) Status survey of slender loris (Loris tardigraduslydekkerianus) in Dindigul, Tamil Nadu, India. Oryx 33:30–36
Singh M, Kumar MA, Kumara HN, Mohnot SM (2000) Distri-bution and conservation of slender lorises (Loris tardi-gradus lydekkerianus) in southern Andhra Pradesh, SouthIndia. Int J Primatol 21:721–730
Stockwell DRB, Noble IR (1992) Induction of sets of rules fromanimal distribution data: a robust and informative methodof data analysis. Math Comput Simul 33:385–390
Stockwell DRB, Peters D (1999) The GARP modeling system:problems and solutions to automated spatial prediction.Int J Geogr Inf Sci 13:143–158
Stockwell DRB, Peterson AT (2002) Controlling bias in biodi-versity data. In: Scott JM, Heglund PJ, Morrison ML (eds)Predicting species occurrences: issues of scale and accu-racy. Island Press, Washington, DC, p 537–546
Swayamprabha MS, Kadam KM (1980) Mother-infant rela-tionship in the slender loris (Loris tardigradus lydekkeri-anus). Primates 21:561–566
Tucker K, Rushton SP, Sanderson RA, Martin EB, Blaiklock J(1997) Modeling bird distributions: a combined GIS andBayesian rule-based approach. Landscape Ecol 12:77–93
USGS (United States Geological Survey) (2001) HYDRO1kelevation derivative database. Available at: http://edcdaac.usgs.gov/gtopo30/hydro/
Walker PA, Cocks KD (1991) HABITAT: a procedure formodelling a disjoint environmental envelope for a plant oranimal species. Global Ecol Biogeogr Lett 1:108–118
Wroughton RC (1917) The slender loris of Malabar. J BombayNat Hist Soci 25:45
Zimmermann E, Bearder SK, Doyle GA, Anderson AB (1988)Variations in vocal patterns of Senegal and South Africanlesser bushbabies and their implications for taxonomicrelationships. Folia Primatol 51:87–105
38
Editorial responsibility: Anne-Isola Nekaris,Oxford, UK
Submitted: April 23, 2008; Accepted: January 9, 2009Proofs received from author(s): March 30, 2009