Embed Size (px)
Citation preview
The author(s) shown below used Federal funds provided by the U.S. Department of Justice and prepared the following final report: Document Title: Mapping Prisoner Reentry: An Action Research
Guidebook Author(s): Nancy G. La Vigne ; Jake Cowan Document No.: 213675 Date Received: March 2006 Award Number: 2003-IJ-CX-1012 This report has not been published by the U.S. Department of Justice. To provide better customer service, NCJRS has made this Federally-funded grant final report available electronically in addition to traditional paper copies.
Opinions or points of view expressed are those
of the author(s) and do not necessarily reflect the official position or policies of the U.S.
Department of Justice.

The Reentry Mapping Network: An Action Research Partnership Abstract
In 2002, the Urban Institute established the Reentry Mapping Network (RMN), a partnership of jurisdictions throughout the country that are engaged in mapping and analyzing prisoner reentry and community data to help inform local policies and practices. The goal of the RMN is fourfold:
1. To develop a better understanding of the dynamics and correlates of prisoner
reentry at the local level; 2. To engage local stakeholders and practitioners in developing strategies to
address reentry-related challenges;
3. To facilitate greater coordination and collaboration among state and local agencies and organizations around this work; and
4. To promote peer learning on how communities can use data to identify and
address incarceration and reentry-related challenges. This report describes the methods underlying the RMN so that other jurisdictions can learn from these experiences and replicate their efforts in the interests of crafting more effective and successful reentry strategies at the community level. These lessons learned are derived from the three RMN partners funded by the National Institute of Justice (NIJ): Washington, DC, Winston-Salem, NC, and Milwaukee, WI. The first section of this report outlines the history and key concepts of mapping prisoner reentry and describes the origins of the RMN and how the network operates. The principal recommendations for each step of the reentry mapping process are addressed in following sections of the report. These steps involve: identifying stakeholders; setting research priorities and identifying key issues; obtaining corrections data; obtaining contextual data; creating maps; sharing maps with stakeholders; using analysis results to inform action; and creating a sustainable reentry mapping partnership. The report is presented as a guidebook, and is followed by a detailed appendix describing the experiences of the three NIJ-funded sites. This appendix also describes the role of The Urban Institute in the project, including detailed information about the methods employed to encourage peer learning across the RMN sites, as well as to provide guidance on data collection, spatial analysis, and community engagement activities. This information, along with a “how to” approach to reentry mapping, is intended to provide practical and useful information to communities that are interested in developing more informed and effective responses to prisoner reentry at the local level.

The Reentry Mapping Network: An Action Research Partnership The importance of understanding and addressing prisoner reentry at the community level cannot be overstated. With a large and growing number of prisoners released each year from state and federal correctional institutions, prisoner reentry poses numerous community challenges, including an increased risk to public safety and the limited availability of jobs, housing, and social services for returning prisoners. Moreover, today's intense cycle of arrest, removal, incarceration, and reentry – at levels four times higher than 20 years ago1 – has had a disparate impact on a relatively small number of communities around the country where policies related to incarceration and reentry are experienced most acutely. Over the past decade, a rising number of released prisoners have returned disproportionately to major metropolitan areas. In Maryland in 2001, for example, 59 percent of prisoners who were released in the state returned to the City of Baltimore. Within Baltimore, released prisoners were even more concentrated, with 30 percent of them returning to just six neighborhoods.2 Similar concentrations have been observed in several other major metropolitan areas.3 These studies have also documented the fact that the communities that are receiving the highest numbers of returning prisoners are often among the least able to provide the needed support for successful reintegration.4
Given the local context of prisoner reentry, it is particularly important for communities to have a clear spatial understanding of the characteristics of reentry within their jurisdictions. Mapping is one of the most powerful means of capturing important concentrations, patterns, and spatial trends in data, especially as they relate to community well being.5 Maps graphically illustrate underlying concentrations and patterns that clarify the ways in which social phenomena, such as prisoner reentry, affect communities. Accordingly, strategies to tackle problems resulting from prisoner reentry can be more effective when they are informed by the mapping of such information as the locations of returning prisoners, reentry services and resources, and parole offices.
Mapping any local phenomenon, however, requires local data. Institutions in a number of cities have successfully built data systems detailing numerous indicators of community well-being that have served to engage their community in local policymaking and community development.6 Applying this model to the issue of prisoner reentry, The Urban Institute established the Reentry Mapping Network, a group of jurisdictions7 applying a data-driven, spatial approach to prisoner reentry. The goal of the RMN is fourfold:
1 Harrison and Beck, 2005. 2 La Vigne and Kachnowski, 2003 3 La Vigne and Mamalian, 2003; La Vigne and Thomson, 2004. 4 La Vigne and Kachnowski, 2003; La Vigne and Mamalian, 2003; La Vigne and Thomson, 2004. 5 Kingsley et al., 1997. 6 Bailey et al, 2000. 7 RMN partner cities include Denver, CO, Des Moines, IA, Hartford, CT, Indianapolis, IN, Louisville, KY, Milwaukee, WI, Oakland, CA, Providence, RI, San Diego, CA, Seattle, WA, Washington, DC, and Winston-Salem, NC.

1. To develop a better understanding of the dynamics and correlates of prisoner
reentry at the local level; 2. To engage local stakeholders and practitioners in developing strategies to
address reentry-related challenges;
3. To facilitate greater coordination and collaboration among state and local agencies and organizations around this work; and
4. To promote peer learning on how communities can use data to identify and
address incarceration and reentry-related challenges. This executive summary describes the methods underlying the RMN so that other jurisdictions can learn from these experiences and replicate their efforts in the interests of crafting more effective and successful reentry strategies at the community level. These lessons learned are derived from the three RMN partners funded by the National Institute of Justice (NIJ): Washington, DC, Winston-Salem, NC, and Milwaukee, WI (see Figure 1 for descriptions of each of these three sites). These sites’ experiences are presented in a series of key steps that are necessary in creating an action-research partnership focused on mapping prisoner reentry, as well as by previous research applying action research to a variety of topics (e.g., neighborhood health8 and welfare reform9). The first section outlines the history and key concepts of mapping prisoner reentry and describes the origins of the RMN and how the Network operates. We then turn to a summary of the key recommendations for each step of the reentry mapping process, followed by a summary of lessons learned across the three NIJ-funded sites. This information, along with a “how to” approach to reentry mapping, is intended to provide practical and useful information to communities throughout the country that are interested in developing more informed and effective responses to prisoner reentry at the local level.
8 Pettit et al., 2003. 9 Turner et al., 1999.
Figure 1: Summary of NIJ-funded Reentry Mapping Network Sites Milwaukee, WI: The Nonprofit Center of Milwaukee’s Neighborhood Data Center is the lead Reentry Mapping Network partner in Milwaukee. The Data Center’s scope of services includes data and mapping support for nonprofit organizations in Milwaukee. The Data Center has time series data on prisoners returning to Milwaukee neighborhoods. The Data Center is working with Making Connections10 Milwaukee to release data and maps. They have also generated interest in reentry mapping in Milwaukee by demonstrating its benefits to local service providers. Washington, DC: NeighborhoodInfo DC leads the reentry mapping network partnership in Washington, DC. Established as a collaboration between the Urban Institute and the Washington DC Local Initiatives Support Corporation (LISC), NeighborhoodInfo DC provides community-based organizations and residents in the District of Columbia with local data and analysis they can use to improve the quality of life in their neighborhoods. NeighborhoodInfo DC is mapping patterns of reentry in Washington, DC, and focusing on obtaining better data on organizations providing services for former prisoners. NeighborhoodInfo DC is working with the Faith-Based Reentry Initiative, a partnership of 40 churches in Washington, DC that provide mentoring and service referrals for returning prisoners, to obtain data and disseminate analysis and mapping results. Winston-Salem, NC: The Winston-Salem Reentry Mapping Network project is managed by the Center for Community Safety (CCS), a public service and research center of Winston-Salem State University. The Center works with the Faith Seeds Reentry Coalition in addressing the challenges of high concentrations of returning prisoners in Winston-Salem’s Northeast neighborhood. Maps and other analyses from the Center are helping the Faith Seeds Reentry Coalition to plan for the creation of a Reentry Network Center, a community-based service coordination center for former prisoners in the Northeast Winston-Salem neighborhood.
10 Making Connections is a national program sponsored by the Annie E. Casey Foundation, and focuses on providing support to families and communities by enhancing social connectedness; linking them to local resources and services; and strengthening community members’ financial well-being.
The Reentry Mapping Network: An Action Research Partnership In recent years, mapping has become increasingly popular among law enforcement officials and criminologists.11 In many cases, these mapping efforts embody “action research” partnerships. Action research diverges from the traditional research model by producing action that addresses problems of practical importance.12 To increase the likelihood and efficacy of resulting action, action researchers partner with the people who are directly affected by the problem under study in order to design, implement, and interpret the research.13 The action research model is mutually beneficial, in that researchers can produce more well-informed and useful findings, and local efforts can be strengthened by the involvement of an external party that can provide support through management, research, and/or evaluation. External parties can fill any gaps in local partners’ technical expertise, knowledge of the problem studied, or knowledge of best practices and lessons learned from the literature. Also, their external perspective can contribute new insights on old problems and greater objectivity in assessing the project’s progress and accomplishments. In the mid-1990s, a new model for action research emerged. Organizations in several communities throughout the country began to assemble neighborhood-level data and then help community actors apply the information to motivate positive change in distressed areas and aid in program and policy development. 14 In order to learn from each other and promote the model to other cities, these organizations joined together with the Urban Institute in 1996 to form the National Neighborhood Indicators Partnership (NNIP). 15 Using data describing various conditions and trends at the neighborhood level to identify spatial patterns of problems and opportunities, these institutions have engaged their communities on issues ranging from welfare reform to vacant housing to public health.17 Applying this successful NNIP model to the topic of prisoner reentry, in 2001, The Urban Institute began efforts to develop the Reentry Mapping Network,18 a partnership working to strengthen communities' capacities to understand and address local problems related to prisoner reentry. The Urban Institute designed the network to assist and advise sites in the use of mapping to pinpoint neighborhoods experiencing high concentrations of returning prisoners as well as to develop strategies for communities to address the challenges that prisoner reentry creates. Partners were selected through a review of their
11 Karappunnan, 2005. 12 Gilmore, 1986; Lewin, 1946 13 McEwen, 1999. 14 Bailey et al., 2000. 15 Currently, there are 26 NNIP partners: Atlanta, Baltimore, Boston, Camden, Chattanooga, Chicago, Cleveland, Columbus, Dallas, Denver, Des Moines, Hartford, Indianapolis, Los Angeles, Louisville, Miami, Milwaukee, Memphis, Nashville, New Orleans, Oakland, Philadelphia, Providence, Sacramento, Seattle, and Washington. For more information on NNIP, see http://www.urban.org/nnip/index.htm. 16 Bailey et al., 2000. 17 The Urban Institute, 1999 18 RMN partner cities include Denver, CO; Des Moines, IA; Hartford, CT; Indianapolis, IN; Louisville, KY; Miami, FL; Milwaukee, WI; Oakland, CA; Providence, RI; San Diego, CA; Seattle, WA; Washington, DC; and Winston-Salem, NC. RMN also has two affiliate sites: Pittsburgh, PA and Newark, NJ.

existing data collection and analysis capabilities, the reentry issue they planned to explore, and their experience in working with community organizations and local agencies on developing action agendas. The RMN partners joined the network in phases, with the first six beginning work in 2002, followed by a second phase of six partners who joined in 2004. Three of the early partners, Winston-Salem, North Carolina, Milwaukee, WI, and Washington, DC, were funded in part by the National Institute of Justice (NIJ). THE REENTRY MAPPING NETWORK APPROACH In support of these partnerships collecting, analyzing and using data, the Urban Institute (UI) engaged in a variety of technical assistance and peer learning activities. These included holding an annual RMN conference, providing on-site support, promoting the exchange of information across all RMN sites, working with sites to disseminate findings and lessons learned, and monitoring each site's progress through bimonthly updates. The following section details these activities, as well as an assessment by RMN partners of the Urban Institute’s role in the RMN. Technical Assistance To RMN Partners As RMN partners developed their projects, Urban Institute staff provided technical assistance and resources to support their efforts. The goals of the Urban Institute in supporting RMN partners included providing assistance with: collecting and analyzing reentry-related data; engaging key community stakeholders throughout the process; presenting findings in an accessible way to stakeholders; and devising strategies to address identified problems. For example, the Urban Institute provided each site with documentation about data that Department of Corrections may be able to make available to them; confidentiality issues that may arise in accessing and using these data; and strategies for managing these confidentiality issues. These resources were developed at the Urban Institute based on the Justice Policy Center staffs' experience and knowledge of collecting data from departments of corrections across the country.19 The Urban Institute also drew from the expertise within its Justice Policy Center to create a guide for creating reentry maps, which serves as a resource for partners in determining the appropriate mapping techniques to employ for their intended audiences. In addition, in each of these cities Urban Institute staff attended community meetings, presented information about reentry mapping to stakeholders, and provided feedback and perspective about the sites’ agendas. Urban Institute staff were also available to assist in RMN partners’ efforts to sustain their work through additional fundraising. This included reviewing proposals, writing letters of support, and participating in conference calls and meetings with potential funders. Each RMN partner was also provided with a fundraising profile for their community, detailing local and national funders that have made grants related to reentry issues.
19 For more specific guidance on data access and confidentiality issues, see Mapping Prisoner Reentry: An Action Research Guidebook.
Web Site and Email Group UI staff maintain a monthly updated website for RMN partners containing administrative resources, relevant research, sample maps and reports, and technical assistance tools. Partners used these resources in their planning, analysis and community engagement work. The Urban Institute also distributes select resources to RMN partners via email. In addition to distributing resources such as those described above, the email list has been used to inform partners about funding opportunities and upcoming conferences. This communication method has made it easy to share timely information about deadlines for solicitations for proposals or conference participation. Conference Calls In addition to virtual communication with Network partners via email and the web, the Urban Institute holds bimonthly conference calls with partners to facilitate peer learning, involve the sites in the Network’s development, and sustain the project’s momentum. Calls are structured around pre-identified topics that might help to inform and guide RMN partners in their work. Cross-Site Meetings In October 2003 the Urban Institute convened the first of two Reentry Mapping Network conferences. This first cross-site conference was held over two days in Washington, DC, with two representatives from each of the first six RMN partners, including Milwaukee, Washington, DC and Winston-Salem, NC, represented. The focus of the conference was for partners to present and obtain feedback on their project strategies, with ample time allotted for discussion of those strategies by all partners and UI staff. In addition, a small number of national experts on reentry mapping attended and presented to the partners on community-level mapping, analysis and reentry issues. A second Reentry Mapping Network conference was held in New Orleans over November 30th – December 1st 2004. Representatives from all twelve RMN partners were present, again including Milwaukee, WI, Washington, DC, and Winston-Salem, NC. Each site presented results from their projects and exchanged ideas regarding data collection and analysis, community engagement strategies, and the future of the Reentry Mapping Network. The conferences were valuable opportunities for partners to meet, share experiences and discuss project strategies. The Urban Institute surveyed partners about the second conference in New Orleans. Fifteen of seventeen attended rated the conference’s networking opportunities as useful or extremely useful. All seventeen attendees found the site presentations and discussions either useful or extremely useful. Thirteen of seventeen attendees indicated that topical presentations on recent reentry related research were useful or extremely useful.
RMN partners also collaborated to present project results at reentry related conferences. For example, Urban Institute staff collaborated with RMN partners from Winston-Salem and Milwaukee to present at the April 2004, National Institute of Justice International Crime Mapping Research Conference in Boston, MA. In addition, Urban Institute staff collaborated with RMN partners from Winston-Salem and San Diego at the Innovative Technologies for Community Corrections Conference in June 2005 in Seattle, sponsored by the National Law Enforcement and Corrections Technology Center. These presentations provided additional opportunities for RMN partners to share project experiences with each other, as well as with wider audiences. KEY STEPS IN IMPLEMENTING A REENTRY MAPPING PARTNERSHIP The partnership between The Urban Institute and each of the reentry mapping partners described above provided the opportunity to closely document the experiences of each of the RMN sites and develop a series of steps that other jurisdictions can follow in order to establish their own reentry mapping partnerships. These key steps are highlighted below. Identifying stakeholders – Reentry mapping partnerships must include stakeholders with expertise in mapping community level data, as well as stakeholders with backgrounds in dealing with the critical prisoner reentry issues in the community. Setting research priorities and identifying key issues – Reentry mapping partnerships typically involve collecting and mapping data while convening stakeholders and planning programmatic and public policy changes for their community. To keep these activities coordinated, stakeholders should agree on a common set of priorities early on in the process, and review them together on an ongoing basis. Obtaining corrections data – Data about former prisoners are typically available from the state Department of Corrections (DOC). In order to obtain the data, however, reentry mapping partners will likely have to make arrangements to ensure the confidentiality of this sensitive data. In addition, developing a good working relationship with the DOC is crucial in order to receive continued assistance in interpreting and using the data. Obtaining contextual data – Additional contextual data about communities, including basic demographic and economic data, is relatively easy to access from local research institutions or the U.S. Census. More detailed local data, especially information about community assets, can be obtained from other organizations or by conducting a data collection project. Creating maps – Maps depicting the concentration of released prisoners in communities are the foundation of reentry mapping partnerships. In order for maps to be useful to stakeholders, they must meet a set of criteria designed to ensure that they communicate effectively and are easy to interpret.
Sharing maps with stakeholders – Reviewing maps with stakeholders prior to their release will help ensure that they are responsive to the needs of the reentry mapping partnership. Using analysis results to inform action – As maps are produced, the reentry mapping partnership must come to a common understanding of what the key findings of the analysis are, and what the necessary actions are based on those findings. Creating a sustainable reentry mapping partnership – Reentry mapping partnerships that rely on a broad base of stakeholder participation are well positioned to leverage the data they collect and the relationships they establish to continue their work on addressing reentry challenges and developing effective solutions. SUMMARY The experiences of Winston-Salem, Milwaukee and Washington, DC establish a baseline of knowledge about reentry mapping which is useful for informing efforts by other jurisdictions to establish reentry mapping partnerships. Included in this baseline of knowledge is the lesson that this type of work is likely to require additional resources or the reallocation of existing ones. Any number of challenges, such as those related to obtaining data, have the potential to require some resource investment to overcome. Even in an ideal scenario where data is easily obtained and stakeholders are already well organized, there is much work to be done to translate research findings into action. In addition, the experiences in RMN communities reveal that obtaining and analyzing data, convening stakeholders and using data are all processes that are subject to unpredictable timelines. New reentry mapping partnerships should have some sense of urgency about their work, but must be able to move forward without unreasonable pressure or expectations about the timing of results. The prospects for continuing the reentry mapping work in Winston-Salem, Milwaukee and Washington, DC are good. The achievements of these three sites during the course of this project include some identifiable impact of reentry practices, and the development of the potential for much more policy relevant work in the future. In each of these communities it is encouraging that all three have obtained data and produced at least basic summary maps. It is also promising that stakeholders in each community are reviewing the maps, and have expressed that they are valuable and useful for their work. This project has generated many key lessons that can be applied in support of developing reentry-mapping partnerships in other cities. The experience in Winston-Salem, for example, demonstrates that potential reentry-mapping partnerships need not have already developed neighborhood data warehouses in order to get started with reentry mapping. And, as all three sites experienced, a commitment to building relationships with key stakeholders can yield benefits through all phases of the project to help reentry mapping partnerships achieve their goals.
Mapping Prisoner Reentry: An Action Research Guidebook
Nancy G. La Vigne, Ph.D. Jake Cowan
research for safer communities
RE
SE
AR
CH
R
EP
OR
T
S
EP
TE
MB
ER
2
00
5
URBAN INSTITUTE Justice Policy Center
Acknowledgments We wish to thank the many individuals who have provided advice and input in the preparation of this report. First and foremost, we thank the project staff from the three Reentry Mapping Network sites highlighted in this report: Sylvia Oberle and Mike Carmichael of the Center for Community Safety in Winston-Salem; Jake Cowan and Kathleen Mantilla in Washington, DC; and Michael Barndt, Jim Pingel, and Todd Clausen from Milwaukee. Tom Kingsley and Kathy Pettit of the Urban Institute shared their lessons learned from the National Neighborhood Indicators Partnership, which provided tremendous guidance on the development and operation of the Reentry Mapping Network, much of which is embodied in this report. Michelle Scott of he Urban Institute helped develop the content for the Creating Maps section of this guidebook. We also appreciate the constructive feedback on an earlier draft of this report provided by Lisa Brooks, Vera Kachnowski, and Jenny Osborne of the Urban Institute. Lastly, we thank Andrew Goldberg of the National Institute of Justice, who has kept us on task and whose employer generously funded this report.
URBAN INSTITUTE Justice Policy Center
2100 M Street NW
Washington, DC 20037
http://www.urban.org
© 2005 Urban Institute
This project was supported by grant # 2003-IJ-CX-1012 by the National Institute of Justice, U.S. Department of Justice. The opinions contained herein are those of the authors(s) and do not necessarily represent the official position of the United States Department of Justice, The Urban Institute, its trustees, or its funders.
i
Contents
EXECUTIVE SUMMARY ............................................................................................................................... IV
INTRODUCTION ............................................................................................................................................... 6
PRISONER REENTRY IN CONTEXT............................................................................................................ 8 HOUSING ........................................................................................................................................................... 8 EMPLOYMENT AND INCOME .............................................................................................................................. 8 SUBSTANCE AND ALCOHOL USE........................................................................................................................ 9 HEALTH............................................................................................................................................................. 9 FAMILIES AND CHILDREN .................................................................................................................................. 9
WHY MAP PRISONER REENTRY? ............................................................................................................. 10 WHERE ARE PRISONERS RETURNING?............................................................................................................. 10 ARE RESOURCES AND SERVICES ACCESSIBLE TO THOSE IN NEED?.................................................................10 WHAT ARE THE CHARACTERISTICS OF AREAS WITH HIGH CONCENTRATIONS OF RELEASEES? ...................... 12 HOW CAN MAPPING HELP MEASURE THE SUCCESS OF A REENTRY INTERVENTION? ...................................... 12
THE REENTRY MAPPING NETWORK: AN ACTION RESEARCH PARTNERSHIP......................... 14
IDENTIFYING STAKEHOLDERS ................................................................................................................ 17 COMMUNITY STAKEHOLDERS.......................................................................................................................... 18 CORRECTIONS AGENCIES................................................................................................................................. 18 LAW ENFORCEMENT........................................................................................................................................ 19 POLICYMAKERS ............................................................................................................................................... 19 SERVICE PROVIDERS........................................................................................................................................ 20 VICTIMS ADVOCATES ...................................................................................................................................... 21 OTHER NONPROFIT ORGANIZATIONS............................................................................................................... 21 UNIVERSITIES .................................................................................................................................................. 23
SETTING RESEARCH PRIORITIES............................................................................................................ 24 GETTING STARTED .......................................................................................................................................... 24 SETTING PRIORITIES ........................................................................................................................................ 25
Identifying Relevant Data .......................................................................................................................... 26 Understanding the Local Political Context................................................................................................ 26 Identifying Available Resources................................................................................................................. 26
GAINING MOMENTUM ..................................................................................................................................... 27 SUMMARY ....................................................................................................................................................... 28
OBTAINING REENTRY DATA ..................................................................................................................... 29 IDENTIFYING DATA SOURCES .......................................................................................................................... 29 DECIDING WHAT DATA TO REQUEST .............................................................................................................. 29 INTERPRETING THE DATA ................................................................................................................................ 32 OVERCOMING BARRIERS TO DATA ACQUISITION ............................................................................................ 33
OBTAINING CONTEXTUAL DATA............................................................................................................. 35 IDENTIFYING DATA ON THE COMMUNITY CONTEXT OF PRISONER REENTRY .................................................. 35
Demographic Data..................................................................................................................................... 35 Boundary Data........................................................................................................................................... 36
ii
Service Provider Data................................................................................................................................ 36 Local, State, and Federal Agency Data ..................................................................................................... 37
PRIMARY DATA COLLECTION ........................................................................................................................... 37 CREATING MAPS ........................................................................................................................................... 38
GEOCODING ACCURATELY .............................................................................................................................. 38 COMMUNICATING EFFECTIVELY WITH MAPS .................................................................................................. 40
Point Maps ................................................................................................................................................. 41 Thematic Maps........................................................................................................................................... 42 Density Maps ............................................................................................................................................. 44
AVOIDING COMMON MAPPING PITFALLS ........................................................................................................ 45 SHARING MAPS WITH STAKEHOLDERS ................................................................................................ 50
RECEIVING EARLY FEEDBACK......................................................................................................................... 50 BROKERING SENSITIVE CONVERSATIONS ........................................................................................................ 50
USING ANALYSIS RESULTS TO INFORM ACTION ............................................................................... 52 PROMOTING COMMUNITY EDUCATION AND AWARENESS ............................................................................... 52 GUIDING THE PLANNING AND IMPLEMENTATION OF REENTRY INITIATIVES .................................................... 52 INFLUENCING PUBLIC POLICY ......................................................................................................................... 56
CREATING A SUSTAINABLE REENTRY MAPPING PARTNERSHIP................................................. 57 PARTNERING WITH OTHER RELATED INITIATIVES ........................................................................................... 58
CONCLUSION .................................................................................................................................................. 60
REFERENCES .................................................................................................................................................. 61
APPENDIX A: THE REENTRY MAPPING NETWORK: CASE STUDIES FROM THREE SITES .... 66
APPENDIX B: RESULTS OF RMN PARTNERS SURVEY........................................................................ 90
APPENDIX C: POTENTIAL DEPARTMENT OF CORRECTIONS DATA AND ACCOMPANYING DATA CONFIDENTIALITY ISSUES ............................................................................................................ 92
APPENDIX D: SAMPLE DATA REQUEST.................................................................................................. 95
APPENDIX E: SUGGESTED ASSET MAPPING PROTOCOL................................................................. 96
iii
Executive Summary The Reentry Mapping Network (RMN) is a partnership among community-based organizations and the Urban Institute designed to create community change through the mapping and analysis of neighborhood-level data related to prisoner reentry. RMN partners collect and analyze local data related to incarceration, reentry, and community well-being; develop policy options based on the findings; and document their accomplishments and lessons learned. This guidebook provides information on how to understand and address prisoner reentry at the community level through mapping and analysis. It describes the concepts and methods underlying the RMN so that other jurisdictions can learn from these experiences in the interests of crafting more effective and successful reentry strategies in their communities. The key steps to doing so are highlighted below. Identifying stakeholders – Reentry mapping partnerships must include stakeholders with expertise in mapping community level data, as well as stakeholders with backgrounds in dealing with the critical prisoner reentry issues in the community. Setting research priorities and identifying key issues – Reentry mapping partnerships typically involve collecting and mapping data while convening stakeholders and planning programmatic and public policy changes for their community. To keep these activities coordinated, stakeholders should agree on a common set of priorities early on in the process, and review them together on an ongoing basis. Obtaining corrections data – Data about former prisoners are typically available from the state Department of Corrections (DOC). In order to obtain the data, however, reentry mapping partners will likely have to make arrangements to ensure the confidentiality of this sensitive data. In addition, developing a good working relationship with the DOC is crucial to receiving continued assistance in interpreting and using the data. Obtaining contextual data – Additional contextual data about communities, including basic demographic and economic data, are relatively easy to access from local research institutions or the U.S. Census. More detailed local data, especially information about community assets, can be obtained from other organizations or by conducting a data collection project. Creating maps – Maps depicting the concentration of released prisoners in communities are the foundation of reentry mapping partnerships. In order for maps to be useful to stakeholders, they must meet a set of criteria designed to ensure that they communicate effectively and are easy to interpret. Sharing maps with stakeholders – Reviewing maps with stakeholders prior to their release will help ensure that these maps meet the needs of the reentry mapping partnership. Using analysis results to inform action – As maps are produced, the reentry mapping partnership must come to a common understanding of the key findings resulting from the analysis and the necessary actions based on those findings.
iv

Creating a sustainable reentry mapping partnership – Reentry mapping partnerships that rely on a broad base of stakeholder participation are well positioned to leverage the data they collect and the relationships they establish to continue their work on addressing reentry challenges in their communities.
v
Introduction The importance of understanding and addressing prisoner reentry at the community level cannot be overstated. With a large and growing number of prisoners released each year from state and federal correctional institutions, prisoner reentry poses numerous community challenges, including an increased risk to public safety and the limited availability of jobs, housing, and social services for returning prisoners. Moreover, today’s intense cycle of arrest, removal, incarceration, and reentry—at levels four times higher than 20 years ago—has had a disparate impact on a relatively small number of communities around the country where policies related to incarceration and reentry are experienced most acutely. Over the past decade, a rising number of released prisoners have returned disproportionately to major metropolitan areas. In Maryland in 2001, for example, 59 percent of prisoners who were released in the state returned to the City of Baltimore. Within Baltimore, released prisoners were even more concentrated, with 30 percent returning to just six neighborhoods.1 Similar concentrations have been observed in several other major metropolitan areas.2 These studies have also documented that the communities receiving the highest numbers of returning prisoners are often among the least able to provide the needed support for successful reintegration.3
Given the local context of prisoner reentry, it is particularly important for communities to have a clear spatial understanding of the characteristics of reentry within their jurisdictions. Mapping is one of the most powerful means of capturing important concentrations, patterns, and spatial trends in data, especially as they relate to community well-being.4 Maps graphically illustrate underlying concentrations and patterns that clarify the ways in which social phenomena, such as prisoner reentry, affect communities. Accordingly, strategies to tackle problems resulting from prisoner reentry can be more effective when they are informed by the mapping of such information as the locations of returning prisoners, reentry services and resources, and parole offices.
Mapping any local phenomenon, however, requires local data. Institutions in a number of cities have successfully built data systems detailing numerous indicators of community well-being that have served to engage their community in local policymaking and community development.5 Applying this model to the issue of prisoner reentry, the Urban Institute established the Reentry Mapping Network (RMN), a group of jurisdictions6 applying a data-driven, spatial approach to prisoner reentry. The goal of the RMN is fourfold:
1 La Vigne and Kachnowski, 2003 2 La Vigne and Mamalian, 2003; La Vigne and Thomson, 2004. 3 La Vigne and Kachnowski, 2003; La Vigne and Mamalian, 2003; La Vigne and Thomson, 2004. 4 Kingsley et al., 1997. 5 Bailey et al., 2000. 6 RMN partner cities include Denver, CO, Des Moines, IA, Hartford, CT, Indianapolis, IN, Louisville, KY, Milwaukee, WI, Oakland, CA, Providence, RI, San Diego, CA, Seattle, WA, Washington, DC, and Winston-Salem, NC.
6
1. To develop a better understanding of the dynamics and correlates of prisoner reentry at the local level;
2. To engage local stakeholders and practitioners in developing strategies to address
reentry-related challenges;
3. To facilitate greater coordination and collaboration among state and local agencies and organizations around this work; and
4. To promote peer learning on how communities can use data to identify and address
incarceration and reentry-related challenges. The purpose of this guidebook is to describe the concepts and methods underlying the RMN so that other jurisdictions can learn from these experiences and replicate the network’sefforts in the interests of crafting more effective and successful reentry strategies at the community level. This guidebook specifically documents the strategies employed by three of the RMN partners based in Washington, DC, Winston-Salem, NC, and Milwaukee, WI (see Appendix A for detailed case studies of each of these three sites). The first section outlines the history and key concepts of mapping prisoner reentry and describes the origins of the RMN and how it operates. We then turn to a step-by-step guide to the various components associated with the development of a data-driven, community-based prisoner reentry effort. Specifically, the guidebook discusses the identification of potential partners in the community and identifies strategies to engage these partners in efforts to inform policymaking and community-building efforts. It then describes the steps associated with collecting, mapping, analyzing, and presenting data. The remaining steps offer detailed guidance for using maps and analysis results to aid in the development of reentry programs and policy efforts, and present strategies for how to build efforts that are sustainable over time.
Throughout the guidebook, efforts are made to provide concrete examples from the RMN sites’ experiences. It is hoped that these examples, along with a “how to” approach to reentry mapping, will provide practical and useful information to communities throughout the country that are interested in developing more informed and effective local responses to prisoner reentry.
7

Prisoner Reentry in Context
When launching a reentry mapping effort, it is often necessary to encourage consensus among prospective agency and community partners regarding why prisoner reentry is a public policy concern and how it can have a far-reaching implications, not just for the individuals being released from prison and their friends and families, but also for the communities to which they return. This issue is particularly important given that, to many casual observers, “prisoner reentry” may appear to be simply a new name for something that has been occurring since the first prisoners were incarcerated in this county over three centuries ago. Indeed, roughly 95 percent of people incarcerated in state and federal prisons are eventually released.7 Yet prisoner reentry today presents new and greater challenges for a number of reasons.8 First, prisoners are being incarcerated and released at historic volumes: Approximately 656,000 people were released from state and federal prisons in 2003 alone,9 a fourfold increase in the past two decades. The sheer magnitude of released offenders has a direct impact on public safety when one considers the odds of their reoffending: Two-thirds of released prisoners will be rearrested and half of them will likely return to prison within three years of their release.10 Prisoners are also less prepared for reentry than in previous years, with a smaller share of prisoners taking part in educational and substance abuse treatment programs.11 This limited program participation is particularly problematic given that most released prisoners return home with low levels of human capital and significant challenges, including those illustrated below. Housing The housing options for ex-prisoners who cannot rely on family and friends are limited. Federal laws prohibit many former prisoners from entering public housing and federally funded housing programs. Instead, former prisoners without family support must rely on halfway houses, housing programs, the private market (where affordability and availability may be highly restrictive), and homeless shelters. For example, a study found that 11.4 percent of prisoners returning to New York City from 1995 to 1998 entered a homeless shelter within two years of their release.12 The Bureau of Justice Statistics found similar findings in a 1997 study, which indicated that roughly 13 percent of prisoners who were scheduled to be released in the next year had been homeless at some time during the year prior to their arrest.13
Employment and Income Many former prisoners have unstable employment histories and lack job skills. According to a study published in 2003, between 21 and 38 percent of state prisoners were unemployed just prior to their arrest.14 Among those who were employed prior to arrest, more than one-third reported monthly incomes of less than $1,000. Approximately 40 percent of state and federal
7 Hughes and Wilson, 2005. 8 For an overview of the challenges of prisoner reentry, see Travis et al., 2001. 9 Harrison and Beck, 2005. 10 Langan and Levin, 2002. 11 Lynch and Sabol, 2001. 12 Metraux and Culhane, 2004. 13 Mumola, 2000. 14 Harlow, 2003.
8
prisoners in 1997 had not completed high school or attained a GED.15 Adding to these barriers, ex-prisoners often lack the necessary identification to secure employment; are legally prohibited from certain types of jobs; and are faced with a decreasing availability of low-skill jobs.
Substance and Alcohol Use Many prisoners face difficulties with substance abuse upon release. A 1999 study reports that roughly 40 percent of prisoners were admitted for drug-related convictions. Nearly two-thirds of prisoners reported a history of substance abuse, and 52 percent of prisoners reported consuming drugs and/or alcohol at the time of their arrest.16
Health Released prisoners suffer disproportionately from health-related problems and can pose health risks to their family members, intimate partners, and communities. Prisoners experience infectious diseases such as HIV/AIDS, hepatitis C, and tuberculosis (TB) at rates five to ten times higher than those of the general public;17 16 percent are estimated to suffer from mental illness.18 These illnesses may also hinder a released prisoner’s ability to secure employment.
Families and Children More than half of state prisoners are parents of minor children. Maintaining contact during incarceration and reunification with family members upon release can pose significant challenges. Former prisoners may have lost custody of their children during their incarceration period, and are faced with a complex legal process before reunification is even possible. Further, child support obligations add to these difficulties. One study of the Massachusetts prison and parole population found that nearly 25 percent of prisoners owed an average of $17,000 in child support arrearages upon release.19
These problems are compounded by the fact that prisoners return disproportionately to metropolitan areas, 20 and even within those areas, they are often concentrated in a handful of neighborhoods that are among the least able to provide support and assistance. 21 Incarceration and reentry are significantly altering the social and economic landscapes within these neighborhoods. Knowledge of these concentrations is critical to ensuring that sufficient and effective support is targeted to the communities where the costs and consequences of incarceration and reentry are experienced most acutely. We now turn to a discussion of how mapping and analyzing reentry related information is useful in the development of community-level prisoner reentry efforts.
15 Harlow, 2003. 16 Mumola, 1999. 17 Hammett and Kennedy, 2001. 18 Ditton 1999, in NCCHC, 2002. 19Thoennes, 2002. 20 Lynch and Sabol, 2001. 21 La Vigne and Kachnowski, 2003; La Vigne and Mamalian, 2003; La Vigne and Thomson, 2003.
9
Why Map Prisoner Reentry? Clearly, prisoner reentry is an important phenomenon affecting individuals and communities in many ways. However, the patterns and distribution of reentry are not well understood, and a greater knowledge of them could enable local policymakers and service providers to develop more effective interventions. Prior research informs us of reentry patterns and correlates in general, but mapping can provide a more detailed illustration of the reentry phenomenon and can help guide policy development at the local level. The utility of reentry mapping is best illustrated through the types of questions this method might help answer. Where Are Prisoners Returning? Analyses of prisoner reentry that are limited to the county or city level may obscure important patterns and trends occurring within the community. Mapping can help identify areas that experience high concentrations of prisoners returning home. For example, by mapping the last known addresses of released prisoners, one can pinpoint concentrations within cities and neighborhoods, right down to the city block. This information can provide local policymakers and community organizers with the capacity to target intervention efforts and resources in the areas that most need them. And, because the use of a Geographic Information System (GIS) enables spatial analysis across a variety of variables of interest, one can map not only where prisoners are returning, but may also explore what types of prisoners are returning to specific neighborhoods. For example, one could map released prisoners based on whether they are under post-release supervision. Those under supervision are more likely to be monitored and to have access to programs and services than their counterparts who are released unconditionally. This difference can have implications for service delivery, in that if unsupervised releasees are located in certain clusters within a city, services could be targeted to those locations. Are Resources and Services Accessible to Those in Need? One of the most useful applications of spatial analysis as a policy tool is the generation of maps to guide resource allocation. Mapping released prisoners in conjunction with services available to them can illustrate areas containing adequate services in close proximity to where the majority of prisoners return. Such mapping can also detect a “service delivery mismatch,” in which services exist but are not easily accessible. Figure 1 illustrates one such example: only 24 percent of the organizations that provide a range of services to former prisoners—employment, housing, drug treatment, or some combination of these support services—fell within the six neighborhoods that are home to the highest concentrations of returning prisoners within the City of Chicago.22
22 La Vigne and Mamalian, 2003.
10
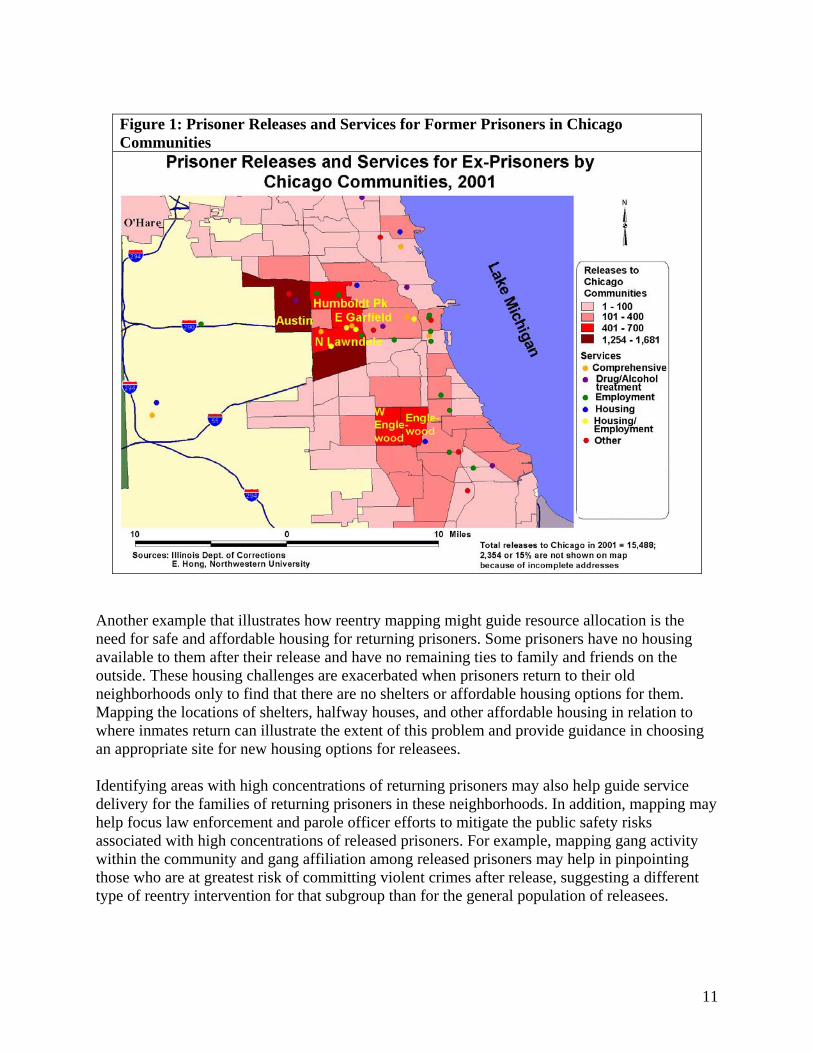
Figure 1: Prisoner Releases and Services for Former Prisoners in Chicago Communities
Another example that illustrates how reentry mapping might guide resource allocation is the need for safe and affordable housing for returning prisoners. Some prisoners have no housing available to them after their release and have no remaining ties to family and friends on the outside. These housing challenges are exacerbated when prisoners return to their old neighborhoods only to find that there are no shelters or affordable housing options for them. Mapping the locations of shelters, halfway houses, and other affordable housing in relation to where inmates return can illustrate the extent of this problem and provide guidance in choosing an appropriate site for new housing options for releasees. Identifying areas with high concentrations of returning prisoners may also help guide service delivery for the families of returning prisoners in these neighborhoods. In addition, mapping may help focus law enforcement and parole officer efforts to mitigate the public safety risks associated with high concentrations of released prisoners. For example, mapping gang activity within the community and gang affiliation among released prisoners may help in pinpointing those who are at greatest risk of committing violent crimes after release, suggesting a different type of reentry intervention for that subgroup than for the general population of releasees.
11
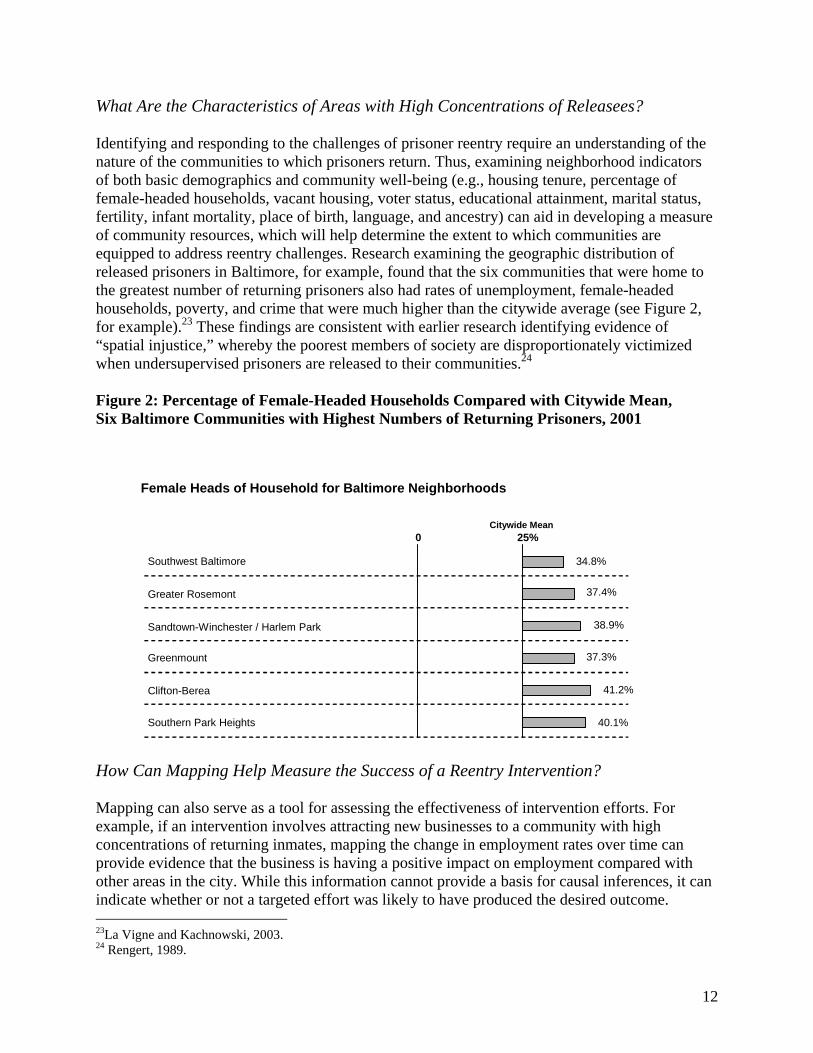
What Are the Characteristics of Areas with High Concentrations of Releasees? Identifying and responding to the challenges of prisoner reentry require an understanding of the nature of the communities to which prisoners return. Thus, examining neighborhood indicators of both basic demographics and community well-being (e.g., housing tenure, percentage of female-headed households, vacant housing, voter status, educational attainment, marital status, fertility, infant mortality, place of birth, language, and ancestry) can aid in developing a measure of community resources, which will help determine the extent to which communities are equipped to address reentry challenges. Research examining the geographic distribution of released prisoners in Baltimore, for example, found that the six communities that were home to the greatest number of returning prisoners also had rates of unemployment, female-headed households, poverty, and crime that were much higher than the citywide average (see Figure 2, for example).23 These findings are consistent with earlier research identifying evidence of “spatial injustice,” whereby the poorest members of society are disproportionately victimized when undersupervised prisoners are released to their communities.24
Figure 2: Percentage of Female-Headed Households Compared with Citywide Mean, Six Baltimore Communities with Highest Numbers of Returning Prisoners, 2001
Female Heads of Household for Baltimore Neighborhoods
Citywide Mean25%0
Southwest Baltimore 34.8%
Greater Rosemont 37.4%
Sandtown-Winchester / Harlem Park 38.9%
Greenmount 37.3%
Clifton-Berea 41.2%
Southern Park Heights 40.1%
How Can Mapping Help Measure the Success of a Reentry Intervention? Mapping can also serve as a tool for assessing the effectiveness of intervention efforts. For example, if an intervention involves attracting new businesses to a community with high concentrations of returning inmates, mapping the change in employment rates over time can provide evidence that the business is having a positive impact on employment compared with other areas in the city. While this information cannot provide a basis for causal inferences, it can indicate whether or not a targeted effort was likely to have produced the desired outcome. 23La Vigne and Kachnowski, 2003. 24 Rengert, 1989.
12
The examples of reentry mapping applications described above underscore the importance and value of understanding the effects of incarceration and reentry on communities. It is important to note, however, that maps themselves are not the end goal of a reentry program. To the contrary, the maps generated should be used in concert with other analysis tools to help launch a community conversation, to engage stakeholders, and to generate support for the creation of new resources—and the targeting of existing ones—where they will be most effective. The promise that mapping holds for developing effective responses to prisoner reentry is what led to the development of the Reentry Mapping Network, the history and structure of which is described in the following section.
13

The Reentry Mapping Network: An Action Research Partnership In recent years, mapping has become increasingly popular among law enforcement officials and criminologists.25 In many cases, these mapping efforts embody “action research” partnerships. Action research diverges from the traditional research model by producing action that addresses problems of practical importance.26 To increase the likelihood and efficacy of resulting action, action researchers partner with the people who are directly affected by the problem under study in order to design, implement, and interpret the research.27 The action research model is mutually beneficial, in that researchers can produce more well-informed and useful findings, and local efforts can be strengthened by the involvement of an external party that can provide support through management, research, and/or evaluation. External parties can fill any gaps in local partners’ technical expertise, knowledge of the problem studied, or knowledge of best practices and lessons learned from the literature. Also, external parties’ perspectives can contribute new insights to old problems and greater objectivity in assessing the project’s progress and accomplishments. In the mid-1990s, a new model for action research emerged. Organizations in several communities throughout the country began to assemble neighborhood-level data and then help community actors apply this information to motivate positive change in distressed areas and aid in program and policy development. 28 In order to learn from each other and promote the model to other cities, these organizations joined together with the Urban Institute in 1996 to form the National Neighborhood Indicators Partnership (NNIP). 29 Using data describing various conditions and trends at the neighborhood level to identify spatial patterns of problems and opportunities, these institutions have engaged their communities on issues ranging from welfare reform to vacant housing to public health.30 Applying this successful NNIP model to the topic of prisoner reentry, the Urban Institute in 2001 began efforts to develop the Reentry Mapping Network,31 a partnership working to strengthen communities’ capacities to understand and address local problems related to prisoner reentry. The Urban Institute designed the network to assist and advise sites in the use of mapping to pinpoint neighborhoods experiencing high concentrations of returning prisoners, as well as to develop strategies for communities to address the challenges that prisoner reentry creates. Partners were selected through a review of their existing data collection and analysis capabilities, the reentry issue they planned to explore, and their experience in working with community organizations and local agencies on developing action agendas. The RMN partners joined the
25 Karappunnan, 2005. 26 Gilmore, 1986; Lewin, 1946. 27 McEwen, 1999. 28 Bailey et al., 2000. 29 Currently there are 26 NNIP partners: Atlanta, Baltimore, Boston, Camden, Chattanooga, Chicago, Cleveland, Columbus, Dallas, Denver, Des Moines, Hartford, Indianapolis, Los Angeles, Louisville, Miami, Milwaukee, Memphis, Nashville, New Orleans, Oakland, Philadelphia, Providence, Sacramento, Seattle, and Washington. For more information on NNIP, see http://www.urban.org/nnip/index.htm. 30 The Urban Institute, 1999 31 RMN partner cities include Denver, CO; Des Moines, IA; Hartford, CT; Indianapolis, IN; Louisville, KY; Miami, FL; Milwaukee, WI; Oakland, CA; Providence, RI; San Diego, CA; Seattle, WA; Washington, DC; and Winston-Salem, NC. RMN also has two affiliate sites: Pittsburgh, PA, and Newark, NJ.
14
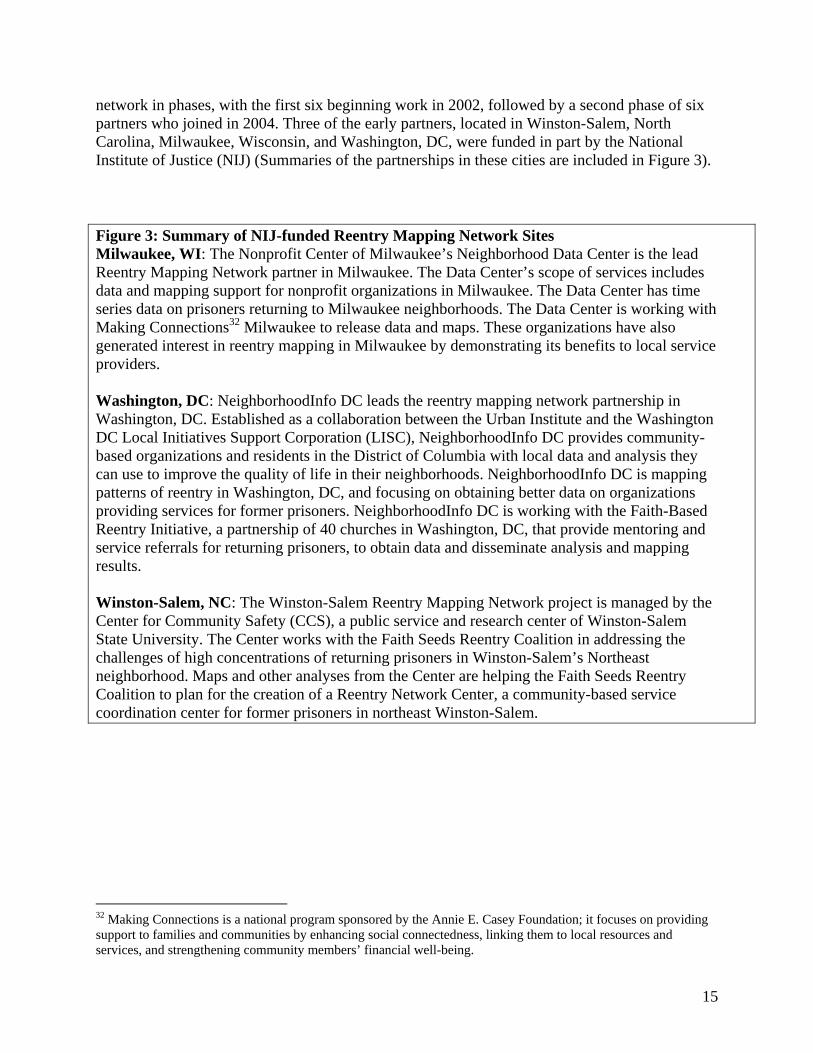
network in phases, with the first six beginning work in 2002, followed by a second phase of six partners who joined in 2004. Three of the early partners, located in Winston-Salem, North Carolina, Milwaukee, Wisconsin, and Washington, DC, were funded in part by the National Institute of Justice (NIJ) (Summaries of the partnerships in these cities are included in Figure 3). Figure 3: Summary of NIJ-funded Reentry Mapping Network Sites Milwaukee, WI: The Nonprofit Center of Milwaukee’s Neighborhood Data Center is the lead Reentry Mapping Network partner in Milwaukee. The Data Center’s scope of services includes data and mapping support for nonprofit organizations in Milwaukee. The Data Center has time series data on prisoners returning to Milwaukee neighborhoods. The Data Center is working with Making Connections32 Milwaukee to release data and maps. These organizations have also generated interest in reentry mapping in Milwaukee by demonstrating its benefits to local service providers. Washington, DC: NeighborhoodInfo DC leads the reentry mapping network partnership in Washington, DC. Established as a collaboration between the Urban Institute and the Washington DC Local Initiatives Support Corporation (LISC), NeighborhoodInfo DC provides community-based organizations and residents in the District of Columbia with local data and analysis they can use to improve the quality of life in their neighborhoods. NeighborhoodInfo DC is mapping patterns of reentry in Washington, DC, and focusing on obtaining better data on organizations providing services for former prisoners. NeighborhoodInfo DC is working with the Faith-Based Reentry Initiative, a partnership of 40 churches in Washington, DC, that provide mentoring and service referrals for returning prisoners, to obtain data and disseminate analysis and mapping results. Winston-Salem, NC: The Winston-Salem Reentry Mapping Network project is managed by the Center for Community Safety (CCS), a public service and research center of Winston-Salem State University. The Center works with the Faith Seeds Reentry Coalition in addressing the challenges of high concentrations of returning prisoners in Winston-Salem’s Northeast neighborhood. Maps and other analyses from the Center are helping the Faith Seeds Reentry Coalition to plan for the creation of a Reentry Network Center, a community-based service coordination center for former prisoners in northeast Winston-Salem.
32 Making Connections is a national program sponsored by the Annie E. Casey Foundation; it focuses on providing support to families and communities by enhancing social connectedness, linking them to local resources and services, and strengthening community members’ financial well-being.
15
The three NIJ-funded partners form the basis for the remainder of this report, which outlines a guide for replicating the RMN approach in other communities. This approach is informed by a series of key steps that are necessary in creating an action research partnership focused on mapping prisoner reentry (see Figure 4), as well as, by previous research, applying action research to a variety of topics (e.g., neighborhood health33 and welfare reform34). Figure 4: Reentry Mapping Partnership Action Steps 1. Identifying stakeholders 2. Setting research priorities 3. Obtaining corrections data 4. Obtaining contextual data 5. Creating maps 6. Sharing maps with stakeholders 7. Using analysis results to inform action 8. Creating a sustainable reentry mapping partnership When reviewing these steps, it is important to note that they are not intended to be a linear, progressive set of tasks. Rather, many of these tasks should be set in motion concurrently, and in some cases the order in which these components of the initiative are implemented depends on local conditions and politics. Moreover, the experience of the partners in the Reentry Mapping Network has been that, once set into motion, work on each of these tasks continues as long as the reentry mapping partnership is active. There is always a need to identify new stakeholders, to get more data, and to reevaluate priorities.
33 Pettit et al., 2003. 34 Turner et al., 1999.
16
Identifying Stakeholders Perhaps the most critical decision for any new action research initiative is to identify who the key stakeholders are within the community. While the list of stakeholders will vary by locality, at a minimum, both the “action” and the “research” capabilities must be represented in the reentry partnership. The partnership should include individuals with a background in or familiarity with prisoner reentry issues who can connect the research findings to crucial funding, program, and public policy decisions that affect former prisoners. It is also critical for the partnership to include an organization or individual with expertise in creating maps and working with neighborhood-level data sets. With regard to recruitment of both types of stakeholders, the RMN partners highlighted in this report found that additional participants became interested in joining the reentry mapping partnership after seeing some of the initial maps and analysis results produced, which helped them develop a better understanding of the utility of mapping prisoner reentry. Because of this ongoing influx of new stakeholders, it is important to periodically evaluate the stakeholders involved in the partnership to determine whether the appropriate interests are represented. Exclusion of key organizations or individuals may create a difficult environment for collaborating to change policies or make program and funding decisions. An effective reentry mapping effort also requires one organization or individual to take a lead role in convening the partnership. This process is important for developing and gaining momentum for the partnership, as well as identifying a single point of contact for any outside inquiries or media outreach. The lead organizations in Milwaukee, Washington, and Winston-Salem all have a research orientation, but they also have a range of other capacities. In Milwaukee, the Nonprofit Center of Milwaukee includes a number of community service and outreach programs, in addition to the capacities housed within their data center. In Washington, DC, NeighborhoodInfo DC is partnership between a research institution and a community development intermediary. The Center for Community Safety in Winston-Salem is part of Winston-Salem State University. While the lead role can be assumed by any type of stakeholder (e.g., community-oriented or research-oriented), it is important that all groups and individuals who stand to be affected by changes in reentry policy and practice be represented and (ideally) actively participate in the partnership. Equally important to having a lead agency is the need for an early champion for the reentry partnership. This champion could take the form of a charismatic individual (e.g., the head of an agency or advocacy group) or an influential foundation or advocacy group. The nature of the champion is less important than the fact that some individual or organization with power, influence, and connections is on board to help get the ball rolling and encourage other key stakeholders to participate. Figure 5 lists potential stakeholders for a reentry mapping partnership. More details about the types of stakeholders to recruit and what they bring to the partnership are illustrated below.
17

Figure 5: Potential Stakeholders for a Reentry Mapping Partnership • Community Stakeholders • Corrections Agencies • Law Enforcement • Policymakers • Service Providers • Victims Advocates • Other Nonprofit Organizations • Universities Community Stakeholders Community stakeholders include former prisoners and their families, businesses, faith-based organizations, local public representatives, and other individuals and organizations affected by prisoner reentry. These are the groups that experience the challenges of prisoner reentry on a day-to-day basis in the community. As such, the reentry mapping partnership should encourage their participation as much as possible. Each of these stakeholders should play a role in advocating for and implementing policy, program, or funding decisions that are proposed by the partnership. Any of these community stakeholders (or some collaboration across these stakeholders) are also potential leaders for a reentry mapping partnership. Community stakeholders can initiate discussions and reach agreements with research organizations to perform the necessary research work, as well as convene other stakeholders to review the research and act on its findings. Corrections Agencies Both institutional and community corrections agencies are natural partners in any reentry initiative. Departments of Correction (DOCs) are the obvious source of address-level data needed to generate maps depicting reentry in communities. Community supervision departments may also have access to data on the addresses of returning prisoners.35 Several Reentry Mapping Network partners have spent significant time working with both types of agencies to understand and correctly interpret the data they receive. The role of these departments in a reentry partnership, however, should not be restricted to that of data provider. As an active participant in a reentry mapping partnership, corrections and supervision agencies can provide input about what they are currently doing with regard to both pre- and post-release reentry assistance, as well as what new policies and programs they are considering to help returning prisoners before their release. Ideally, these agencies will actively seek opportunities to make policy and program decisions in collaboration with the community. In fact, a corrections or supervision agency may even be a lead participant in a community reentry mapping initiative. Some are already using mapping for tasks such as assigning caseloads to
35 These data, however, are usually limited to only those prisoners who are released under some form of parole or community supervision and thus leave out an important subgroup of returning prisoners.
18
probation and parole officers.36 Using mapping in the context of community reentry planning may be a natural extension of the work in which the agency is already engaged. Law Enforcement The primary mission of law enforcement is to maintain peace and order and provide for a safe environment. Thus, the most compelling argument for police involvement in prisoner reentry is that a significant share of former prisoners present a threat to that mission by committing new crimes in the community. As such, police have a natural role in reentry because making contact with former prisoners is part of their everyday business. In fact, arrest rates for former prisoners are 30 to 45 times higher than those for the general population.37 Police agencies stand to benefit from their involvement in reentry because successful efforts to reduce crime among released prisoners can, by definition, prevent future crimes and help improve community perceptions of the police, which could ultimately improve police legitimacy in the public’s eyes.38 Moreover, reentry initiatives fit well within the community policing model, which typically focuses on solving the underlying cause of a crime problem through partnerships with local businesses, residents, government agencies, and other community stakeholders.39 Prior research has found that these types of proactive crime prevention partnerships can also yield long-term crime reduction benefits.40
Just as police can benefit from involvement in reentry, so too can those engaged in reentry efforts gain from police participation. Many reentry partnerships are focused on helping returning prisoners access services, obtain housing, and find employment; police involvement sends the message that these initiatives are by no means “soft on crime” because, in addition to the support they provide, the programs also carry with them the distinct threat of rearrest. Police involvement in reentry can also aid community corrections efforts by serving as additional eyes and ears on the street, enhancing both the surveillance and assistance functions of community supervision. Police can aid in restorative justice efforts by serving as intermediaries between victims and offenders. Finally, from an analysis perspective, most police departments are already using GIS to map crime locations, which then helps them to allocate patrols, identify crime hot spots, and develop crime prevention interventions.41 Given this pre-existing GIS capacity, the police department is a prime candidate for providing the mapping support needed to create reentry maps. Policymakers Policymakers are another key partner in a reentry mapping effort, particularly if the initiative is focused around implementing changes in state statutes or administrative procedures. State agencies (and to a lesser extent, federal agencies) provide funding and oversight for many programs and services accessed by returning offenders. These programs can include workforce
36 Karappunnan, 2005. 37 Rosenfeld et al., 2005. 38 This increased legitimacy can yield great benefits, as the public will be more willing to report crimes and engage in community crime prevention activities (Tyler, 2004; Sunshine and Tyler, 2003; Tyler and Hou, 2002). 39 For more information on the role of community policing in prisoner reentry initiatives, see La Vigne et al., 2005. 40 Wilson and Kelling, 1987; Kelling and Coles, 1996. 41 Mamalian and La Vigne, 1999.
19

development programs, food stamps, and cash assistance benefits (TANF). Locally, city governments also administer such programs and services as homeless shelters, transitional housing, substance abuse treatment, and health care. Policymakers in the executive and legislative branches of government also make decisions on a regular basis about how funds are appropriated to support these programs and services, as well as how they are administered and delivered. While some policymakers may be more familiar with the challenges associated with prisoner reentry than others, all of them can benefit from better data to inform their decisions about these programs and services. Thus, the key role for policymakers in a reentry mapping partnership is to implement policy, program, and funding decisions that are informed by the data presented in reentry maps. Policymakers should be welcomed to participate in reviewing and interpreting reentry maps, alongside their constituents. A clearer understanding of reentry challenges and how they vary from neighborhood to neighborhood enables policymakers to target resources more effectively. Service Providers As mentioned earlier in this report, returning prisoners face a number of challenges when returning home, including a shortage of housing, substance abuse treatment, and mental health services (Figure 6 includes a list of types of services accessed by returning prisoners). Organizations providing these services can benefit from participating in a reentry mapping partnership in at least two ways: (1) they will learn in much more specific detail about the location and characteristics of the population they serve; and (2) they will connect with other service providers in reviewing the information, creating an opportunity for collaboration in providing services with a targeted, coordinated effort. Service provider stakeholders might include both government agencies and nonprofit organizations that provide services (e.g. housing assistance, job training) specifically to returning prisoners, as well as those that provide services to a broader population of which former prisoners could be a subset. Figure 6: Services Accessed by Returning Prisoners • General, Dental, and Vision Health Practice • Substance Abuse Treatment and Rehabilitation • Mental Health Services • Family Counseling and Reunification • Legal Services • Credit Counseling and Repair • Transitional and Permanent Housing Placement • Food Security (e.g., access to Food Stamp benefits, finding soup kitchens) • Job Training, Adult Basic Education, Literacy Services • Job Placement, Interview Coaching, Professional Clothing Assistance • Transportation Assistance Participation in the reentry mapping partnership can come from any level of an organization providing services for returning prisoners. Staff members at an executive or other leadership level of service provision have a valuable contribution to make by helping to connect the reentry mapping partnership to other stakeholders, especially other service providers and policymakers.
20

Case workers or other line-level staff also have an important contribution to the reentry mapping partnership because they can add qualitative context to the interpretation of maps and other analysis. Line staff who interact directly with former prisoners on a frequent basis are also able to provide insight about how to respond to reentry challenges identified and quantified through maps and other analysis. At a practical level, service providers are also top candidates to provide some level of leadership support to a reentry mapping partnership. They tend to have a number of relationships with other potential stakeholders in the reentry mapping partnership, and thus are well positioned to help with convening and coordinating efforts among like organizations. Victims Advocates Having been directly affected by crime, victims are an important group that can provide input on reentry-related community efforts. Victims have many rights that allow them to participate in prisoners’ release to the community,42 including:
• The right to be informed about parole-related events and proceedings; • The right to be heard on matters relating to the offender’s parole and related
incidents; • The right to be present at parole proceedings; and • The right to an order for restitution as a condition of parole.
Many people erroneously believe that victim participation in these processes results in negative outcomes for prisoners.43 Yet victims share the same goal as other partners in a reentry effort: to prevent future victimization by released prisoners. Toward this end, victims can contribute important, offender-specific information to standard reentry plans. Some victims know their offenders well (e.g., victims of domestic violence and sexual assault by friends or acquaintances) and, because the communities in which victims reside and prisoners return are often the same, victims may have helpful insights about how to manage the risks inherent in the circumstances to which the prisoners return. Other Nonprofit Organizations In addition to the service provider community discussed above, other nonprofit organizations in the community have the potential to play a lead role in a reentry mapping partnership, regardless of their prior experience with the topic of prisoner reentry. In fact, the majority of the Reentry Mapping Network’s lead partners are nonprofit organizations that had little or no background in prisoner reentry prior to their involvement in the Network. Yet taking on this issue is a natural extension of the work in which they were already engaged. For example, the Data Center at the Nonprofit Center for Milwaukee has a long history of leading action research–oriented projects, including a lead poisoning abatement program. The Nonprofit Center conducts research on Milwaukee neighborhoods, with a specific focus on strategies for improving the quality of life for families and individuals in distressed neighborhoods. These distressed neighborhoods were the same neighborhoods to which many released prisoners were returning; so there was a natural
42 Herman and Wasserman, 2001. 43 Shapiro, 1997 and Staples, 1997, as cited in Herman and Wasserman, 2001.
21
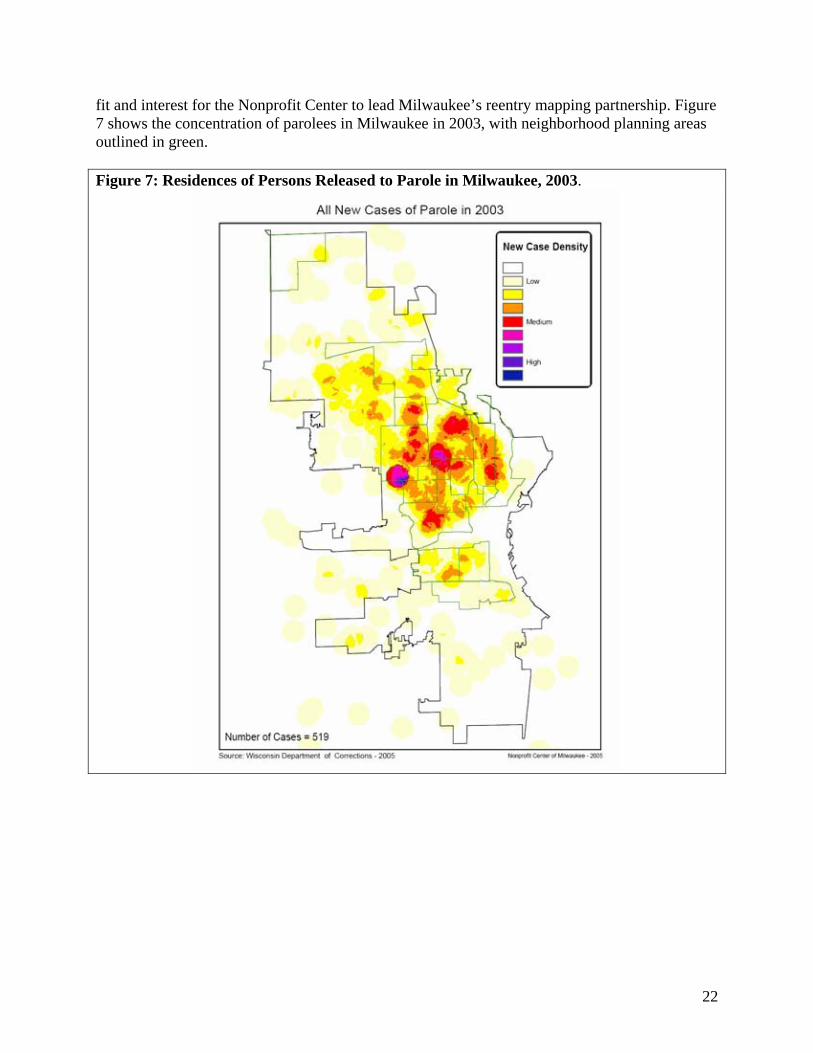
fit and interest for the Nonprofit Center to lead Milwaukee’s reentry mapping partnership. Figure 7 shows the concentration of parolees in Milwaukee in 2003, with neighborhood planning areas outlined in green. Figure 7: Residences of Persons Released to Parole in Milwaukee, 2003.
22
Universities Universities are potential stakeholders in a reentry mapping partnership both because they are logical candidates to provide mapping and analytic support to the partnership, and also because many universities have strong relationships within their communities. In some cases, universities may also be positioned to lead a reentry mapping partnership, particularly if they have funding available to support their involvement. The Center for Community Safety in Winston-Salem is affiliated with Winston-Salem State University and coordinates multiple community-based initiatives. In addition, several staff members also teach at the university or facilitate service-learning and internship activities.
23
Setting Research Priorities After convening the relevant stakeholders, the reentry mapping partnership must determine a specific area of reentry on which to focus. This process involves educating all stakeholders so that they are equally informed about the nature of the issues, as well as deciding on the scope and nature of the reentry project they plan to undertake. These and other considerations associated with setting priorities for a reentry mapping partnership are described below. Getting Started Early in the convening of partners, some stakeholders likely may not have experience with mapping, while others may have limited experience with the criminal justice system. Thus, it is important that stakeholders begin deliberations with the same base knowledge about the issue in order for all parties to actively participate in the partnership from its inception. Each of the partners in Milwaukee, Washington, DC, and Winston-Salem held at least one early meeting with stakeholders during which examples of reentry maps (similar to the examples appearing throughout this guidebook) from other cities were presented. In addition to these maps, other localized maps describing related issues were provided. For example, the kickoff meeting for the reentry mapping partnership in Washington, DC, included a presentation of several maps about demographics and social and economic conditions in District neighborhoods. Figure 8, for example, shows the poverty rate for Washington, DC, neighborhoods. This information provided some basic context for the research focus of the reentry mapping partnership.
24
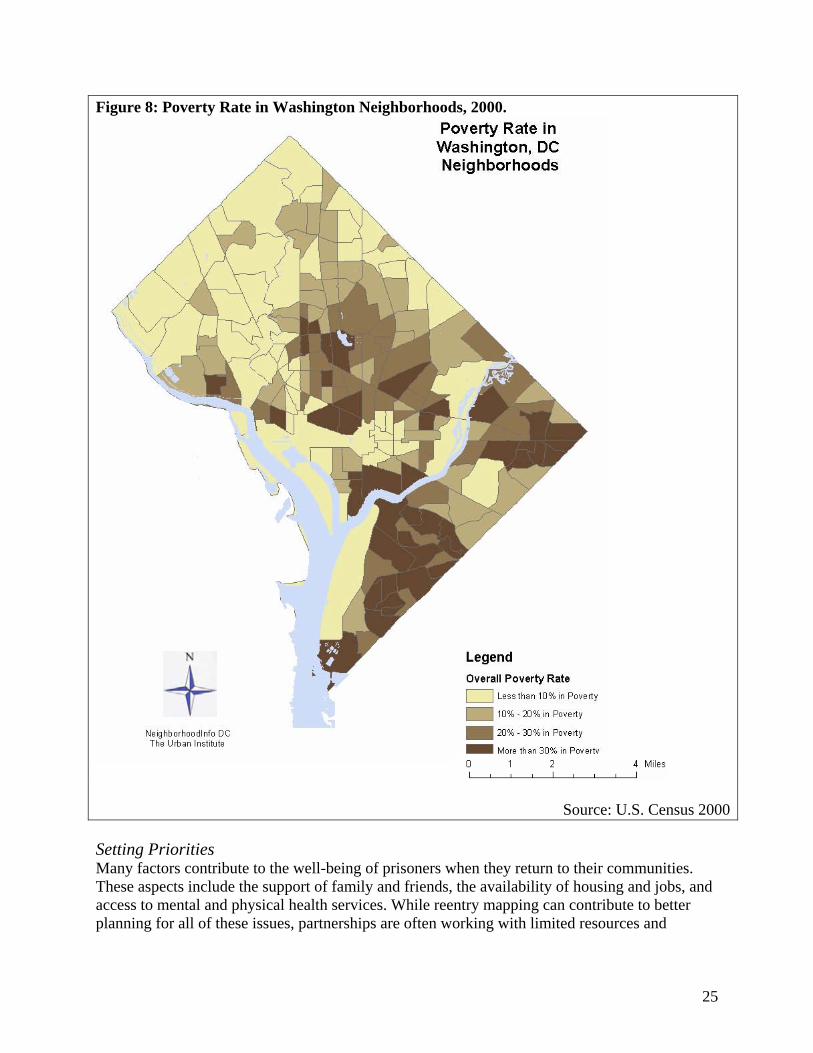
Figure 8: Poverty Rate in Washington Neighborhoods, 2000.
Setting Priorities Many factors contribute to the well-being of prisoners wThese aspects include the support of family and friends, access to mental and physical health services. While reenplanning for all of these issues, partnerships are often wo
Source: U.S. Census 2000
hen they return to their communities. the availability of housing and jobs, and try mapping can contribute to better rking with limited resources and
25
therefore may benefit from making a decision early on about the scope and target population of the project. With a common, basic understanding of the possibilities for research and action by a reentry mapping partnership, the process of setting priorities to focus activity is remarkably similar to the priority-setting processes used in other contexts. In setting priorities, the input of all stakeholders should be heard and shaped to build consensus. Priority setting is not a discrete task, however. New data become available, stakeholders join and leave the partnership, and priorities need to be continually reassessed to assure that they are relevant to the community and reflective of the input of all stakeholders. Some of the key considerations for this priority-setting process include: 1) identifying relevant data; 2) understanding the local political and economic context for prisoner reentry; and 3) assessing the resources available to address the identified priorities.
Identifying Relevant Data In order to address a specific topic, the partnership needs to have a reasonable expectation of what data they might obtain about it. For example, if the partnership decided to focus on the availability of substance abuse treatment for returning prisoners, members would set out to obtain data on the substance abuse histories of returning prisoners and the locations and capacities of substance abuse treatment providers. Later sections of this guidebook address how to assess what data are available and how to access them. Understanding the Local Political Context It is also important to identify whether those agencies whose policies and practices may need to change are willing to do so. Continuing with the substance abuse treatment example, if maps demonstrate a need for more treatment services in a particular neighborhood, what is the likelihood that the service provider community will be able to come together to shift resources (or obtain new ones) to meet that need? Are there stakeholders in the reentry mapping partnership that work with substance abuse treatment providers? In order to work on a specific issue, a reentry mapping partnership will need involvement of stakeholders with experience related to the specific issue being addressed. Identifying Available Resources Reentry mapping partnerships address the priorities identified for their community. Not all priorities are of equal importance, however. Some data are harder to obtain than others, and some obstacles related to the local political and economic context are more challenging to overcome than others. If there are challenges associated with either of those considerations, additional resources may be required to overcome them. Reentry mapping partnerships need not limit their issues and priorities to only those for which data are available and political will exists to create results. In fact, reentry maps can be used to make the case for collecting more detailed data that could help overcome some of these common obstacles to action.
26
The way in which priorities are set will depend on a number of different factors. The community partnership will bring perspective on what are the most pressing community needs. Identified needs, however, will not always match up with the availability of information to support a project. The availability of relevant corrections and contextual data will play a significant role in managing competing priorities. If a partnership wants to assess the adequacy of reentry services in their community, then it will need either a data source about reentry services in their community or sufficient time to develop such a data source. If a partnership wants to address recidivism rates of returning offenders, then it will likely need access to arrest and reconviction data from local and state agencies. The research partner will play a critical role in priority setting by helping the group think through what data will be needed for a proposed project and how much time and resources (if any) will be needed to acquire it. The availability of data, as well as the types of partners involved with the project, will likely change throughout the course of the project. Data that was once unavailable may become available. Key partners may come and go for any number of reasons, including staff turnover or changes in organizational priorities. In addition, new findings from ongoing analytic work may suggest a need for action that had not previously been identified. For these reasons, setting partnership priorities should be an ongoing process. Thus, it is important that these priorities be regularly reviewed and adapted. In addition to the availability of information, the structure of the partnership will also have some influence on what projects are deemed as priorities. This is particularly true when addressing specific policies or service areas. In order to engage in a project to improve access to health care or employment training services, a partnership will need to include organizations or individuals from those fields. Even with good access to data on health care or employment services, appropriate partners are needed to move toward changing policies and practices. Gaining Momentum In the Reentry Mapping Network, each partner achieved milestones of data access and community impact on very different schedules. Nonetheless, throughout their projects, RMN partners maintained a collaborative, community-based approach to their action research partnerships. This approach involved partnerships across a variety of community stakeholders, during which all parties reviewed maps and data reports together, with no single stakeholder having the ability to censor the findings. Involving these community stakeholders, however, is not an easy task. In some cases, the presence of law enforcement and corrections stakeholders in the partnership can be off-putting to community stakeholders if there is a history of tension between them. In Winston-Salem, the faith community played an integral role in overcoming this barrier to community stakeholder involvement. The Center for Community Safety’s partnership with churches enabled the partnership to involve former prisoners and other advocates who otherwise might have been reluctant to work with the Center.
27
Summary These key processes of identifying stakeholders, setting priorities, and beginning the work of the reentry mapping partnership all reflect a collaborative effort. This team approach is advantageous when the reentry mapping partnership encounters challenges. Moreover, having an actively involved set of stakeholders across a wide variety of viewpoints and interests can help advocate for the release of data that are otherwise difficult to obtain. This collaborative approach also has significant potential for influencing policymakers by demonstrating the breadth of the support behind any changes the reentry mapping partnership is advocating. The long-term benefit of this type of collaboration is the opportunity for stakeholders to work together, jointly pooling resources (and/or obtaining new ones) to sustain their reentry work over time.
28
Obtaining Reentry Data Perhaps the most critical element to any reentry mapping partnership is obtaining the right data to be able to accurately analyze which prisoners are returning to the community and where they end up residing. While this may initially appear to be a simple task, it can become quite complex depending on the nature of corrections agencies’ databases. Because most corrections databases were designed primarily to manage offender populations rather than to inform research, the structure of the fields and the accuracy of the data may create problems from a reentry mapping perspective. Many corrections databases also rely on antiquated Management Information Systems (MIS), making the data difficult to extract. Moreover, corrections data acquisition is fraught with potential data confidentiality violations, which can make data providers resistant to sharing information. These and related issues are discussed in detail below. Identifying Data Sources Reentry mapping partnerships can turn to various corrections agencies to request data on prisoners returning to their communities. These agencies include state Departments of Corrections (DOCs), which supervise prisoners serving time for felony convictions; city or county DOCs, which supervise jail inmates awaiting trial and those serving time for misdemeanor convictions; state parole or community corrections agencies, which oversee prisoners released to some form of supervision; and the Federal Bureau of Prisons, which supervises prison inmates convicted of federal level offenses.44 Most RMN partners were interested in data on state prisoners returning to the community—a much more sizable population than federal prison returnees—and thus worked with the corrections agencies in their states to access information on these individuals. Although specific contacts varied by state, RMN sites found that the information technology and the research and statistics offices within the DOC or community corrections agency tended to have the most familiarity with the data systems used to extract information on returning prisoners. For example, in the Milwaukee RMN site, the Information Technology office of the Wisconsin DOC was the key data contact, while in Washington, DC, the Office of Research and Evaluation of the Court Services and Offender Supervision Agency (CSOSA) provided the data to the RMN partnership. Deciding What Data to Request Before requesting data from the appropriate agency, the reentry mapping partnership must first clarify what population of returning prisoners they are interested in studying, what time period they are concerned with, and which data items they hope to receive. As to the population of interest, it is important to determine if the partnership is interested in prison or jail returnees (who may have substantively different reentry challenges) or both. Partners will also need to decide whether they will include data on individuals who are unsupervised after release as well as those who will be subject to some period of post-release supervision. In some states, nearly all prisoners are released to some form of supervision, whereas in other states significantly fewer
44 While this is an important data source, we have been unable to identify a reentry partnership or research effort that has obtained Federal Bureau of Prisons data for mapping purposes.
29
prisoners are supervised after release.45 Partnerships should also keep in mind that post-release supervision may include parole, probation, and other forms of community supervision. These different types of post-release supervision statuses have implications for the types of data that should be included in the analysis, as well as the source of those data. Although a full set of data on both supervised and unsupervised released prisoners would provide the most complete picture of the returning population, it is possible that the DOCs will only have some portion of the data available. By determining the populations of interest in advance, partnerships can negotiate for the most relevant data given the potential for these data limitations. RMN partners set out to obtain a data set of all those prisoners released from custody during the most recent calendar year. However, given the structure of their respective DOC’s databases and certain restrictions in the type of data they collect, the three RMN partners profiled in this guidebook ended up with very different data sets, each of which has its share of advantages and disadvantages. 1. Release data over a specific time period. The primary advantage of requesting data on all
those released during a given period of time (typically for the most recent fiscal or calendar year) is that it represents a discrete set of data for the specific population of interest, providing tremendous value for analyzing and understanding current spatial patterns of reentry. These data are desirable because they provide a snapshot of the characteristics and locations of the population of interest in a way that is relatively easy to analyze. However, the data set only depicts those most recently released from prison, and that information becomes outdated relatively quickly, requiring subsequent data requests in the future.
2. Cross-sectional data on current correctional populations. This approach is similar to the first, but less specific in that it includes all individuals on supervision at a given point in time regardless of when they were released. Unless the data include a field describing when the person was released, the file cannot be manipulated to create an accurate depiction of current spatial patterns of reentry. Instead, the location of new releasees is mixed in with the addresses for former prisoners who have been on supervision for some unknown period of time. As a result, maps will depict different spatial concentrations than those produced by analyzing locations of recently released prisoners, and may in turn have implications for how the maps inform service provision. If services are designed specifically for recently released prisoners, such maps may lead to erroneous decisions as to where such services should be located. On the other hand, some services—such as substance abuse treatment centers—may be designed to serve a broader former prisoner population, in which case these data would be very useful in guiding site location decisions.
3. Longitudinal data on correctional populations. A third option for reentry-related data is to
obtain a series of data on correction populations over time. This approach was used in the Milwaukee RMN site, which obtained biannual data snapshots of all sentenced persons who were incarcerated or on post-release supervision from 1997 to the present. The advantage of this approach is that it yields a powerful data set for tracking the reentry population over
45 The national average of those released under supervision is 82 percent, but this can vary greatly by state. California, for example, releases almost all prisoners to supervision while Florida and Massachusetts release less than half to supervision (Travis and Lawrence, 2002).
30
time. The significant drawback to these types of data, however, is that, unlike the first two approaches, they require significant additional effort to analyze and use.
Once the reentry mapping partnership has decided on the who and the when for their analysis, they can turn to the what—what data fields should be requested from the DOC?46 The prisoner’s release address is the key piece of data needed for mapping purposes and it is critical that data analysts understand the source of the address data. Reentry mapping partnerships should seek to obtain a street address for each individual. However, due to confidentiality concerns, data requestors may have to settle for records with the census block group or even the census tract identified for the returning prisoner. In these cases, the data requestor should still attempt to obtain records for each individual, rather than summarized records for census block groups or tracts. Individual records offer much more flexibility to analyze data in a variety of ways and can also be linked by a unique identifier to track reentry patterns experiences over time. Although NeighborhoodInfo DC only received census tract–level data, they did receive individual records and will be able to match their 2004 data set to future data releases in this way. In the ideal case, the DOC will be able to provide data on the address to which each prisoner plans to return after release, although in some cases these data are collected only for those released to supervision. For those data sources derived solely from such parole data, it is important to verify the frequency with which address information is updated and whether the data set accounts for released prisoners who are subsequently reincarcerated. The least desirable data source is that for which only the individual’s pre-prison address is available. While reentry partners have been known to use these data as a proxy for release address when no better data are available, these addresses are likely to be inaccurate given that close to half of released prisoners end up residing in neighborhoods different from the ones they lived in prior to incarceration.47 Finally, research has found that a significant share of released prisoners change addresses over a relatively short period of time.48 As a result, the addresses provided by the DOC (whether pre-incarceration or post-release) should not be viewed as an exact representation of the permanent locations of former prisoners. In addition to address information, reentry mapping partnerships should seek additional information maintained by Departments of Corrections about released prisoners in order to better understand the nature of the returning prisoner population. Some variables of interest may include demographic data (e.g., age, race, and gender), criminal history, educational level, employment and substance abuse history, and in-prison program participation. Appendix B contains a complete list of variables reentry mapping partnerships may seek to obtain, along with any confidentiality restrictions that may accompany those data. Reentry mapping partnerships should receive input from stakeholders in the partnership to help guide decisions about what data variables would be most useful to them.
46 Other studies have attempted to use police data on the location of arrests as a proxy for release addresses. This is a highly flawed approach for a number of reasons, including that arrest location is not a good proxy for where a person lives, much less for where they would return after serving time in prison. 47 La Vigne and Parthasarthy, 2005. 48 See La Vigne and Parthasarathy, 2005.
31

Interpreting the Data Each data variable provided by the Department of Corrections is likely to have important background and context needed for accurate interpretation. To the extent possible, reentry mapping partnerships should establish in advance that they will need additional support from their data provider to interpret the data. Below are specific issues that arose from the data received by Reentry Mapping Network partners. Sorting through issues such as these will result in a cleaner and more accurate database for use in analyses:
• If a person is released from prison twice during the period of time covered by the data, are two records included in the data, or just one? There are pros and cons to each approach. Including both records is an accurate measure of the number of people released from prison during a given period. Identifying the share of released prisoners who, over the course of a year, cycle in and out of prison is a good proxy for the “revolving door” trends observed in many states across the county. This approach, however, overestimates the number of unique individuals who are released. For the purposes of planning for service provision and identifying concentrations of returning prisoners within a community, it is usually preferable to only include the record representing the most recent release of an individual.
• If data on past offenses are provided, how are cases with multiple offenses coded? Typically, corrections data providers supply information on the most serious offense of conviction, as well as multiple data fields indicating the other conviction offenses, if any. Both the most serious offense and the other conviction fields are useful for reentry mapping, particularly if one is interested in measuring the number of released prisoners who were convicted of drug-related crimes. Because many more serious crimes are committed along with drug crimes (e.g., aggravated assault in combination with drug trafficking), all conviction fields should be requested and obtained to conduct this type of analysis.
• How are probation, parole, and other supervision statuses designated? In some states, there are multiple means of releasing individuals from prison, including early release on parole, expiration of sentence, and various forms of split sentences (e.g., “shock probation,” for which an offender is sentenced to a short period of incarceration followed by a term of probation supervision in the community). Each of these types of release has implications for the challenges and resource requirements of prisoners returning to the community.
• How are race and ethnicity coded? Correctional agencies can code race and ethnicity in a variety of ways, and often the way these attributes are coded can create analysis problems. Whereas the U.S. Census accurately defines race separate from ethnicity, 49 Hispanic is often miscategorized as a race and thus presents problems for individuals who might identify themselves as, for
49 For more information about how race and ethnicity are coded in the decennial census, visit www.census.gov.
32
example, both black and Hispanic. Data obtained from providers who do not conform to the Census’ approach are likely to depict an inaccurate race/ethnic composition of the correctional population being studied. It is therefore critical to understand how race and ethnicity are coded.50
• How often are records updated? Are multiple databases used to generate the
complete data set? If so, when are data fields and databases updated? As mentioned earlier, corrections data are often collected to support the primary mission of the agency, which is to house and monitor prisoners safely and securely. Unfortunately, from a research perspective, that viewpoint means that data fields are often simply overwritten when updated or not updated throughout the prisoner’s tenure in the system. For example, educational level at the time of admission could be different from that at the time of release.51 Likewise, a prisoner’s marital status or number of children could change during the course of incarceration. It is therefore critical that reentry mapping partners verify with data providers which fields are updated and when (if at all) those updates occur.
Overcoming Barriers to Data Acquisition Obtaining data may be as easy as making a request over the phone or via email to a contact at the Department of Corrections. It is much more likely, however, that significant work will need to be done by the reentry mapping partnership to address data confidentiality concerns and other data access issues. Typically, DOCs and other data providers are willing to work with reentry partnerships to fulfill such data requests. Despite this openness, however, the actual delivery of data can take months.
In order to protect the confidentiality of the information about released prisoners contained in the requested data sets, DOCs and other corrections data providers may require reentry mapping partnerships to have their data request reviewed by an Institutional Review Board (IRB). An IRB is a group of statisticians, researchers, community advocates, and others that ensures that a research project is ethical and that the rights and identities of study participants are protected. All universities and most research organization have IRBs, and any research project funded by the federal government must be reviewed by an IRB. The IRB review process requires the researchers to set forth a series of protocols for ensuring that the rights and privacy of research subjects will be protected. For example, when the Center for Community Safety (CCS) in Winston-Salem submitted their data request to the North Carolina Department of Corrections Human Subjects Review Committee, they outlined steps they would take to protect the confidentiality of data. These included provisions ensuring that:
1. All staff handling the data sign and abide by a Staff Confidentiality Pledge;
50 The National Neighborhood Change Database project has developed a methodology for coding data sets with multiple race categories for individuals. The methodology is included in Tatian, 2003. 51 In Maryland, for example, we found that 13 percent of released prisoners increased their education level during their most recent term of incarceration (Visher et al., 2003).
33

2. All sensitive computerized records be transmitted via secure means (e.g., CD’s shipped via FedEx, not email);
3. All materials be stored in locked file cabinets or stored in password-protected files on password-protected hard drives using PGP disk encryption software;
4. Access privileges and passwords be made available only to the appropriate staff members; and
5. The project director conducts unannounced checks to ensure that all project staff complied with this data security plan.
The data request made by the CCS also included strategies to assure that the data would not be presented in such a way that the identity of individuals could be determined. Specifically, CCS only mapped data that had at least five observations per unit of analysis so that outside parties could not identify specific individuals. For example, if there were only one or two released prisoners of a particular race/ethnicity (e.g., Asian) or age category (e.g., below 18 or above 65) for a neighborhood or census block group, identifying the individual by name could be relatively easy. Appendix C details potential solutions for confidentiality issues on a variable-by-variable basis.
Another limiting factor in accessing reentry data is availability of specific variables of interest. In some cases, the Department of Corrections may not have access to the data being requested, such as individuals’ previous incarceration records. In other cases, the data may be available, but cost prohibitive to obtain due to the time that would be required to extract the data. In addition, staff turnover and antiquated data systems sometimes limit access to data. Despite these concerns about data availability, reentry mapping partnerships should not limit their data requests. Presenting the Department of Corrections with a complete “wish list” of the data needed for the reentry mapping partnership can serve as the starting point for more specific discussions with corrections officials about what data are available and obtainable. (Appendix C includes an example of such a wish list, which was used by CCS for its original request for data from the North Carolina DOC). The Department of Corrections may be more willing to provide data if the data request comes from a well-organized reentry mapping partnership with strong connections and involvement with reentry issues in the community. In addition, if the DOC is not already involved in the reentry mapping partnership, staff members may be willing to provide data if they are invited to participate at some level. This could involve formal participation in the ongoing discussions and decisions of the partnership, or simply receiving the maps and other analytic products of the reentry mapping partnership. If reentry mapping partnerships are able to analyze reentry data in a way that is helpful to the DOC, the DOC may be more willing to commit staff resources to extract data that would otherwise be difficult to access. For example, the Center for Community Safety in Winston-Salem was able to overcome the initial reluctance of corrections officials to provide a full set of data by giving these officials maps that displayed the limited data that the DOC was initially willing to release. The North Carolina DOC saw the value of the CCS’s work and agreed to provide a full data set and to provide updates of those data on a regular basis. In Washington, DC, the Research and Evaluation Department of CSOSA has also been supportive of providing data for reentry mapping, in part because staffers see the potential value-added to their work of having a partner analyzing their data and sharing results with them.
34
Obtaining Contextual Data In addition to data about released prisoners, the reentry mapping partnership will also need contextual data about the neighborhoods in which returning prisoners reside. These data include basic information, such as the income and employment levels in those neighborhoods, as well as more detailed information, such as the locations of service providers and potential employers. The specific data sets that need to be assembled depend on the reentry mapping partnership’s priorities. This section describes the various data types that are typically used in reentry mapping, provides guidance on identifying sources for those data, and discusses some potential problems that may arise when mapping them. Each of the data sources and approaches for collecting data described below can be easily accessed and used with the partnership, provided the stakeholders include at least one staff person with a background in community-based research and GIS. In Washington, DC, and Milwaukee, the lead partners had already developed comprehensive warehouses of contextual data about their communities. To compile these data warehouses, they accessed many of the same resources detailed here. Similar data warehousing capacities exist in most major cities across the country. Members of NNIP, for example, have built such data warehouses, as have a number of organizations affiliated with NNIP.52 Reentry mapping partnerships will benefit greatly if they are able to include in their stakeholder group a local research organization that has already compiled much of the contextual data that might be needed for the partnerships’ priorities. This organization could be a nonprofit group or a local university’s urban planning or GIS department. Identifying Data on the Community Context of Prisoner Reentry Demographic Data The U.S. Census Bureau is an excellent source of information that provides comprehensive data on indicators of community well-being. The census provides baseline information about neighborhoods, including population demographics such as age, sex, race, ethnicity, marital and family status, children, and education level, as well as characteristics of communities, such as employment rates and percentage of renter-occupied units. The Census Bureau maintains a web site where this data can be downloaded free of charge.53 The primary drawback of using census data is that neighborhood-level data are collected only every ten years (most recently in 2000), and thus does not reflect important changes in neighborhoods that occur between data collection periods. Caution should be exercised in using traditional census data that might not accurately describe current neighborhood characteristics. However, this downside of census data could change because of the recent launching of the American Community Survey (ACS), which collects annual data from major U.S. cities. Pending full funding from Congress, the ACS will deliver
52 See http://www.urban.org/nnip/index.htm. 53 Census data can be accessed and downloaded from their web site: http://www.census.gov/.
35
yearly neighborhood (census tract) level data around 2012.54 In the meantime, some researchers have found private vendors such as Claritas (www.claritas.com) and Geolytics (www.geolytics.com) to be a useful source of annual census data estimates. Boundary Data In addition to census data, information about communities can often be obtained from city or county planning departments or multi-jurisdictional Councils of Government (COGs). These data sources include some of the basic data needed to create maps, such as data on neighborhood boundaries and the locations of bus routes and other transit stops, schools, and police and fire stations. The best place to start looking for this information is on the local city or county government web site. In some cases, these data can also be obtained from the local university research center or other local research organizations. Service Provider Data Additional data about neighborhoods can be obtained from existing resources, although it might not always be freely and conveniently available for download. Examples of these types of data include information on services for former prisoners. Most communities have a number of printed and electronic databases about service providers. Some communities feature automated Information and Referral systems (I&R or 211 systems) with comprehensive details about service providers. The local United Way or other service provider umbrella agencies may also be a useful source of this information. In addition, some state corrections departments maintain data on services for former prisoners. In all these types of service provider data sets, information about organizational and program-related goals, target populations, client-eligibility criteria, services offered, fees, and programmatic capacity for each available service are desirable if available. This information can be mapped to identify service delivery gaps and overlaps, and potentially can be used to prepare or expand upon a service directory as a resource for returning prisoners. Data from individual service providers about their clients can also be useful in better understanding the former prisoner population and in planning for their return. For example, a food kitchen, homeless shelter, or employment training center may note in their client files whether a client is a convicted felon. These data can be used to estimate how services are accessed and used, and in some cases outcomes for these clients can be tracked. As with the Department of Corrections, these data are extremely sensitive, and any request for the data should be vetted by an Institutional Review Board and include a detailed plan to guarantee data security and the protection of clients’ privacy. Once those protocols are in place, obtaining data from service providers should be relatively easy, particularly if the reentry partnership offers to produce maps detailing where service provider clients reside, which can be used to help target their services. An important caveat about obtaining and mapping service provider data, however, is that these data require the appropriate level of detail to discern between the locations of service provider headquarters or administrative offices and the locations of clinics, transitional housing, and other 54 For more information about the American Community Survey, see http://www.census.gov/acs/.
36

places that represent the points of delivery to former prisoner clients. Without this information, one could map all addresses related to a service provider and erroneously conclude that services are available in areas where they do not actually exist. Local, State, and Federal Agency Data Other existing data sets from government agencies can be pursued to address particular priority issues for reentry mapping partnerships. For example, to fully analyze the housing needs of returning offenders, data about the housing stock can be obtained from the city or country assessor’s office in many communities. To fully analyze the employment needs of returning prisoners, recent employment statistics can be obtained from the federal Bureau of Labor Statistics.55 In addition, data about new construction projects or other potential employment opportunities can often be obtained from a city or county office of planning, or potentially the local workforce development council. For most issues, a local government office as well as one or more local nonprofits can be contacted as potential data providers and stakeholders. Primary Data Collection Although many data sets are readily available to reentry mapping partnerships for use in addressing their priority issues, it may be necessary to collect new data. Information about methods for primary data collection is well documented in a number of existing manuals and guidebooks.56 In Winston-Salem, the reentry mapping partnership was interested in collecting more data than were already available about the neighborhood in which they focused their efforts. Specifically, they wanted information about the location of churches and day care centers (assets) as well as information about abandoned and vacant housing (deficits). The CCS, in partnership with UI, developed a protocol for former prisoners to walk the blocks in the neighborhood and record their observations about the location of assets and deficits on those blocks (See Appendix D). This data collection effort was complemented by a survey of employers in the area to measure their willingness to employ ex-offenders. The survey results will be used to develop programs and services that would help minimize the risk for employers in hiring former prisoners and alleviate any concerns identified by local employers in the survey. The Winston-Salem partnership is in the early stages of implementing some other new data collection projects, such as a survey of former prisoners to assess their job skills, as well as a community skill-set survey in a high-concentration reentry neighborhood. The survey results will be used to demonstrate to local stakeholders that former prisoners have a number of job skills that could be developed through targeted training programs, or applied in jobs with local employers. Results from the community skill-set survey will be used to identify and link former prisoners with possible entrepreneurial opportunities or existing small businesses.
55 See the Bureau of Labor Statistics at: http://www.bls.gov/. 56 See Chapter 4 in Tatian, 2000.
37
Creating Maps Creating maps that effectively and accurately communicate information is part art and part science. Mapmakers must make judgments about color schemes and graphics while also applying statistics and sound geographic principles to the maps they produce. This section offers advice on how to avoid common pitfalls in creating maps and how to choose the right type of map to communicate your data most effectively. Geocoding Accurately Before one can create a map, it is first necessary to “geocode” the data to be presented on the map. Geocoding is the process of assigning geographic coordinates (longitudes and latitudes) to street addresses. While all GIS software has built-in geocoding capabilities, issues of data quality associated with incomplete or inaccurate street numbers, names, and/or zip codes can present problems. Typically, a mapper will first use the built-in geocoder associated with whatever GIS software is being employed, and then follow that “batch geocoding” operation by manually geocoding the remainder, which involves going through each troublesome address one at a time to clean the data and determine the accurate address. The importance of effective geocoding cannot be overstated. Oftentimes, novice mappers will simply run the GIS software’s batch geocoding function and leave it at that, with no concern about what share of addresses are actually depicted on the map. Thus, it is always important to make note of the “geocoding hit rate”—the percentage of all addresses that were confirmed as accurate and depicted on the map. Hit rates of 95 percent or higher are desirable, and anything below 80 percent should be viewed skeptically. This is particularly true because it could be that an entire share of cases at one specific location are missing—for example, all those prisoners who are released to a specific transitional center may not have been geocoded if the DOC simply recorded the name of the center with no street address. This would result in a map that is spatially biased, misrepresenting the concentrations of released prisoners.
Where Can I Learn How to Map?
While this guidebook recommends that reentry mapping novices team up with local experts (e.g., universities or nonprofit data centers) to obtain mapping assistance, it may not be possible or desirable to do so. In fact, some reentry mapping partnerships may determine that having in-house GIS expertise is important for project sustainability. Fortunately, several affordable training options are available. Software vendors such as ESRI and MapInfo offer training workshops throughout the country for a fee (see www.esri.com and www.mapinfo.com). Beginning mappers can also take advantage of the workshops offered through NIJ’s Crime Mapping Research Conference or the NIJ-funded Crime Mapping and Analysis Program in Denver, CO. For a comprehensive list of mapping training and tutorial options, see www.ojp.usdoj.gov/nij/maps/training.html.
38

Even when the hit rate is high, the locations on the map may not be accurate. It could be, for example, that a significant share of addresses are geocoded (i.e., they are legitimate locations on a map) and yet may not be accurate because they could be industrial areas, water bodies, or other unlikely locations of released prisoners’ residences. Thus, it is usually recommended that the mapper take a random sample of point locations and check them to determine whether they appear valid. In the future, the use of Geographic Positioning Systems (GPS) in corrections may make this step unnecessary, as GPS is used more often for the purposes of prisoner tracking.57
Figure 9: Illustration of False Concentration of Prison Release Locations
Location of county jail.
With regard to the transitional center example, geocoding can be a useful tool in identifying “repeat addresses”—those addresses to which multiple released prisoners are returning. The mapper should make note of all of these repeat addresses and then attempt to identify those that have a significant number of released prisoners associated with them. Common explanations for repeat addresses include halfway houses, transitional centers, homeless shelters, jails, and INS detention centers. In some cases, the mapper may determine that these repeat addresses should be eliminated from the map. In Chicago, for example, Urban Institute researchers mapped the addresses of all prisoners released to the city in 2001 and produced a density map that depicted an unusual concentration in the southeast part of the city, where one address alone was 57 See Karappunnan, 2005.
39
associated with 1,158 released prisoners. A quick check of the address revealed that it was the location of the county jail, where “released” prisoners were transferred to await other pending charges (see Figure 9 above). In that instance, those data were subsequently removed from the file because they did not depict the true residential locations of returning prisoners. In cases such as repeat addresses associated with halfway houses and transition centers, however, mappers typically keep those data points in the file as they can help inform service delivery needs and locations for this subpopulation. Communicating Effectively with Maps58
When creating maps depicting prisoner reentry and related data, it is critical to first ask a series of questions that will help guide both the content and presentation of the map. The first question is, Who is the audience? Is it the general public, the department of corrections, a meeting of service providers, or some combination of these stakeholders? Understanding the audience will help to guide the level of detail and amount of information to include. An equally important question to ask is, What is the purpose of the map? Is the purpose to depict the distribution of released prisoners across a county, the precise locations of service providers, or a summary of socioeconomic data in a neighborhood? Determining the purpose of the map ahead of time can help prevent the inclusion of unnecessary or irrelevant information, which can often result in a cluttered map that is difficult to interpret. Once the audience and purpose of the map are agreed upon, the next question to consider is, What information must be included and at what level of detail? Is it necessary to include offense information? Demographics? Is street-level information required or would major arteries suffice? A general rule of thumb is that the map should depict only those data that are necessary to get across the intended message. Assuming the above questions are asked and answered, the next decision is what type of map to make. The most common options are point maps, graduated symbol maps,59 thematic or “choropleth” maps, and density maps. Each of these maps has its share of advantages and disadvantages; while there is no “right” map to use for all occasions, some work better for some types of data than for others. Your map choice will also depend on scale and context.
58 This section provides a cursory overview of the types of reentry maps that could be made, as well as general tips on creating maps that communicate clearly and effectively. For more detailed guidance on map-making principles, see Heywood et al., 1998; and Harries, 1999. 59 Graduated symbol maps, for which data are depicted with symbols that vary in size based on the volume of the data presented, are most commonly used in nationwide maps and therefore are not illustrated in this report.
40
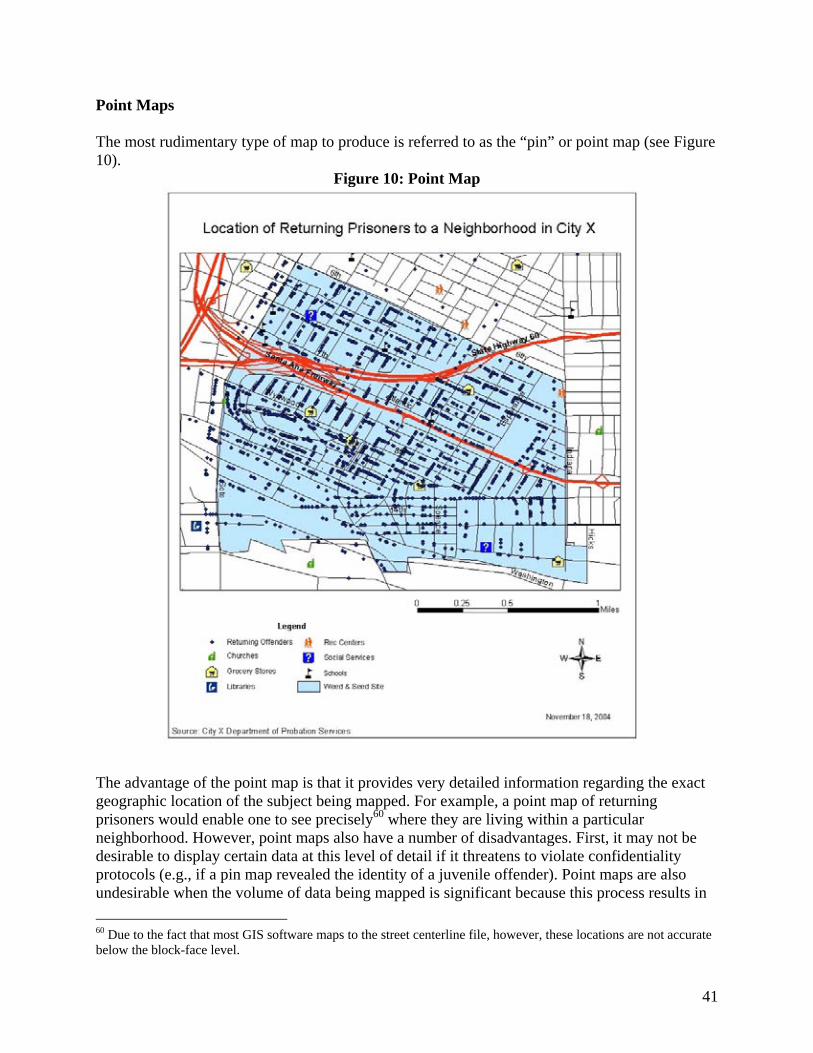
Point Maps The most rudimentary type of map to produce is referred to as the “pin” or point map (see Figure 10).
Figure 10: Point Map
The advantage of the point map is that it provides very detailed information regarding the exact geographic location of the subject being mapped. For example, a point map of returning prisoners would enable one to see precisely60 where they are living within a particular neighborhood. However, point maps also have a number of disadvantages. First, it may not be desirable to display certain data at this level of detail if it threatens to violate confidentiality protocols (e.g., if a pin map revealed the identity of a juvenile offender). Point maps are also undesirable when the volume of data being mapped is significant because this process results in 60 Due to the fact that most GIS software maps to the street centerline file, however, these locations are not accurate below the block-face level.
41
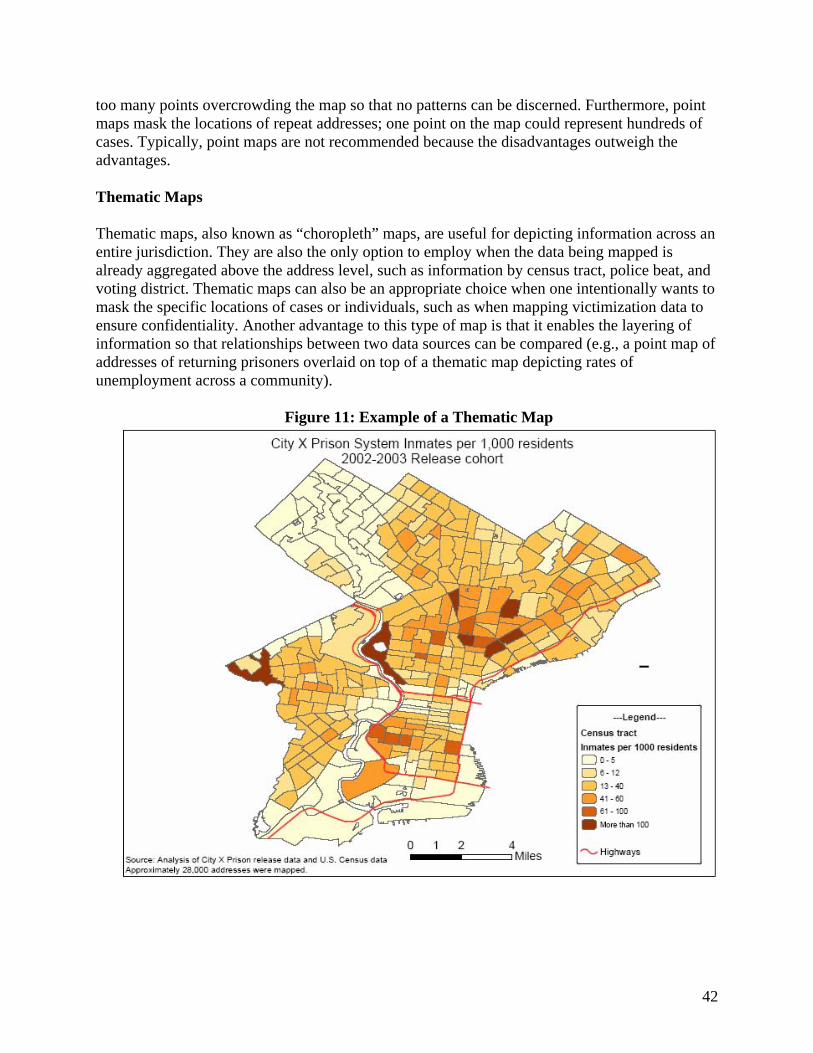
too many points overcrowding the map so that no patterns can be discerned. Furthermore, point maps mask the locations of repeat addresses; one point on the map could represent hundreds of cases. Typically, point maps are not recommended because the disadvantages outweigh the advantages. Thematic Maps Thematic maps, also known as “choropleth” maps, are useful for depicting information across an entire jurisdiction. They are also the only option to employ when the data being mapped is already aggregated above the address level, such as information by census tract, police beat, and voting district. Thematic maps can also be an appropriate choice when one intentionally wants to mask the specific locations of cases or individuals, such as when mapping victimization data to ensure confidentiality. Another advantage to this type of map is that it enables the layering of information so that relationships between two data sources can be compared (e.g., a point map of addresses of returning prisoners overlaid on top of a thematic map depicting rates of unemployment across a community).
Figure 11: Example of a Thematic Map
42

The final advantage to thematic maps is that, because they employ aggregate data, they are well suited for depicting rates versus volumes. The distinction between rate and volume can be critical for the mapping of released prisoners. For example, if one is preparing a map of released prisoners to help inform whether adequate services exist in the areas closest to where most released prisoners live, mapping the volume, or raw number of released prisoners, is the appropriate choice. But if one were exploring the extent to which a neighborhood experiences the impact of reentry, it might be more appropriate to map the number of released prisoners per 1,000 residents. Revisiting the earlier Chicago example, we found that the difference between numbers and rates can be significant when analyzing the location of released prisoners within neighborhoods, with the Austin area receiving the largest volume of returning prisoners, but released prisoners in East Garfield making up a much greater share of the population (see Figure 12).
Figure 12. Number and Rate of Prisoners Returning to Chicago Communities, 2001
Community Number of returning prisoners
Rate per 1,000 residents
Austin Humbolt Park North Lawndale West Englewood Englewood East Garfield Park
1,681 699 656 521 429 412
14.3 10.6 15.7 11.5 10.7 19.7
Source: LaVigne and Mamalian (2003). The disadvantages to thematic maps involve the Modifiable Areal Unit Problem (MAUP), for which address data that are aggregated to a larger unit can mask concentrations within the unit.61 Another potential problem with this type of map is that GIS software typically uses arbitrary value breaks (as shown in the legend) to identify different ranges of data. While the map designer has the option of choosing a number of ways to make those value breaks, each can change the interpretation of the map.62
61 For a more detailed description of MAUP and how it can effect map interpretation, see Professor Jerry Ratcliffe’s discussion and listing of related references at http://www.jratcliffe.net/research/maup.htm. 62 For more information on this point, see Monmonier, 1991.
43
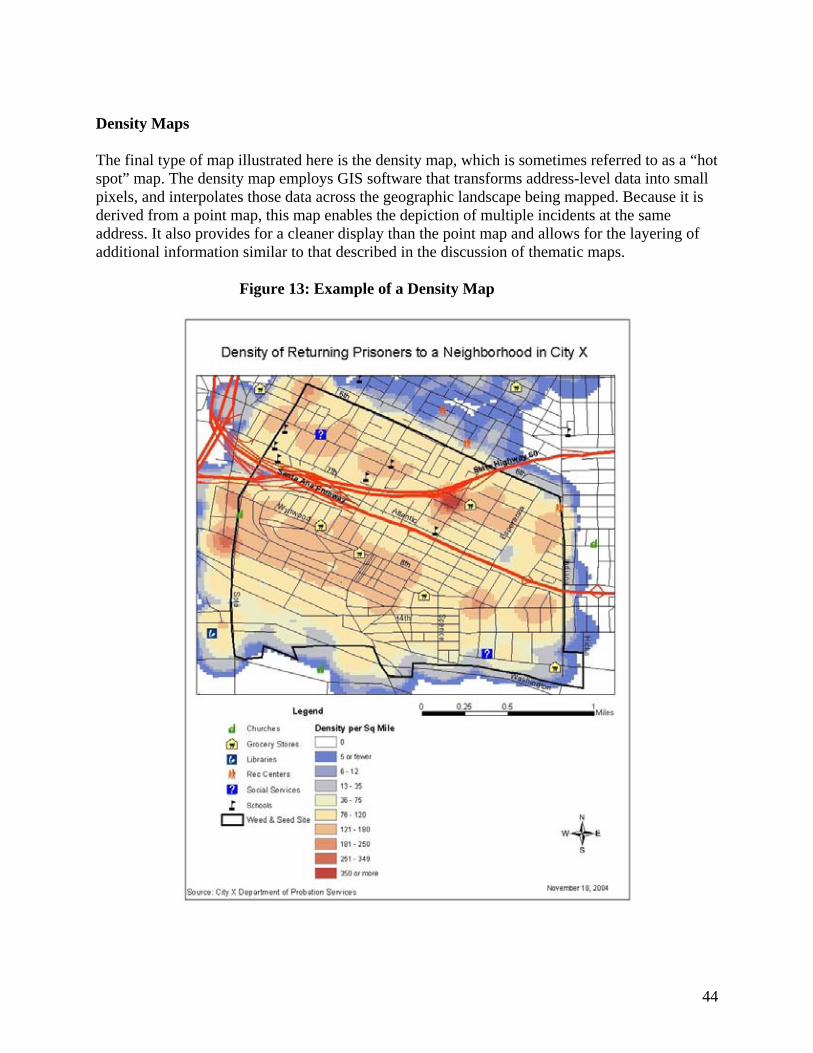
Density Maps The final type of map illustrated here is the density map, which is sometimes referred to as a “hot spot” map. The density map employs GIS software that transforms address-level data into small pixels, and interpolates those data across the geographic landscape being mapped. Because it is derived from a point map, this map enables the depiction of multiple incidents at the same address. It also provides for a cleaner display than the point map and allows for the layering of additional information similar to that described in the discussion of thematic maps.
Figure 13: Example of a Density Map
44
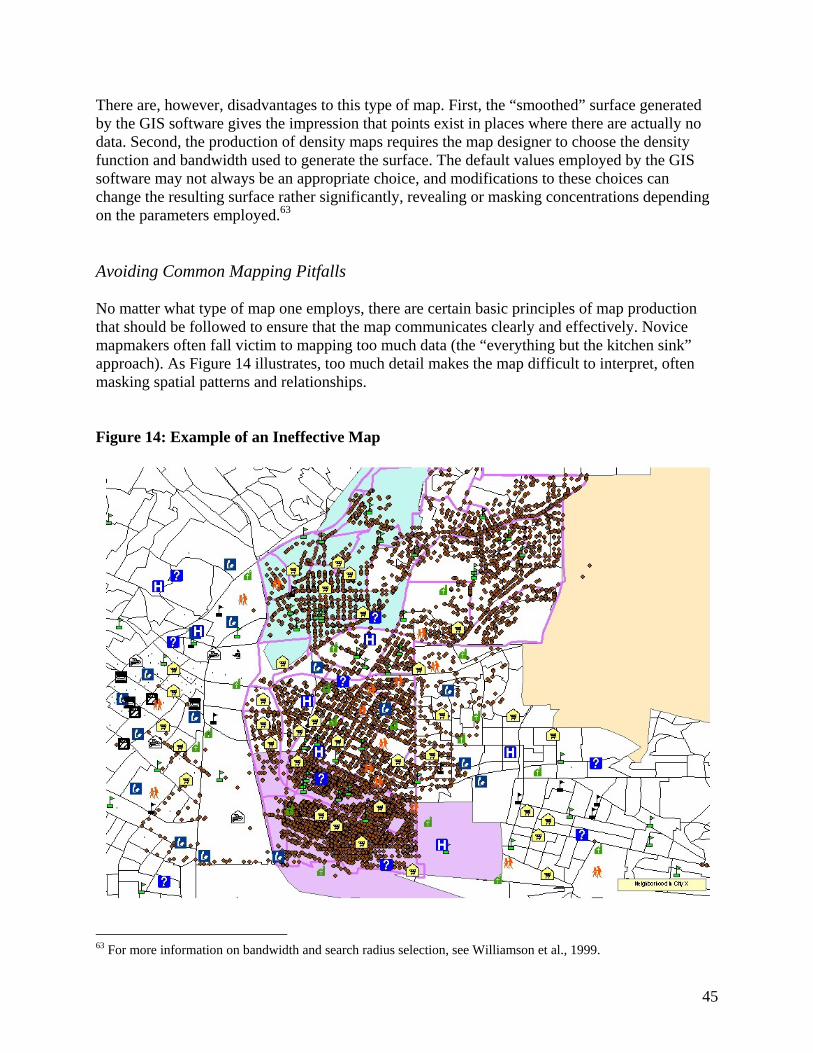
There are, however, disadvantages to this type of map. First, the “smoothed” surface generated by the GIS software gives the impression that points exist in places where there are actually no data. Second, the production of density maps requires the map designer to choose the density function and bandwidth used to generate the surface. The default values employed by the GIS software may not always be an appropriate choice, and modifications to these choices can change the resulting surface rather significantly, revealing or masking concentrations depending on the parameters employed.63 Avoiding Common Mapping Pitfalls No matter what type of map one employs, there are certain basic principles of map production that should be followed to ensure that the map communicates clearly and effectively. Novice mapmakers often fall victim to mapping too much data (the “everything but the kitchen sink” approach). As Figure 14 illustrates, too much detail makes the map difficult to interpret, often masking spatial patterns and relationships. Figure 14: Example of an Ineffective Map
63 For more information on bandwidth and search radius selection, see Williamson et al., 1999.
45
Clearly, the map in Figure 14 does not communicate effectively for a number of reasons:
• The general purpose of this map is unclear because there is no title or legend; • The viewer is unable to determine what the points, other symbols, shaded areas, or
lines symbolize; • It is difficult to see all the symbols because there are so many points and overlapping
symbols; • The area and data displayed are not appropriate for the use of a point map; and • The colors used are visually jarring.
While the above example illustrates what can happen when one maps too much data, it is equally problematic when not enough information is included on a map. A standard guiding principle of map making is that any map created should have sufficient information so that it can serve as a stand-alone document. The user should be able to understand the map without any accompanying text and also know the source of the data presented on the map and who created it. This is important, as maps are often widely disseminated and can easily be taken out of context without this accompanying information (see Figure 15: Essential Elements of a Map).
46

Figure 15: Essential Elements of a Map The following seven items are essential for every map created, especially for those distributed to other organizations during meetings and conferences. Maps in PowerPoint presentations can be modified to fit the screen better; however these elements are still important to include:
Title Legend Scale Bar Date North Arrow Sources & Notes
Title
The largest type size on map. Located in visually pleasing and easily seen portion of page. Provides overview of what the map displays.
47
DateSome maps are time sensitive. The date of creation helps determine how current the map is.
North ArrowProvides orientation. It is especially important if North is not ‘up.’
Scale BarProvides sense of distance. Usually positioned near the bottom of the map. Legend
Needs to be easily under-standable. Positioned so it balances the rest of the elements.
Acknowledgeinformation awho made it, data presente
Source: City X Department of Juvenile Services, July 1, 2004 – June 30, 2005
Source and Notes
and/or reference any pertinent bout how the map was made, and the dates associated with the d in the map.
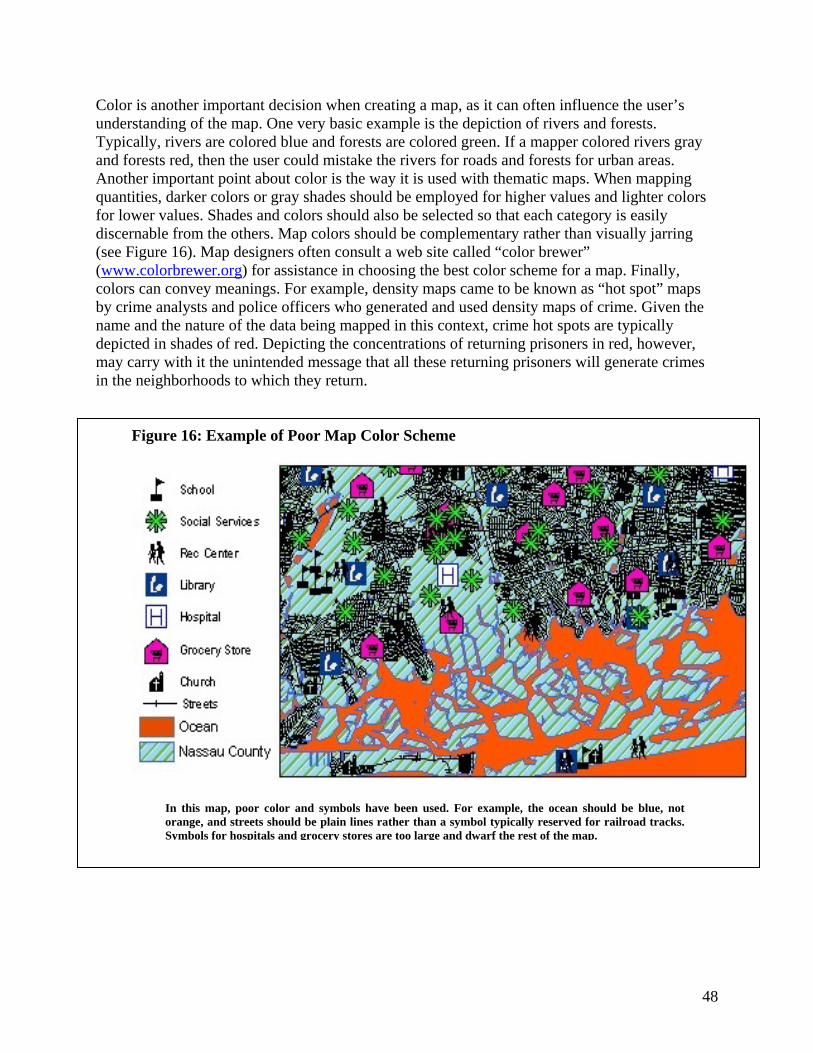
Color is another important decision when creating a map, as it can often influence the user’s understanding of the map. One very basic example is the depiction of rivers and forests. Typically, rivers are colored blue and forests are colored green. If a mapper colored rivers gray and forests red, then the user could mistake the rivers for roads and forests for urban areas. Another important point about color is the way it is used with thematic maps. When mapping quantities, darker colors or gray shades should be employed for higher values and lighter colors for lower values. Shades and colors should also be selected so that each category is easily discernable from the others. Map colors should be complementary rather than visually jarring (see Figure 16). Map designers often consult a web site called “color brewer” (www.colorbrewer.org) for assistance in choosing the best color scheme for a map. Finally, colors can convey meanings. For example, density maps came to be known as “hot spot” maps by crime analysts and police officers who generated and used density maps of crime. Given the name and the nature of the data being mapped in this context, crime hot spots are typically depicted in shades of red. Depicting the concentrations of returning prisoners in red, however, may carry with it the unintended message that all these returning prisoners will generate crimes in the neighborhoods to which they return.
Figure 16: Example of Poor Map Color Scheme
In this map, poor color and symbols have been used. For example, the ocean should be blue, not orange, and streets should be plain lines rather than a symbol typically reserved for railroad tracks. Symbols for hospitals and grocery stores are too large and dwarf the rest of the map.
48

As with color, the shapes and patterns of symbolism chosen to depict various types of data on a map can also influence viewers’ perceptions of what is being communicated. Using a “+” to depict locations of schools, for example, may confuse viewers who assume the cross is associated with the location of a church. Thus, symbols should bear some natural relation to the feature being represented. While there are many built-in symbols available in GIS software, these symbols should be used with care so that they do not detract from the map’s main purpose. Symbols also should be of appropriate size so as not to dwarf other data on the map. The symbols are too big for the size of the map in Figure 16 and clutter the map without providing helpful information.
49
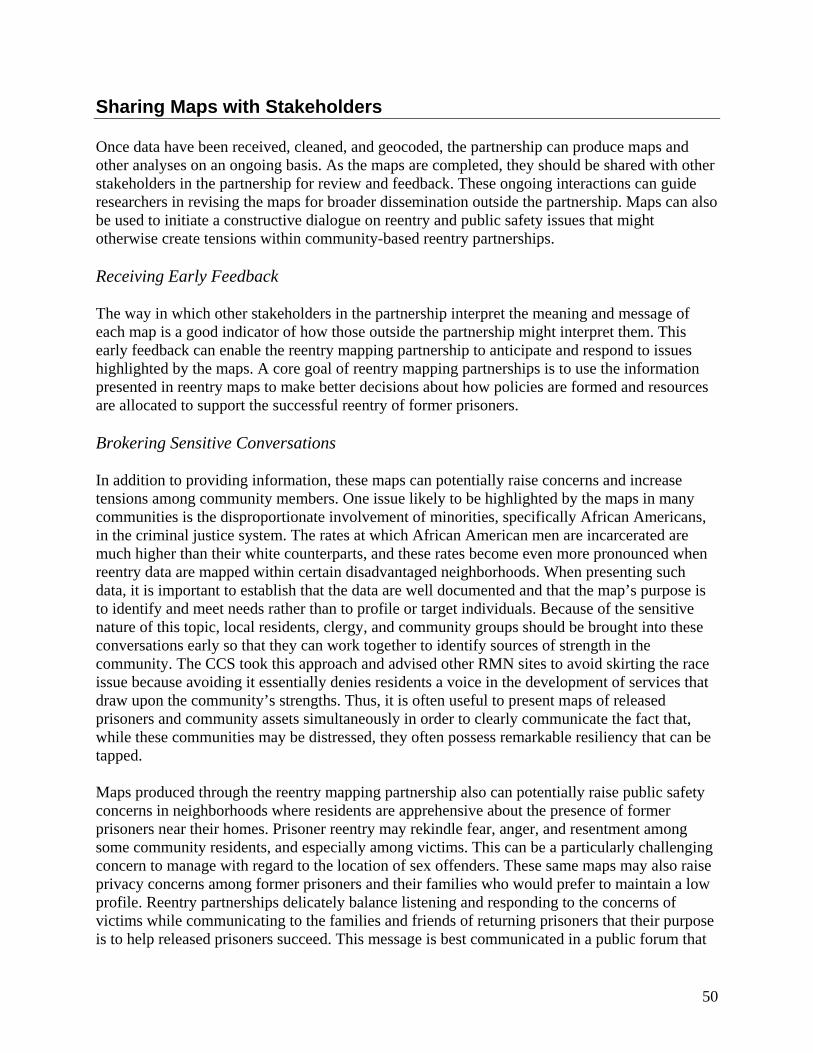
Sharing Maps with Stakeholders Once data have been received, cleaned, and geocoded, the partnership can produce maps and other analyses on an ongoing basis. As the maps are completed, they should be shared with other stakeholders in the partnership for review and feedback. These ongoing interactions can guide researchers in revising the maps for broader dissemination outside the partnership. Maps can also be used to initiate a constructive dialogue on reentry and public safety issues that might otherwise create tensions within community-based reentry partnerships. Receiving Early Feedback The way in which other stakeholders in the partnership interpret the meaning and message of each map is a good indicator of how those outside the partnership might interpret them. This early feedback can enable the reentry mapping partnership to anticipate and respond to issues highlighted by the maps. A core goal of reentry mapping partnerships is to use the information presented in reentry maps to make better decisions about how policies are formed and resources are allocated to support the successful reentry of former prisoners. Brokering Sensitive Conversations In addition to providing information, these maps can potentially raise concerns and increase tensions among community members. One issue likely to be highlighted by the maps in many communities is the disproportionate involvement of minorities, specifically African Americans, in the criminal justice system. The rates at which African American men are incarcerated are much higher than their white counterparts, and these rates become even more pronounced when reentry data are mapped within certain disadvantaged neighborhoods. When presenting such data, it is important to establish that the data are well documented and that the map’s purpose is to identify and meet needs rather than to profile or target individuals. Because of the sensitive nature of this topic, local residents, clergy, and community groups should be brought into these conversations early so that they can work together to identify sources of strength in the community. The CCS took this approach and advised other RMN sites to avoid skirting the race issue because avoiding it essentially denies residents a voice in the development of services that draw upon the community’s strengths. Thus, it is often useful to present maps of released prisoners and community assets simultaneously in order to clearly communicate the fact that, while these communities may be distressed, they often possess remarkable resiliency that can be tapped. Maps produced through the reentry mapping partnership also can potentially raise public safety concerns in neighborhoods where residents are apprehensive about the presence of former prisoners near their homes. Prisoner reentry may rekindle fear, anger, and resentment among some community residents, and especially among victims. This can be a particularly challenging concern to manage with regard to the location of sex offenders. These same maps may also raise privacy concerns among former prisoners and their families who would prefer to maintain a low profile. Reentry partnerships delicately balance listening and responding to the concerns of victims while communicating to the families and friends of returning prisoners that their purpose is to help released prisoners succeed. This message is best communicated in a public forum that
50
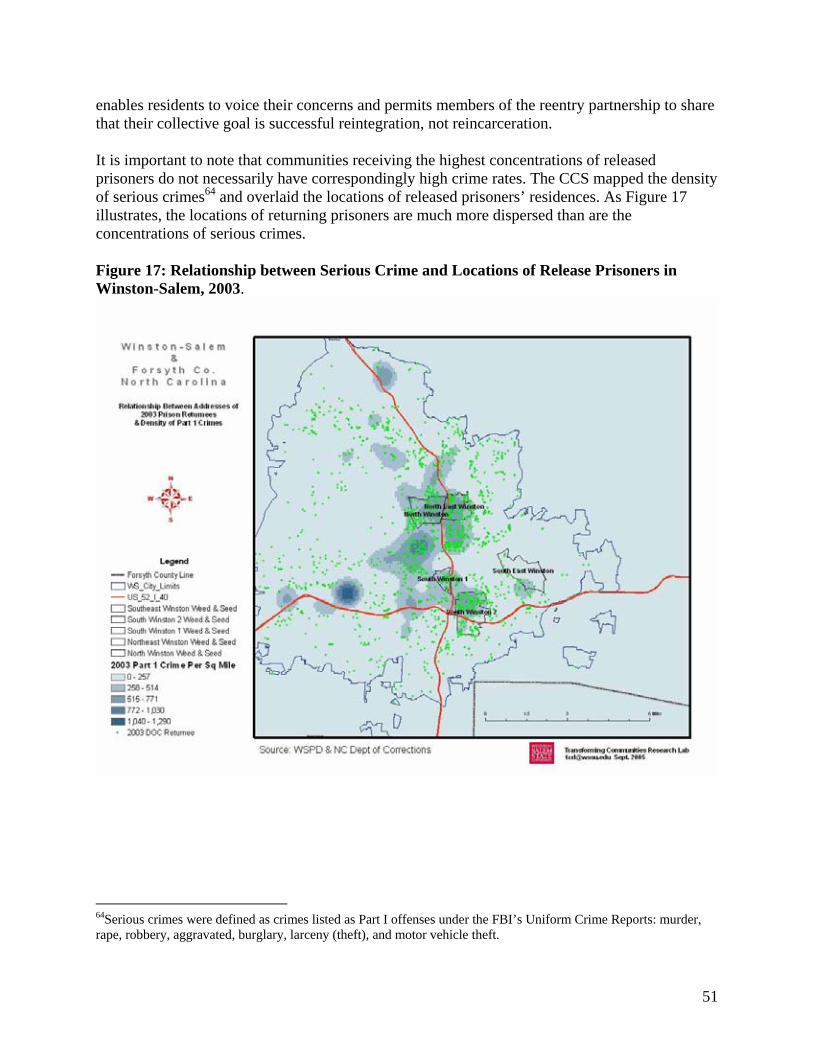
enables residents to voice their concerns and permits members of the reentry partnership to share that their collective goal is successful reintegration, not reincarceration. It is important to note that communities receiving the highest concentrations of released prisoners do not necessarily have correspondingly high crime rates. The CCS mapped the density of serious crimes64 and overlaid the locations of released prisoners’ residences. As Figure 17 illustrates, the locations of returning prisoners are much more dispersed than are the concentrations of serious crimes. Figure 17: Relationship between Serious Crime and Locations of Release Prisoners in Winston-Salem, 2003.
64Serious crimes were defined as crimes listed as Part I offenses under the FBI’s Uniform Crime Reports: murder, rape, robbery, aggravated, burglary, larceny (theft), and motor vehicle theft.
51
Using Analysis Results to Inform Action The data collection and mapping activities described in previous sections of this guidebook represent maps as the end products of a reentry mapping network partnership. Yet in some respects this is an inaccurate depiction, as the use of maps and analysis results should lead to further refinement of priorities that ultimately increase public awareness, provide more comprehensive support services, and influence public policy. Promoting Community Education and Awareness Information about the key issues related to prisoner reentry and how those issues affect communities is often not well understood among all relevant stakeholders and organizations. Reentry mapping partners can use data to create and raise awareness about reentry issues, and engage community members in developing a more precise understanding of the reentry landscape in their community. For example, Milwaukee’s Community Justice Center (CJC) needed an MIS system and a way to share outcome information with other organizations. The Nonprofit Center of Milwaukee (NPCM) developed a web database of CJC clients and tracked client outcomes in order to more efficiently communicate with referral programs. The NPCM also mapped data collected by service providers, such as Going Home and the St. Rose Youth and Family Center, to demonstrate the value of mapping for resource allocation and caseload estimation. Guiding the Planning and Implementation of Reentry Initiatives Reentry mapping can also be useful in helping residents develop long-term goals for their community and formulate strategies to achieve those goals. A comprehensive strategy provides the basis for developing specific improvement initiatives and for building partnerships for policy change. Partners have found value in targeting specific high-priority issues identified by community residents and formulating plans of action. In Winston-Salem, for example, the CSS mapped the spatial mismatch between returning prisoners and resources and services targeted to them. These maps were used as a basis for justifying a successful grant application to the Mary Babcock Reynolds Foundation to support the planning process for creating the Reentry Network Center, a one-stop resource center located close to where most prisoners are returning. Figure 18 shows one of the maps used in CCS’s analysis.
52
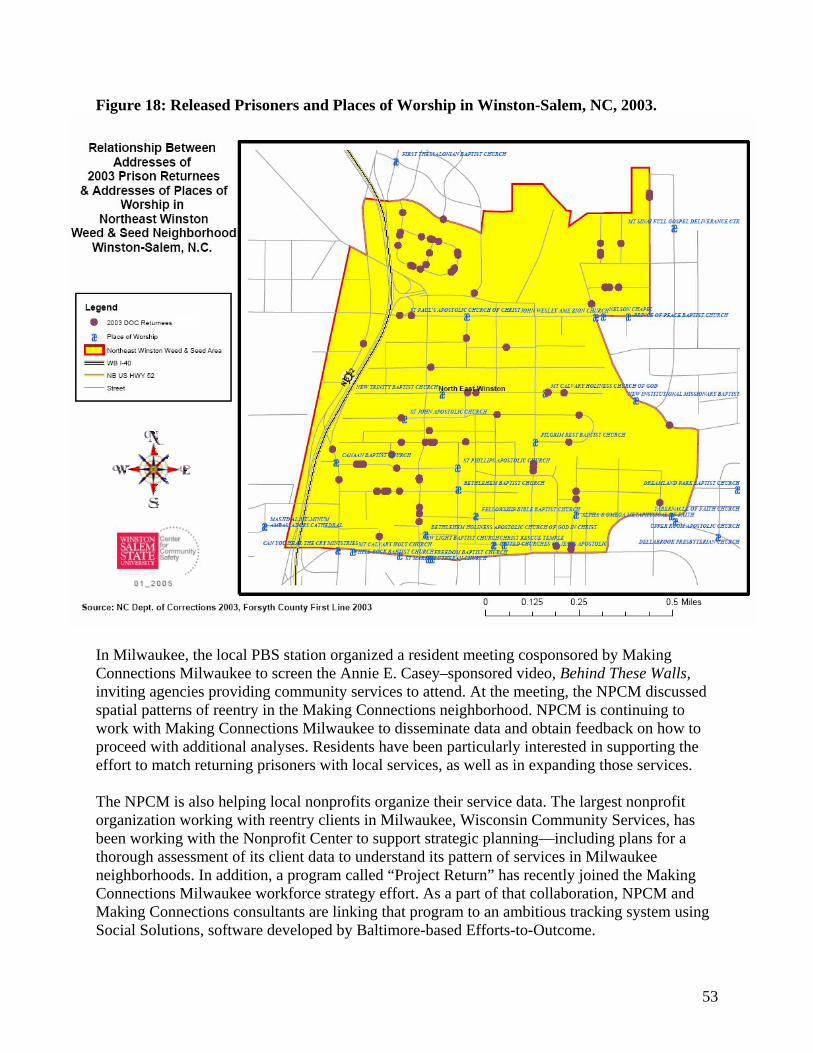
Figure 18: Released Prisoners and Places of Worship in Winston-Salem, NC, 2003.
In Milwaukee, the local PBS station organized a resident meeting cosponsored by Making Connections Milwaukee to screen the Annie E. Casey–sponsored video, Behind These Walls, inviting agencies providing community services to attend. At the meeting, the NPCM discussed spatial patterns of reentry in the Making Connections neighborhood. NPCM is continuing to work with Making Connections Milwaukee to disseminate data and obtain feedback on how to proceed with additional analyses. Residents have been particularly interested in supporting the effort to match returning prisoners with local services, as well as in expanding those services. The NPCM is also helping local nonprofits organize their service data. The largest nonprofit organization working with reentry clients in Milwaukee, Wisconsin Community Services, has been working with the Nonprofit Center to support strategic planning—including plans for a thorough assessment of its client data to understand its pattern of services in Milwaukee neighborhoods. In addition, a program called “Project Return” has recently joined the Making Connections Milwaukee workforce strategy effort. As a part of that collaboration, NPCM and Making Connections consultants are linking that program to an ambitious tracking system using Social Solutions, software developed by Baltimore-based Efforts-to-Outcome.
53
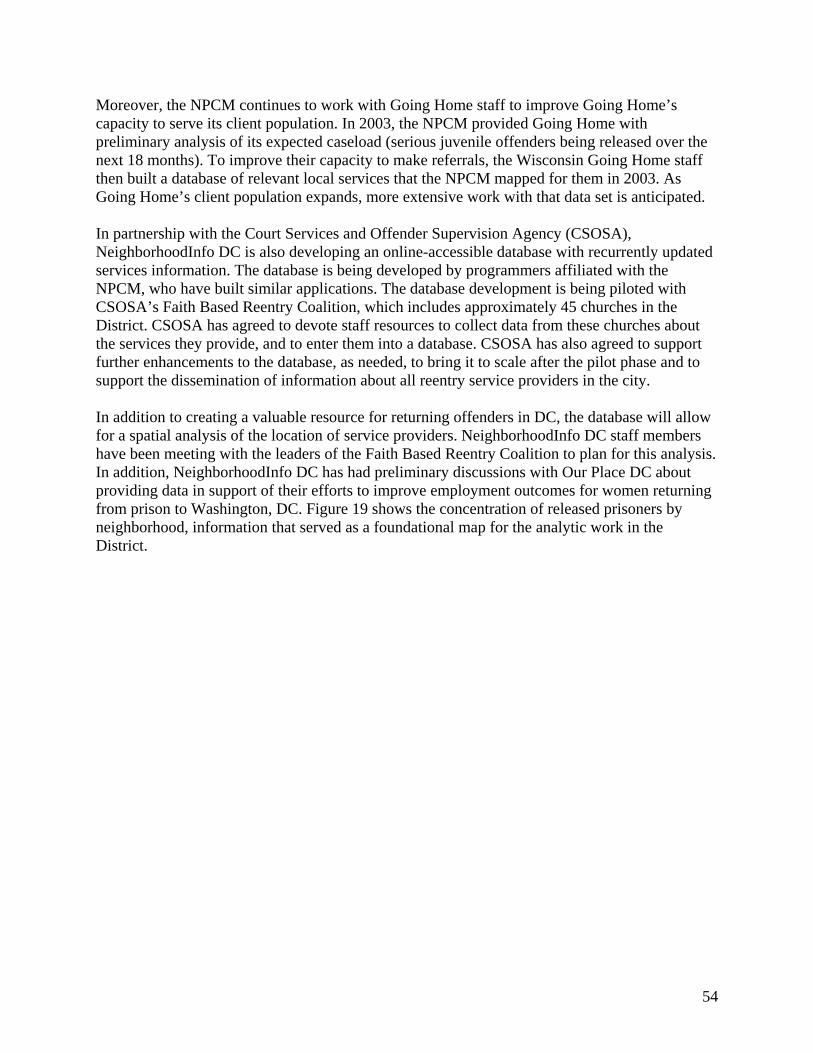
Moreover, the NPCM continues to work with Going Home staff to improve Going Home’s capacity to serve its client population. In 2003, the NPCM provided Going Home with preliminary analysis of its expected caseload (serious juvenile offenders being released over the next 18 months). To improve their capacity to make referrals, the Wisconsin Going Home staff then built a database of relevant local services that the NPCM mapped for them in 2003. As Going Home’s client population expands, more extensive work with that data set is anticipated. In partnership with the Court Services and Offender Supervision Agency (CSOSA), NeighborhoodInfo DC is also developing an online-accessible database with recurrently updated services information. The database is being developed by programmers affiliated with the NPCM, who have built similar applications. The database development is being piloted with CSOSA’s Faith Based Reentry Coalition, which includes approximately 45 churches in the District. CSOSA has agreed to devote staff resources to collect data from these churches about the services they provide, and to enter them into a database. CSOSA has also agreed to support further enhancements to the database, as needed, to bring it to scale after the pilot phase and to support the dissemination of information about all reentry service providers in the city. In addition to creating a valuable resource for returning offenders in DC, the database will allow for a spatial analysis of the location of service providers. NeighborhoodInfo DC staff members have been meeting with the leaders of the Faith Based Reentry Coalition to plan for this analysis. In addition, NeighborhoodInfo DC has had preliminary discussions with Our Place DC about providing data in support of their efforts to improve employment outcomes for women returning from prison to Washington, DC. Figure 19 shows the concentration of released prisoners by neighborhood, information that served as a foundational map for the analytic work in the District.
54
Figure 19: Released Prisoners in Washington, DC, 2004.
Source: Court S
ervices and Offender Supervision Agency Data
55
Influencing Public Policy Reentry Mapping Network partners have worked effectively to assess, influence, and change public policy in their communities. They have been able to do this by working within their community, and in some cases by partnering with groups outside their targeted neighborhoods. The CCS, for example, supplied data on abandoned buildings and returning prisoners to officials with the city’s Housing Services Department. The city recognized the reentry challenges in Winston-Salem and the connection to their abandoned building problems. In response, the city’s Housing Services Department partnered with local contractors to train former prisoners to rehab abandoned buildings in a neighborhood with a high concentration of returning prisoners. Several of the construction firms later hired ex-offenders for additional contracting work. In Milwaukee, the NPCM is using reentry data to assess Wisconsin’s 1998 truth-in-sentencing (TIS) legislation, which enacted stricter guidelines on the proportion of the total sentence prisoners must serve. This sentencing reform act greatly reduced the number of individuals exiting prisons on parole in Wisconsin, and may have implications for the experiences those sentenced under TIS have in prison as well as their level of preparation for release.
56

Creating a Sustainable Reentry Mapping Partnership As a reentry mapping partnership moves forward with action plans, it is also necessary to conduct a critical examination of available resources and staff that are dedicated to see the effort through to fruition. These questions of sustainability involve an assessment of existing and anticipated future funds, the types and mix of stakeholders currently involved in the project, and the prospects for partnerships and additional funding over time. Part of this process involves the review of earlier decisions to examine what stakeholders are involved, what key issues still need to be addressed, what data have already been obtained, what data gaps still exist, and what actions have been taken as a result of partnership’s efforts. The answers to these questions provide a framework for determining what work remains for the partnership, and how much funding it would take to complete work. The Reentry Mapping Network partners highlighted in this report are in various stages of this sustainability analysis. Most have submitted proposals to local and national funders to obtain new resources to sustain the work of their local partnerships. In discussions at the RMN’s cross-site meeting, partners suggested that successful fundraising efforts might focus on replicating existing models of reentry mapping research from other cities (such as the projects outlined in Figure 20 below). Partners may also find value in teaming up with other cities conducting similar action research projects in order to be better positioned to apply for funding from foundations with a national scope. This strategy is particularly feasible when one or more stakeholders in the partnership have affiliate organizations in other jurisdictions. Figure 20 provides an overview of potential action research topics that reentry mapping partnerships might pursue. Because of a partnership’s previous work to collect data and bring stakeholders together, engaging in these projects is unlikely to require the same initial investment that was necessary to originally launch the partnership, Figure 20: Potential Action Research Projects for Reentry Mapping Partnerships • Analyzing the availability and accessibility of services for former prisoners (an overview
of all services, examining a specific service) • Analyzing the availability of culturally relevant services • Creating educational materials for elected officials on relevant public policy issues • Engaging employers in identifying barriers to employing former prisoners and how to
overcome them • Collecting and mapping data on neighborhood assets available to former prisoners • Researching neighborhood costs of prisoner reentry • Analyzing barriers to finding housing for former prisoners • Researching the impact of reentry on families • Researching the cost of incarceration to families, children, and government • Estimating the impacts of the voter disenfranchisement of former prisoners • Analyzing legal barriers and access to public benefits for former prisoners
57
Partnering with Other Related Initiatives A key approach for sustaining the work of a reentry mapping partnership is to collaborate with other related initiatives. Reentry mapping partnerships can offer their services in support of other existing work on prisoner reentry, and in doing so may gain additional access to resources. These parallel partnerships can also be useful for obtaining data and convening common stakeholders. For example, the Serious and Violent Offender Reentry Initiative 65 grant (SVORI—also known as “Going Home”) may help partnerships gain access to data by providing additional legitimacy to the project and the need for the research itself. SVORI projects want to know where released prisoners are residing, which may present an opportunity for reentry mapping. For example, the Child and Family Policy Center (Des Moines, Iowa) has conducted a survey of former prisoners through Iowa’s SVORI. The Urban Institute, in partnership with the Research Triangle Institute, recently released its National Portrait of SVORI,66 which provides an overview of information on prisoner reentry in each of the 50 states.67
Another potential research project that might be leveraged for reentry mapping efforts is the Urban Institute’s Returning Home project. Initiated in the fall of 2001, Returning Home is a longitudinal study documenting the pathways of prisoner reintegration, examining what factors contribute to a successful or unsuccessful reentry experience, and identifying how those factors can inform policy. As part of this documentation process, data collected is fairly comprehensive and includes information on study participants’ pre-prison experiences, in-prison experiences, post-prison circumstances, and measures of attitudes, beliefs, and expectations. Official data are also collected and include state-level information pertaining to incarceration and social and economic conditions; and community-level data related to employment opportunities, availability of social services, crime rates, community social capital, and health indicators. Although none of the RMN sites currently overlap with the Returning Home study, which is being conducted in Maryland, Illinois, Ohio, and Texas, such sites possess rich quantitative and qualitative data that can greatly inform the analytical capabilities of those wishing to map prisoner reentry. The Weed and Seed Initiative also overlaps with reentry mapping work. Weed and Seed is a national grant program that aims to bolster law enforcement and community development while linking the two through community policing efforts.68 Because community members involved in Weed and Seed have working relationships with police and other institutional organizations, they make ideal members of a reentry mapping community coalition. In Winston-Salem, the CCS’s involvement in local Weed and Seed efforts positioned it to identify and engage relevant community stakeholders. Weed and Seed also uses local crime data to inform policing efforts, which presents reentry mappers with a potential source of data. Through Weed and Seed, the 65 This grant (also known as the Going Home grant), funded by the Department of Justice’s Office of Justice Programs, targets high-risk juvenile and adult offenders and provides grants to support reentry efforts that decrease serious, violent crime. Each state received around $2 million from this grant. More information about this grant is available at http://www.ojp.usdoj.gov/reentry/learn.html, and information about the award for each state is available at http://www.ojp.usdoj.gov/reentry/sar/welcome.html. 66 Lattimore et al., 2004. 67 For more information on the SVORI evaluation and related publications, see the UI/RTI SVORI web site, http://www.svori-evaluation.org/index.cfm?fuseaction=dsp_home. 68 For more information on Weed and Seed sites, see http://www.weedandseeddatacenter.org/.
58
CCS forged a relationship with the Winston-Salem County Police Department (WSPD) and subsequently acquired WSPD data. Many Reentry Mapping Network partners are also partnering with their local Making Connections69 initiative team. Currently, 9 of the 10 Making Connections cities are also RMN partners.70 Making Connections is a national program sponsored by the Annie E. Casey Foundation; it focuses on providing support to families and communities by enhancing social connectedness, linking families to local resources and services, and strengthening community members’ financial well-being. To advance these goals and objectives, partners mobilize a broad cross-section of constituencies, including community members, public agencies, private organizations, the business community, and faith-based leaders to obtain their support and investment in strengthening families in disadvantaged neighborhoods. Program partners engage these stakeholders in order to gather related information, identify community problems and resources, and discuss and test various strategies. RMN partners have benefited from access to neighborhood-level data on indices of family and community well-being through Making Connections. Making Connections partners have also forged relationships with a wide range of stakeholders that have enabled them to produce local change based on their findings. RMN partners in some sites have been able to leverage those Making Connections partnerships to support their reentry mapping efforts.
69 The information provided in this section that pertains to the Making Connections initiative was drawn from the Annie E. Casey Foundation web site, http://www.aecf.org/initiatives/ntfd/. 70 Making Connections includes 10 organizations in the following cities: Denver, Des Moines, Hartford, Indianapolis, Louisville, Milwaukee, Oakland, Providence, San Antonio, and Seattle.
59
Conclusion The experiences of the three Reentry Mapping Network sites highlighted in this guidebook have yielded a wealth of information on the specific steps that are necessary to launch a local reentry mapping partnership. These steps involve the identification of appropriate stakeholders, the acquisition of reentry-related data, the mapping and analysis of those data, and the bridging of those research findings to prompt action and ultimately lead to programs and policies that improve the prospects of successful reentry for prisoners returning to the community. These steps are not easy, and they cannot be achieved without a bare minimum of resources. The most important of those resource requirements relate to people: reentry mapping partnerships need a broad base of stakeholders, competent researchers, and individuals with leadership capabilities who have the vision to move beyond maps to community action. Preferably, those leaders include representatives from both state and local agencies and community residents. This long list of requirements may appear daunting to jurisdictions contemplating the development of a reentry mapping partnership, but in most cases the foundation for such a partnership already exists. Neither Washington, DC, nor Milwaukee, for example, had much in the way of experience in prisoner reentry issues prior to joining the RMN. Yet, interest in the topic of prisoner reentry is strong, prompted by the growing understanding by politicians on both sides of the aisle that promoting successful reentry is both important for public safety and fiscally practical given the high costs associated with perpetually returning people to prison. This interest is likely to help build support and maintain momentum for the development of reentry mapping partnerships throughout the country.
60
References Bailey, Terri. 2000. “Building Community Capacity to Use Information: Four Training Options from the Experience of the National Neighborhood Indicators Partnership.” National Neighborhood Indicators Partnership Report. Washington, DC: Urban Institute, December. Barndt, Michael. 2002. “A Model for Evaluating Public Participation GIS.” In Community Participation and Geographic Information Systems, edited by Daniel Weiner, Trevor M. Harris, and William J. Craig (346–56). London: Taylor and Francis. Cadora, Eric. 2002. “Criminal Justice and Health and Human Services: An Exploration of Overlapping Needs, Resources, and Interests in Brooklyn Neighborhoods.” Research Report. Washington, DC: Urban Institute. http://www.urban.org/UploadedPDF/410633_CriminalJustice.pdf Ditton, P.M. 1999. Mental Health and Treatment of Inmates and Probationers. Washington, DC: U.S. Department of Justice, Bureau of Justice Statistics, July, NCJ 174463. Cited in National Commission on Correctional Health Care. 2002. The Health Status of Soon-to-Be-Released Inmates: A Report to Congress, vol. 1. Washington, DC: National Institute of Justice, Office of Justice Programs, U.S. Department of Justice. Gilmore, Thomas, Jim Krantz, and Rafael Ramirez. 1986. “Action Based Modes of Inquiry and the Host-Researcher Relationship.” Consultation 5.3 (Fall). Hammett, Theodore M., Cheryl Roberts, and Sofia Kennedy. 2001. “Health-Related Issues in Prisoner Reentry.” Crime and Delinquency 47 (3): 390–409. Harlow, Caroline Wold. 2003. “Education and Correctional Populations.” Washington, DC: U.S. Department of Justice, Bureau of Justice Statistics, January, NCJ 195670. Harries, Keith. 1999. Mapping Crime: Principle and Practice. Washington, DC: U.S. Department of Justice, National Institute of Justice. Harrison, Paige M., and Allen J. Beck. 2005. Prison and Jail Inmates at Midyear 2004. Washington, DC: U.S. Department of Justice, Bureau of Justice Statistics, April, NCJ 208801. Herman, Susan, and Cressida Wasserman. 2001. “A Role for Victims in Offender Reentry.” Crime and Delinquency 47 (3): 428–45. Heywood, Ian, Sarah Cornelius, and Steve Carter. 1998. An Introduction to Geographical Information Systems. Upper Saddle River, NJ: Prentice Hall. Hughes, Timothy, and Doris J. Wilson. 2005. “Reentry Trends in the United States.” U.S. Department of Justice, Bureau of Justice Statistics. http://www.ojp.usdoj.gov/bjs/reentry/reentry.htm.
61

Karappunnan, Jaishankar. 2005. “Mapping and Corrections: Management of Offenders with Geographic Information Systems.” Corrections Compendium 30 (1, January/February). Kelling, George L., and Catherine M. Coles. 1996. Fixing Broken Windows: Restoring Order and Reducing Crime in Our Communities. New York: Touchstone. Kingsley, G. Thomas, Claudia J. Coulton, Michael Barndt, David S. Sawicki, and Peter Tatian. 1997. Mapping Your Community: Using Geographic Information to Strengthen Community Initiatives. Washington, DC: U.S. Department of Housing and Urban Development. Langan, Patrick A., and David Levin. 2002. Recidivism of Prisoners Released in 1994. Bureau of Justice Statistics Special Report. Washington, DC: U.S. Department of Justice, Office of Justice Programs. Lattimore, Pamela, Susan Burmbaugh, Christy Visher, Christine Lindquist, Laura Winterfield, Meghan Salas, and Janine Zweig. 2004. National Portrait of the Serious Violent Offender Reentry Initiative. Raleigh, NC: The Research Triangle Institute. La Vigne, Nancy G. 2004. “Why Map Prisoner Reentry?” Crime Mapping News 6 (4): 1–3. Washington, DC: The Police Foundation. www.policefoundation.org. La Vigne, Nancy G. and Vera Kachnowski. 2003. “A Portrait of Prisoner Reentry in Maryland.” Washington, DC: The Urban Institute Press. http://www.urban.org/url.cfm?ID=410655. La Vigne, Nancy G., and Cynthia A. Mamalian. 2003. “A Portrait of Prisoner Reentry in Illinois.” Washington, DC: The Urban Institute Press. http://www.urban.org/url.cfm?ID=410662. La Vigne, Nancy G., and Gillian L. Thompson. 2003. “A Portrait of Prisoner Reentry in Ohio.” Washington, DC: The Urban Institute Press. http://www.urban.org/url.cfm?ID=410891. La Vigne, Nancy G., Christy Visher, and Jennifer Castro. 2004. “Chicago Prisoners’ Experience Returning Home.” Washington, DC: The Urban Institute Press. http://www.urban.org/url.cfm?ID=311115. La Vigne, Nancy G., Amy Solomon, Karen Beckman, and Kelly Dedel Johnson. In Press. Prisoner Reentry and Community Policing: Partnerships for Public Safety. Washington, DC: U.S. Department of Justice, Office of Community Oriented Policing Services. Lewin, Kurt. 1946. “Action Research and Minority Problems.” Journal of Social Issues 2: 34-46. Lynch, James P., and William J. Sabol. 2001. “Prisoner Reentry in Perspective.” Washington, DC: The Urban Institute Press. http://www.urban.org/url.cfm?ID=410213.
62
Mamalian, Cynthia A., and Nancy G. La Vigne. 1999. “The Use of Computerized Mapping by Law Enforcement: Survey Results.” Research Preview. Washington: National Institute of Justice. Metraux, Stephen, and Dennis P. Culhane. 2004. “Homeless Shelter Use and Reincarceration Following Prison Release: Assessing the Risk.” Criminology and Public Policy 3 (2): 201–22. Monmonier, Mark. 1991. How to Lie with Maps. Chicago: University of Chicago Press. Mumola, Christopher J. 1999. “Substance Abuse and Treatment, State and Federal Prisoners, 1997.” Bureau of Justice Statistics Special Report. NCJ 172871. Washington, DC: U.S. Department of Justice, Bureau of Justice Statistics. ———. 2000. “Incarcerated Parents and Their Children.” Bureau of Justice Statistics Special Report. NCJ 182335. Washington, DC: U.S. Department of Justice, Bureau of Justice Statistics. Pettit, Kathryn L.S., G. Thomas Kingsley, and Claudia J. Coulton. 2003. Neighborhoods and Health: Building Evidence for Local Policy. Washington, D.C.: The Urban Institute, May. Available for download at http://www.urban.org/url.cfm?ID=410819. Rengert, George F. 1989. “Spatial Justice and Criminal Victimization.” Justice Quarterly 6 (4): 543–64. Rosenfeld, Richard, J. Wallman, and R. Fornango. 2005. “The Contribution of Ex-Prisoners to Crime Rates.” In Prisoner Reentry and Crime in America, edited by Jeremy Travis and Christy Visher. Cambridge, New York: Cambridge University Press. Rubin, Mark, and Michelle DeLair. 1999. Exploring Welfare-to-Work Challenges in Five Metropolitan Regions. National Neighborhood Indicators Partnership Report. Washington, DC: The Urban Institute, June. http://www.urban.org/nnip/publications.html. Tatian, Peter. 2000. Indispensable Information: Data Collection and Information Management for Healthier Communities. National Neighborhood Indicators Partnership Report. Washington, DC: The Urban Institute. http://www.urban.org/nnip/publications.html. ———. 2003. Neighborhood Change Database Data Users’ Guide. Washington, DC: The Urban Institute, October. Thoennes, Nancy. 2002. “Child Support Profile: Massachusetts Incarcerated and Paroled Parents.” Denver, CO: Center for Policy Research. Travis, Jeremy. 2005. But They All Come Back: Facing the Challenges of Prisoner Reentry. Washington, DC: The Urban Institute Press. Travis, Jeremy, and Sarah Lawrence. 2002. Beyond the Prison Gates: The State of Parole in America. Washington, DC: The Urban Institute.
63
Travis, Jeremy, Amy L. Solomon, and Michelle Waul. 2001. From Prison to Home: The Dimensions and Consequences of Prisoner Reentry. Washington, DC: The Urban Institute Press. Turner, Margery Austin, Mark Rubin, and Michelle DeLair. 1999. “National Neighborhood Indicators Partnership Project.” Washington, DC: The Urban Institute. http://www.urban.org/nnip/publications.html. Urban Institute, The. 1999. Using Information in Community Building and Local Policy. National Neighborhood Indicators Partnership Report. Washington, D.C.: Author, March. Visher, Christy, Vera Kachnowski, Nancy LaVigne, and Jeremy Travis. 2003. Baltimore Prisoners’ Experiences Returning Home. Washington, DC: The Urban Institute. Williamson, Douglas, Sarah McLafferty, Victor Goldsmith, and Phil McGuire. 1999. “A Better Method to Smooth Crime Data.” ArcUser Magazine. http://www.esri.com/news/arcuser/0199/crimedata.html. Wilson, J.Q., and G.L. Kelling. 1982. “Broken Windows.” The Atlantic Monthly 249 (3): 29–38. http://www.theatlantic.com/politics/crime/windows.htm.
64

65

APPENDIX A: THE REENTRY MAPPING NETWORK: CASE STUDIES FROM THREE SITES
In 2002, The Urban Institute established the Reentry Mapping Network (RMN), an action research partnership with jurisdictions across the country engaged in mapping and analyzing data to help inform local prisoner reentry efforts. Funded by the Annie E. Casey Foundation and the National Institute of Justice (NIJ), the Network’s primary objective is to mobilize key stakeholders in 12 U.S. cities to devise data-driven and coordinated strategies that will effectively address reentry-related problems. This report assesses the efforts of partners in three of those Reentry Mapping Network communities: NeighborhoodInfo DC in Washington, DC; the Center for Community Safety in Winston-Salem, NC; and the Non-Profit Center of Milwaukee, in Milwaukee, WI. The report explores how successful each of these partners was in obtaining and using data to improve reentry related strategies and policies in their communities. It also summarizes the goals accomplished, the challenges overcome, and the lessons learned about reentry mapping in Winston-Salem, Milwaukee, and Washington, DC. The potential for replicating these experiences in other communities is discussed, along with a summary of partner institutions’ assessments of the Network.1 REENTRY MAPPING NETWORK PARTNERSHIP DEVELOPMENT The Reentry Mapping Network project was formed to help communities harness the power of mapping to aid in local prisoner reintegration efforts. The RMN selected its first members in April of 2003: Des Moines, IA, Milwaukee, WI, Oakland, CA, Providence, RI, Washington, DC, and Winston-Salem, NC. These partners were not provided with funding at this time, although the Urban Institute did provide technical support to the partners in support of their data collection efforts. In October of 2003, the NIJ provided funding to support the RMN. This included funding for the infrastructure of the Network to be managed by the Urban Institute, as well as $25,000 each for three partners to support their local reentry-related activities. Specifically, Milwaukee, WI, Washington, DC, and Winston-Salem, NC, were selected to receive funding to support reentry-related data collection, analysis, and community engagement because they represented a good mix of reentry problems and planned approaches. The selection of these three sites was also influenced by NIJ’s interests based upon both topic area and previous NIJ investments.2 Each $25,000 grant with local RMN partners was initiated in January of 2004 for a period of 12 months. During those 12 months, each partner was expected to successfully collect address-level data on offenders returning to their community, produce maps and analysis describing reentry
1 This assessment model draws from Barndt, 2002. 2 Milwaukee, for example, is an NIJ COMPASS site, and the RMN work dovetails off of COMPASS work that has already been done. In addition, Winston-Salem is a former SACSI site and currently is a part of Project Safe Neighborhoods.
66
patterns in their community, and work with local stakeholders to use the data for improving reentry-related programs and policies. Each of the three partners selected to receive grants had a different focus for their projects. Winston-Salem focused on community planning and the identification of community assets; Washington, DC, focused on forming a collaboration across faith-based institutions; and Milwaukee focused on coordination across social service agencies. In September 2004, an additional six partners joined the RMN. Those RMN partners not supported with local grants through NIJ funding have been able to move their local reentry mapping work forward with funding provided by the Annie E. Casey Foundation. The Reentry Mapping Network has also selected two communities as Network affiliates. Affiliates do not receive funding from RMN grants.3 SITE PROJECTS, CHALLENGES, AND ACCOMPLISHMENTS As members of the Reentry Mapping Network, partners collect and analyze local data related to incarceration, reentry, and community well-being; develop policy options based on the findings; use the findings to engage community stakeholders toward community improvement; and document their findings and lessons learned. The following section describes these activities with the reentry mapping partnerships in Winston-Salem, Milwaukee, and Washington, DC. These descriptions draw from reports submitted by the partners in these cities, as well as from observations made by Urban Institute staff during site visits to interview key reentry partnership stakeholders. Winston-Salem, NC The Winston-Salem Reentry Mapping Network project is managed by the Center for Community Safety (CCS), a public service and research center of Winston-Salem State University.4 Working with community partners, CCS initiates analysis and research on community safety issues and then helps shape action and response. In addition to the RMN project, CCS also manages the Weed and Seed5 initiative for Winston-Salem, is heavily involved in Project Safe Neighborhoods,6 and helps coordinate the Serious and Violent Offender Re-Entry Initiative7 for Winston-Salem. By integrating these various initiatives within a central hub, the CCS is able to leverage resources, encourage collaborative responses, and ensure the sustainability of each project. The CCS has emerged as a strong advocate for reentry issues regionally and statewide. In collaboration with the Urban Institute, CCS hosted a local reentry roundtable in January 2002 in
3 Organizations that become Reentry Mapping Network affiliates are invited to attend select RMN meetings as observers and to participate in the RMN email list, which enables participants to share questions, ideas, and lessons learned. Affiliates do not receive funding or technical support from UI. 4 For more information on the Center for Community Safety, see http://www.centerforcommunitysafety.org/. 5 For more information about the Weed and Seed program, see http://www.ojp.usdoj.gov/ccdo/ 6 For more information about Project Safe Neighborhoods, visit http://www.projectsafeneighborhoods.gov/ 7 Fro more information about the Serious and Violent Offender Reentry Initiative (SVORI), visit http://www.svori-evaluation.org/
67

which Jeremy Travis, Senior Fellow at the Urban Institute, shared data from his report “But They All Come Back.” Later that year, CCS contracted with UI staff to conduct two focus groups with successfully reintegrated and recently released prisoners to identify the needs and services of released prisoners and to help launch a local strategic planning effort on reentry. This initial work focused on the Northeast Winston-Salem neighborhood, characterized by high concentrations of returning prisoners as well as high rates of crime, open-air drug markets, unemployment, and poverty. Northeast Winston-Salem is also one of five designated Weed and Seed neighborhoods in the city. The RMN project enabled CCS to continue focusing on this neighborhood to help support a community-based effort to assist ex-prisoners in reintegrating into a neighborhood already beset by numerous challenges, and to create a model for other similar neighborhoods. For their RMN project, the Center set out to determine for this neighborhood: 1. Who are the returning ex-prisoners and where are they returning? 2. Is there a relationship between areas of return and neighborhood crime rates? 3. To what extent are returning ex-prisoners involved in the criminal offenses being committed
in Northeast Winston-Salem? 4. What are the existing risk factors and assets/resources in the community to which the ex-
prisoners are returning? and 5. What other assets/resources, such as skills possessed by individuals, are available to address
needs within the community?
Data Access and Quality Data were obtained from the North Carolina Department of Corrections (DOC), the Forsyth County Sheriff’s Department (Forsyth County Detention Center [FCDC]) and the North Carolina Department of Juvenile Justice and Delinquency Prevention (DJJDP). The DOC data set contained individual characteristics of released prisoners, such as basic demographic data and data on conviction offense, incarceration date, release date, and status upon release (expiration of sentence or parole release). These data included all prisoners returning to Winston-Salem in 2003 and 2004. The FCDC data also contained individual characteristics for inmates who exited the Detention Center during 2003. The DJJDP data set included data on juveniles returned to the community from Youth Development Centers (training schools) in 2003. CCS staff initially achieved a 70 percent match rate8 when geocoding the DOC, FCDC, and NCDJJDP data. With cleaning, that rate rose to between 87 percent and 95 percent, depending on the data source. The CCS also accessed data from other governmental sources. The CCS received crime data, including data about victims, suspects, and offenders, from the Winston-Salem Police Department. The Winston-Salem Transit Authority provided files containing transportation routes across the city. The CCS also acquired data from the Winston-Salem city/county planning department GIS site, including: building structures, tax parcels, corporate limits, FEMA
8 The geocoding match or “hit” rate reflects the share of all addresses for which staff were able to assign geographic coordinates.
68
floodplain boundaries, fire stations, hydrography, police sectors, schools, voting precincts, zoning, color aerials, fire demand zones, hydrants, planimetrics and topography, recreation centers and parks, voting polling places, wards, and zoning jurisdictions. At a more local level, the CCS facilitated a data collection project, conducted by community residents and released prisoners trained in data collection, to record the precise location community risks and assets within the Northeast Winston-Salem neighborhood. This project helped to develop participation and ownership of the reentry mapping work in the community. In addition, through the Mayor’s Transitional Jobs Network, the CCS completed an employers’ survey, which looked at hiring practices and preferences among employers in Winston-Salem and Forsyth County. Though it is not specific to the Northeast Winston-Salem neighborhood, the survey included employers in that area. Community Engagement The CCS developed a community engagement plan to help the neighborhood best address the challenges of high concentrations of released prisoners. A key component of this plan was partnering with a grassroots organization, Eureka Ministries, to develop a reentry coalition that involved adequate representation of community residents in the decisionmaking process. Eureka Ministries operates a transitional home for male prisoners returning to Winston-Salem, and thus was already intimately familiar with the reentry challenges experienced in the city, many of which are linked to the absence of family and community connections, service/support gaps, and current policy and laws that impede prisoners’ reintegration. In the spring of 2003, Eureka Ministries launched its Faith Seeds Reentry Coalition, a community-driven process to address the issues of reentry. The Coalition is facilitated by a volunteer consultant and cochaired by a released prisoner and a member of the clergy. Its goal is to use a community-based approach to engage released prisoners, community members, and other stakeholders in restoring and revitalizing the community through the application of asset mapping, education, community action, and development of human capital—all toward the goal of reducing recidivism. A critical challenge facing the CCS was the need to build legitimacy with community organizations and residents in implementing its grassroots/community-based engagement strategy. This challenge was evident in the difficulties the CCS encountered with a survey they planned to field in partnership with the Faith Seeds Reentry Coalition. The survey was intended to collect data from released prisoners about their job skills and other assets they could contribute to their community. Its purpose was to identify training and business development opportunities unlikely to be discovered through traditional employment surveys and workforce development programs. After initially agreeing to help administer the survey, coalition members reconsidered, indicating that their neighborhood had been “over-surveyed,” and that researchers were taking community members’ time and effort without leaving any value behind. As a result, the CCS decided not to field the survey at that time (the CCS is considering launching it in the future, but only with community support from local community development corporations). Instead of pursuing the survey, the CCS focused on ensuring that the Faith Seeds Reentry Coalition would be representative of community members and released prisoners so that research plans would produce findings of value to the community. For example, to ensure community
69

participation in and ownership of the coalition’s work, CCS decided to delay including service providers in the initial stages of coalition building in order to allow the Coalition to develop without the influence of outside service providers, who might have goals conflicting with those of local residents. Unfortunately, this strategy has made it more difficult to collaborate with local service providers now that the Coalition is proceeding with plans for a Reentry Network Center, which will rely upon service providers for support and referrals. CCS is making progress in easing these tensions through ongoing dialogue with key service providers. Another unanticipated roadblock was the conflicting objectives of different members of the faith community, which made it difficult for CCS and Faith Seeds to gain the full cooperation of all parties. The partnership addressed this problem by identifying and working with only those organizations that were willing to collaborate and work towards a common goal. Mapping and Analysis The CCS achieved success in investigating each of their research questions, and their analysis proved critical to coalition-building efforts. Initially, the CCS was concerned that presenting maps of released prisoners within high-concentration communities would lead residents and other stakeholders to assume that where there are ex-prisoners, there will be crime. Instead, CCS’s analysis of the relationship between crime and reentry showed that this was not necessarily the case. While the CCS found a correlation between crime and reentry citywide, this correlation did not hold within a subset of neighborhoods with a high number of released prisoners. The CCS also found that while the released prisoner recidivism rate in Winston-Salem was comparable to the national rate of recidivism, released prisoners were not disproportionately contributing to the crime rates in their neighborhoods. Within the Northeast Weed and Seed neighborhood, for example, ex-prisoners represent 2.33 percent of the neighborhood’s population, and the 106 charges they faced were 2.58 percent of the total offenses in that neighborhood in 2003. This type of analysis and its findings helped to build a positive community dialogue on prisoner reentry, public safety, and stigmatization. In addition to maps of crime and reentry, the CCS produced maps depicting the locations of returning offenders from DOC, FCDC, and DJJDP; the locations of local institutions, such as churches, schools, service providers in Northeast Winston-Salem; and the locations of major employers and transportation in the entire city. Additional census data (e.g., housing, income, and employment) and data from the WSPD (e.g., open-air drug markets, hot spots, and high calls-for-service locations) provided a balanced analysis of community needs, risks, and assets. The CCS maps showed a scarcity of resources and assets or economic opportunities in those parts of the neighborhood where concentrations of released prisoners are highest. More pointedly, they learned that locations with high concentrations of released prisoners are more likely to be those with open-air drug markets and abandoned buildings. Results and Lessons Learned The CCS’s mapping and analytic work has enhanced discussions at neighborhood planning sessions and generated creative ideas and possible solutions to prisoner reentry in the area. During a community problem-solving session in July of 2004, CCS maps and data detailing
70
abandoned building locations and concentrations of unemployed released prisoners prompted a significant change in public policy. Upon reviewing the data, city officials redirected a construction-training program to focus on training released prisoners from Northeast Winston-Salem. In addition, Eureka House has used CCS maps to target outreach and recruitment for a released-prisoner support group. The CCS’s mapping and analytic work also sparked the idea for the one-stop Reentry Network Center. Maps depicting the spatial mismatch between released prisoners and resources in Winston-Salem led directly to plans for creating a center to meet the needs of released prisoners. The Reentry Network Center stands to have a significant and lasting impact on reentry policy and practice in Winston-Salem. As the main focus of the Faith Seeds Reentry Coalition, the Center is seen as a collaborative, community-based, service coordination center, offering a continuum of services for released prisoners. The Center will be located in the Northeast Winston-Salem neighborhood and be managed by released prisoners and human service professionals. The Center’s board, composed of representatives of faith-based organizations, community members, corrections officials, and various other reentry stakeholders, will draw heavily from the Faith Seeds Reentry Coalition. Faith Seeds Coalition members have expressed that data and maps from the CCS were instrumental in all aspects of their reentry work. Data provided by the CCS played an important role in mobilizing initial participation in the Coalition as it expanded to include other service providers, city officials, and community members. At regularly scheduled reentry meetings, the CCS provided the Coalition with data reports and maps as they became available. The CCS data and maps also helped demonstrate to community members the need for creating the Reentry Network Center. The CCS also provided guidance as to the value that the Center could bring to community residents. The CCS will continue to provide data and analysis for the Faith Seeds Coalition as additional research questions are raised. For example, Coalition members are interested in knowing the number, percentage, and characteristics of neighborhood members who are currently incarcerated and on probation; the percentage of males removed from the neighborhood through incarceration; and other indicators of the overall impact that the criminal justice system has on the stability and human capital of the neighborhood. These analyses will continue to fuel the CCS’s reentry work. In addition to these contributions to local reentry efforts, the CCS has made major investments in developing a community-oriented research lab with GIS mapping capabilities. The lab, which is a collaborative effort among the CCS, the City of Winston-Salem, and Forsyth County, will explore a variety of topics related to community well-being. Given this investment in mapping and the extensive data collected for its RMN project, the CCS is well positioned to remain involved with the Faith Seeds Reentry Coalition in producing maps and data analysis to support its work. The CCS also continues to collaborate with community members, training them to collect neighborhood survey data that can inform resource mapping and future decisionmaking. The greatest remaining challenge for CCS will be managing the mounting requests for maps and data analysis resulting from its outreach work.
71
Milwaukee, WI The Nonprofit Center of Milwaukee’s Neighborhood Data Center is the lead Reentry Mapping Network partner in Milwaukee. The Nonprofit Center of Milwaukee is an association of nonprofit organizations that provides technical support, training, and services to the nonprofit community. The Center’s purpose is to dispense the tools that nonprofits need to successfully fulfill their missions and improve the lives of people in the community. The Neighborhood Data Center is the Nonprofit Center’s analytic arm, serving as a clearinghouse for mapping and analysis support as well as for community data on housing, health, safety and local assets. Project COMPASS9 was also a lead partner with the Data Center at the inception of the Reentry Mapping Network partnership in Milwaukee. The COMPASS program at the City of Milwaukee originated as one of three pilot programs sponsored by the National Institute of Justice to model the use of data and mapping for community problem solving around issues of public safety and community well-being. Project COMPASS played a significant role in assisting the Data Center in building relationships within the corrections field to obtain and use reentry-related data. Initially, the Milwaukee reentry mapping partnership planned to use spatial analysis to:
1. identify and depict the relationship of risks and assets to concentrations of ex-prisoners; 2. identify all agencies providing services to released prisoners; 3. generate data-driven problem solving within a consortium or network consisting of DOC
and other reentry service providers; and 4. collaboratively develop new or improved policy responses to build the capacity and
stability of neighborhoods with high concentrations of ex-prisoners. Data Access and Quality At the onset of the project, the climate for accessing data could not have been more favorable. Relationships with the state Department of Corrections and the local police and sheriff’s offices had already been established during the three-year development of the COMPASS project. The value of organizing data to address community safety problems had been demonstrated, and the Data Center had already demonstrated its experience in working with sensitive data. Corrections officials shared preliminary data shortly after the Data Center began its reentry mapping partnership. This included data about all persons under supervision, including street address, statute violation (e.g. felony, misdemeanor), age, gender and race. The most significant limitation of these initial data was that they did not distinguish between offenders released to probation and offenders released to parole. It did have some limited value in estimating the overall spatial patterns of reentry in Milwaukee, though, because nearly all Wisconsin offenders are released to some form of supervision. Despite this early data acquisition victory, it took the Data Center more than a year to obtain more refined data from the Department of Corrections (DOC). The DOC’s Management 9 For more information on COMPASS Milwaukee, see http://isdweb1.ci.mil.wi.us/compass/.
72

Information System (MIS) consisted of several legacy databases—one for community corrections, one for prison management, one for assessment and programming for inmates, and yet another to track the criminal charges and court dispositions. Although a single ID number could serve as a unique identifier with which to link information across data sets, differences in the degree to which the data sets were updated created problems in doing so, as one file could be out of sync with records in other files. Fortunately, the Data Center was able to identify a data analyst within the DOC’s Community Corrections Unit who understood how to tie the systems together and generate file structures that could yield accurate information. After a legal review of the Data Center’s request (including a review of applicable privacy guidelines with regard to health data10), the actual programming began for the data extract. In January 2005, the Data Center obtained biannual data snapshots of released prisoners in the DOC system from 1997 to 2004. These snapshots pictured everyone in the DOC system at a particular time (in this case, twice annually on the first Tuesday of March and September). These snapshots include data detailing offender residence prior to incarceration, residence following incarceration, incarceration dates, most serious offense, supervision status, supervision termination date, birth year, race/ethnicity, gender, program needs and participation status while incarcerated, work skills and drug/alcohol risks assessments, and previous incarceration. The combined data set obtained from the DOC was extremely rich, yet it had its share of shortcomings. In numerous cases, addresses were missing or turned out to be inaccurate representations of a person’s actual residence in the community (e.g., a local jail or INS detention center). The volume of individuals cycling in and out of the correctional system also presented a significant problem, as the snapshots do not capture individuals who are incarcerated, released, and reincarcerated within short periods of time. Perhaps the greatest challenge associated with this data set was the time required to extract useful information from it. The Data Center has obtained an extraordinarily complete portrait of reentry in Milwaukee through these data snapshots. Much work remained, however, in creating usable maps and data analysis. While corrections data proved more difficult to obtain than expected, other data sources were easily accessible. Data on crime incidents were already available through the COMPASS program. Prior agreements became the basis for accessing Sheriff’s department information on arrests, and the Data Center program already possessed well-developed demographic and neighborhood characteristics data. Data on local service programs was very limited at first, although the Data Center made progress during the project on collecting this information by working with the local service providers. Community Engagement Prior to receiving data from the state DOC, the Data Center generated interest in reentry mapping in Milwaukee by demonstrating its benefits to local service providers. For example, Milwaukee’s Community Justice Center (CJC) needed an MIS system and a way to share outcome information 10 For more information, see http://www.hhs.gov/ocr/hipaa/.
73
with other organizations for referral purposes. The Data Center developed a web-based database for profiling CJC clients and tracking client outcomes, enabling more efficient communication with outside referral programs. The Data Center also mapped data collected by service providers, such as the St. Rose Youth and Family Center, to demonstrate the use of reentry mapping for allocating resources. More recently, the Data Center has focused its community engagement efforts on working with Making Connections Milwaukee. Funded by the Annie E. Casey Foundation, Making Connections is a neighborhood revitalization program focusing on distressed neighborhoods in 10 U.S. cites, including Milwaukee.11 Making Connections Milwaukee partnered with the Milwaukee PBS station to organize a screening of a video on incarceration and reentry, Behind These Walls, which residents and community services agencies attended. At the meeting, the Data Center presented data illustrating reentry patterns within the Making Connections neighborhood. The Data Center has continued to work with Making Connections Milwaukee to share data and obtain feedback on how to proceed with its analysis. Residents were particularly interested in supporting the effort to match released prisoners to local social services as well as to expand those programs. The community engagement effort with Making Connections Milwaukee developed relatively late in the timeline of the reentry mapping partnership in Milwaukee. This effort, however, represents a promising and sustainable application of reentry mapping toward informing community-based initiatives. With the help of Making Connections Milwaukee, the Nonprofit Center Data Center program will identify key indicators of reentry challenges and successes, assess their potential strengths and weaknesses, and create templates allowing the easy tracking of these indicators at six-month intervals. This work will be essential to informing strategic decisions made by the Making Connections initiative. These demonstrations of reentry mapping and analysis will continue for the foreseeable future. Wisconsin Community Services, the largest nonprofit organization serving reentry clients in Milwaukee, has been working with the Data Center in support of its strategic planning, including a planned assessment of its client data to understand its pattern of services in Milwaukee neighborhoods. In addition, the Data Center will be working with the Hope Project, a new partner of Making Connections Milwaukee, to design a data-driven workforce strategy for released prisoners. Mapping and Analysis Using the DOC snapshots, the Data Center created summary profiles for all persons under correctional supervision in 2003 and analyzed the spatial patterns of their locations within the City of Milwaukee. The Data Center has cleaned and organized queries of the extensive DOC data set in preparation for further mapping of the multiyear prisoner release cohorts. This analysis will focus on selecting indicators of successful reentry by released prisoners and 11 For information about the Annie E. Casey Foundation’s Making Connections initiative, visit http://www.aecf.org/initiatives/ntfd/
74

assessing their quality, examining shifts in population characteristics and spatial distributions over time, and assessing flows of individuals through the corrections system longitudinally. The Data Center will also compare the different experiences of persons sentenced under “truth in sentencing”12 provisions with those prisoners sentenced prior to those sentencing reforms. Department of Corrections and local nonprofit organizations have agreed to review and provide guidance for these forthcoming analyses. The Data Center’s relationship with Making Connections Milwaukee will enable it to undertake more focused analysis incorporating neighborhood-level data provided by the Making Connections team. The Data Center has also worked with the Wisconsin Going Home13 staff to improve Going Home’s capacity to serve their client population. To improve their capacity to make referrals, the Wisconsin Going Home staff built a database of relevant local services that the Data Center mapped for them. Results and Lessons Learned The Data Center, through its partnership with Making Connections Milwaukee, is positioned to continue reentry-mapping work well beyond the end of the NIJ grant period. In addition, because the Data Center has received time-series, address-level data (for which they will receive updates every six months), they are uniquely positioned to a make a substantial contribution to the continued exploration of reentry challenges in Milwaukee. Early results and impact of the Data Center’s reentry mapping efforts are difficult to assess because of the extraordinary investment in time and resources needed to obtain and analyze DOC data. The Data Center faced considerable challenges in collecting and analyzing DOC data because the state system included several distinct subsystems that required complex programming to link together. The Data Center may have had earlier and more tangible results had it made a more conventional request for one calendar year’s worth of data on a single release cohort. From an analytic perspective, the construction of this data set also presented a second challenge: frequent changes in supervision status and address data among individual released prisoners over time made assessing patterns of release difficult. Rather than create a seamless file with all changes in status (linked across each relevant file at the point of that change), the Data Center developed a file system that provided data snapshots in six-month intervals. The start and end dates within snapshots allow reconstructing all but very short episodes of incarceration. A major challenge now facing the Data Center is releasing the data for review and use by multiple service providers and community-based stakeholders. Although there is significant interest in and support from the Making Connections Milwaukee partners with regard to prisoner
12 For more information about Truth in Sentencing in Wisconsin, visit http://www.wicourts.gov/services/judge/truth.htm 13 “Going Home” is Wisconsin’s application of the federal Serious and Violent Offender Reentry Initiative (SVORI) grant. For more information, see http://www.ojp.usdoj.gov/reentry/sar/wi.html.
75
reentry issues, the broader community of stakeholders has no pre-existing network. For example, individual organizations may be familiar with each other’s work, but they lack an established venue at which to convene and discuss collaboration or coordination of efforts. As a result, the Data Center is challenged with serving as the lead convenor of relevant stakeholders and is tasked with providing a sustainable and supportive infrastructure that allows stakeholders to collaborate on projects and initiatives that result from reviewing the results of the Data Center’s mapping and analytic work. The Data Center has already begun to overcome this challenge by convening initial community meetings with relevant stakeholders to review reentry maps. Several meetings were held in 2004, and one in 2005, at which the Data Center was able to present preliminary maps. The meeting in 2004 included reentry stakeholders, agency representatives, and service providers—ranging from the DOC to a prison ministry group. In the 2005 meeting, the Data Center shared preliminary maps and data from a snapshot of all probation and parole persons currently under supervision. At this meeting, a number of organizations learned about each other for the first time, and those present expressed interest in collaborating on a regular basis and committed to convene for subsequent meetings later in 2005. The Data Center’s original community engagement strategy was to convene relevant organizations after the reentry data had been acquired and fully mapped and analyzed. The Data Center made an intentional decision to carry forward with obtaining a complex database, at the expense of delaying this community engagement goal. This strategy resulted in the acquisition of an extremely useful data set though, which may yield a powerful, long-term payoff in informing reentry planning in Milwaukee. In the short term, however, the most notable result from this work in Milwaukee is the development of potential in the form of a rich database of reentry-related information and a sustainable community partnership with Making Connections Milwaukee to support the use of that database.
Washington, DC NeighborhoodInfo DC is the lead reentry mapping network partner in Washington, DC. Established as a partnership between the Urban Institute and the Washington, DC Local Initiatives Support Corporation (LISC), NeighborhoodInfo DC provides community-based organizations and residents in the District of Columbia with local data and analysis they can use to improve the quality of life in their neighborhoods. The Urban Institute brings its broad experience in data collection, processing, and analysis, as well as its expertise in public policy research, neighborhood indicators, and economic development to this NeighborhoodInfo DC partnership. LISC brings to the partnership its expertise in community outreach with organizations that have interest in using data to address neighborhood and citywide issues. LISC makes use of its partner organizations throughout the city, and also reaches out to new groups with which it has not previously had a relationship. NeighborhoodInfo DC is the successor to DC Agenda’s Neighborhood Information Service. DC Agenda was originally selected as the grant recipient and lead partner for the Reentry Mapping Network partnership in Washington, DC. In March of 2004, however, DC Agenda’s Board announced the closing of the organization. Most of the staff members, including those working
76
on the Reentry Mapping Network partnership, were laid off effective the first week of April 2004. This presented significant challenges for the District’s continued participation in the Reentry Mapping Network. The program capacities of DC Agenda’s Neighborhood Information Services were quickly transferred and reorganized at the Urban Institute, however, and became operational by May 2004. A key staff person from DC Agenda was also hired by the Urban Institute in late May, and took up the charge to continue Washington DC’s involvement in the Network. Since the capacities needed to make progress in building a reentry mapping partnership were quickly reestablished after DC Agenda’s closing, the decision was made (in consultation with the project’s NIJ grant monitor) to proceed with building a reentry mapping partnership in Washington, DC, with NeighborhoodInfo DC in the lead. NeighborhoodInfo DC set out to conduct spatial analysis of the location of released prisoners in the District to:
1. identify and depict the relationship of assets (and risks) to concentrations of ex-prisoners; 2. generate problem solving from within the community and responsible service providers
and agencies; and 3. inform decisionmaking on better ways to build the capacity and stability of
neighborhoods with high concentrations of ex-prisoners.
Data Access and Quality Prior to the closing of DC Agenda, data on released prisoners in the Washington, DC, had not yet been obtained. NeighborhoodInfo DC immediately renewed efforts to obtain these data. The city is unique in comparison with other Reentry Mapping Network partners with regard to the source for data about released prisoners. An independent federal agency, the Court Services and Offender Supervision Agency (CSOSA), manages probation, parole, and other supervision for released prisoners coming home to the District. NeighborhoodInfo DC worked with staff at CSOSA’s Research and Evaluation Office to better understand what data they would be willing to provide, and to shape a formal data request. The formal data request to CSOSA’s Research and Review Board (RRB) was submitted in October 2004. The RRB reviewed and approved the request in January 2005, and data were transferred in March 2005. CSOSA staff members were receptive to working with NeighborhoodInfo DC staff to assist in transferring and interpreting the data. Immediately after receiving approval to obtain the data, staff from NeighborhoodInfo DC met with CSOSA research analysts to review all of the variables available in their data systems and discuss appropriate methods for delivering the data. Based on the recommendations of the CSOSA’s RRB, NeighborhoodInfo DC was given record-level data on all parolees and other supervised releasees returning to Washington, DC, in 2004. The data were provided with census tract identifiers, and CSOSA agreed to supply quarterly updates of these data. The data include race/ethnicity, age, gender, education level, marital status, and employment status for released prisoners. While these data are useful for estimating general spatial patterns of reentry in Washington, DC, they are rough estimates because they are not based on address-level data and
77

are limited to persons under criminal justice supervision rather than a cohort of released prisoners. NeighborhoodInfo DC has excellent access to contextual data about District neighborhoods. Its data warehouse includes information from local government agencies (DC Dept. of Human Services, DC Office of Planning, Metropolitan Police Dept., DC Superior Court, and State Center for Health Statistics), as well as nationally available data sources (Census, Home Mortgage Disclosure Act, and U.S. Dept. of Housing and Urban Development). Community Engagement When NeighborhoodInfo DC took on the work of the reentry mapping partnership in May of 2004, the opportunity to create results in the time frame allowed by the Reentry Mapping Network grant was already very short. DC Agenda had held some initial community conversations on employment issues prior to its closing, but these conversations were very preliminary and did not present a promising set of relationships for generating action in accordance with the project’s timeline. Instead, NeighborhoodInfo DC set out to identify an existing group of community stakeholders who were already collaborating to provide better opportunities for the successful return of prisoners to Washington, DC, neighborhoods. This focus quickly connected NeighborhoodInfo DC to the Faith-Based Reentry Initiative. Facilitated by CSOSA, the Faith-Based Reentry Initiative is a partnership of approximately 40 churches in Washington, DC, that provide mentoring and service referrals for released prisoners. A meeting was scheduled with NeighborhoodInfo DC staff and the leaders of the Faith-Based Initiative to discuss the Reentry Mapping Network and identify priorities for data collection that would inform the work of their Initiative. Staff from both CSOSA and Washington, DC’s Pre-Trial Services Agency also participated in this discussion. At this meeting, as well as in subsequent meetings with individual leaders of the Faith-Based Reentry Initiative, it became apparent that information about services available to released prisoners in the District was sorely lacking. In particular, the Initiative’s leaders indicated that they had some usable information about where services were located, but nothing about the eligibility criteria or capacity of the programs at specific locations. NeighborhoodInfo has focused its analytic plans on addressing these information gaps. The Faith-Based Reentry Initiative participants have become a natural audience for reviewing maps and other analytic products from NeighborhoodInfo DC’s analysis of CSOSA data. This project focus on services was a change from the initial research direction established by DC Agenda, however. As such, a completely new data request needed to be submitted to CSOSA.14
Mapping and Analysis In addition to using data provided by CSOSA to map patterns of reentry in Washington, DC, NeighborhoodInfo DC is focusing on obtaining better data on organizations providing services 14 This explains the delay between May, when NeighborhoodInfo DC took over the project, and October, when the request for reentry data was formally submitted to CSOSA.
78

for released prisoners. While a number of existing resource directories describe services available to released prisoners in the capital, most of these directories have proven to be outdated and lack the detail necessary to understand program eligibility requirements and capacities at service locations. In addition, a review of these directories and other nonprofit service databases reveals that information about small, faith-based programs for released prisoners are particularly difficult to identify. To begin to fill critical information gaps, as well as to develop a data source for better understanding deficits in services for released prisoners in Washington, DC, NeighborhoodInfo DC is partnering with CSOSA to develop a database of services for released prisoners. Rather than reinventing the wheel, CSOSA and NeighborhoodInfo DC sought the expertise of staff at the Nonprofit Center of Milwaukee’s Data Center, who had developed a similar database for their own reentry mapping project. This database could be easily adapted for use in the District at a fraction of the costs required to build a database from scratch. The database will initially be populated with information on the services provided by the 52 churches in the Faith-Based Reentry Initiative. Staff members from CSOSA have been assigned to work with each individual church to get their program information entered and updated on a regular basis. This pilot database will serve as a model that can be expanded to include a broader set of service providers. Once populated, it will also provide the underlying data about where programs are located, as well as their eligibility requirements and capacities—information that is critical in analyzing and responding to service gaps for released prisoners. The database will also be accessible on the Internet for mentors in the Faith-Based Reentry Initiative so that they can look up information about services for those they are guiding. In June, analysis plans for the CSOSA data were presented at a meeting of the coordinators of the Faith-Based Reentry Initiative for review and feedback. These discussions included a review of maps of the spatial concentration of parolees and supervised releasees in Washington, DC. Since that meeting, additional maps overlaying parolee/supervisee location with transitional housing facilities, as well as with information about changes in home values have been produced to begin to analyze gaps in housing availability for released prisoners. This analysis will be used in discussions with stakeholders about housing services for released prisoners in the District. Now that a working relationship has been established between NeighborhoodInfo DC and CSOSA, prospects are favorable for obtaining address-level data later in 2005. Results and Lessons Learned In a relatively short time period, NeighborhoodInfo DC has engineered the development of the information infrastructure needed to analyze the location of released prisoners and the location and characteristics of services that can be most useful to them. Although much work remains to be completed, the development of the services database will be supported by CSOSA in the future, which is key to the sustainability of this information resource. In addition, NeighborhoodInfo DC works on a number of parallel projects that will allow continued analysis of reentry data from CSOSA. In particular, NeighborhoodInfo DC will be conducting analyses and producing maps on women who are returning from prison to
79
Washington, DC as part of a project with the Washington Area Women’s Foundation. Maps and analyses on the housing needs of released prisoners are also being produced by NeighborhoodInfo DC for an annual publication on the housing market in Washington DC. LESSONS LEARNED FROM THREE COMMUNITIES The reentry mapping partners in Winston-Salem, Milwaukee, and Washington, DC, each started their projects with ambitious agendas for data collection and analysis, community engagement, and impacting reentry policy and practice. The following section explores the similarities and differences between the achievements and challenges faced in each of these three communities in carrying out those agendas. Data Access and Quality Winston-Salem, Washington, DC, and Milwaukee all had profoundly different experiences in accessing data, with each site receiving crucial reentry-related data at different stages in their projects. Winston-Salem had relatively immediate success in obtaining their data. In Washington, DC, it took six months to receive the data once a request was submitted. In Milwaukee, it took over a year for the Data Center’s request to be met. As will be discussed later, these differences in the timing of data acquisition had an impact on the overall progress and accomplishments achieved in each of the sites. The data providers in each of these three cities were receptive to sharing their data for use in support of reentry mapping partnerships. While these positive working relationships helped the RMN partners in shaping their data requests, the experiences in Milwaukee and Washington, DC, also prove that a willing partner does not necessarily translate into a quick transfer of data. The data requests submitted by partners had to be reviewed and approved by the data provider’s Institutional Review Board to ensure that necessary steps would be taken the safeguard sensitive reentry-related data. In Washington, DC, and Milwaukee, the review and approval process took longer than anticipated. NeighborhoodInfo DC’s data request to CSOSA suffered from unfortunate timing because it was received six weeks before the CSOSA Research Review Board’s (RRB’s)15 next meeting, and thus was not reviewed until that time. In Milwaukee, data security issues were raised by lawyers with the state Department of Corrections rather than a review board, also delaying the data acquisition process. In Winston-Salem, the project staff’s success in obtaining data quickly may have been closely related to the relative simplicity of their data request as well as the level of sophistication characterizing the DOC’s MIS, which made it relatively easy to provide the CCS with an extract of data from their system. Likewise, in Washington, DC, once CSOSA’s RRB approved NeighborhoodInfo DC’s request, data were ready for delivery shortly thereafter.
15 CSOSA’s Research Review Board reviews all data requests to ensure that the requestors conform to best practices for securing sensitive data sets.
80

In contrast, the Data Center in Milwaukee requested a complicated multiyear data set, which required significant planning and programming by DOC staff. The planning and programming to extract the data began before the DOC’s legal team provided final approval for data delivery. Had the Data Center and DOC waited for final approval to begin planning and programming, it would have taken even longer for the data transfer to occur. A measure of caution can be taken from this experience: complex data may take more time and resources to acquire and use, and may not be worth the time and effort, given the importance of developing and gaining momentum early in the project. Timing issues aside, the data set acquired by the Data Center is extremely valuable in developing indicators to measure changes in reentry patterns in Milwaukee neighborhoods. The data include information that is often not found in administrative data sets available to researchers, such as information about released prisoners’ program needs, work skills, and drug/alcohol risk assessments. Although the Winston-Salem network was not able to obtain this level of detail in the data received from its DOC, sufficient data were acquired for its reentry mapping analysis. NeighborhoodInfo DC’s reentry data, however, was of limited value for the analysis they planned to conduct. Without address-level data, it is not possible to thoroughly analyze spatial patterns of reentry in comparison with community assets and risks. Their inability to obtain address-level data is the result of the limited amount of time NeighborhoodInfo DC had to work with CSOSA in shaping a data request that would address the RRB’s concerns about releasing address-level data. The prospects for obtaining address-level data in the future are good for NeighborhoodInfo DC, however. This partner has been able to use this initial transfer of census tract–level data as an opportunity to learn more about what is available from CSOSA’s data system, as well as to better understand and respond to the specific data security concerns of its RRB. Lessons Learned about Data Access and Quality
Based on these experiences, it is clear that a good working relationship with data providers has some payoff in terms of shaping data requests and in facilitating a quick transfer of data. Complex data requests, and long processes for reviewing data requests, however, may delay the timing of the data transfer and can impact all aspects of the reentry mapping project.
Community Engagement The community engagement approaches demonstrated by these three partnerships included a grass-roots, community-based approach in Winston-Salem, and approaches in Milwaukee and Washington, DC, that are much more closely connected to service providers and corrections stakeholders. The Winston-Salem community engagement approach fostered the development of a significant level of community ownership in the review and use of reentry maps. This tactic was largely due to the existence of a group of participants who were willing to join and lead the Faith Seeds Reentry Coalition. By encouraging early community ownership of the project, the CCS alleviated community concerns that the reentry mapping project would be driven exclusively by
81
institutional actors, such as corrections officials, law enforcement, and service providers. In the absence of guidance from the Coalition, the CCS believes that they would have worked more directly with service providers from the outset of their reentry mapping project. NeighborhoodInfo DC and the Nonprofit Data Center in Milwaukee both approached community engagement with the intention of involving all relevant stakeholders simultaneously. This approach presents some challenges; it means involving community-oriented stakeholders that are apprehensive about working with service providers and government stakeholders (as was the case in Winston-Salem). The approach, however, also avoids having to work backwards to involve the service providers and government stakeholders in a project that is already well underway. Each of these approaches to community engagement produced different results for their communities. The focus on community-oriented stakeholders in Winston-Salem helped to involve key organizations and individuals who otherwise would not have developed the level of trust and ownership in the project that has led to their sustained involvement through the Coalition. In Washington, DC, the close connection to an existing initiative and with corrections stakeholders was necessary to create a sustainable information resource for both referral and mapping purposes. In Milwaukee, coordination among service providers was ad hoc and limited. This lack of coordination among reentry stakeholders, and the absence of an existing community-based coalition (such as the Faith Seeds Reentry Coalition in Winston-Salem), required the partnership to focus on being broadly inclusive so as not alienate any key stakeholders early in their coordination efforts. Notably, though, Milwaukee also chose to delay much of their community engagement activity until they had worked through their challenges with obtaining data. This decision made it difficult to assemble stakeholders quickly once data had been received. Milwaukee gained some momentum early with regard to engaging community in their reentry mapping work by connecting with the COMPASS project. This momentum was difficult to sustain, however, when COMPASS encountered funding difficulties after NIJ decided not to provide continuation funding to Milwaukee COMPASS and the other two COMPASS pilot sites.16 While a partner such as COMPASS might not have made a difference in the time it took for Milwaukee to obtain DOC data, COMPASS could have been a natural ally in pulling together reentry stakeholders. It is clear that the connection of the three reentry mapping partnerships to other, independent reentry-related initiatives generated some payoff in supporting stakeholder involvement in the partnership.
Lessons Learned about Community Engagement Whether by design (as in Winston-Salem) or by necessity (as in Washington, DC), connecting reentry mapping work to existing partnerships or initiatives creates opportunities for a substantial impact on reentry policy and practice in a relatively short time frame.
16 COMPASS was also piloted in Seattle, Washington, and Redlands/San Bernardino County, California.
82
Mapping and Analysis Winston-Salem was the only RMN partner among the three described in this report to make substantial progress in investigating their initial research questions. Having received data later than anticipated, Washington, DC, and Milwaukee are still working on producing maps to answer their questions of interest. Each of the three RMN partners committed to sharing maps with stakeholders, offering them an opportunity to provide input and feedback on the maps, as well as receiving input and feedback on additional maps the stakeholders wanted to have made. The Center for Community Safety in Winston-Salem has formalized this process into a regular meeting to discuss progress and next steps for reentry mapping and analysis. Washington, DC, and Milwaukee are also beginning to have these types of meetings. A challenge common to all of the RMN partners in facilitating stakeholder input into plans for mapping and analysis is the lack of data to address issues of fundamental importance. For example, Washington, DC, and Milwaukee stakeholders are interested in seeing more mapping and other data about services for released prisoners. Winston-Salem stakeholders wanted more data about community assets. In each of these cases, very little data exist. The RMN partners have started to collect the data from existing sources, as well as by fielding new data collection projects. In Washington, DC, faith-based service providers are actively participating in completing the database of information about services for released prisoners. In Winston-Salem, released prisoners helped with collecting data about community assets. Recruiting stakeholders in those data collection projects is important to maintaining their involvement in the reentry mapping partnership during the interim period during which sufficient data to answer their questions is lacking. Lessons Learned about Mapping and Analysis
Discussions with reentry mapping stakeholders about maps and other data analysis are likely to reveal significant gaps in needed data. Primary data collection projects may be needed to fill these gaps. Continued stakeholder involvement in the reentry mapping partnership can be enhanced by involving them in these data collection projects.
Informing Policy and Practice The partnerships in Winston-Salem, Milwaukee, and Washington, DC, placed varying degrees of emphasis on the key project components: data collection and analysis, community engagement, and the use of data to impact reentry policy and practice. These variations had a tangible impact on the overall achievements in each community.
• Taking advantage of a strong community infrastructure and a smooth transfer of data from the North Carolina DOC, the CCS was able to focus on using its data with the Faith Seeds Coalition to impact reentry policy and practice through the development of a one-stop reentry service center and the creation of a construction training program for released prisoners.
• The Nonprofit Data Center in Milwaukee had to address competing priorities of obtaining
and analyzing a complicated data set and convening a reentry stakeholder group that had little experience working together. The Center chose to focus on obtaining and analyzing
83
the data, and positioning itself to use its analytic work to develop and catalyze the agenda of reentry stakeholders. Thus, the policy and practical implications of the Center’s work remain to be seen.
• NeighborhoodInfo DC also juggled competing priorities, along with the challenge of
managing those priorities in a relatively short time frame. Rather than convening a new group of stakeholders, it connected to the infrastructure of an ongoing initiative. This strategy allowed focus on data collection and analysis and ways to connect that with the work of the Faith-Based Reentry Initiative to impact reentry policy and practice. The lag in accomplishments due to the change in leadership (from DC Agenda to NeighborhoodInfo DC), however, means that the DC reentry partnership has not yet achieved any tangible results in terms of influencing policies or the provision of services for released prisoners.
These experiences suggest that, in order to impact reentry policy and practice, reentry mapping partnerships must place equal emphasis on both data collection and analysis and engaging the community in using the data. Lack of adequate development in either of these two components will hinder the partnership’s ability to achieve results. The Reentry Mapping Network Approach In support of these partnerships collecting, analyzing and using data, the Urban Institute (UI) engaged in a variety of technical assistance and peer learning activities. These activities included holding an annual RMN conference, providing on-site support, promoting the exchange of information across all RMN sites, working with sites to disseminate findings and lessons learned, and monitoring each site’s progress through bimonthly updates. The following section details these activities, as well as an assessment by RMN partners of the Urban Institute’s role in the RMN. Technical Assistance to RMN Partners As RMN partners developed their projects, Urban Institute staff provided technical assistance and resources to support the partners’ efforts. The Urban Institute’s goals in supporting RMN partners included providing assistance with collecting and analyzing reentry-related data, engaging key community stakeholders throughout the process, presenting findings in an accessible way to stakeholders, and devising strategies to address identified problems. The Winston-Salem, Milwaukee, and Washington, DC, partnerships, for example, all faced some degree of challenge with acquiring reentry data for their community. The partners needed assistance with identifying what data elements to request and how to address confidentiality concerns. The Urban Institute provided each site with documentation about data that the DOCs might be able to make available to them, confidentiality issues that might arise in accessing and using these data, and strategies for managing these confidentiality issues. These resources were
84
developed at the Urban Institute, based on Justice Policy Center staff members’ experience with and knowledge about collecting data from corrections departments across the country.17 The Urban Institute also drew from the expertise within its Justice Policy Center to create a guide for creating reentry maps, which serves as a resource for partners in determining the appropriate mapping techniques to employ for their intended audiences. In addition, in each of these cities, Urban Institute staff attended community meetings, presented information about reentry mapping to stakeholders, and provided feedback and perspective about the sites’ agendas. Urban Institute staff members were also available to assist in RMN partners’ efforts to sustain their work through additional fundraising. This assistance included reviewing proposals, writing letters of support, and participating in conference calls and meetings with potential funders. Each RMN partner was also provided with a fundraising profile for their community, detailing local and national funders that have made grants related to reentry issues. Web Site and Email Group Urban Institute staff maintain a monthly updated web site for RMN partners containing administrative resources, relevant research, sample maps and reports, and technical assistance tools. Partners use these resources in their planning, analysis, and community engagement work. The web site contains four main sections: Partnership Information, RMN Resources, Partner Contributions, and UI Research and Publications. The web site is password protected so that partners can freely share presentations and papers that may be helpful to RMN colleagues, regardless of whether the presentation or paper has been thoroughly edited for broader public release. Partnership Information includes Reentry Mapping Network project summaries for the Network as a whole, as well as periodic updates on activities from each Network partner. This section also includes basic administrative tools, such as the schedule for Network meetings and conference calls, and Network contact sheets. The RMN Resources section contains resources intended to guide partners’ RMN work. The Getting Started subsection includes sample data requests and data nondisclosure agreements, sample data dictionaries, and a guide to developing a research agenda. The Mapping and Analysis subsection contains a basic guide to creating reentry maps, advanced mapping guides, and other reports on mapping neighborhood level data. The Community subsection features resources to guide the planning of community roundtables. Partner Contributions includes reentry maps and reports from RMN partners, as well as PowerPoint presentations used by partners in their community meetings. The web site’s UI Research and Publications section contains research reports and presentations by UI staff and other reentry research. UI contributions include reports from UI’s Returning Home Project, and presentations made by UI researchers on mapping and community at meetings and conferences. Other resources in this section cover reentry-related reports on housing and employment, as well as reports on the legal barriers to reentry in communities. 17 For more specific guidance on data access and confidentiality issues, see the Accessing Data section of this Guidebook.
85
The Urban Institute also distributes select resources to RMN partners via email. Emails are usually sent on a monthly basis, and resources from the email are archived on the Network web site. In addition to distributing resources such as those described above, the email list has been used to inform partners about funding opportunities and upcoming conferences. This communication method has made it easy to share timely information about deadlines for solicitations for proposals or conference participation. Conference Calls In addition to virtual communication with Network partners via email and the web, the Urban Institute holds bimonthly conference calls with partners to facilitate peer learning, involve the sites in the Network’s development, and sustain the project’s momentum. Calls are structured around preidentified topics that might help to inform and guide RMN partners in their work. In the early months of the Reentry Mapping Network in 2003, conference calls were geared toward getting RMN partners communicating with one another, as well as serving as a forum for discussing such issues as planning the initial phases of each partner’s projects, writing data-sharing agreements, creating maps, and obtaining data sets and data dictionaries. As partners continued to work on these issues, the conference calls emerged as a forum for partners to discuss with each other and UI staff the common obstacles they encountered and strategies for overcoming them. This theme has continued into 2005, as the RMN has expanded to 12 cities. The calls currently serve as a forum for partners to talk about common issues, as well as share lessons learned for the benefit of the RMN’s newest group of partners. The conference calls have also been used as an opportunity to keep RMN partners up-to-date on current reentry research and policy issues. Nancy Fishman of the New Jersey Institute for Social Justice spoke to RMN partners about her experiences and lessons learned in planning and convening local reentry roundtables. Betsey Nevins of the Reentry Policy Council (RPC) spoke about the RPC’s report on prisoner reentry and discussed key strategies for impacting reentry policy and practice, engaging the community, and attracting positive media coverage.18 Gene Guerrero of the Open Society Institute’s Policy Center gave a presentation detailing the Second Chance Act under Congressional consideration, discussing how the bill could affect a partner’s work locally.19 Cross-Site Meetings In October 2003, the Urban Institute convened the first of two Reentry Mapping Network conferences. This first cross-site conference was held over two days in Washington, DC, with two representatives from each of the first six RMN partners, including representatives from Milwaukee, Washington, DC, and Winston-Salem. The focus of the conference was for partners to present and obtain feedback on their project strategies, with ample time allotted for discussion 18 The Reentry Policy Council’s report is available for download at http://www.reentrypolicy.org/documents/rpc_report.pdf. 19 The Open Society Institute’s work on reentry issues can be obtained at http://www.opensocietypolicycenter.org/issues/issue.php?docId=13.
86
of those strategies by all partners and UI staff. In addition, a small number of national experts on reentry mapping attended and made presentations on community-level mapping, analysis, and reentry issues. In addition, a second Reentry Mapping Network conference was held in New Orleans over November 30h to December 1, 2004. Representatives from all 12 RMN partners were present, again including Milwaukee, Washington, DC, and Winston-Salem. Each site presented results from their projects and exchanged ideas regarding data collection and analysis, community engagement strategies, and the future of the Reentry Mapping Network. The conferences were valuable opportunities for partners to meet, share experiences, and discuss project strategies. The Urban Institute then surveyed partners about the second conference in New Orleans. Fifteen of 17 who attended rated the conference’s networking opportunities as useful or extremely useful. All 17 attendees found the site presentations and discussions either useful or extremely useful. Thirteen of 17 attendees indicated that topical presentations on recent reentry-related research were useful or extremely useful. RMN partners also collaborated to present project results at other reentry-related conferences. For example, Urban Institute staff collaborated with RMN partners from Winston-Salem and Milwaukee to present at the National Institute of Justice’s International Crime Mapping Research Conference, held in Boston in April 2004. In addition, in June 2005, Urban Institute staff collaborated with RMN partners from Winston-Salem and San Diego at the Innovative Technologies for Community Corrections Conference in Seattle, sponsored by the National Law Enforcement and Corrections Technology Center. These presentations provided additional opportunities for RMN partners to share project experiences with each other, as well as with wider audiences. Assessment of the Reentry Mapping Network In order to obtain critical feedback on the RMN structure and UI’s role as Network facilitator, UI conducted a survey of the RMN partners about the assistance and resources they provided to partners. Of the key staff members from each of the first six RMN partners selected (including Winston-Salem, Milwaukee, and Washington, DC), 12 people responded to the survey (two from each city). Survey results are also included in Appendix A. In this survey, partners indicated that they have been accessing and using resources provided on the RMN web site. Specifically, nine respondents are using presentations, maps, and reports from other RMN partners; eight respondents are using the web site to access research and reports about prisoner reentry; and another four respondents are using the web site to obtain more information about how to map reentry. Partners also indicated that they found email broadcasts, conference calls, and the annual conferences to be useful. In addition, the survey revealed that when partners contacted each other directly to discuss common issues, the interaction was very productive (although the frequency of this interaction was not high). RMN partners gave mixed ratings for the technical assistance the Urban Institute provided on different aspects of their projects. These results, however, reflect the individual observations of
87
staff with RMN partners. So, for example, a low rating by staff at a particular site as the assistance the Urban Institute provided in gaining access to reentry data would not be surprising, because gaining access to the data might have required little assistance in that particular case. By contrast, the same site could have rated UI highly on the support staff members provided in analyzing and interpreting data. Partners were also asked in this survey to indicate how they used their subgrants. Each RMN site receives a $25,000 subgrant to help offset the costs of participating in the Network. On average, partners spent 88 percent of their project resources on staff time (including paid consultants). Two partners spent approximately 10 percent of their resources on software needed for the project. The remaining spending categories included direct costs (e.g., equipment and supplies) and costs associated with meeting (e.g., food, facilities charges, and audiovisual equipment). Four partners submitted open-ended comments. The comments were supportive of the RMN’s work, indicating that the peer learning provided by RMN helped sites gain a richer understanding of reentry issues, and that being a member of RMN gave them credibility, which helped to generate ongoing support for the project (all four comments are included with Appendix B). RMN partners have indicated that the Network has added value to their work locally. Two of the first six partners selected in the Network indicated that it is unlikely that they would have engaged in reentry mapping had they not been selected as RMN partners. Even among those who would have pursued this work regardless of membership in the Network, several partners indicated that participating in the RMN helped move them forward more deliberately. One partner commented on the Partnership Survey that their selection as an RMN partner was the catalyst for getting them started with local reentry research. The Urban Institute provided partners with varying support, depending on their needs. In Winston-Salem, for example, UI provided assistance with interpreting and mapping DOC data, which was instrumental in creating the packet of materials that was used at community problem-solving sessions. In Milwaukee, the Data Center was able to draw upon the experience of the Urban Institute and other sites in designing the programming approach to extract data from the state DOC system. UI provided Milwaukee with advice on the types and structure of data to request from the DOC. Collaboration among partners in the Network also played a vital role in supporting local reentry projects. The database developed in Washington, DC, to create an information resource about services for released prisoners draws from the design for a similar database created by the Nonprofit Data Center in Milwaukee. NeighborhoodInfo DC was able to leverage this available resource from the Center to create a valuable resource at a fraction of what it would have otherwise cost to develop. The opportunities for partners to interact with each other and with the Urban Institute through the Network enable these types of collaborations to occur. In addition, the Network approach also creates opportunities for funded, cross-community action research projects. Cross-community action research projects similar to the RMN, and like the one conducted by the Urban Institute in
88
2003 on improving neighborhood health outcomes,20 present communities with more opportunities to build their capacity to collect and analyze data for a new field of research or specific issues. In the context of reentry, the Network approach can potentially connect sites to opportunities to conduct research on common reentry-related issues, such as employment barriers or voter disenfranchisement. Overall, it appears that the key value that the Network added to the reentry mapping partnerships is that it improved the work in individual communities by introducing partners to best practices in reentry mapping, connecting them to partners conducting similar research, and increasing the prospects for sustaining the action research partnership. REPLICATING REENTRY MAPPING IN OTHER COMMUNITIES The experiences of Winston-Salem, Milwaukee, and Washington, DC, establish a baseline of knowledge about reentry mapping that is useful for informing efforts by other jurisdictions to establish reentry mapping partnerships. Included in this baseline of knowledge is the lesson that this type of work is likely to require additional resources or the reallocation of existing ones. Any number of challenges, such as challenges with obtaining data, can potentially require some resource investment to overcome. Even in an ideal scenario, where data is easily obtained and stakeholders are already well organized, there is much work to be done to translate research findings into action. In addition, the experiences in RMN communities reveal that obtaining and analyzing data, convening stakeholders, and using data are all processes that are subject to unpredictable timelines. New reentry mapping partnerships should have some sense of urgency about their work, but must be able to move forward without unreasonable pressure or expectations about the timing of results. SUMMARY The prospects for continuing the reentry mapping work in Winston-Salem, Milwaukee, and Washington, DC, are good. The achievements of these three sites during the course of this project include some identifiable impact of reentry practices, and the development of the potential for much more policy-relevant work in the future. It is encouraging that all three communities have obtained data and produced at least basic summary maps. It is also promising that stakeholders in each community are reviewing the maps, and have expressed that they are valuable and useful for their work. This project has generated many important lessons that can be applied in support of developing reentry mapping partnerships in other cities. The experience in Winston-Salem shows that potential reentry mapping partnerships need not have already developed neighborhood data warehouses in order to get started with reentry mapping. And, as all three sites experienced, a commitment to building relationships with key stakeholders can yield benefits through all phases of the project, helping reentry mapping partnerships achieve their goals.
20 Pettit et al., 2003
89
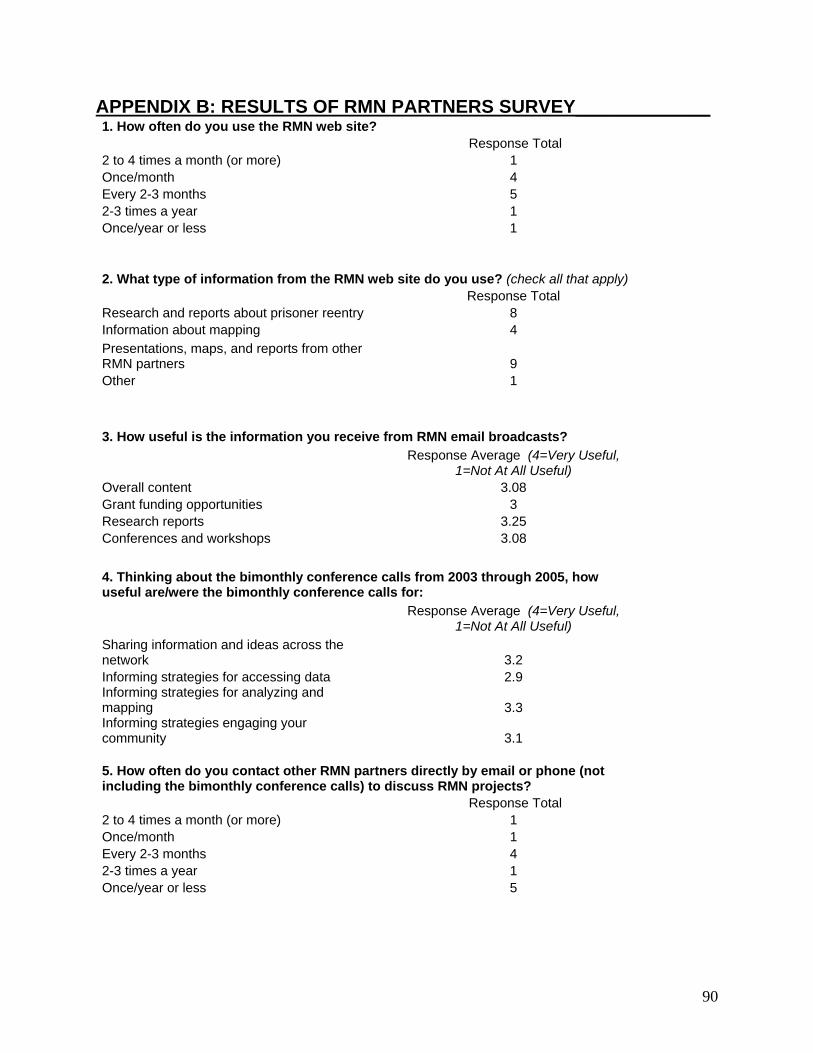
APPENDIX B: RESULTS OF RMN PARTNERS SURVEY_____________1. How often do you use the RMN web site? Response Total 2 to 4 times a month (or more) 1 Once/month 4 Every 2-3 months 5 2-3 times a year 1 Once/year or less 1
2. What type of information from the RMN web site do you use? (check all that apply) Response Total Research and reports about prisoner reentry 8 Information about mapping 4 Presentations, maps, and reports from other RMN partners 9 Other 1
3. How useful is the information you receive from RMN email broadcasts?
Response Average (4=Very Useful,
1=Not At All Useful) Overall content 3.08 Grant funding opportunities 3 Research reports 3.25 Conferences and workshops 3.08 4. Thinking about the bimonthly conference calls from 2003 through 2005, how useful are/were the bimonthly conference calls for:
Response Average (4=Very Useful,
1=Not At All Useful) Sharing information and ideas across the network 3.2 Informing strategies for accessing data 2.9 Informing strategies for analyzing and mapping 3.3 Informing strategies engaging your community 3.1 5. How often do you contact other RMN partners directly by email or phone (not including the bimonthly conference calls) to discuss RMN projects? Response Total 2 to 4 times a month (or more) 1 Once/month 1 Every 2-3 months 4 2-3 times a year 1 Once/year or less 5
90
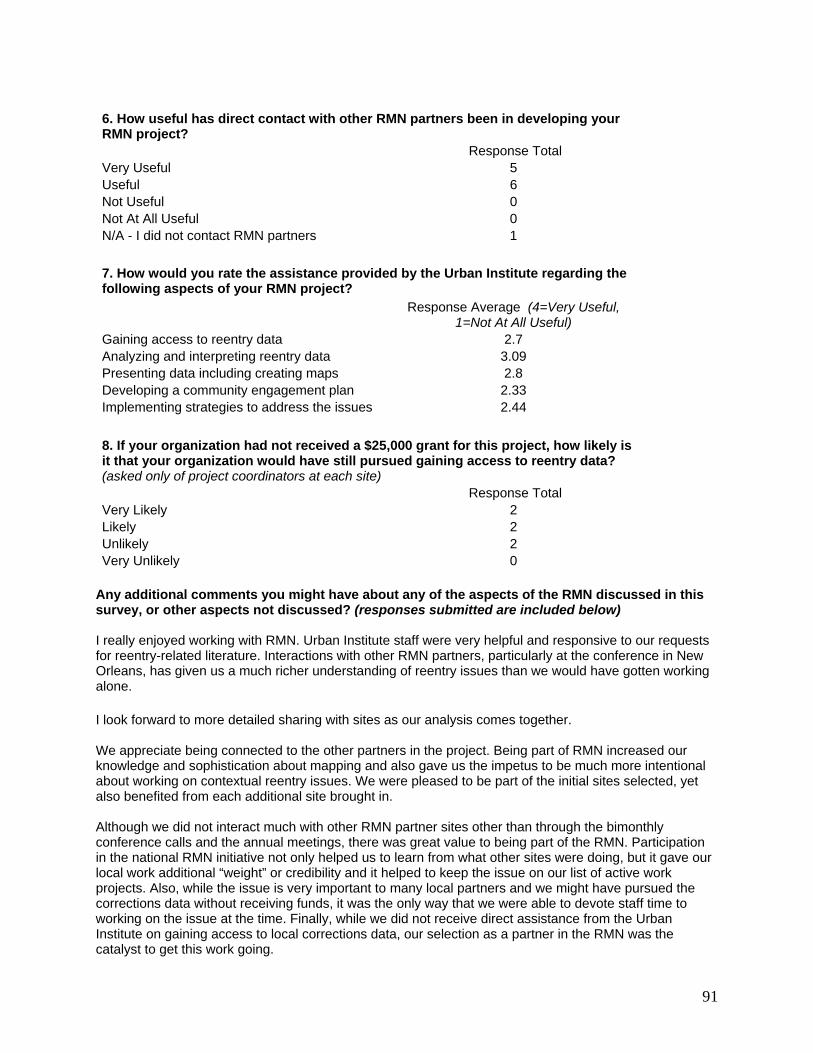
6. How useful has direct contact with other RMN partners been in developing your RMN project? Response Total Very Useful 5 Useful 6 Not Useful 0 Not At All Useful 0 N/A - I did not contact RMN partners 1 7. How would you rate the assistance provided by the Urban Institute regarding the following aspects of your RMN project?
Response Average (4=Very Useful,
1=Not At All Useful) Gaining access to reentry data 2.7 Analyzing and interpreting reentry data 3.09 Presenting data including creating maps 2.8 Developing a community engagement plan 2.33 Implementing strategies to address the issues 2.44 8. If your organization had not received a $25,000 grant for this project, how likely is it that your organization would have still pursued gaining access to reentry data? (asked only of project coordinators at each site) Response Total Very Likely 2 Likely 2 Unlikely 2 Very Unlikely 0
Any additional comments you might have about any of the aspects of the RMN discussed in this survey, or other aspects not discussed? (responses submitted are included below) I really enjoyed working with RMN. Urban Institute staff were very helpful and responsive to our requests for reentry-related literature. Interactions with other RMN partners, particularly at the conference in New Orleans, has given us a much richer understanding of reentry issues than we would have gotten working alone. I look forward to more detailed sharing with sites as our analysis comes together. We appreciate being connected to the other partners in the project. Being part of RMN increased our knowledge and sophistication about mapping and also gave us the impetus to be much more intentional about working on contextual reentry issues. We were pleased to be part of the initial sites selected, yet also benefited from each additional site brought in. Although we did not interact much with other RMN partner sites other than through the bimonthly conference calls and the annual meetings, there was great value to being part of the RMN. Participation in the national RMN initiative not only helped us to learn from what other sites were doing, but it gave our local work additional “weight” or credibility and it helped to keep the issue on our list of active work projects. Also, while the issue is very important to many local partners and we might have pursued the corrections data without receiving funds, it was the only way that we were able to devote staff time to working on the issue at the time. Finally, while we did not receive direct assistance from the Urban Institute on gaining access to local corrections data, our selection as a partner in the RMN was the catalyst to get this work going.
91
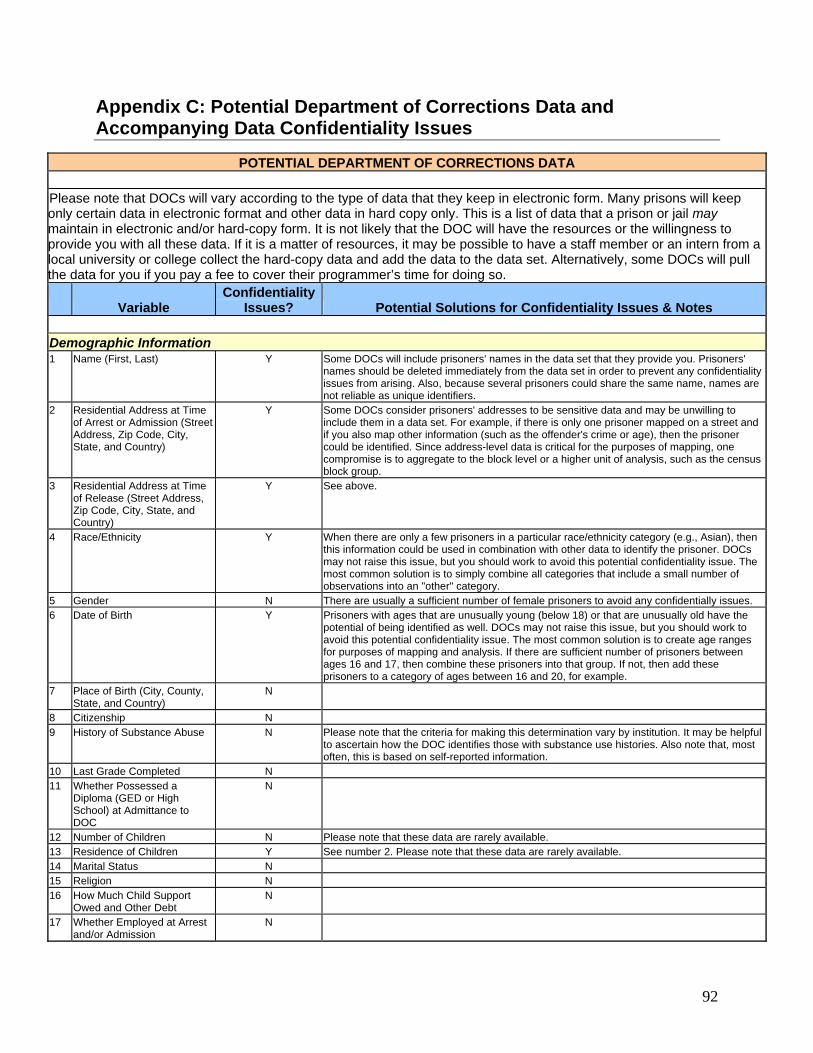
Appendix C: Potential Department of Corrections Data and Accompanying Data Confidentiality Issues
POTENTIAL DEPARTMENT OF CORRECTIONS DATA
Please note that DOCs will vary according to the type of data that they keep in electronic form. Many prisons will keep only certain data in electronic format and other data in hard copy only. This is a list of data that a prison or jail may maintain in electronic and/or hard-copy form. It is not likely that the DOC will have the resources or the willingness to provide you with all these data. If it is a matter of resources, it may be possible to have a staff member or an intern from a local university or college collect the hard-copy data and add the data to the data set. Alternatively, some DOCs will pull the data for you if you pay a fee to cover their programmer’s time for doing so.
Variable Confidentiality
Issues? Potential Solutions for Confidentiality Issues & Notes Demographic Information 1 Name (First, Last) Y Some DOCs will include prisoners' names in the data set that they provide you. Prisoners'
names should be deleted immediately from the data set in order to prevent any confidentiality issues from arising. Also, because several prisoners could share the same name, names are not reliable as unique identifiers.
2 Residential Address at Time of Arrest or Admission (Street Address, Zip Code, City, State, and Country)
Y Some DOCs consider prisoners' addresses to be sensitive data and may be unwilling to include them in a data set. For example, if there is only one prisoner mapped on a street and if you also map other information (such as the offender's crime or age), then the prisoner could be identified. Since address-level data is critical for the purposes of mapping, one compromise is to aggregate to the block level or a higher unit of analysis, such as the census block group.
3 Residential Address at Time of Release (Street Address, Zip Code, City, State, and Country)
Y See above.
4 Race/Ethnicity Y When there are only a few prisoners in a particular race/ethnicity category (e.g., Asian), then this information could be used in combination with other data to identify the prisoner. DOCs may not raise this issue, but you should work to avoid this potential confidentiality issue. The most common solution is to simply combine all categories that include a small number of observations into an "other" category.
5 Gender N There are usually a sufficient number of female prisoners to avoid any confidentially issues. 6 Date of Birth Y Prisoners with ages that are unusually young (below 18) or that are unusually old have the
potential of being identified as well. DOCs may not raise this issue, but you should work to avoid this potential confidentiality issue. The most common solution is to create age ranges for purposes of mapping and analysis. If there are sufficient number of prisoners between ages 16 and 17, then combine these prisoners into that group. If not, then add these prisoners to a category of ages between 16 and 20, for example.
7 Place of Birth (City, County, State, and Country)
N
8 Citizenship N 9 History of Substance Abuse N Please note that the criteria for making this determination vary by institution. It may be helpful
to ascertain how the DOC identifies those with substance use histories. Also note that, most often, this is based on self-reported information.
10 Last Grade Completed N 11 Whether Possessed a
Diploma (GED or High School) at Admittance to DOC
N
12 Number of Children N Please note that these data are rarely available. 13 Residence of Children Y See number 2. Please note that these data are rarely available. 14 Marital Status N 15 Religion N 16 How Much Child Support
Owed and Other Debt N
17 Whether Employed at Arrest and/or Admission
N
92
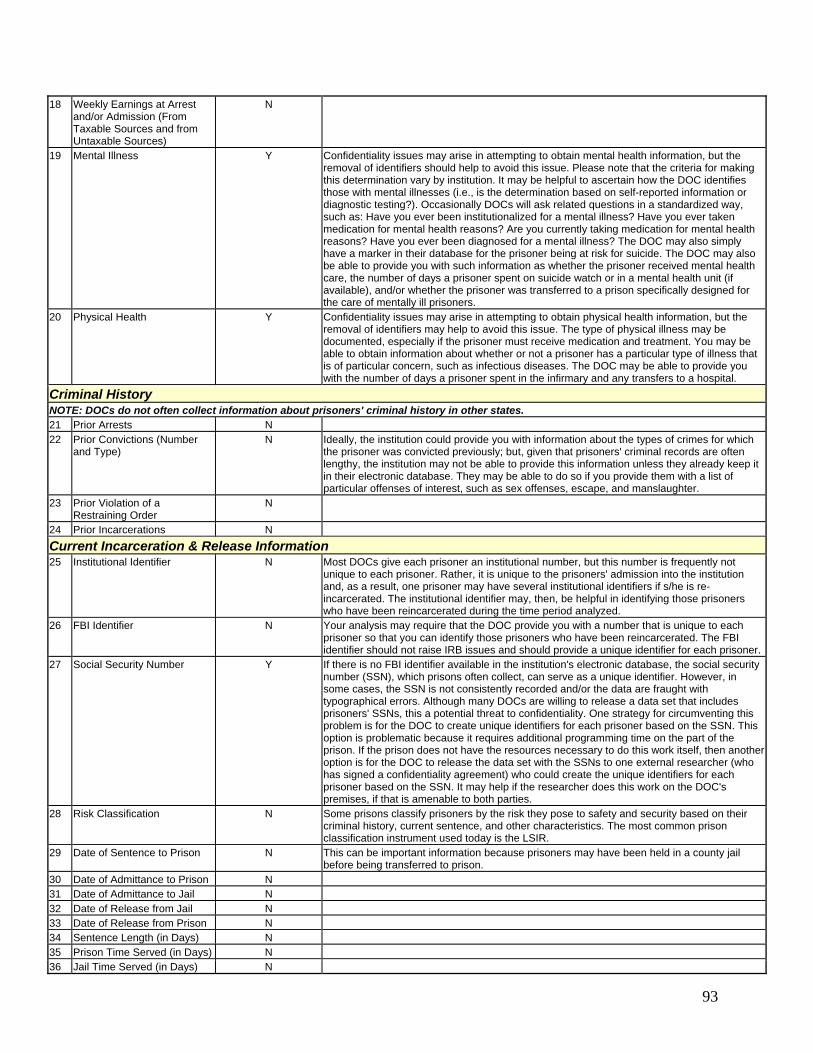
18 Weekly Earnings at Arrest and/or Admission (From Taxable Sources and from Untaxable Sources)
N
19 Mental Illness Y Confidentiality issues may arise in attempting to obtain mental health information, but the removal of identifiers should help to avoid this issue. Please note that the criteria for making this determination vary by institution. It may be helpful to ascertain how the DOC identifies those with mental illnesses (i.e., is the determination based on self-reported information or diagnostic testing?). Occasionally DOCs will ask related questions in a standardized way, such as: Have you ever been institutionalized for a mental illness? Have you ever taken medication for mental health reasons? Are you currently taking medication for mental health reasons? Have you ever been diagnosed for a mental illness? The DOC may also simply have a marker in their database for the prisoner being at risk for suicide. The DOC may also be able to provide you with such information as whether the prisoner received mental health care, the number of days a prisoner spent on suicide watch or in a mental health unit (if available), and/or whether the prisoner was transferred to a prison specifically designed for the care of mentally ill prisoners.
20 Physical Health Y Confidentiality issues may arise in attempting to obtain physical health information, but the removal of identifiers may help to avoid this issue. The type of physical illness may be documented, especially if the prisoner must receive medication and treatment. You may be able to obtain information about whether or not a prisoner has a particular type of illness that is of particular concern, such as infectious diseases. The DOC may be able to provide you with the number of days a prisoner spent in the infirmary and any transfers to a hospital.
Criminal History NOTE: DOCs do not often collect information about prisoners' criminal history in other states. 21 Prior Arrests N 22 Prior Convictions (Number
and Type) N Ideally, the institution could provide you with information about the types of crimes for which
the prisoner was convicted previously; but, given that prisoners' criminal records are often lengthy, the institution may not be able to provide this information unless they already keep it in their electronic database. They may be able to do so if you provide them with a list of particular offenses of interest, such as sex offenses, escape, and manslaughter.
23 Prior Violation of a Restraining Order
N
24 Prior Incarcerations N Current Incarceration & Release Information 25 Institutional Identifier N Most DOCs give each prisoner an institutional number, but this number is frequently not
unique to each prisoner. Rather, it is unique to the prisoners' admission into the institution and, as a result, one prisoner may have several institutional identifiers if s/he is re-incarcerated. The institutional identifier may, then, be helpful in identifying those prisoners who have been reincarcerated during the time period analyzed.
26 FBI Identifier N Your analysis may require that the DOC provide you with a number that is unique to each prisoner so that you can identify those prisoners who have been reincarcerated. The FBI identifier should not raise IRB issues and should provide a unique identifier for each prisoner.
27 Social Security Number Y If there is no FBI identifier available in the institution's electronic database, the social security number (SSN), which prisons often collect, can serve as a unique identifier. However, in some cases, the SSN is not consistently recorded and/or the data are fraught with typographical errors. Although many DOCs are willing to release a data set that includes prisoners' SSNs, this a potential threat to confidentiality. One strategy for circumventing this problem is for the DOC to create unique identifiers for each prisoner based on the SSN. This option is problematic because it requires additional programming time on the part of the prison. If the prison does not have the resources necessary to do this work itself, then another option is for the DOC to release the data set with the SSNs to one external researcher (who has signed a confidentiality agreement) who could create the unique identifiers for each prisoner based on the SSN. It may help if the researcher does this work on the DOC's premises, if that is amenable to both parties.
28 Risk Classification N Some prisons classify prisoners by the risk they pose to safety and security based on their criminal history, current sentence, and other characteristics. The most common prison classification instrument used today is the LSIR.
29 Date of Sentence to Prison N This can be important information because prisoners may have been held in a county jail before being transferred to prison.
30 Date of Admittance to Prison N 31 Date of Admittance to Jail N 32 Date of Release from Jail N 33 Date of Release from Prison N 34 Sentence Length (in Days) N 35 Prison Time Served (in Days) N 36 Jail Time Served (in Days) N
93
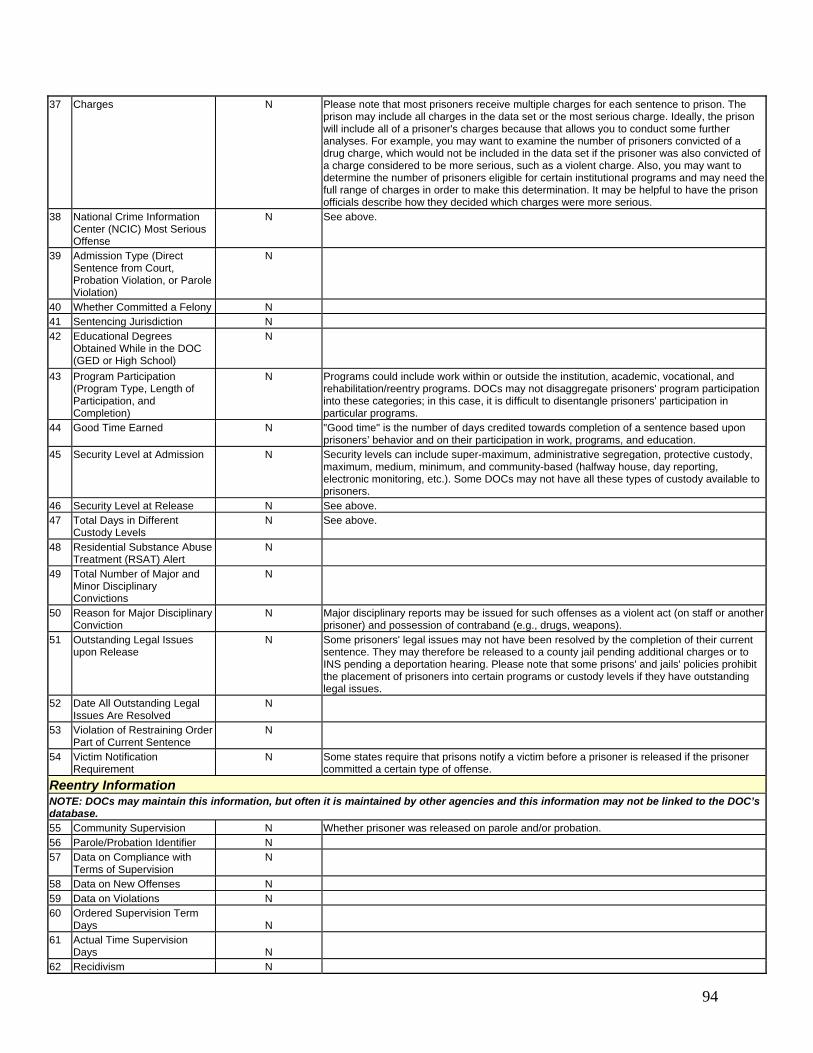
37 Charges N Please note that most prisoners receive multiple charges for each sentence to prison. The prison may include all charges in the data set or the most serious charge. Ideally, the prison will include all of a prisoner's charges because that allows you to conduct some further analyses. For example, you may want to examine the number of prisoners convicted of a drug charge, which would not be included in the data set if the prisoner was also convicted of a charge considered to be more serious, such as a violent charge. Also, you may want to determine the number of prisoners eligible for certain institutional programs and may need the full range of charges in order to make this determination. It may be helpful to have the prison officials describe how they decided which charges were more serious.
38 National Crime Information Center (NCIC) Most Serious Offense
N See above.
39 Admission Type (Direct Sentence from Court, Probation Violation, or Parole Violation)
N
40 Whether Committed a Felony N 41 Sentencing Jurisdiction N 42 Educational Degrees
Obtained While in the DOC (GED or High School)
N
43 Program Participation (Program Type, Length of Participation, and Completion)
N Programs could include work within or outside the institution, academic, vocational, and rehabilitation/reentry programs. DOCs may not disaggregate prisoners' program participation into these categories; in this case, it is difficult to disentangle prisoners' participation in particular programs.
44 Good Time Earned N "Good time" is the number of days credited towards completion of a sentence based upon prisoners’ behavior and on their participation in work, programs, and education.
45 Security Level at Admission N Security levels can include super-maximum, administrative segregation, protective custody, maximum, medium, minimum, and community-based (halfway house, day reporting, electronic monitoring, etc.). Some DOCs may not have all these types of custody available to prisoners.
46 Security Level at Release N See above. 47 Total Days in Different
Custody Levels N See above.
48 Residential Substance Abuse Treatment (RSAT) Alert
N
49 Total Number of Major and Minor Disciplinary Convictions
N
50 Reason for Major Disciplinary Conviction
N Major disciplinary reports may be issued for such offenses as a violent act (on staff or another prisoner) and possession of contraband (e.g., drugs, weapons).
51 Outstanding Legal Issues upon Release
N Some prisoners' legal issues may not have been resolved by the completion of their current sentence. They may therefore be released to a county jail pending additional charges or to INS pending a deportation hearing. Please note that some prisons' and jails' policies prohibit the placement of prisoners into certain programs or custody levels if they have outstanding legal issues.
52 Date All Outstanding Legal Issues Are Resolved
N
53 Violation of Restraining Order Part of Current Sentence
N
54 Victim Notification Requirement
N Some states require that prisons notify a victim before a prisoner is released if the prisoner committed a certain type of offense.
Reentry Information NOTE: DOCs may maintain this information, but often it is maintained by other agencies and this information may not be linked to the DOC’s database. 55 Community Supervision N Whether prisoner was released on parole and/or probation. 56 Parole/Probation Identifier N 57 Data on Compliance with
Terms of Supervision N
58 Data on New Offenses N 59 Data on Violations N 60 Ordered Supervision Term
Days N
61 Actual Time Supervision Days N
62 Recidivism N
94
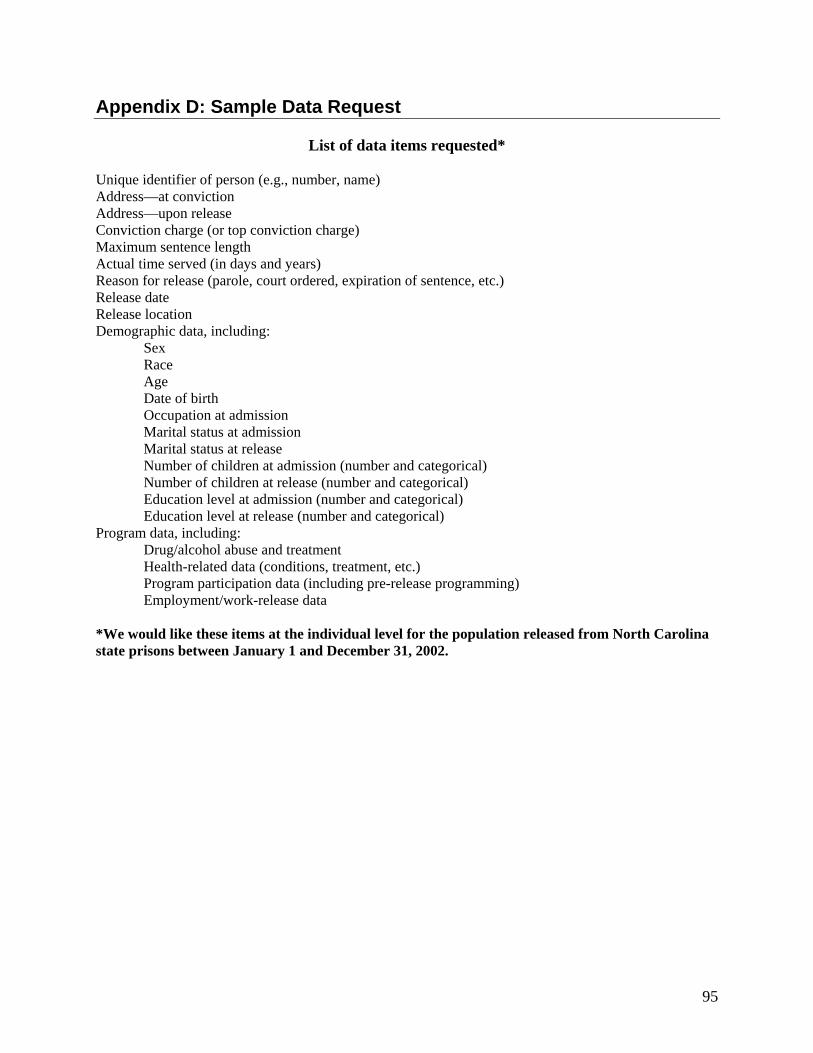
Appendix D: Sample Data Request
List of data items requested* Unique identifier of person (e.g., number, name) Address—at conviction Address—upon release Conviction charge (or top conviction charge) Maximum sentence length Actual time served (in days and years) Reason for release (parole, court ordered, expiration of sentence, etc.) Release date Release location Demographic data, including:
Sex Race Age Date of birth
Occupation at admission Marital status at admission Marital status at release Number of children at admission (number and categorical) Number of children at release (number and categorical) Education level at admission (number and categorical) Education level at release (number and categorical) Program data, including: Drug/alcohol abuse and treatment
Health-related data (conditions, treatment, etc.) Program participation data (including pre-release programming) Employment/work-release data
*We would like these items at the individual level for the population released from North Carolina state prisons between January 1 and December 31, 2002.
95
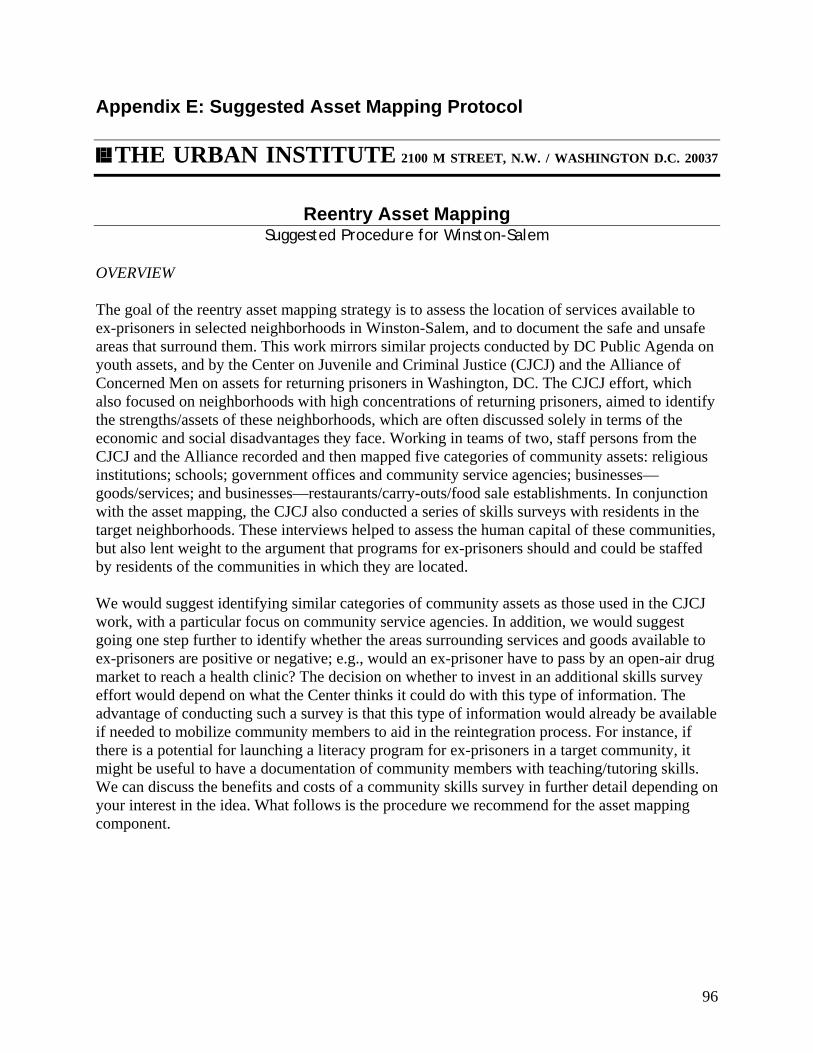
Appendix E: Suggested Asset Mapping Protocol
THE URBAN INSTITUTE 2100 M STREET, N.W. / WASHINGTON D.C. 20037
Reentry Asset Mapping
Suggested Procedure for Winston-Salem
OVERVIEW The goal of the reentry asset mapping strategy is to assess the location of services available to ex-prisoners in selected neighborhoods in Winston-Salem, and to document the safe and unsafe areas that surround them. This work mirrors similar projects conducted by DC Public Agenda on youth assets, and by the Center on Juvenile and Criminal Justice (CJCJ) and the Alliance of Concerned Men on assets for returning prisoners in Washington, DC. The CJCJ effort, which also focused on neighborhoods with high concentrations of returning prisoners, aimed to identify the strengths/assets of these neighborhoods, which are often discussed solely in terms of the economic and social disadvantages they face. Working in teams of two, staff persons from the CJCJ and the Alliance recorded and then mapped five categories of community assets: religious institutions; schools; government offices and community service agencies; businesses—goods/services; and businesses—restaurants/carry-outs/food sale establishments. In conjunction with the asset mapping, the CJCJ also conducted a series of skills surveys with residents in the target neighborhoods. These interviews helped to assess the human capital of these communities, but also lent weight to the argument that programs for ex-prisoners should and could be staffed by residents of the communities in which they are located. We would suggest identifying similar categories of community assets as those used in the CJCJ work, with a particular focus on community service agencies. In addition, we would suggest going one step further to identify whether the areas surrounding services and goods available to ex-prisoners are positive or negative; e.g., would an ex-prisoner have to pass by an open-air drug market to reach a health clinic? The decision on whether to invest in an additional skills survey effort would depend on what the Center thinks it could do with this type of information. The advantage of conducting such a survey is that this type of information would already be available if needed to mobilize community members to aid in the reintegration process. For instance, if there is a potential for launching a literacy program for ex-prisoners in a target community, it might be useful to have a documentation of community members with teaching/tutoring skills. We can discuss the benefits and costs of a community skills survey in further detail depending on your interest in the idea. What follows is the procedure we recommend for the asset mapping component.
96

PROCEDURE 1. Select Neighborhoods Using the maps showing distributions of returning prisoners, identify which high-concentration areas would be the most interesting areas on which to focus your attention. The number of neighborhoods selected would, of course, depend on cost and staff restrictions. We recommend piloting the mapping procedures on a one- or two-square-block area to better estimate how much time this effort would require and to assess how large of an area could be covered within reasonable budgetary allowances. 2. Recruit ‘Mappers’ We suggest using one of your street workers in the recruitment process, since they know the returning prisoners in the area and have a good rapport with them. The ideal ex-prisoner for this kind of work would be from the community, familiar with the neighborhoods of interest, and have good interpersonal skills. 3. Train Mappers The formality and extent of training will depend on the number of people recruited to serve as mappers. If only a few people will be involved in the effort, shadowing a Center member as they conduct the first few surveys on the street might be sufficient. If a larger group is involved, more formal training, including some role playing–type activities at the Center, might be more appropriate. Certain issues should be addressed in the training of any mappers used in this effort: the importance of legible handwriting, appropriate demeanor when interviewing people, attention to detail, documentation of labor hours, and dealing with sensitive issues. For instance, if a male ex-prisoner encounters a homeless shelter for women, he could simply make a note of its location and have a female return to conduct the interview rather than potentially upsetting the residents by entering the facility. 4. Design Survey Instrument We feel that it would be useful to consider the data collection methods used by CJCJ and DC Agenda in addition to our own ideas, so as not to reinvent the wheel when designing the survey instrument. 5. Conduct Survey Once the data collection instrument has been designed, mappers can begin to canvas the selected neighborhood to catalog the assets. The pilot test should give you a better estimate of how much time would be required to entirely survey the areas of interest. One potential problem with this type of work is ensuring the validity of the survey results. A couple of different methods can be used to counteract this problem. If only a few mappers will be employed, it may work best if the surveys are conducted in teams of two—one person from the Center and one ex-prisoner. If a large number of mappers will be used, a Center member could validate a random subset of places that were listed as assets.
97
6. Reimburse Participants Since we do not yet know how much time this type of work would involve, it is also unclear how mappers should be paid. For instance, would it be more appropriate to pay by the hour or by the geographic area covered? Once again, a pilot should help you to think through these issues and determine the most suitable payment approach. 7. Create Products Once all of the data have been collected, members of the Center staff will geocode each address by type of service/asset. Maps can then be created to show where different kinds of services are located. Different landmarks can be added to the maps, such as bus routes and bus stops. Finalized maps can serve a number of functions. They can be given to ex-prisoners as a resource. They may also be used by the Center staff to further assess the availability of services, determine gaps, and identify potential areas for action by the Center. In addition, they could add another layer to the concentration maps we have already created.
98