Embed Size (px)
Citation preview

RESEARCH ARTICLE
Mapping Schistosoma mansoni endemicity in
Rwanda: a critical assessment of geographical
disparities arising from circulating cathodic
antigen versus Kato-Katz diagnostics
Nicholas J. ClarkID1,2‡*, Irenee Umulisa3‡, Eugene Ruberanziza3, Kei Owada1,2, Daniel
G. Colley4, Giuseppina OrtuID5, Carl H. Campbell, Jr4, Emmanuel Ruzindana6,
Warren Lancaster7, Jean Bosco Mbonigaba3, Aimable Mbituyumuremyi8, Alan Fenwick5,
Ricardo J. Soares Magalhaes1,2, Innocent Turate9
1 UQ Spatial Epidemiology Laboratory, School of Veterinary Science, The University of Queensland,
Queensland, Australia, 2 Children Health and Environment Program, Child Health Research Centre, The
University of Queensland, Queensland, Australia, 3 Neglected Tropical Diseases and Other Parasitic
Diseases Unit, Malaria and Other Parasitic Diseases Division, Rwanda Biomedical Center, Ministry of Health,
Kigali, Rwanda, 4 Center for Tropical and Emerging Global Diseases, Department of Microbiology, University
of Georgia, Georgia, United States of America, 5 Schistosomiasis Control Initiative (SCI), Department of
Infectious Diseases Epidemiology, Imperial College, London, United Kingdom, 6 Microbiology Unit, National
Reference Laboratory (NRL) Division, Rwanda Biomedical Center, Ministry of Health, Kigali, Rwanda, 7 The
END Fund, New York, New York, United States of America, 8 Malaria and Other Parasitic Diseases Division,
Rwanda Biomedical Center, Ministry of Health, Kigali, Rwanda, 9 Institute of HIV/AIDS, Disease Prevention
and Control (IHDPC), Rwanda Biomedical Center, Ministry of Health, Kigali, Rwanda
‡ These authors share first authorship on this work.
Abstract
Background
Schistosomiasis is a neglected tropical disease caused by Schistosoma parasites. Interven-
tion relies on identifying high-risk regions, yet rapid Schistosoma diagnostics (Kato-Katz
stool assays (KK) and circulating cathodic antigen urine assays (CCA)) yield different preva-
lence estimates. We mapped S. mansoni prevalence and delineated at-risk regions using a
survey of schoolchildren in Rwanda, where S. mansoni is an endemic parasite. We asked if
different diagnostics resulted in disparities in projected infection risk.
Methods
Infection data was obtained from a 2014 Rwandan school-based survey that used KK and
CCA diagnostics. Across 386 schools screened by CCA (N = 19,217). To allow for uncer-
tainty when interpreting ambiguous CCA trace readings, which accounted for 28.8% of total
test results, we generated two presence-absence datasets: CCA trace as positive and CCA
trace as negative. Samples (N = 9,175) from 185 schools were also screened by KK. We
included land surface temperature (LST) and the Normalized Difference Vegetation and
Normalized Difference Water Indices (NDVI, NDWI) as predictors in geostatistical
regressions.
PLOS Neglected Tropical Diseases | https://doi.org/10.1371/journal.pntd.0007723 September 30, 2019 1 / 21
a1111111111
a1111111111
a1111111111
a1111111111
a1111111111
OPEN ACCESS
Citation: Clark NJ, Umulisa I, Ruberanziza E,
Owada K, Colley DG, Ortu G, et al. (2019) Mapping
Schistosoma mansoni endemicity in Rwanda: a
critical assessment of geographical disparities
arising from circulating cathodic antigen versus
Kato-Katz diagnostics. PLoS Negl Trop Dis 13(9):
e0007723. https://doi.org/10.1371/journal.
pntd.0007723
Editor: Amaya Lopez Bustinduy, London School of
Hygiene and Tropical Medicine, UNITED KINGDOM
Received: April 22, 2019
Accepted: August 20, 2019
Published: September 30, 2019
Copyright: © 2019 Clark et al. This is an open
access article distributed under the terms of the
Creative Commons Attribution License, which
permits unrestricted use, distribution, and
reproduction in any medium, provided the original
author and source are credited.
Data Availability Statement: All data required to
replicate analyses is included in the Supporting
Information.
Funding: This study received financial support
from the END Fund, the Schistosomiasis Control
Initiative and the University of Georgia Research
Foundation, Inc., which was funded by the Bill &
Melinda Gates Foundation for the SCORE Project.
SCORE receives its funding from the University of
Findings
Across 8,647 children tested by both methods, prevalence was 35.93% for CCA trace as
positive, 7.21% for CCA trace as negative and 1.95% for KK. LST was identified as a risk
factor using KK, whereas NDVI was a risk factor for CCA models. Models predicted high
endemicity in Northern and Western regions of Rwanda, though the CCA trace as positive
model identified additional high-risk areas that were overlooked by the other methods. Esti-
mates of current burden for children at highest risk (boys aged 5–9 years) varied by an order
of magnitude, with 671,856 boys projected to be infected by CCA trace as positive and only
60,453 projected by CCA trace as negative results.
Conclusions
Our findings show that people in Rwanda’s Northern, Western and capital regions are at
high risk of S. mansoni infection. However, variation in identification of environmental risk
factors and delineation of at-risk regions using different diagnostics likely provides confusing
messages to disease intervention managers. Further research and statistical analyses,
such as latent class analysis, can be used to improve CCA result classification and assess
its use in guiding treatment regimes.
Author summary
Schistosomiasis control efforts rely on rapid diagnostic tests to generate maps of disease
prevalence. This is so that high-risk areas can be identified and provided with treatments.
A range of tests are available, yet it is unclear how their differing results can inform disease
mitigation. This study compared the results of diagnostic methods for uncovering areas at
risk of Schistosoma mansoni infection in Rwanda. A national survey of Rwandan school-
children used two detection methods: a test detecting a schistosome antigen in urine
(CCA) and a test to detect parasite eggs in stool (KK). We divided the CCA test into two
datasets, as there is large uncertainty when interpreting its reading. We found that these
three datasets all tell different stories about the distribution of S. mansoni in Rwanda.
While all tests found similar high-risk areas where prevalence reaches 50%, such as North-
ern and Western regions, their overall messages are mixed. Some urine tests find areas
that are high-risk, while stool tests in the same area may consider it low-risk. This makes
it difficult to design budgets for treatment programs, as it is unclear where resources
should go. More research and analyses are needed to determine how these tests can be
used as tools for schistosomiasis risk mapping. Furthermore, the interpretations of map-
ping outcomes will also likely rest on national decisions regarding programmatic goals.
Introduction
Schistosomiasis, caused by parasitic trematode species of the genus Schistosoma, is an infec-
tious disease affecting people throughout the world’s tropical and sub-tropical regions [1, 2].
Chronic infections can lead to impaired growth and development in children, making schisto-
somiasis one of the world’s most important neglected tropical diseases [3]. Schistosomiasis is
often linked to absence of access to latrines and / or clean water, which can lead to the use of
Disparities in Schistosoma risk-mapping using different diagnostics
PLOS Neglected Tropical Diseases | https://doi.org/10.1371/journal.pntd.0007723 September 30, 2019 2 / 21
Georgia Research Foundation, Inc., which received
funds for SCORE from the Bill & Melinda Gates
Foundation. The END Fund and SCORE supported
remapping of schistosomiasis through sub-awards
to SCI at Imperial College, London. The END Fund
also provided a research grant to the University of
Queensland for additional data analyses and
reporting. The funders had no role in study design,
data collection and analysis, decision to publish, or
preparation of the manuscript.
Competing interests: RSM declares that he is an
editorial board member of PLoS Neglected Tropical
Diseases.
freshwater bodies that can become contaminated with parasite eggs when infected people uri-
nate or defecate while bathing, washing and swimming. Freshwater snails, often present in
these water bodies, act as intermediate hosts for the parasites. Following infection of appropri-
ate snail hosts, asexual replication occurs followed by the development of the infectious stages
of the parasite which can be released into the water and infect people. Consequently, infection-
related morbidity is especially common in poor agricultural areas that rely on unsanitized
freshwater [4, 5]. Globally, it is estimated that more than 779 million people live in areas with
high risk of human Schistosoma transmission [6]. Infection risk is particularly high in sub-
Saharan Africa, where up to 90% of the world’s infections occur [6, 7]. Burdens in this region
are enormous, matching or exceeding those related to malaria and HIV/AIDS [3]. An esti-
mated 300,000 people die from schistosomiasis in Africa each year [8].
Mass delivery of anthelminthic treatment can reduce Schistosoma prevalence and facilitate
major improvements to public health outcomes [9]. Mass administration of praziquantel can
be cost effective, especially in areas with relatively high prevalence of infection and high trans-
mission intensity [7, 10]. Yet burdens are so great that mass drug administration remains unaf-
fordable for most low-income endemic countries [9, 11]. Steps have been taken by Merck
KGaA, the United States Agency for International Development, the Bill and Melinda Gates
Foundation, the British Department of International Development and the Global Network
for Neglected Tropical Diseases to increase delivery of doses to sub-Saharan African countries
[12].
Designing effective drug delivery programmes to reduce Schistosoma transmission is com-
plicated by inadequate understanding of regional burdens and risk factors [13, 14]. The geo-
graphical distributions and transmission rates of Schistosoma parasites are poorly studied in
many endemic regions but are broadly known to be driven by environmental heterogeneity
[15–17]. Climate or environmental variables that influence soil moisture and composition can
reflect variability in molluscan host distributions and parasite larval survival rates [18–20].
Data-driven approaches to identify environmental correlates of infection risk in understudied
endemic regions are imperative to design mitigation procedures.
In addition to climatic and environmental heterogeneity in infection risk, uncertainty sur-
rounding regional infection prevalence is a barrier to treatment design. The World Health
Organization (WHO) recommends that treatment for schistosomiasis should be provided to
areas of high endemism in efforts to reduce morbidity. Such treatment is important not only
for morbidity control but also for current pushes to eliminate schistosomiasis where feasible
[21]. Developing treatment regimens to achieve these goals relies on gathering accurate esti-
mates of infection prevalence. Moreover, with targets for 2020–2030 now under public consul-
tation [21], critical assessments of inferences resulting from different diagnostic tests are
needed. This is particularly true considering that different diagnostics may be chosen depend-
ing on whether a country’s specified goal is elimination as a public health problem (morbidity
control) or interruption of transmission. However, gathering estimates of prevalence is chal-
lenging, particularly since symptoms of intestinal schistosomiasis are incredibly variable and
can include headache, fever, rash, anaemia, bloody diarrhoea and abdominal pain, hepatosple-
nomegaly, blood in urine, burning sensation during urination, fibrosis of the bladder, and spe-
cifically in females, genital lesions which may lead to irreversible consequences, including
infertility [2, 22]. Use of rapid diagnostic tests is therefore recommended for generating esti-
mates of prevalence. For intestinal schistosomiasis, detection of eggs in the faeces (primarily
using the Kato-Katz (KK) method, which involves microscopic examination of faecal smears
[23]) or of circulating cathodic antigen (CCA) in urine are the primary methods of choice for
diagnosis of infections [24, 25]. However, the two methods can return different prevalence
estimates, with CCA generally yielding higher sensitivity [26, 27]. The KK method may show
Disparities in Schistosoma risk-mapping using different diagnostics
PLOS Neglected Tropical Diseases | https://doi.org/10.1371/journal.pntd.0007723 September 30, 2019 3 / 21
particularly low sensitivity in low to moderate endemic areas, especially when there are many
low-intensity infections [28].
Without an accurate understanding of current burdens and environmental correlates, iden-
tifying areas in need of treatment remains difficult. Geostatistical models that use up-to-date
infection data and account for environmental risk factors are useful tools for producing evi-
dence-based projections of populations at risk of Schistosoma infection [29, 30]. Modelling
assessments should ideally be formulated following adequate scrutiny of assessment of the per-
formances and inferences that are provided by different available diagnostic methods.
Rwanda is a landlocked central African country bordered by Tanzania to the East, Uganda
to the North, the Democratic Republic of the Congo (DRC) to the West, and Burundi to the
South. With a land area of 26,338 square kilometres and a population of over 10.7 million,
Rwanda is one of the most densely populated countries in Africa [31]. The economy is mostly
agriculture-based and the average life expectancy is 63 years [32]. Rwanda sustained wide-
spread public health disruption as a result of political and social unrest throughout the 1990’s
[33]. Health workforce training and public health outcomes have since improved, however,
infectious disease monitoring and control still present major challenges [34–36]. Previous sur-
veys suggest that Schistosoma mansoni is highly endemic and hence a parasite of high public
health importance in Rwanda [34, 37]. While some evidence suggests intestinal schistosomiasis
reaches 60% prevalence or higher in certain areas, research on infection rates is limited to
small-scale regional studies [1, 38–40]. Consequently, we have a poor understanding of risk
factors for schistosomiasis in Rwanda.
This study aims to understand geographical variation in S. mansoni infection risk in
Rwanda and to provide new insights into uncertainties in treatment pathways that can arise
from variation in chosen on-the-ground diagnostic procedures. To accomplish these aims, we
outline two key objectives. First, we apply geostatistical models to data from a national school-
based survey in Rwanda to identify S. mansoni risk factors, map infection prevalence and
delineate endemic clusters of high risk. Second, we compare geographical patterns in projected
infection risk arising from the use of the CCA and KK methods. We hypothesize that infection
risk will be spatially clustered within the country but that geographical disparities in the size
and intensity of these clusters will arise when relying on different diagnostics, providing con-
fusing messages to policymakers designing treatment guidelines.
Methods
Ethics statement
Ethical clearance for this analytical study was provided by The National Ethics Committee in
Rwanda (Sep 2014, Ref No: 261/RNEC/2014).
Detecting Schistosoma mansoni infections in Rwandan schoolchildren
Schistosoma mansoni presence-absence data was obtained from a nationwide school-based
survey undertaken in Rwanda between June and mid-July 2014. Methods for school selection
were as follows: a national sampling effort was carried out following the first nationwide sur-
veys for prevalence of intestinal schistosomiasis and soil-transmitted helminthiasis (STH) in
Rwandan schoolchildren, conducted between 2007 and 2008 [1]. This sampling scheme was
designed to (1) provide insights into endemicity of S. mansoni across the country and (2)
guide the decision of new treatment and surveillance strategies for Rwanda, in alignment with
WHO guidelines [41]. The scheme took into consideration groups of sectors as administrative
mapping units. Schools were chosen by selecting units likely to have similar S. mansoni
Disparities in Schistosoma risk-mapping using different diagnostics
PLOS Neglected Tropical Diseases | https://doi.org/10.1371/journal.pntd.0007723 September 30, 2019 4 / 21
transmission characteristics (based on epidemiological characteristics such as nearby perennial
water bodies) and to ensure sample sizes in each mapping unit were statistically representative.
To assess possible geographical disparities in risk mapping arising from choice of diagnostic
method, infection data was obtained using both the circulating cathodic antigen (CCA;
detected in urine) and Kato-Katz (KK; detected in faeces) diagnostic methods. Specifically,
CCA was used to survey S. mansoni infection in schoolchildren (aged 5 to 18 years) across 386
schools. A single urine sample was collected from each randomly-selected participant and
tested with a point of care CCA rapid test (Rapid Medical Diagnostics, South Africa). A single-
use pipette was used to add the drop of urine to the test cassette well, followed by a drop of the
provided buffer. It should be noted that CCA tests returns negative, trace, 1+, 2++ or 3+++
readings, which are designed to give an indication of the strength of the reading. Results were
read after 20 minutes and graded into one of four intensities: 0 = negative; trace; 1+; 2++;
3+++ using a reference image showing representative incremental readings (Supporting
Information, S1 Fig). All CCA kits were from Rapid Medical Diagnostics Batch number
33955, ensuring we did not need to account for possible batch-to-batch variation in trace read-
ings. We did not use a band density reader to avoid observational bias, as it would have been
extremely expensive to provide such a tool to every team in the field. Moreover, we note that
even though there is an mReader that Mobile Assay and SCORE, developed in 2016 for provid-
ing quantitative CCA test results, this mReader cannot distinguish between a trace ‘true posi-
tive’ and a trace ‘false positive’. Therefore, during this study and indeed to this day, the visual
read of the intensity of the test band on the strip compared to the supplied control image is
still considered standard practice in Rwanda.
The KK method was also used in 174 of these schools (concurrent urine and faecal samples
were collected from the same participants), while a further 11 schools were surveyed using
only KK (bringing the total number of schools surveyed using KK to 185). For this test, a single
stool specimen was collected from each participant and duplicate thick smears were prepared
for microscopic examination. Smears were assessed for presence of S. mansoni eggs by trained
technicians, with each smear assessed by at least two different technicians. Quality control was
performed by independent external consultants to ensure accurate diagnosis from KK micros-
copy. This involved random allocation of 10% of the smears for re-examination by two inde-
pendent experts.
For each of the visited schools, up to 50 students per school were sampled for parasite infec-
tion. However, while the original CCA datasets included 19,371 children, only children with
complete information were included in the analysis (children without age, sex, or geocoordi-
nates recorded were excluded). As a result, the total number of children included in CCA anal-
yses was 19,217. Following removal of children with missing data, the total number of pupils
ranged from 25–50 per school for CCA sampling (mean = 49.78, sd = 1.89) and from 25–50
for KK sampling (mean = 49.59, sd = 2.05). Across the 174 schools sampled by all three meth-
ods, the number of pupils ranged from 44–50 (mean = 49.70, sd = 1.01).
Extraction of environmental variables
Environmental measurements were extracted at the school level to be included as covariates in
analyses. We extracted information for three variables likely to influence Schistosoma spp. sur-
vival and transmission. These included: average land surface temperature (LST), extracted
from the WorldClim database (www.worldclim.org), and the Normalized Difference Vegeta-
tion and Normalized Difference Water Indices (NDVI and NDWI), both extracted from the
National Oceanographic and Atmospheric Administrations’ Satellite and Information Services
database (NOAASIS) (http://noaasis.noaa.gov/). LST was included because this can influence
Disparities in Schistosoma risk-mapping using different diagnostics
PLOS Neglected Tropical Diseases | https://doi.org/10.1371/journal.pntd.0007723 September 30, 2019 5 / 21
both the density of intermediate molluscan hosts and the rate of schistosomal development
within the molluscan host [42]. NDVI and NDWI variables capture local variation in vegeta-
tion, moisture and the presence of water bodies, which can impact the distributions of inter-
mediate molluscan hosts [16, 42, 43]. Environmental variables were obtained using the Google
Earth Engine in ArcGIS version 10.4.0.5524 [44] at 1km x 1km grid cell resolution and were
standardized to unit variance prior to analysis.
Statistical analysis to identify infection risk factors
Our analysis assessed the presence of S. mansoni infection in 19,217 students from 386 schools
who provided a urine sample for CCA assay analysis. While trace readings are recommended
by the manufacturer and by the WHO [45] to be considered as positive infections, some pro-
grams have reported weaker trace readings as negative because they may not reliably confirm
the presence or absence of infection [46]. For our analysis, we created two datasets for statisti-
cal analyses to account for this uncertainty when categorizing trace readings [47]. To do this,
CCA tests were stratified into two separate presence-absence datasets, namely CCA with traceas positive (i.e. only those readings of 0 were considered negative, while readings of trace, 1+,
2+ or 3++ were considered positive) and CCA with trace as negative (i.e. readings of either 0 or
trace were considered negative, while all other readings were considered positive). In addition,
9,175 students had stool specimens collected for Kato-Katz analyses, collected from 185 of the
386 schools. Data regarding school geolocation and participant demography (i.e. age and sex)
was included for all observations. We stratified ages of participants into a three-level categori-
cal variable (5 to 9 years old; 10 to 14; and 15 to 18 years old). The average age of participants
included in analyses was 13.36 years. School polygon centroids were estimated from a shapefile
representing Rwanda’s current administrative units (obtained from the geographic data ware-
house DIVA GIS (www.diva-gis.org/Data)). Parasite infection and environmental covariate
data were linked to their corresponding school centroids.
To assess evidence for spatial autocorrelation in infection probability, we fit logistic regres-
sion models (binomial errors with logit link function) using participant sex and age (categori-
cal variables) and the scaled environmental predictors LST, NDVI and NDWI. Correlations
between environmental covariates were investigated using Pearson’s correlations. Residuals
were extracted and examined with semivariograms (calculated using functions in the ‘geoR’
package [48]) in R version 3.1.1 (The R foundation for statistical computing, Vienna, Austria,
http://www.R-project.org). A semivariogram is a graphical representation of the spatial varia-
tion in an outcome variable; residual semivariograms represent spatial variation that is left
unexplained after accounting for predictors. A semivariogram is characterised by three param-
eters: the partial sill, representing the spatially structured semivariance component and
indicating the tendency for geographical clustering; the nugget, representing the spatially
unstructured semivariance component (representing either small-scale spatial variability, mea-
surement error or random variation); and the range, representing the pairwise distance above
which two locations can be considered independent (indicative of the average size of geo-
graphical clusters). We estimated the tendency for geographical clustering within a region (i.e.
proportion of variation due to spatial proximity) by dividing the partial sill by the sum of the
nugget plus the partial sill [49]. Separate models were developed using KK, CCA with trace aspositive and CCA with trace as negative presence-absence datasets.
Geostatistical models
Examination of spatial autocorrelation revealed some level of residual spatial clustering for
each model (see Results below). We implemented geostatistical models to account for our
Disparities in Schistosoma risk-mapping using different diagnostics
PLOS Neglected Tropical Diseases | https://doi.org/10.1371/journal.pntd.0007723 September 30, 2019 6 / 21

covariates and to simultaneously explore this autocorrelation. Bayesian logistic models with
geostatistical random effects were built for CCA tests using the open software OpenBUGS
[50]. We assumed the observed presence-absence vectors for each diagnostic group were ran-
dom draws from an underlying infection probability according to a Bernoulli distribution.
Using a logit link function, we modelled this probability as a linear regression that included an
intercept, our fixed predictors and a multivariate normal geostatistical random effect capturing
distances (km) between pairs of locations (using the spatial.exp function BUGS language,
which is essentially a Bayesian kriging model). Note that due to a low overall prevalence in the
KK dataset, we had inadequate infection data to generate precise estimates of spatial effects.
We instead investigated possible spatial clustering using aggregated data by classifying loca-
tions as a binomial variable based on whether that location’s mean observed prevalence was
higher or lower than the mean prevalence (1.95%) observed in the entire dataset (i.e. each
survey location was categorised using 1 or 0 based on whether its prevalence was� 1.95%
or< 1.95%).
Geostatistical models were estimated in a Bayesian framework using Markov Chain Monte
Carlo (MCMC) sampling based on the Gibbs sampler in OpenBUGS [50]. Normal priors with
mean = 0 and variance = 100 (i.e. precision = 0.01) were specified for intercepts and regression
coefficients. Geostatistical random effects were assumed to follow a normal distribution with
mean = 0 and variance = 1/tau, where tau was drawn from a gamma distribution (shape =
0.001, scale = 0.001). For CCA models, a burn-in of 5,000 MCMC iterations was used followed
by 5,000 iterations. For the KK model, a burn-in of 2,000 iterations was used followed by
another 3,300 iterations. Convergence for all models was assessed visually based on inspection
of posterior density and trace plots. Significance of predictor effects was inferred based on
whether 95% confidence intervals of posterior estimates did not include zero.
Model predictions were used to generate representative maps of the prevalence of S. man-soni infections across Rwanda for boys aged between 5–9 years, the subgroup with the highest
overall prevalence of S. mansoni infection in our dataset (though it should be noted that age
was not a significant predictor of infection probability, see Results below). Predictions were
made at the nodes of a 0.03 × 0.03 decimal degree grid (approximately 3km2). The mean and
standard deviation were extracted from the posterior distributions of predicted risk. Mar-
ginal predictions of risk were calculated using the spatial.unipred command in OpenBUGS,
which carries out single site predictions to yield marginal prediction intervals for each sample
site.
Estimation of the number of infections in population at risk of Schistosomamansoni infections in Rwanda in 2018
To assess geographical discrepancies in S. mansoni endemicity and the estimated numbers of
at-risk individuals across the three diagnostic datasets, we selected the highest risk group in
our dataset, represented as boys aged between 5 to 9 years old. A raster map of the estimated
total population size of this select group (estimated for the year 2018) was multiplied by the
predicted prevalence of S. mansoni in the at-risk group to produce a map of the total number
of infected children in each grid cell. To create the 2018 population raster, we retrieved a 2015
population density raster from the Center for International Earth Science Information Net-
work (CIESIN) [51], which was originally estimated using National Institute of Statistics
Rwanda’s Fourth Population and Housing Census 2012 data. This raster was multiplied by the
reported United Nations Development Programme (UNDP) average annual rate of population
change (i.e. 2.53%), which was then multiplied by the proportion of 5 to 9 year-olds (i.e.
13.5%) to produce a raster map of the estimated densities of children in this focal group in
Disparities in Schistosoma risk-mapping using different diagnostics
PLOS Neglected Tropical Diseases | https://doi.org/10.1371/journal.pntd.0007723 September 30, 2019 7 / 21
2018. All spatial calculations and plots were conducted in ArcGIS version 10.4.0.5524 [44].
Data required to replicate analyses is included in Supporting Information, S1 Data.
Results
Summary statistics of Schistosoma mansoni prevalence in Rwandan
schoolchildren
A total of 174 schools were tested for the prevalence of S. mansoni infection using all three
methods, with 8,647 pupils providing both stool and urine samples. Across these samples,
observed prevalence using CCA with trace as positive was 37.5%, 8.6% when using CCA withtrace as negative and only 2% when using KK (Supporting Information, S1 Table). Results
were broadly similar when taken across the entire dataset: only 1.95% of the 9,175 children
tested with the KK method were diagnosed as infected (Table 1), while observed prevalence
was 35.93% for CCA with trace as positive and 7.21% for CCA with trace as negative(N = 19,218; Table 1).
Despite these large discrepancies in diagnosed outcomes, some spatial agreement was evi-
dent across tests. Prevalence was generally highest in Northern and Western regions of the
country for all three diagnostic groups (Fig 1: Panel A to C). However, this pattern of spatial
variation was more evident for the CCA with trace as positive group, with many high-burden
locations (i.e. with prevalence >50%) occurring within close proximity of one another in the
Northern and Western regions of Rwanda (Fig 1: Panel B). The KK and CCA with trace as neg-ative groups tended to show very low prevalence in most regions, with only a few high-preva-
lence locations occurring in the Northern and Western Regions (Fig 1: Panel A and C,
respectively).
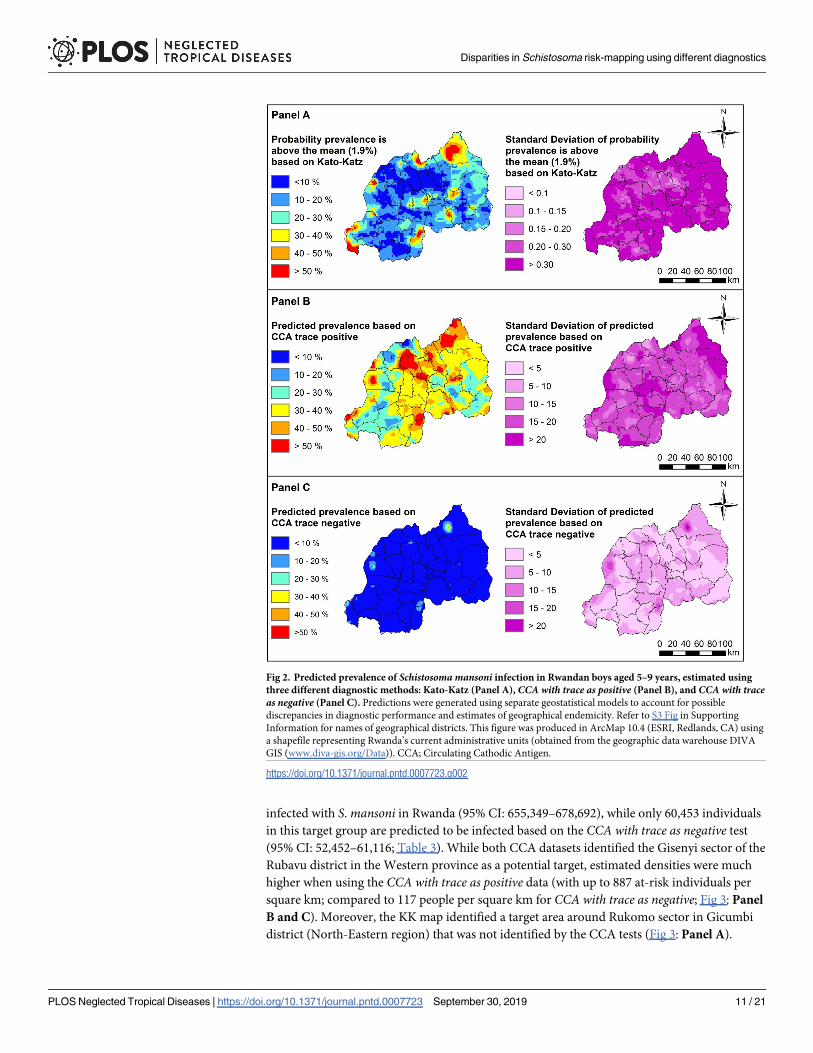
Spatial clustering in Schistosoma mansoni prevalence and risk prediction
Semivariograms based on residuals from non-spatial models revealed a tendency for spatial
clustering for all diagnostic groups, warranting the need for geostatistical methods (Support-
ing Information, S2 Fig). Sex of participants was an important risk factor for S. mansoni infec-
tion across all models, with males exhibiting higher risk compared to females (odds ratios of
increased risk for males = 1.71, 1.08 and 1.35 for KK, CCA with trace as positive and CCA withtrace as negative, respectively; Table 2). However, environmental predictors differed among
methods. We found a positive association between LST and infection risk when using the KK
test, whereas NDVI was positively associated with risk for both CCA groups (Table 2).
For the KK method, regions with highest probability of harbouring above-average preva-
lence generally occurred in the Northern region, Nyagatare and Burera districts, the Western
region such as Rusizi districts and also in inland-areas of Rwanda such as Kamonyi and Rwa-
magana (Fig 2: Panel A; see S3 Fig in Supporting Information for locations of districts).
Table 1. Summary statistics of observed Schistosoma mansoni prevalence across Rwandan schools recorded using
different diagnostic methods. A total of 5,547 CCA results were categorised as ‘trace’. The CCA with trace as positivedataset considered these as positive, while the CCA with trace as negative dataset considered these as negative. CCA;
Circulating Cathodic Antigen.
Kato-Katz CCA with trace as positive CCA with trace as negativeNumber of schools sampled 185 386 386
Number of pupils positive 179 6,906 1,385
Number of pupils negative 8,996 12,311 17,832
Mean prevalence (%) 1.95% 35.93% 7.21%
https://doi.org/10.1371/journal.pntd.0007723.t001
Disparities in Schistosoma risk-mapping using different diagnostics
PLOS Neglected Tropical Diseases | https://doi.org/10.1371/journal.pntd.0007723 September 30, 2019 8 / 21

Fig 1. Observed prevalence of Schistosoma mansoni infection in Rwandan schoolchildren estimated using three
different diagnostic methods: Kato-Katz (Panel A), CCA with trace as positive (Panel B), and CCA with trace asnegative (Panel C). Refer to S3 Fig in Supporting Information for names of geographical districts. This figure was
produced in ArcMap 10.4 (ESRI, Redlands, CA) using a shapefile representing Rwanda’s current administrative units
(obtained from the geographic data warehouse DIVA GIS (www.diva-gis.org/Data)). CCA; Circulating Cathodic
Antigen.
https://doi.org/10.1371/journal.pntd.0007723.g001
Disparities in Schistosoma risk-mapping using different diagnostics
PLOS Neglected Tropical Diseases | https://doi.org/10.1371/journal.pntd.0007723 September 30, 2019 9 / 21
Predicted prevalence of S. mansoni using CCA with trace as positive was mostly between 30 to
40% across Rwanda, with highest prevalence (i.e. with>50% predicted prevalence) occurring
in Northern districts (including Nyagatare, Gicumbi and Gakenke) as well as Southern dis-
tricts such as Gisagara and Nyanza (Fig 2: Panel B; S3 Fig). In contrast, predicted prevalence
using CCA with trace as negative was mostly <10% across Rwanda, with the highest predicted
prevalence observed only in a small localized area in the Northern Nyagatare district (Fig 2:
Panel C; S3 Fig). Importantly, vast areas of the country identified as high-risk when consider-
ing trace results as positive were estimated to have prevalence <10% when considering traceresults as negative.
Comparison of population densities in at-risk regions using different
diagnostic tests
Our spatially-adjusted projection maps identified areas where high densities of individuals in
the focal group (boys aged 5 to 9 years) live in risk-prone environments. Projections were
broadly in agreement across diagnostic tests, though it should be noted that our KK prediction
map is restricted to estimating total at-risk individuals in spatial clusters with above-average
predicted prevalence. Areas within and around the capital Kigali in the central area of Rwanda
(i.e. the capital city Kigali, and the southwest part of Kigali including Rwezamenyo, Gitega,
Kimisagara, Nyakabanda sectors) had high estimated densities of at-risk individuals across all
three tests (Fig 3: Panel A to C; S3 Fig). In addition, target areas were also identified in local-
ised areas around Mururu sector in Rusizi district in South-Western province, and Nkombo
sector which is located around the southern end of Lake Kivu in Rusizi district.
Despite some general agreement, we identified considerable discrepancies in spatial pat-
terns and estimated densities of at-risk children across diagnostic tests. For the CCA with traceas positive test, we estimated that approximately 671,856 boys aged 5 to 9 years are currently
Table 2. Predictor associations with an individual child’s probability of being infected with Schistosoma mansoni,estimated using three different diagnostic methods to account for possible discrepancies in diagnostic perfor-
mance and estimates of geographical endemicity. For each diagnostic method, a geostatistical model was built to
estimate predictor effects while accounting for spatial autocorrelation. Presented are effect means and 95% credible
intervals (in brackets). KK; Kato-Katz. CCA; Circulating Cathodic Antigen.
Variable KK CCA with trace aspositive
CCA with trace asnegative
Age 10–14 y (versus 5–9 y) 1.47 (-4.75, 10.15) 0.01 (-0.55, 0.57) 1.11 (-0.20, 2.73)
Age 15–18 y (versus 5–9 y) 0.91 (-5.35, 9.56) -0.16 (-0.76, 0.46) 1.08 (-0.29, 2.72)
Male (versus female) 0.54 (0.21, 0.88) 0.08 (0.02, 0.15) 0.30 (0.18, 0.43)
Land surface temperaturea 0.91 (0.14, 1.73) 0.08 (-0.03, 0.20) 0.12 (-0.06, 0.30)
Normalized difference vegetation indexa 0.93 (-0.08, 2.00) 0.23 (0.08, 0.38) 0.28 (0.03, 0.54)
Normalized difference water indexa -0.36 (-1.59, 0.80) -0.10 (-0.29, 0.08) -0.25 (-0.56, 0.06)
ϕ (phi: rate of decay of spatial
correlation)b11.90 (4.24,
19.34)
17.36 (13.10, 19.88) 14.81 (9.06, 19.54)
σ2 (sigma: variance of spatial random
effect)b
11.74 (5.93,
23.15)
1.17 (0.95, 1.46) 2.65 (2.00, 3.62)
Tau (precision) 0.10 (0.04, 0.17) 0.86 (0.69, 1.05) 0.39 (0.28, 0.50)
Intercept -9.57 (-18.32,
-2.99)
-0.80 (-1.42, -0.19) -4.87 (-6.54, -3.48)
a Variables were standardized to have mean = 0 and standard deviation = 1b Measured in decimal degrees and 3/phi determines the cluster size; one decimal degree is approximately 111km at
the Equator (the size of the radii of the clusters).
https://doi.org/10.1371/journal.pntd.0007723.t002
Disparities in Schistosoma risk-mapping using different diagnostics
PLOS Neglected Tropical Diseases | https://doi.org/10.1371/journal.pntd.0007723 September 30, 2019 10 / 21
infected with S. mansoni in Rwanda (95% CI: 655,349–678,692), while only 60,453 individuals
in this target group are predicted to be infected based on the CCA with trace as negative test
(95% CI: 52,452–61,116; Table 3). While both CCA datasets identified the Gisenyi sector of the
Rubavu district in the Western province as a potential target, estimated densities were much
higher when using the CCA with trace as positive data (with up to 887 at-risk individuals per
square km; compared to 117 people per square km for CCA with trace as negative; Fig 3: Panel
B and C). Moreover, the KK map identified a target area around Rukomo sector in Gicumbi
district (North-Eastern region) that was not identified by the CCA tests (Fig 3: Panel A).
Fig 2. Predicted prevalence of Schistosoma mansoni infection in Rwandan boys aged 5–9 years, estimated using
three different diagnostic methods: Kato-Katz (Panel A), CCA with trace as positive (Panel B), and CCA with traceas negative (Panel C). Predictions were generated using separate geostatistical models to account for possible
discrepancies in diagnostic performance and estimates of geographical endemicity. Refer to S3 Fig in Supporting
Information for names of geographical districts. This figure was produced in ArcMap 10.4 (ESRI, Redlands, CA) using
a shapefile representing Rwanda’s current administrative units (obtained from the geographic data warehouse DIVA
GIS (www.diva-gis.org/Data)). CCA; Circulating Cathodic Antigen.
https://doi.org/10.1371/journal.pntd.0007723.g002
Disparities in Schistosoma risk-mapping using different diagnostics
PLOS Neglected Tropical Diseases | https://doi.org/10.1371/journal.pntd.0007723 September 30, 2019 11 / 21
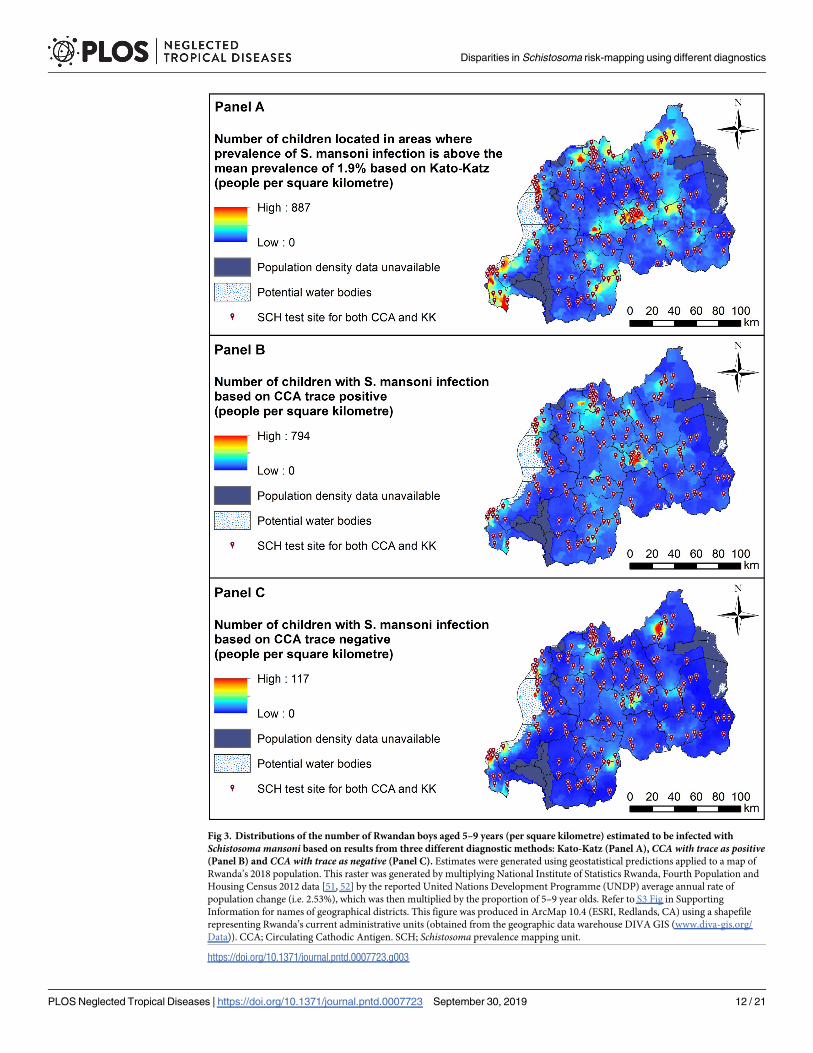
Fig 3. Distributions of the number of Rwandan boys aged 5–9 years (per square kilometre) estimated to be infected with
Schistosoma mansoni based on results from three different diagnostic methods: Kato-Katz (Panel A), CCA with trace as positive(Panel B) and CCA with trace as negative (Panel C). Estimates were generated using geostatistical predictions applied to a map of
Rwanda’s 2018 population. This raster was generated by multiplying National Institute of Statistics Rwanda, Fourth Population and
Housing Census 2012 data [51, 52] by the reported United Nations Development Programme (UNDP) average annual rate of
population change (i.e. 2.53%), which was then multiplied by the proportion of 5–9 year olds. Refer to S3 Fig in Supporting
Information for names of geographical districts. This figure was produced in ArcMap 10.4 (ESRI, Redlands, CA) using a shapefile
representing Rwanda’s current administrative units (obtained from the geographic data warehouse DIVA GIS (www.diva-gis.org/
Data)). CCA; Circulating Cathodic Antigen. SCH; Schistosoma prevalence mapping unit.
https://doi.org/10.1371/journal.pntd.0007723.g003
Disparities in Schistosoma risk-mapping using different diagnostics
PLOS Neglected Tropical Diseases | https://doi.org/10.1371/journal.pntd.0007723 September 30, 2019 12 / 21
Discussion
Our study outlines important risk factors and provides national geostatistical projections of
Schistosoma mansoni infection burden in Rwanda. Concordant spatial predictions for diagnos-
tic test groups highlighted areas in most need of interventions. Population-dense areas in the
West and around Rwanda’s capital region are projected to exhibit environmental conditions
that are conducive to transmission and harbour high densities of at-risk children. Our findings
therefore provide useful insights that can be leveraged to devise tailored monitoring and inter-
vention programs. However, our assessment of multiple diagnostic procedures highlights a
major issue in efforts to design intervention strategies that can reduce schistosomiasis-related
morbidity. Variation in parasite detection rates, identification of different environmental risk
factors and geographical discrepancies in at-risk projections suggest that considerably different
inferences will be gleaned from surveys using either KK or CCA datasets [27]. This is particu-
larly evident in Rwanda, where the low overall prevalence leads to even greater insensitivity by
the KK method and is similar to a comparable country-wide survey done in Burundi [53]. We
stress that data collection using multiple diagnostic sources may be necessary to generate accu-
rate infection estimates while dealing with diagnostic test uncertainty.
Identifying areas at greatest need of targeted Schistosoma mansonimitigation: Discrepancies across Kato-Katz and circulating cathodic
antigen surveys
Helminth infection is among the most common causes of anaemia and subsequent hospitaliza-
tion in Rwanda [31, 54]. As one of Africa’s most densely populated countries and with an
economy that relies on agriculture [32], it is unsurprising that up to 36% of schoolchildren
are estimated to be infected with S. mansoni. However, infection rates are not homogenous
throughout the country. Determining accurate estimates of Schistosoma prevalence is an
important step to design mitigation programs, particularly considering that even low infection
intensities can cause morbidity [3]. We provide multiple lines of evidence that different diag-
nostic procedures yield different inferences about S. mansoni infection rates and spatial pat-
terns in Rwandan schoolchildren. Our prevalence estimates varied largely across procedures,
with the KK method yielding far lower estimates compared to the CCA datasets. Explaining
this discrepancy requires an understanding of what these tests are designed to detect. Positive
detection by the KK method is limited to individuals that are infected with egg-producing
female worms in sufficient numbers to consistently yield eggs in their faeces. This immediately
rules out detection of some infections that are composed of male worms, of worms that have
not reached sexual maturity or low numbers of worms that produce low numbers of eggs.
Moreover, parasite egg counts in our study (as in most KK studies) were based on a single
stool sample, which can limit the ability of technicians to identify infections [28]. Finally, other
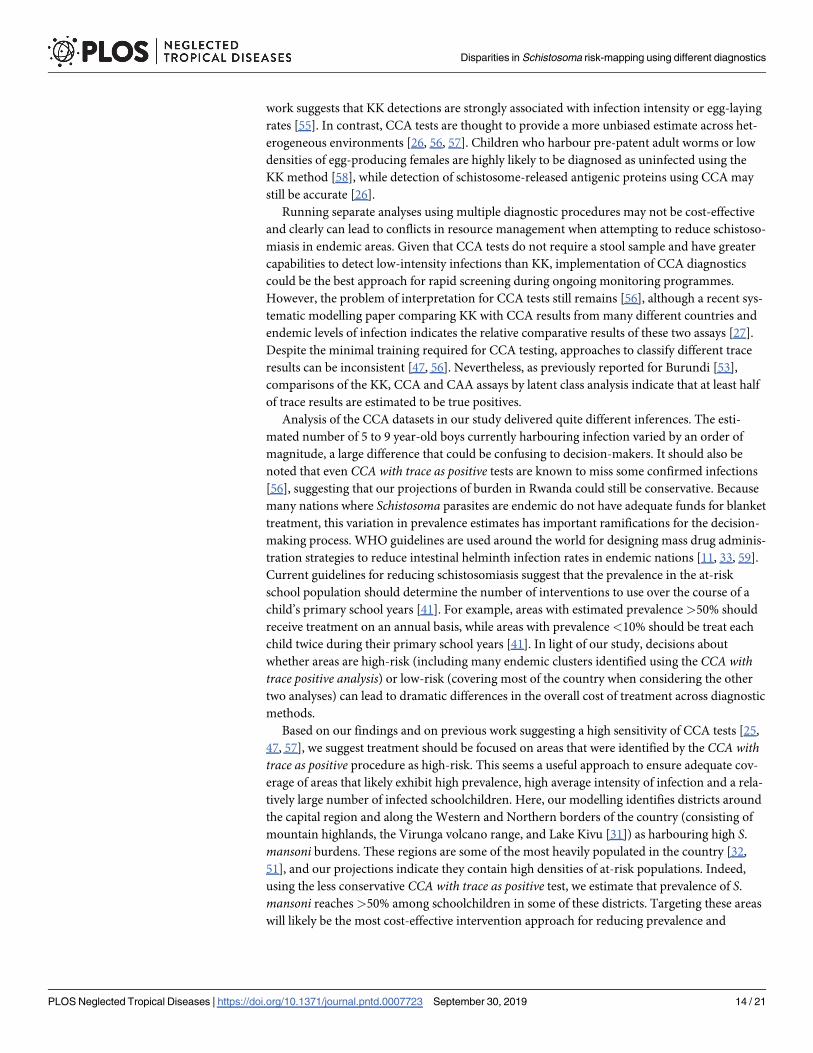
Table 3. Predicted number of individual boys aged 5 to 9 years estimated to be harbouring Schistosoma mansoni infection in Rwanda in 2018 based on results from
two different diagnostic methods: CCA with trace as positive and CCA with trace as negative. CCA; Circulating Cathodic Antigen.
Total population for 2015 (in
Thousands)aAnnual population growth rate for 2015–2020
(Percentage)aPercentage of individuals
aged 5-9yaPredicted number of individuals with S.
mansoni infection in 2018
CCA with as tracepositive
CCA with as tracenegative
11629.6 2.53 13.85 671,856 60,453
a Source: World Population Prospects 2017 Revision Population Database: Rwanda
CCA; Circulating Cathodic Antigen
https://doi.org/10.1371/journal.pntd.0007723.t003
Disparities in Schistosoma risk-mapping using different diagnostics
PLOS Neglected Tropical Diseases | https://doi.org/10.1371/journal.pntd.0007723 September 30, 2019 13 / 21
work suggests that KK detections are strongly associated with infection intensity or egg-laying
rates [55]. In contrast, CCA tests are thought to provide a more unbiased estimate across het-
erogeneous environments [26, 56, 57]. Children who harbour pre-patent adult worms or low
densities of egg-producing females are highly likely to be diagnosed as uninfected using the
KK method [58], while detection of schistosome-released antigenic proteins using CCA may
still be accurate [26].
Running separate analyses using multiple diagnostic procedures may not be cost-effective
and clearly can lead to conflicts in resource management when attempting to reduce schistoso-
miasis in endemic areas. Given that CCA tests do not require a stool sample and have greater
capabilities to detect low-intensity infections than KK, implementation of CCA diagnostics
could be the best approach for rapid screening during ongoing monitoring programmes.
However, the problem of interpretation for CCA tests still remains [56], although a recent sys-
tematic modelling paper comparing KK with CCA results from many different countries and
endemic levels of infection indicates the relative comparative results of these two assays [27].
Despite the minimal training required for CCA testing, approaches to classify different trace
results can be inconsistent [47, 56]. Nevertheless, as previously reported for Burundi [53],
comparisons of the KK, CCA and CAA assays by latent class analysis indicate that at least half
of trace results are estimated to be true positives.
Analysis of the CCA datasets in our study delivered quite different inferences. The esti-
mated number of 5 to 9 year-old boys currently harbouring infection varied by an order of
magnitude, a large difference that could be confusing to decision-makers. It should also be
noted that even CCA with trace as positive tests are known to miss some confirmed infections
[56], suggesting that our projections of burden in Rwanda could still be conservative. Because
many nations where Schistosoma parasites are endemic do not have adequate funds for blanket
treatment, this variation in prevalence estimates has important ramifications for the decision-
making process. WHO guidelines are used around the world for designing mass drug adminis-
tration strategies to reduce intestinal helminth infection rates in endemic nations [11, 33, 59].
Current guidelines for reducing schistosomiasis suggest that the prevalence in the at-risk
school population should determine the number of interventions to use over the course of a
child’s primary school years [41]. For example, areas with estimated prevalence >50% should
receive treatment on an annual basis, while areas with prevalence <10% should be treat each
child twice during their primary school years [41]. In light of our study, decisions about
whether areas are high-risk (including many endemic clusters identified using the CCA withtrace positive analysis) or low-risk (covering most of the country when considering the other
two analyses) can lead to dramatic differences in the overall cost of treatment across diagnostic
methods.
Based on our findings and on previous work suggesting a high sensitivity of CCA tests [25,
47, 57], we suggest treatment should be focused on areas that were identified by the CCA withtrace as positive procedure as high-risk. This seems a useful approach to ensure adequate cov-
erage of areas that likely exhibit high prevalence, high average intensity of infection and a rela-
tively large number of infected schoolchildren. Here, our modelling identifies districts around
the capital region and along the Western and Northern borders of the country (consisting of
mountain highlands, the Virunga volcano range, and Lake Kivu [31]) as harbouring high S.
mansoni burdens. These regions are some of the most heavily populated in the country [32,
51], and our projections indicate they contain high densities of at-risk populations. Indeed,
using the less conservative CCA with trace as positive test, we estimate that prevalence of S.
mansoni reaches >50% among schoolchildren in some of these districts. Targeting these areas
will likely be the most cost-effective intervention approach for reducing prevalence and
Disparities in Schistosoma risk-mapping using different diagnostics
PLOS Neglected Tropical Diseases | https://doi.org/10.1371/journal.pntd.0007723 September 30, 2019 14 / 21
associated morbidity, as programs targeting areas with high transmission risk are expected to
be more efficient reduction measures for battling schistosomiasis [10, 59].
In addition to mass drug administration, additional measures should ensure improved
access to clean water and environmental measures to control snail abundances and reduce
transmission [59, 60]. With malnutrition and diarrhea presenting as two of the most com-
mon causes of hospital-based child mortality in Rwanda [34], population densities and lack
of adequate sanitation likely play strong roles in driving the observed spatial variation in S.
mansoni infection rates. Schistosoma parasites maintain high transmission rates in regions
where overcrowding and poor sanitation coincide [61]. For example in Rwanda’s capital city
Kigali, where we identified an endemic cluster of high S. mansoni infection risk, construction
of adequate sanitation facilities has not kept pace with rapid population expansion in recent
years [62]. Instead, many people reside in high-density temporary slums where access to
freshwater is limited. However, the issue of poor sanitation is not restricted to urbanised
areas. Pit latrines, which facilitate the spread of infectious diseases through environmental
contamination, are the most common toilet facilities, while defecation in fields or rivers is
also commonplace [63]. Poverty contributes to these poor sanitation practices, as low-income
communities are often located in marsh or swamp lands skirting urban centres in Rwanda
[62]. In these areas, densities of intermediate snail hosts may be high, leading to high trans-
mission forces.
Risk factors for Schistosoma mansoni infection in Rwandan schoolchildren
Female S. mansoni worms can produce hundreds of eggs per day [64]. When sanitation rates
are poor and burdens are high, ecological risk factors that influence vegetation or water prop-
erties, both of which impact parasite survival and/or infectivity, become especially important.
The widespread availability of satellite imagery has played a key role in identifying ecological
correlates of geographical distributions and infection rates for an incredible diversity of patho-
gens [29, 65–69]. For human helminth parasites, numerous geostatistical analyses have delin-
eated spatial clusters of high infection risk, further indicating a strong role of environmental
forces [29, 65, 70, 71]. In our case, we identified LST and NDVI as important predictors of S.
mansoni infection probability and spatial clustering. Temperature of the land surface is a key
predictor of population dynamics for intermediate snail hosts, while low temperatures can
impede the development of Schistosoma parasites within snails [43]. Vegetation indices could
reflect distributions of habitats that are suitable for snails, while both variables in tandem may
influence vegetation or soil properties that determine the survival of parasite stages in human
excreta (Schistosoma eggs that release miracidia) or the infectivity of water-borne stages that
penetrate human skin (cercariae) [4, 61]. Identifying key drivers of infection risk using
remotely sensed variables presents a major advantage in efforts to provide continuously
updated high-resolution projection maps [66, 72–74].
Study limitations
We provide new insights into risk factors and the spatial distribution of S. mansoni infections
in Rwanda. However, our study has some weaknesses that should not be ignored. Our dataset
did not consider whether infection with other intestinal parasites might have influenced risk of
S. mansoni infection. Parasite co-infections are ubiquitous, and there is mounting evidence
indicating that biotic parasite associations can have marked influences infection risk and/or
disease progression [70, 71, 75–79]. In addition, remote-sensed variables such as those used in
our study come with their own levels of uncertainty, though these are commonly ignored
Disparities in Schistosoma risk-mapping using different diagnostics
PLOS Neglected Tropical Diseases | https://doi.org/10.1371/journal.pntd.0007723 September 30, 2019 15 / 21
when producing raster maps [80, 81]. Moreover, our projection maps of at-risk population
densities used population estimates from the UN population database. These estimates may
not be entirely accurate, as data on the proportion of persons within our target age group over-
laps a number of UN categories. Further uncertainty in our estimates could result from our
approach to calculate population sizes using the UNDP average annual rate of population
change. This average rate may not reflect spatio-temporal variation in population changes in
Rwanda. Finally, while school-based surveys are the primary method of choice for mapping
intestinal parasite infections, estimates of infections in adults would provide useful additional
information to gain better insights into population-level risk factors [82].
Conclusions
We provide high-resolution predictions of spatial heterogeneity in S. mansoni infection preva-
lence in Rwandan schoolchildren. Together with our identification of risk factors and data-
driven projections of current burdens in at-risk populations, these results can be leveraged to
make informed decisions about mass drug treatment regimes. Treatment decisions based on
mapping and modelling approaches such as ours could be useful for managers deciding
between sustained morbidity control or moving toward elimination [21]. Ongoing monitoring
and use of continuously updated geostatistical models will be essential for designing intestinal
parasite mitigation programmes and evaluating their efficacy [66, 72–74]. Nevertheless, we
highlight important discrepancies in spatial disease projections that rely on different diagnos-
tic procedures. Greater emphasis is needed to develop standardized guidelines for classifying
CCA trace results, as our risk maps yielded very different conclusions about areas in need of
treatment when considering traces as positive or negative. We hope that our research provides
a platform to help mitigate Schistosoma infection burdens and associated morbidity in the
tropical and subtropical regions.
Supporting information
S1 Data. Individual-level observations of infection data.
(CSV)
S1 Table. Associations between Schistosoma mansoni presence-absence results from the
three diagnostic test methods. CCA; circulating cathodic antigen. The CCA with trace as posi-tive dataset considered readings of ‘trace’ as positive infections, while the CCA with trace asnegative dataset considered these as negative.
(DOCX)
S1 Fig. Rapid medical diagnostic circulating cathodic antigen (CCA) test results. From
the left to the right: negative (0), trace, positive (1+), double positive (2++), and strong positive
(3+++), according to the intensity of the test line.
(DOCX)
S2 Fig. Visual representations of residual spatial autocorrelation semivariograms for the
Kato-Katz dataset (top panel), the CCA trace positive dataset (middle panel) and the CCA
trace negative dataset (bottom panel).
(DOCX)
S3 Fig. Map of Rwanda’s provencial districts.
(DOCX)
Disparities in Schistosoma risk-mapping using different diagnostics
PLOS Neglected Tropical Diseases | https://doi.org/10.1371/journal.pntd.0007723 September 30, 2019 16 / 21
Acknowledgments
We thank the many children, parents, schoolteachers and district administrative and health
officials who participated in this parasite re-mapping survey in Rwanda. We also thank the dis-
trict and central level staff, the Rwanda Biomedical Center and the Schistosomiasis Control
Initiative (SCI) for providing organizational and administrative support during the field
survey.
Author Contributions
Conceptualization: Irenee Umulisa, Eugene Ruberanziza, Daniel G. Colley, Giuseppina Ortu,
Carl H. Campbell, Jr, Emmanuel Ruzindana, Warren Lancaster, Jean Bosco Mbonigaba,
Aimable Mbituyumuremyi, Alan Fenwick, Ricardo J. Soares Magalhaes, Innocent Turate.
Formal analysis: Nicholas J. Clark, Kei Owada, Ricardo J. Soares Magalhaes.
Funding acquisition: Irenee Umulisa, Daniel G. Colley, Carl H. Campbell, Jr, Warren Lancas-
ter, Alan Fenwick.
Investigation: Irenee Umulisa, Eugene Ruberanziza.
Methodology: Nicholas J. Clark, Kei Owada.
Project administration: Irenee Umulisa, Eugene Ruberanziza.
Supervision: Irenee Umulisa, Eugene Ruberanziza.
Visualization: Nicholas J. Clark.
Writing – original draft: Nicholas J. Clark, Kei Owada, Ricardo J. Soares Magalhaes.
Writing – review & editing: Nicholas J. Clark, Eugene Ruberanziza, Kei Owada, Daniel G.
Colley, Giuseppina Ortu, Carl H. Campbell, Jr, Emmanuel Ruzindana, Warren Lancaster,
Jean Bosco Mbonigaba, Aimable Mbituyumuremyi, Alan Fenwick, Ricardo J. Soares Magal-
haes, Innocent Turate.
References1. Rujeni N, Morona D, Ruberanziza E, Mazigo HD. Schistosomiasis and soil-transmitted helminthiasis in
Rwanda: an update on their epidemiology and control. Infect Dis Poverty. 2017; 6(1):8. https://doi.org/
10.1186/s40249-016-0212-z PMID: 28245883
2. Burke M, Jones M, Gobert G, Li Y, Ellis M, McManus D. Immunopathogenesis of human schistosomia-
sis. Paras Immunol. 2009; 31(4):163–76.
3. King CH, Dangerfield-Cha M. The unacknowledged impact of chronic schistosomiasis. Chronic Illness.
2008; 4(1):65–79. https://doi.org/10.1177/1742395307084407 PMID: 18322031.
4. Lardans V, Dissous C. Snail control strategies for reduction of schistosomiasis transmission. Parasitol-
ogy Today. 1998; 14(10):413–7. https://doi.org/10.1016/s0169-4758(98)01320-9 PMID: 17040832
5. Grimes JE, Croll D, Harrison WE, Utzinger J, Freeman MC, Templeton MR. The relationship between
water, sanitation and schistosomiasis: a systematic review and meta-analysis. PLoS Negl Trop Dis.
2014; 8(12):e3296. https://doi.org/10.1371/journal.pntd.0003296 PMID: 25474705
6. Steinmann P, Keiser J, Bos R, Tanner M, Utzinger J. Schistosomiasis and water resources develop-
ment: systematic review, meta-analysis, and estimates of people at risk. The Lancet Infectious Dis-
eases. 2006; 6(7):411–25. https://doi.org/10.1016/S1473-3099(06)70521-7 PMID: 16790382
7. Hotez PJ, Fenwick A. Schistosomiasis in Africa: An Emerging Tragedy in Our New Global Health
Decade. PLoS Negl Trop Dis. 2009; 3(9):e485. https://doi.org/10.1371/journal.pntd.0000485 PMID:
19787054
8. van der Werf MJ, de Vlas SJ, Brooker S, Looman CW, Nagelkerke NJ, Habbema JDF, et al. Quantifica-
tion of clinical morbidity associated with schistosome infection in sub-Saharan Africa. Acta Tropica.
2003; 86(2–3):125–39. https://doi.org/10.1016/s0001-706x(03)00029-9 PMID: 12745133
Disparities in Schistosoma risk-mapping using different diagnostics
PLOS Neglected Tropical Diseases | https://doi.org/10.1371/journal.pntd.0007723 September 30, 2019 17 / 21
9. Hotez P. Mass Drug Administration and Integrated Control for the World’s High-Prevalence Neglected
Tropical Diseases. Clinical Pharmacology & Therapeutics. 2009; 85(6):659–64.
10. Turner HC, Truscott JE, Fleming FM, Hollingsworth TD, Brooker SJ, Anderson RM. Cost-effectiveness
of scaling up mass drug administration for the control of soil-transmitted helminths: a comparison of
cost function and constant costs analyses. The Lancet Infectious Diseases. 2016; 16(7):838–46.
https://doi.org/10.1016/S1473-3099(15)00268-6 PMID: 26897109
11. Fenwick A, Rollinson D, Southgate V. Implementation of human schistosomiasis control: challenges
and prospects. Adv Parasitol. 2006; 61:567–622. https://doi.org/10.1016/S0065-308X(05)61013-5
PMID: 16735173
12. Hotez PJ, Molyneux DH, Fenwick A, Kumaresan J, Sachs SE, Sachs JD, et al. Control of neglected
tropical diseases. New Engl J Med. 2007; 357(10):1018–27. https://doi.org/10.1056/NEJMra064142
PMID: 17804846
13. Jordan P, Webbe G. Schistosomiasis: epidemiology, treatment and control: London, UK; William
Heinemann Medical Books Ltd; 1982.
14. Rudge JW, Stothard JR, Basañez M-G, Mgeni AF, Khamis IS, Khamis AN, et al. Micro-epidemiology of
urinary schistosomiasis in Zanzibar: Local risk factors associated with distribution of infections among
schoolchildren and relevance for control. Acta Tropica. 2008; 105(1):45–54. https://doi.org/10.1016/j.
actatropica.2007.09.006 PMID: 17996207
15. Woolhouse ME, Dye C, Etard J-F, Smith T, Charlwood J, Garnett G, et al. Heterogeneities in the trans-
mission of infectious agents: implications for the design of control programs. Proc Nat Acad Sci. 1997;
94(1):338–42. https://doi.org/10.1073/pnas.94.1.338 PMID: 8990210
16. Bethony J, Williams JT, Kloos H, Blangero J, Alves-Fraga L, Buck G, et al. Exposure to Schistosoma
mansoni infection in a rural area in Brazil. II: household risk factors. Trop Med Int Health. 2001;
6(2):136–45. https://doi.org/10.1046/j.1365-3156.2001.00685.x PMID: 11251910
17. King CH. Epidemiology of schistosomiasis: determinants of transmission of infection. Schistosomiasis:
World Scientific; 2001. p. 115–32.
18. Schur N, Hurlimann E, Stensgaard A-S, Chimfwembe K, Mushinge G, Simoonga C, et al. Spatially
explicit Schistosoma infection risk in eastern Africa using Bayesian geostatistical modelling. Acta Tro-
pica. 2013; 128(2):365–77. https://doi.org/10.1016/j.actatropica.2011.10.006 PMID: 22019933
19. Michelson EH. Studies on the biological control of schistosome-bearing snails. Predators and parasites
of fresh-water mollusca: A review of the literature. Parasitol. 1957; 47(3–4):413–26.
20. Dillon RT. The ecology of freshwater molluscs: Cambridge University Press; 2000.
21. Fenwick A, Jourdan P. Schistosomiasis elimination by 2020 or 2030? Int J Parasitol. 2016; 46(7):385–
8. https://doi.org/10.1016/j.ijpara.2016.01.004 PMID: 26907938
22. Danso-Appiah A, De Vlas S J, Bosompem KM, Habbema JDF. Determinants of health-seeking behav-
iour for schistosomiasis-related symptoms in the context of integrating schistosomiasis control within
the regular health services in Ghana. Trop Med Int Health. 2004; 9(7):784–94. https://doi.org/10.1111/j.
1365-3156.2004.01267.x PMID: 15228488
23. World Health Organization. Basic laboratory methods in medical parasitology. Geneva: World Health
Organization 1991.
24. Shane HL, Verani JR, Abudho B, Montgomery SP, Blackstock AJ, Mwinzi PNM, et al. Evaluation of
Urine CCA Assays for Detection of Schistosoma mansoni Infection in Western Kenya. PLoS Negl Trop
Dis. 2011; 5(1):e951. https://doi.org/10.1371/journal.pntd.0000951 PMID: 21283613
25. Stothard JR, Kabatereine NB, Tukahebwa EM, Kazibwe F, Rollinson D, Mathieson W, et al. Use of
circulating cathodic antigen (CCA) dipsticks for detection of intestinal and urinary schistosomiasis.
Acta Tropica. 2006; 97(2):219–28. https://doi.org/10.1016/j.actatropica.2005.11.004 PMID:
16386231
26. Kittur N, Castleman JD, Campbell CH Jr, King CH, Colley DG. Comparison of Schistosoma mansoni
prevalence and intensity of infection, as determined by the circulating cathodic antigen urine assay or
by the Kato-Katz fecal assay: a systematic review. Am J Trop Med Hyg. 2016; 94(3):605–10. https://
doi.org/10.4269/ajtmh.15-0725 PMID: 26755565
27. Barenbold O, Garba A, Colley DG, Fleming FM, Haggag AA, Ramzy RMR, et al. Translating preventive
chemotherapy prevalence thresholds for Schistosoma mansoni from the Kato-Katz technique into the
point-of-care circulating cathodic antigen diagnostic test. PLoS Negl Trop Dis. 2018; 12(12):e0006941.
https://doi.org/10.1371/journal.pntd.0006941 PMID: 30550594
28. Krauth SJ, Coulibaly JT, Knopp S, Traore M, N’Goran EK, Utzinger J. An in-depth analysis of a piece of
shit: distribution of Schistosoma mansoni and hookworm eggs in human stool. PLoS Negl Trop Dis.
2012; 6(12):e1969. https://doi.org/10.1371/journal.pntd.0001969 PMID: 23285307
Disparities in Schistosoma risk-mapping using different diagnostics
PLOS Neglected Tropical Diseases | https://doi.org/10.1371/journal.pntd.0007723 September 30, 2019 18 / 21
29. Brooker S. Spatial epidemiology of human schistosomiasis in Africa: risk models, transmission dynam-
ics and control. Trans Roy Soc Trop Med Hyg. 2007; 101(1):1–8. https://doi.org/10.1016/j.trstmh.2006.
08.004 PMID: 17055547
30. Chammartin F, Hurlimann E, Raso G, N’Goran EK, Utzinger J, Vounatsou P. Statistical methodological
issues in mapping historical schistosomiasis survey data. Acta Tropica. 2013; 128(2):345–52. https://
doi.org/10.1016/j.actatropica.2013.04.012 PMID: 23648217
31. ICF International. Rwanda Demographic and Health Survey 2014–15, National Institute of Statistics of
Rwanda. Rockville, Maryland, USA 2016.
32. World Bank. The World Bank in Rwanda 2014 [May 2018]. http://www.worldbank.org/en/country/
rwanda/overview.
33. World health report. Working together for health. Geneva http://www.who.int/whr/2006/en: World Health
Organization; 2006.
34. Rwanda Human Resources for Health Program. Strategic plan 2011–2016. Kigali http://www.brown.
edu/academics/medical/bright/sites/brown.edu.academics.medical.bright/files/uploads/MOH%
20Rwanda%20HRH%20Strategic%20Plan%202011%20-%202016.pdf: Ministry of Health of the
Republic of Rwanda; 2011.
35. Binagwaho A, Kyamanywa P, Farmer PE, Nuthulaganti T, Umubyeyi B, Nyemazi JP, et al. The human
resources for health program in Rwanda—a new partnership. New Engl J Med. 2013; 369(21):2054–9.
https://doi.org/10.1056/NEJMsr1302176 PMID: 24256385
36. Ruberanziza E, Owada K, Clark NJ, Umulisa I, Ortu G, Lancaster W, et al. Mapping Soil-Transmitted
Helminth Parasite Infection in Rwanda: Estimating Endemicity and Identifying At-Risk Populations.
Trop Med Infect Dis. 2019; 4(2):93.
37. Ruberanziza E, Kabera M, Ortu G, Kanobana K, Mupfasoni D, Ruxin J, et al. Nkombo Island: the most
important Schistosomiasis mansoni focus in Rwanda. American Journal of Life Sciences. 2015;
3(1):27–31.
38. Mupfasoni D, Karibushi B, Koukounari A, Ruberanziza E, Kaberuka T, Kramer MH, et al. Polyparasite
Helminth Infections and Their Association to Anaemia and Undernutrition in Northern Rwanda. PLoS
Negl Trop Dis. 2009; 3(9):e517. https://doi.org/10.1371/journal.pntd.0000517 PMID: 19753110
39. Clerinx J, Bottieau E, Wichmann D, Tannich E, Van Esbroeck M. Acute schistosomiasis in a cluster of
travelers from Rwanda: diagnostic contribution of schistosome DNA detection in serum compared to
parasitology and serology. Journal of Travel Medicine. 2011; 18(6):367–72. https://doi.org/10.1111/j.
1708-8305.2011.00552.x PMID: 22017711
40. Lai Y-S, Biedermann P, Ekpo UF, Garba A, Mathieu E, Midzi N, et al. Spatial distribution of schistosomi-
asis and treatment needs in sub-Saharan Africa: a systematic review and geostatistical analysis. The
Lancet Infectious Diseases. 2015; 15(8):927–40. https://doi.org/10.1016/S1473-3099(15)00066-3
PMID: 26004859
41. World Health Organization. Helminth control in school-age children: a guide for managers of control pro-
grammes, 2nd edition. Geneva: World Health Organization; 2002.
42. Appleton C. Review of literature on abiotic factors influencing the distribution and life cycles of bilharzia-
sis intermediate host snails. 1978; 11:1–25.
43. Sturrock RF. The intermediate hosts and host–parasite relationships. Jordan P, Webbe G, Sturrock RF,
editors. Wallingford: CAB International; 1993.
44. Environmental Systems Research Institute. ArcGIS Desktop: Release 10.4. Redlands, California,
USA: Environmental Systems Research Institute; 2015.
45. World Health Organization. Scientific working group on Schistosomiasis. Geneva: World Health Orga-
nization: 2005.
46. Casacuberta M, Kinunghi S, Vennervald BJ, Olsen A. Evaluation and optimization of the Circulating
Cathodic Antigen (POC-CCA) cassette test for detecting Schistosoma mansoni infection by using
image analysis in school children in Mwanza Region, Tanzania. Parasite Epidemiology and Control.
2016; 1(2):105–15. https://doi.org/10.1016/j.parepi.2016.04.002 PMID: 27430027
47. Ortu G, Ndayishimiye O, Clements M, Kayugi D, Campbell CH, Lamine MS, et al. Countrywide reas-
sessment of Schistosoma mansoni infection in Burundi using a urine-Circulating Cathodic Antigen rapid
test: informing the National Control Program. Am J Trop Med Hyg. 2017; 96(3):664–73. https://doi.org/
10.4269/ajtmh.16-0671 PMID: 28115675
48. Ribeiro PJ, Diggle PJ. geoR: Analysis of Geostatistical Data R package version 1.7–5.2. 2016.
49. Soares Magalhães RJ, Clements ACA, Patil AP, Gething PW, Brooker S. The applications of model-
based geostatistics in helminth epidemiology and control. Adv Parasitol. 2011; 74:267–96. https://doi.
org/10.1016/B978-0-12-385897-9.00005-7 PMID: 21295680
Disparities in Schistosoma risk-mapping using different diagnostics
PLOS Neglected Tropical Diseases | https://doi.org/10.1371/journal.pntd.0007723 September 30, 2019 19 / 21
50. Lunn D, Jackson C, Best N, Thomas A, Spiegelhalter D. The BUGS Book: A practical introduction to
Bayesian analysis: CRC Press; 2012.
51. Center for International Earth Science Information Network (CIESIN). Documentation for the Gridded
Population of the World, Version 4 (GPWv4) Columbia University, Palisades, New York: NASA Socio-
economic Data and Applications Center (SEDAC)2016 [21st January 2018]. http://dx.doi.org/10.7927/
H4D50JX4.
52. Population Division of the Department of Economic SAotUNS. World Population Prospects 2017 Revi-
sion Population Database: Rwanda. https://esa.un.org/unpd/wpp/DataQuery/2017.
53. Clements MN, Corstjens PLAM, Binder S, Campbell CH Jr., de Dood CJ, Fenwick A, et al. Latent class
analysis to evaluate performance of point-of-care CCA for low-intensity Schistosoma mansoni infec-
tions in Burundi. Paras Vect. 2018; 11(1):111-. https://doi.org/10.1186/s13071-018-2700-4 PMID:
29475457.
54. Colon-Gonzalez FJ, Tompkins AM, Biondi R, Bizimana JP, Namanya DB. Assessing the effects of air
temperature and rainfall on malaria incidence: an epidemiological study across Rwanda and Uganda.
Geospatial Health. 2016; 11(1s).
55. Foo KT, Blackstock AJ, Ochola EA, Matete DO, Mwinzi PN, Montgomery SP, et al. Evaluation of point-
of-contact circulating cathodic antigen assays for the detection of Schistosoma mansoni infection in
low-, moderate-, and high-prevalence schools in western Kenya. Am J Trop Med Hyg. 2015; 92
(6):1227–32. https://doi.org/10.4269/ajtmh.14-0643 PMID: 25870418
56. Clements MN, Donnelly CA, Fenwick A, Kabatereine NB, Knowles SCL, Meite A, et al. Interpreting
ambiguous ‘trace’ results in Schistosoma mansoni CCA Tests: Estimating sensitivity and specificity of
ambiguous results with no gold standard. PLoS Negl Trop Dis. 2017; 11(12):e0006102. https://doi.org/
10.1371/journal.pntd.0006102 PMID: 29220354
57. Colley DG, Binder S, Campbell C, King CH, Tchuente L-AT, N’Goran EK, et al. A five-country evaluation
of a point-of-care circulating cathodic antigen urine assay for the prevalence of Schistosoma mansoni.
Am J Trop Med Hyg. 2013; 88(3):426–32. https://doi.org/10.4269/ajtmh.12-0639 PMID: 23339198
58. Berhe N, Medhin G, Erko B, Smith T, Gedamu S, Bereded D, et al. Variations in helminth faecal egg
counts in Kato–Katz thick smears and their implications in assessing infection status with Schistosoma
mansoni. Acta Tropica. 2004; 92(3):205–12. https://doi.org/10.1016/j.actatropica.2004.06.011 PMID:
15533288
59. WHO Expert Committee on the Control of Schistosomiasis. Prevention and control of schistosomiasis
and soil-transmitted helminthiasis: report of a WHO expert committee. Geneva: World Health Organi-
zation; 2002.
60. Campbell SJ, Savage GB, Gray DJ, Atkinson J-AM, Soares Magalhães RJ, Nery SV, et al. Water, Sani-
tation, and Hygiene (WASH): A Critical Component for Sustainable Soil-Transmitted Helminth and
Schistosomiasis Control. PLoS Negl Trop Dis. 2014; 8(4):e2651. https://doi.org/10.1371/journal.pntd.
0002651 PMID: 24722335
61. Grimes JE, Croll D, Harrison WE, Utzinger J, Freeman MC, Templeton MR. The roles of water, sanita-
tion and hygiene in reducing schistosomiasis: a review. Paras Vect. 2015; 8(1):156.
62. Tsinda A, Abbott P, Pedley S, Charles K, Adogo J, Okurut K, et al. Challenges to Achieving Sustainable
Sanitation in Informal Settlements of Kigali, Rwanda. Int J Env Res Public Health. 2013; 10(12):6939.
https://doi.org/10.3390/ijerph10126939 PMID: 24336021
63. Gasana J, Morin J, Ndikuyeze A, Kamoso P. Impact of water supply and sanitation on diarrheal morbid-
ity among young children in the socioeconomic and cultural context of Rwanda (Africa). Environ Res.
2002; 90(2):76–88. https://doi.org/10.1006/enrs.2002.4394 PMID: 12483797
64. Moore DV, Sandground JH. The Relative Egg Producing Capacity of Schistosoma Mansoni and Schis-
tosoma Japonicum. Am J Trop Med Hyg. 1956; 5(5):831–40. https://doi.org/10.4269/ajtmh.1956.5.831
PMID: 13362750
65. Assoum M, Ortu G, Basañez M-G, Lau C, Clements ACA, Halton K, et al. Spatiotemporal distribution
and population at risk of soil-transmitted helminth infections following an eight-year school-based
deworming programme in Burundi, 2007–2014. Paras Vect. 2017; 10(1):583. https://doi.org/10.1186/
s13071-017-2505-x PMID: 29169386
66. Brooker S, Michael E. The potential of geographical information systems and remote sensing in the epi-
demiology and control of human helminth infections. Adv Parasitol. 2000; 47:245–88. PMID: 10997209
67. Clark NJ, Seddon JM, Kyaw-Tanner M, Al-Alawneh J, Harper G, McDonagh P, et al. Emergence of
canine parvovirus subtype 2b (CPV-2b) infections in Australian dogs. Infect Gen Evol. 2018; 58:50–5.
https://doi.org/10.1016/j.meegid.2017.12.013.
68. Clark N, Soares Magalhães RJ. Airborne geographical dispersal of Q Fever from livestock holdings to
human communities: a systematic review and critical appraisal of evidence. BMC Infect Dis. 2018:
https://doi.org/10.1186/s12879-018-3135-4 PMID: 29764368
Disparities in Schistosoma risk-mapping using different diagnostics
PLOS Neglected Tropical Diseases | https://doi.org/10.1371/journal.pntd.0007723 September 30, 2019 20 / 21
69. Wells K, Gibson DI, Clark NJ, Ribas A, Morand S, McCallum HI. Global spread of helminth parasites at
the human–domestic animal–wildlife interface. Glob Change Biol. 2018: https://doi.org/10.1111/gcb.
14064 PMID: 29436086
70. Soares Magalhães RJ, Biritwum N-K, Gyapong JO, Brooker S, Zhang Y, Blair L, et al. Mapping helminth
co-Infection and co-intensity: geostatistical prediction in Ghana. PLoS Negl Trop Dis. 2011; 5(6):e1200.
https://doi.org/10.1371/journal.pntd.0001200 PMID: 21666800
71. Raso G, Vounatsou P, Singer BH, Eliezer K, Tanner M, Utzinger J. An integrated approach for risk pro-
filing and spatial prediction of Schistosoma mansoni–hookworm coinfection. Proc Nat Acad Sci. 2006;
103(18):6934–9. https://doi.org/10.1073/pnas.0601559103 PMID: 16632601
72. Pullan RL, Gething PW, Smith JL, Mwandawiro CS, Sturrock HJ, Gitonga CW, et al. Spatial modelling
of soil-transmitted helminth infections in Kenya: a disease control planning tool. PLoS Negl Trop Dis.
2011; 5(2):e958. https://doi.org/10.1371/journal.pntd.0000958 PMID: 21347451
73. Truscott J, Turner H, Farrell S, Anderson R. Soil-transmitted helminths: Mathematical models of trans-
mission, the impact of mass drug administration and transmission elimination criteria. Adv Parasitol.
94: Elsevier; 2016. p. 133–98. https://doi.org/10.1016/bs.apar.2016.08.002 PMID: 27756454
74. Basañez M-G, McCarthy JS, French MD, Yang G-J, Walker M, Gambhir M, et al. A research agenda for
helminth diseases of humans: modelling for control and elimination. PLoS Negl Trop Dis. 2012; 6(4):
e1548. https://doi.org/10.1371/journal.pntd.0001548 PMID: 22545162
75. Clark NJ, Wells K, Dimitrov D, Clegg SM. Co-infections and environmental conditions drive the distribu-
tions of blood parasites in wild birds. J Anim Ecol. 2016; 85:1461–70. https://doi.org/10.1111/1365-
2656.12578 PMID: 27561363
76. Clark NJ, Wells K, Lindberg O. Unravelling changing interspecific interactions across environmental
gradients using Markov random fields. Ecol. 2018: https://doi.org/10.1002/ecy.2221 PMID: 29768661
77. Muturi EJ, Jacob BG, Kim C-H, Mbogo CM, Novak RJ. Are coinfections of malaria and filariasis of any
epidemiological significance? Parasitol Res. 2008; 102(2):175–81. https://doi.org/10.1007/s00436-007-
0779-1 PMID: 18026992
78. Tollenaere C, Susi H, Laine A-L. Evolutionary and Epidemiological Implications of Multiple Infection in
Plants. Trends Plant Sci. 2016; 21(1):80–90. https://doi.org/10.1016/j.tplants.2015.10.014 PMID:
26651920
79. Furuya-Kanamori L, Liang S, Milinovich G, Soares Magalhaes RJ, Clements ACA, Hu W, et al. Co-dis-
tribution and co-infection of chikungunya and dengue viruses. BMC Infect Dis. 2016; 16(1):84. https://
doi.org/10.1186/s12879-016-1417-2 PMID: 26936191
80. Hay S, Tatem A, Graham A, Goetz S, Rogers D. Global environmental data for mapping infectious dis-
ease distribution. Adv Parasitol. 2006; 62:37–77. https://doi.org/10.1016/S0065-308X(05)62002-7
PMID: 16647967
81. Brooker S, Clements AC, Bundy DA. Global epidemiology, ecology and control of soil-transmitted hel-
minth infections. Adv Parasitol. 2006; 62:221–61. https://doi.org/10.1016/S0065-308X(05)62007-6
PMID: 16647972
82. Campbell S, Osei-Atweneboana M, Stothard R, Koukounari A, Cunningham L, Armoo S, et al. The
COUNTDOWN Study Protocol for Expansion of Mass Drug Administration Strategies against Schisto-
somiasis and Soil-Transmitted Helminthiasis in Ghana. Trop Med Infect Dis. 2018; 3(1):10. https://doi.
org/10.3390/tropicalmed3010010 PMID: 30720777
Disparities in Schistosoma risk-mapping using different diagnostics
PLOS Neglected Tropical Diseases | https://doi.org/10.1371/journal.pntd.0007723 September 30, 2019 21 / 21