Embed Size (px)
Citation preview
Mapping Techniques and Visualization of Statistical Indicators
Haitham Zeidan
Palestinian Central Bureau of Statistics
IAOS 2014 Conference on Official Statistics 1
2
Contents
Objectives Methodology:
Data preparation Data Analysis Database Schema Data Mapping Algorithm Importing and Mapping Indicators Data Visualization
Experimental Results System Design and evaluation Conclusion and Future Work
IAOS 2014 Conference on Official Statistics
3
Objectives
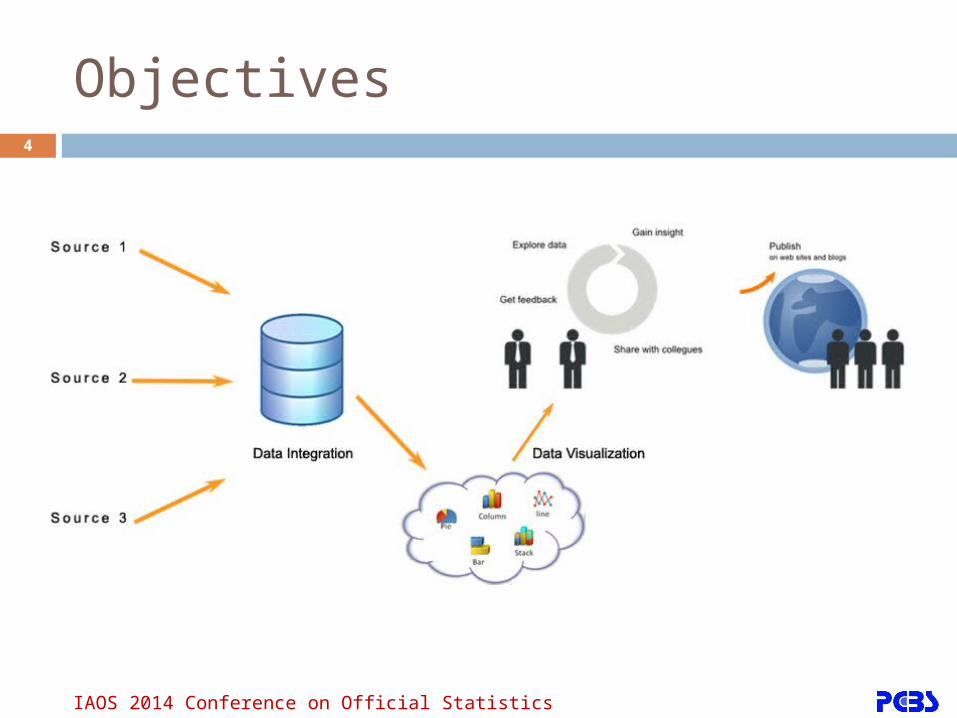
The objective of this study is to introduce mapping algorithm and visualization application for:Collecting, mapping, grouping, and integrating heterogeneous data and statistical indicators into a common schema.Due to increase in complexity and heterogeneity of statistical data, an increasing need for sophisticated visualization technology arises, We introduced a new visualization application to enhance presentation of official statistics based on visual analytical approach that combines both data analysis and interactive visualization.
We implemented new mapping algorithm based on hamming distance, edit distance and ontology, using our algorithm we enhanced integration, harmonization and mapping of statistical data indicators from different sourcesIAOS 2014 Conference on Official Statistics
4
Objectives
IAOS 2014 Conference on Official Statistics
5
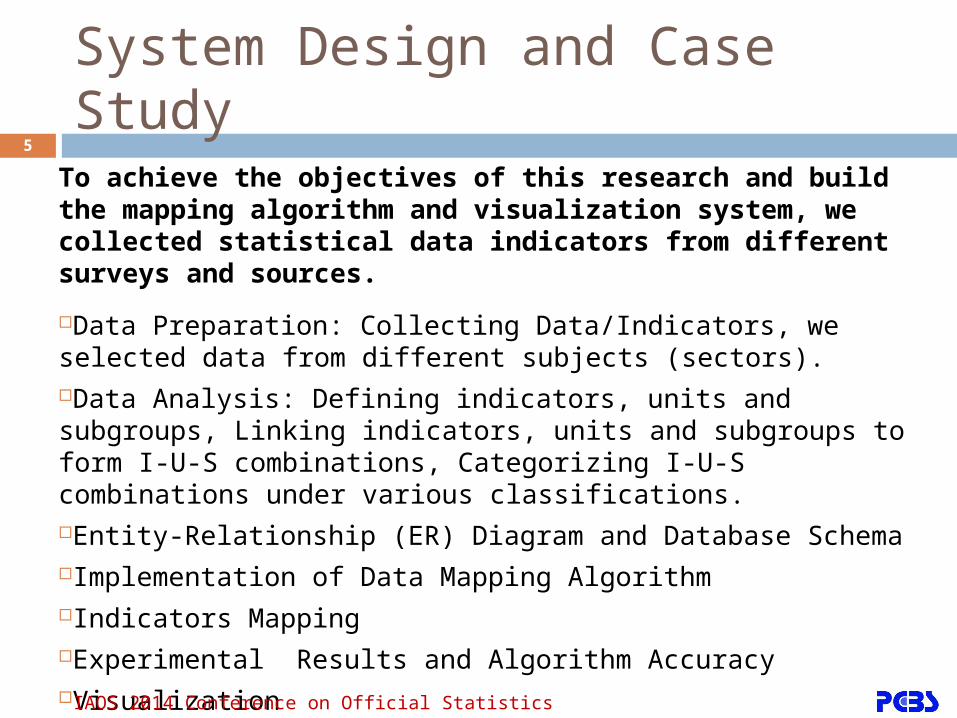
To achieve the objectives of this research and build the mapping algorithm and visualization system, we collected statistical data indicators from different surveys and sources.
Data Preparation: Collecting Data/Indicators, we selected data from different subjects (sectors). Data Analysis: Defining indicators, units and subgroups, Linking indicators, units and subgroups to form I-U-S combinations, Categorizing I-U-S combinations under various classifications.Entity-Relationship (ER) Diagram and Database SchemaImplementation of Data Mapping AlgorithmIndicators MappingExperimental Results and Algorithm AccuracyVisualization
System Design and Case Study
IAOS 2014 Conference on Official Statistics
6
We focused on in our study on Millennium Development Goals (MDGs) indicators.
Statistical data and indicators were included in different sectors and sub sectors like economy, education, environment, health, information and communication, nutrition, population and women.
Many interviews with the managers of Palestinian Central Bureau of Statistics (PCBS) departments and divisions were conducted to know the structure of the indicators, subgroups and units and to help us in building the final schema.
Data Preparation
IAOS 2014 Conference on Official Statistics
7
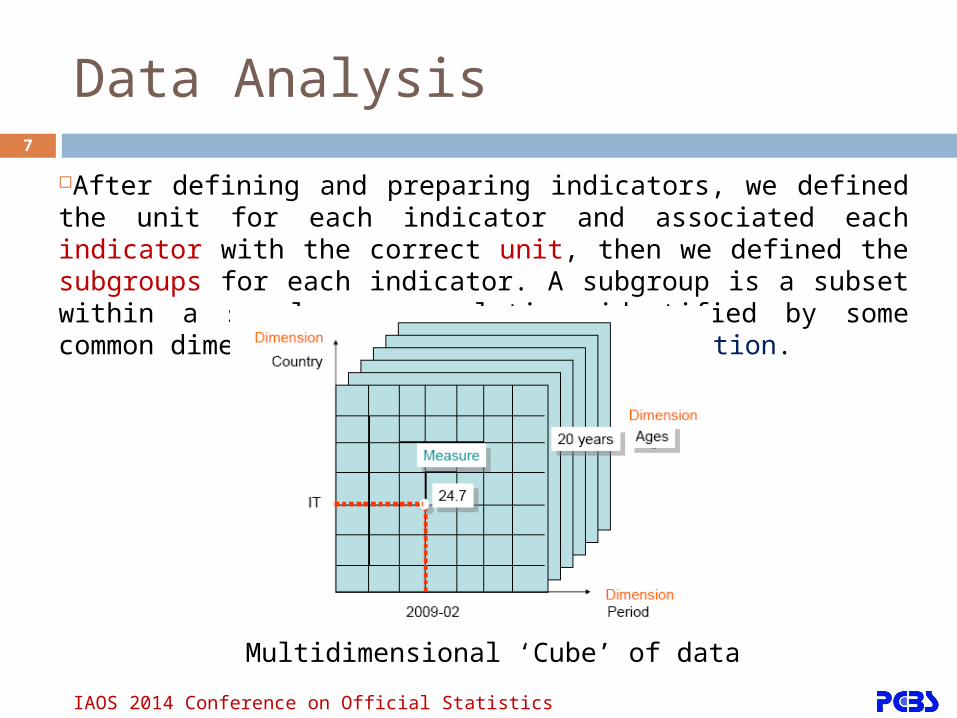
After defining and preparing indicators, we defined the unit for each indicator and associated each indicator with the correct unit, then we defined the subgroups for each indicator. A subgroup is a subset within a sample or population identified by some common dimension such as sex, age or location.
Data Analysis
Multidimensional ‘Cube’ of data
IAOS 2014 Conference on Official Statistics
8
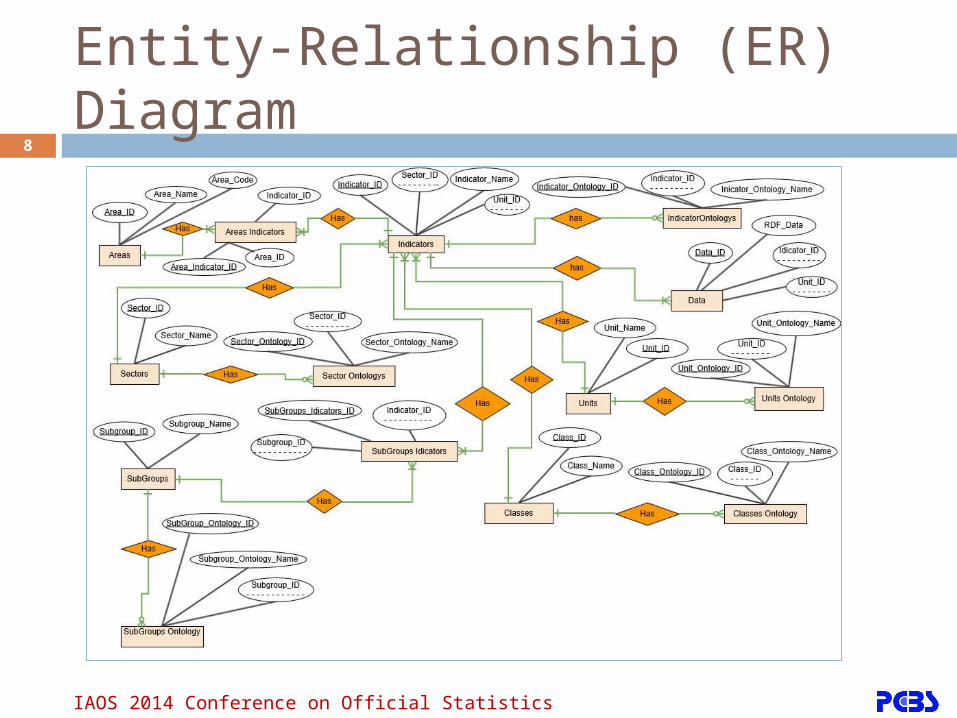
Entity-Relationship (ER) Diagram
IAOS 2014 Conference on Official Statistics

9
Data Mapping Algorithm
After building our schema, we built mapping algorithm in C# using hamming distance and edit (Levenshtein) distance, and by adding ontology, edit distance can be considered a generalization of the Hamming distance, which is used for strings of the same length and only considers substitution edits
IAOS 2014 Conference on Official Statistics
10
String Comparator Metrics
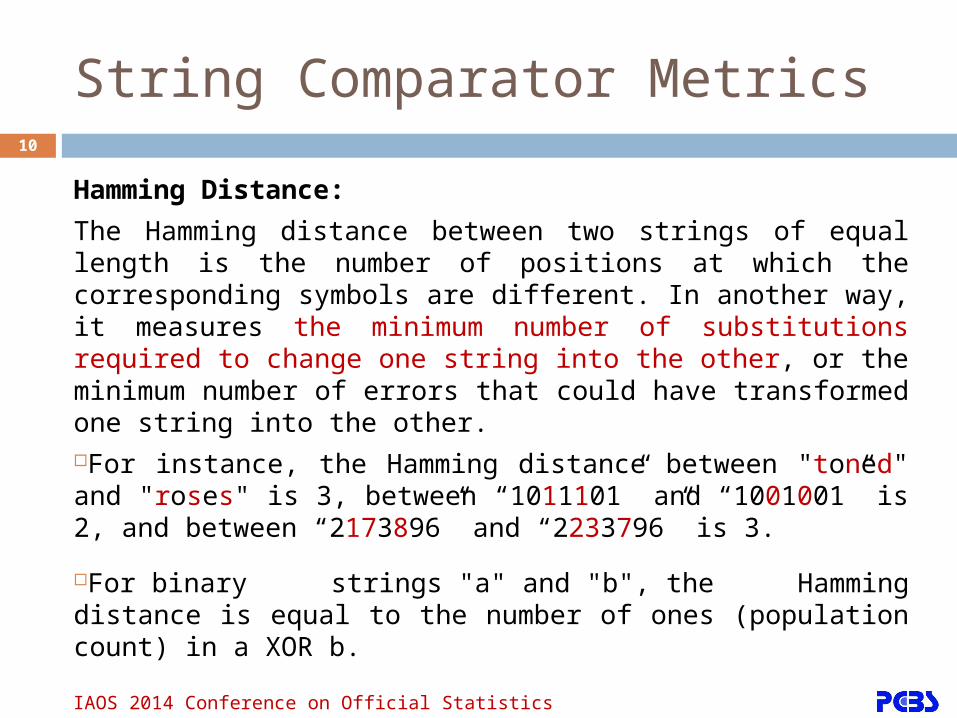
Hamming Distance:
The Hamming distance between two strings of equal length is the number of positions at which the corresponding symbols are different. In another way, it measures the minimum number of substitutions required to change one string into the other, or the minimum number of errors that could have transformed one string into the other.For instance, the Hamming distance between "toned" and "roses" is 3, between “1011101” and “1001001” is 2, and between “2173896” and “2233796” is 3.
For binary strings "a" and "b", the Hamming distance is equal to the number of ones (population count) in a XOR b.
IAOS 2014 Conference on Official Statistics
11
String Comparator Metrics
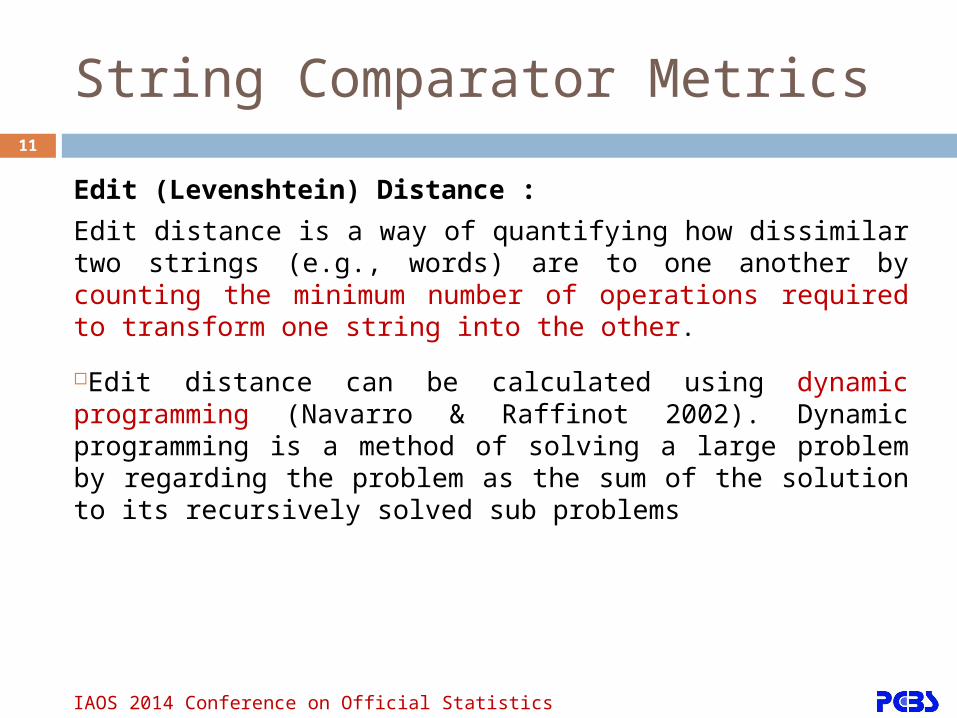
Edit (Levenshtein) Distance :
Edit distance is a way of quantifying how dissimilar two strings (e.g., words) are to one another by counting the minimum number of operations required to transform one string into the other.
Edit distance can be calculated using dynamic programming (Navarro & Raffinot 2002). Dynamic programming is a method of solving a large problem by regarding the problem as the sum of the solution to its recursively solved sub problems
IAOS 2014 Conference on Official Statistics
12
String Comparator Metrics
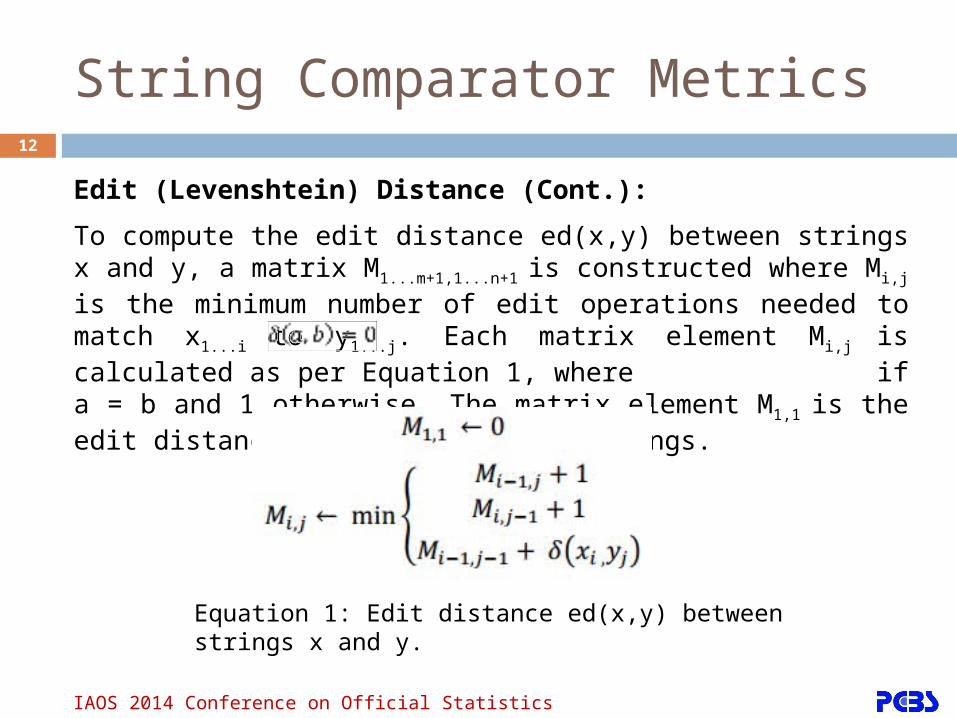
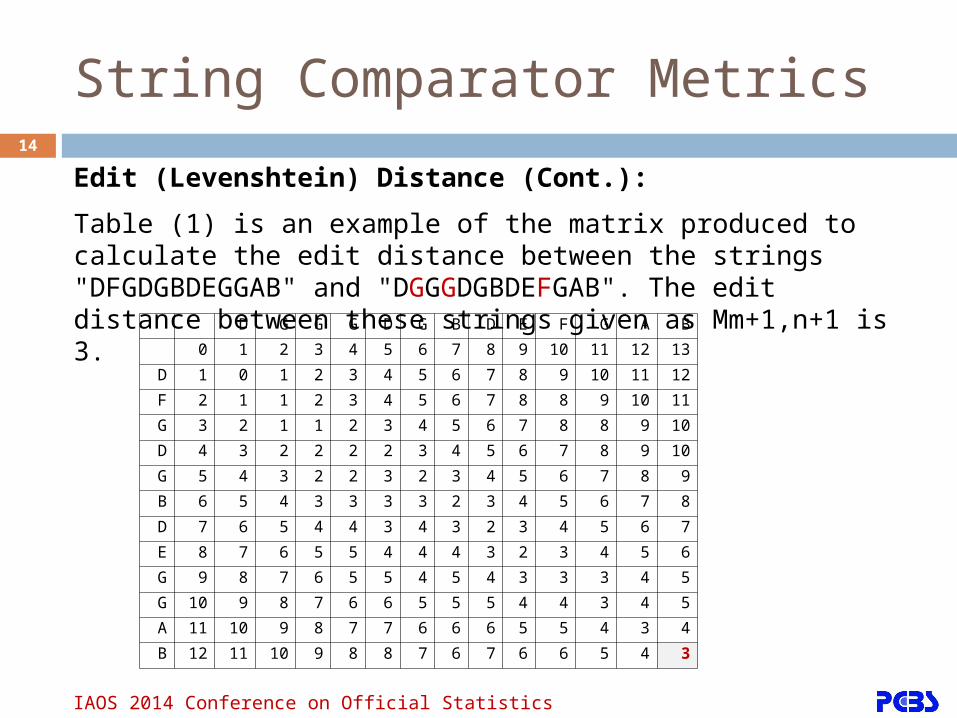
Edit (Levenshtein) Distance (Cont.):
To compute the edit distance ed(x,y) between strings x and y, a matrix M1...m+1,1...n+1 is constructed where Mi,j is the minimum number of edit operations needed to match x1...i to y1...j. Each matrix element Mi,j is calculated as per Equation 1, where if a = b and 1 otherwise. The matrix element M1,1 is the edit distance between two empty strings.
Equation 1: Edit distance ed(x,y) between strings x and y.
IAOS 2014 Conference on Official Statistics
13
String Comparator Metrics
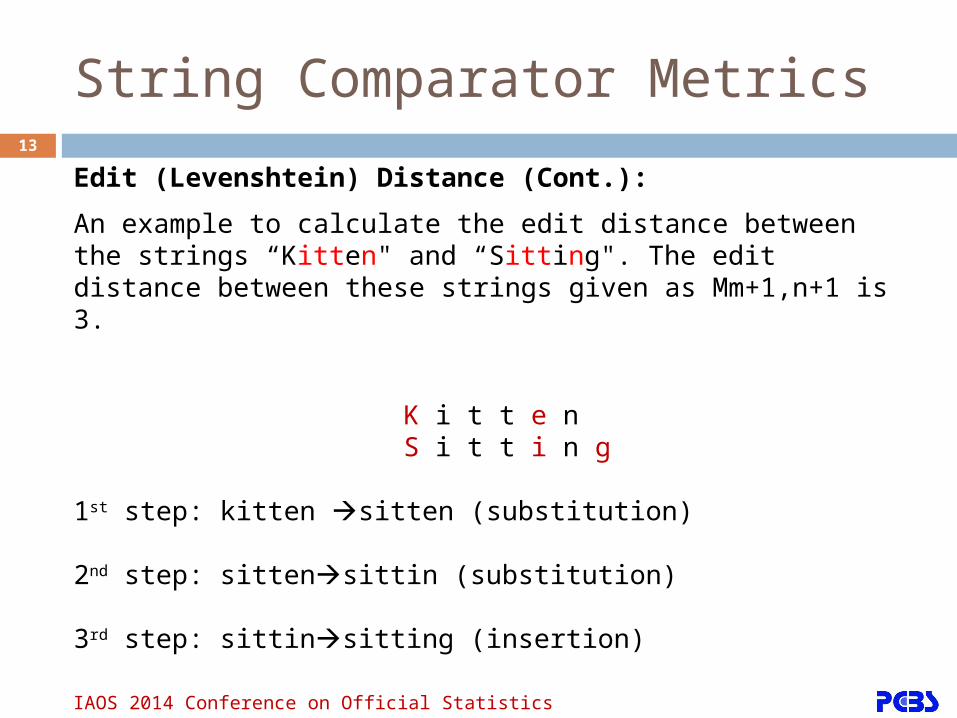
Edit (Levenshtein) Distance (Cont.):
An example to calculate the edit distance between the strings “Kitten" and “Sitting". The edit distance between these strings given as Mm+1,n+1 is 3.
K i t t e n S i t t i n g
1st step: kitten sitten (substitution)
2nd step: sittensittin (substitution)
3rd step: sittinsitting (insertion)
IAOS 2014 Conference on Official Statistics
14
String Comparator Metrics
Edit (Levenshtein) Distance (Cont.):
Table (1) is an example of the matrix produced to calculate the edit distance between the strings "DFGDGBDEGGAB" and "DGGGDGBDEFGAB". The edit distance between these strings given as Mm+1,n+1 is 3.D G G G D G B D E F G A B
0 1 2 3 4 5 6 7 8 9 10 11 12 13
D 1 0 1 2 3 4 5 6 7 8 9 10 11 12
F 2 1 1 2 3 4 5 6 7 8 8 9 10 11
G 3 2 1 1 2 3 4 5 6 7 8 8 9 10
D 4 3 2 2 2 2 3 4 5 6 7 8 9 10
G 5 4 3 2 2 3 2 3 4 5 6 7 8 9
B 6 5 4 3 3 3 3 2 3 4 5 6 7 8
D 7 6 5 4 4 3 4 3 2 3 4 5 6 7
E 8 7 6 5 5 4 4 4 3 2 3 4 5 6
G 9 8 7 6 5 5 4 5 4 3 3 3 4 5
G 10 9 8 7 6 6 5 5 5 4 4 3 4 5
A 11 10 9 8 7 7 6 6 6 5 5 4 3 4
B 12 11 10 9 8 8 7 6 7 6 6 5 4 3
IAOS 2014 Conference on Official Statistics
15
An ontology typically provides a vocabulary that describes a domain of interest and a specification of the meaning of terms used in the vocabulary
Ontology matching is a solution to the semantic heterogeneity problem.
It finds correspondences between semantically related entities of ontologies. These correspondences can be used for various tasks, such as ontology merging, query answering, or data translation.
Ontology
IAOS 2014 Conference on Official Statistics
16
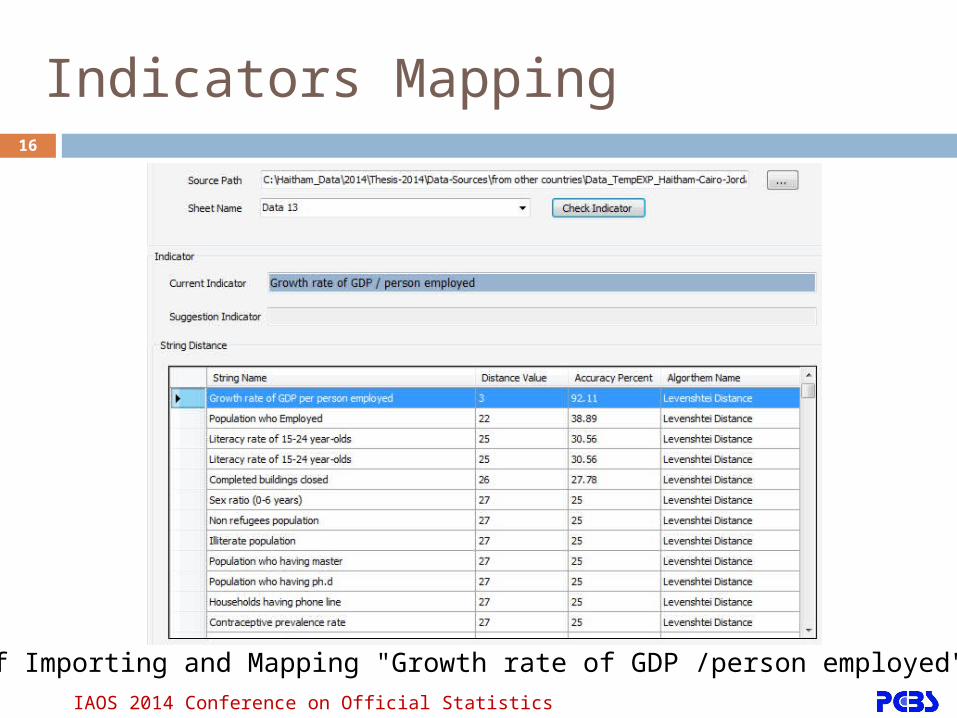
Indicators Mapping
Example of Importing and Mapping "Growth rate of GDP /person employed" Indicator.IAOS 2014 Conference on Official Statistics
17
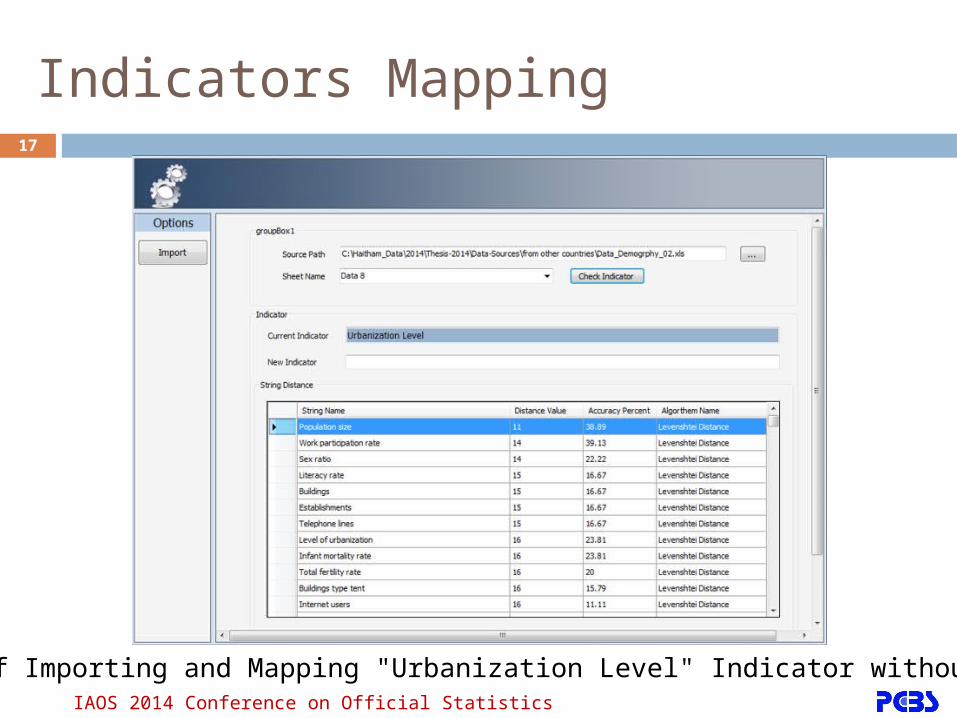
Indicators Mapping
Example of Importing and Mapping "Urbanization Level" Indicator without Ontology.IAOS 2014 Conference on Official Statistics
18
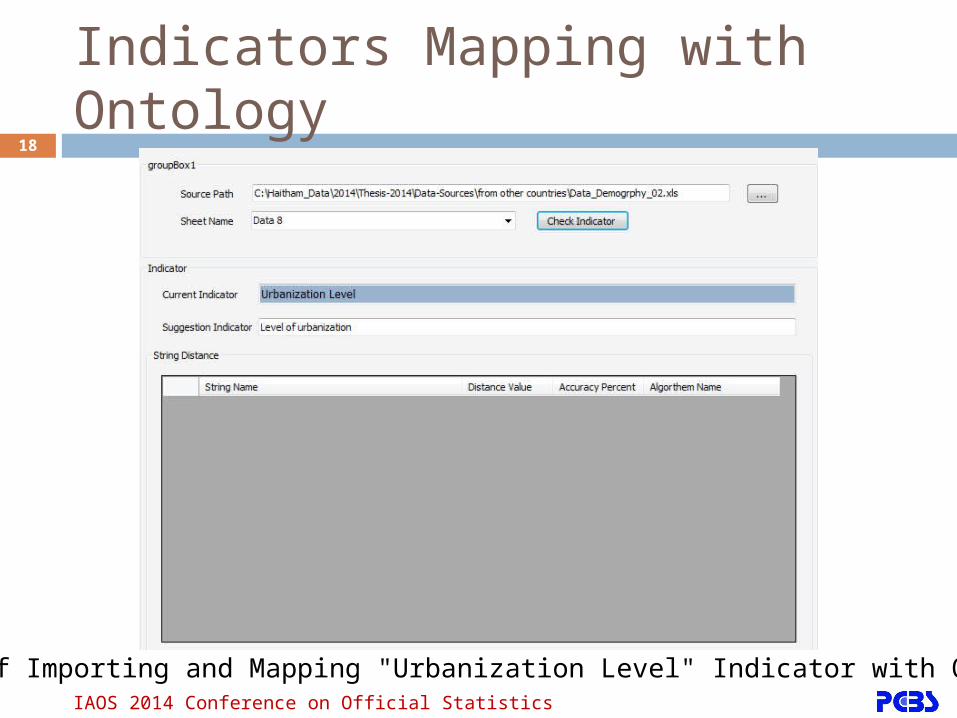
Indicators Mapping with Ontology
Example of Importing and Mapping "Urbanization Level" Indicator with Ontology.
IAOS 2014 Conference on Official Statistics
19
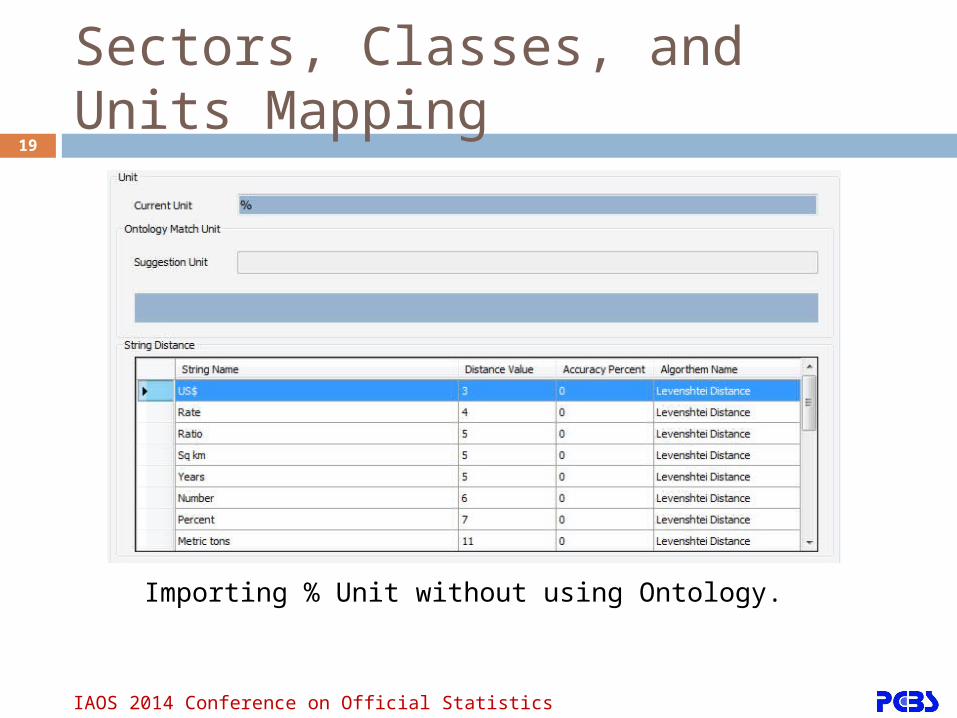
Sectors, Classes, and Units Mapping
Importing % Unit without using Ontology.
IAOS 2014 Conference on Official Statistics
20
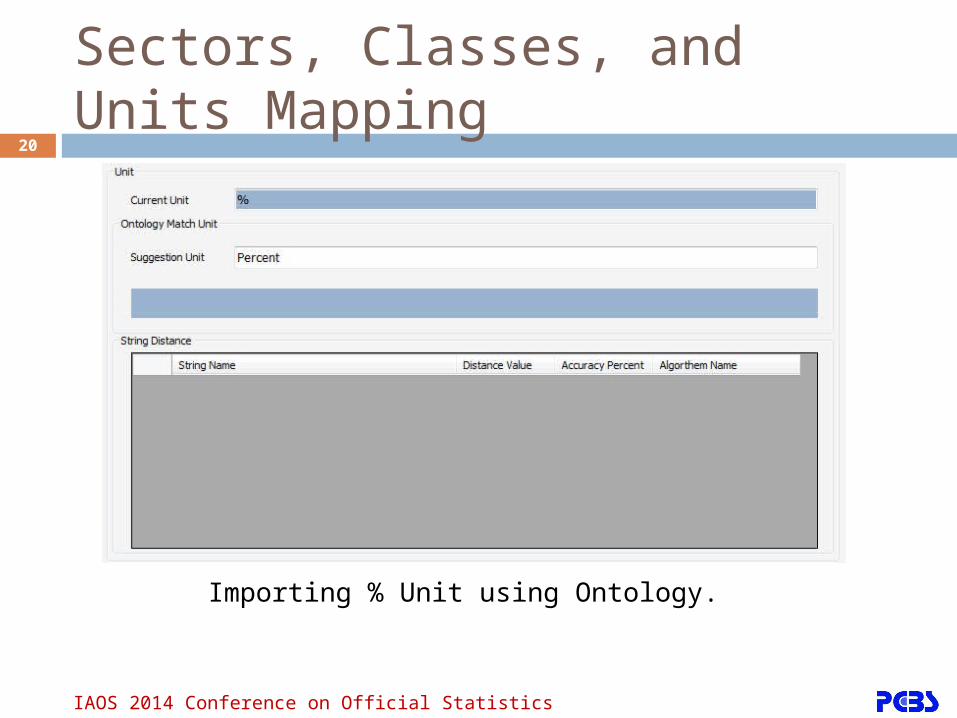
Sectors, Classes, and Units Mapping
Importing % Unit using Ontology.
IAOS 2014 Conference on Official Statistics
21
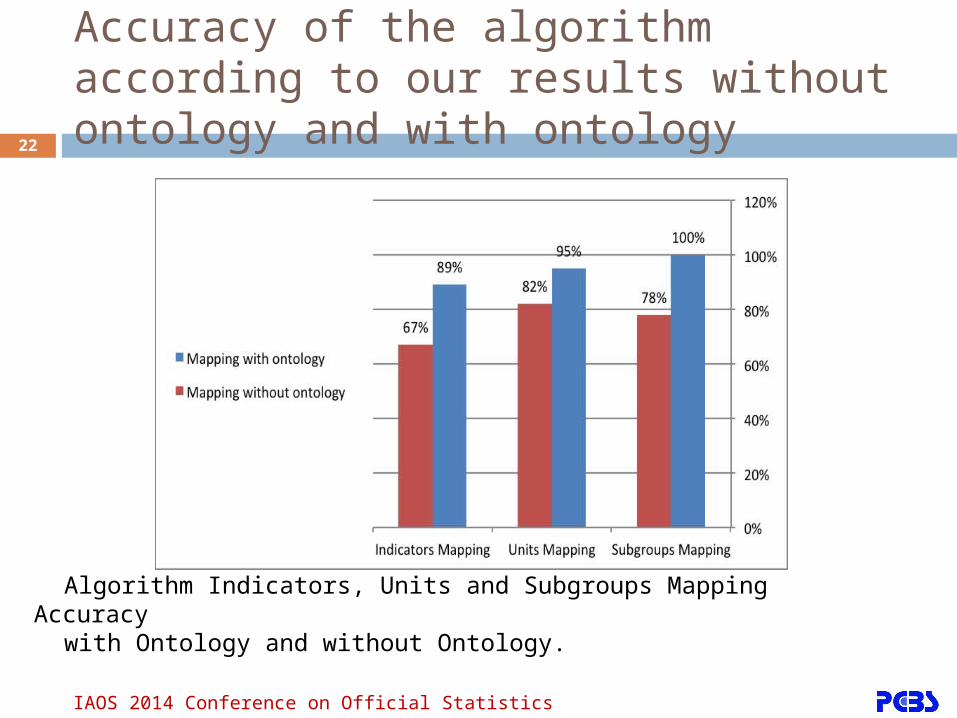
Experimental Results
To test and evaluate the accuracy of the mapping algorithm in practice, we performed some experiments on many indicators, the indicators chosen from different countries since each country indicators different from others in the name of the indicators, units and subgroups, this will help us to test the algorithm accuracy.
IAOS 2014 Conference on Official Statistics
22
Accuracy of the algorithm according to our results without ontology and with ontology
Algorithm Indicators, Units and Subgroups Mapping Accuracy
with Ontology and without Ontology.
IAOS 2014 Conference on Official Statistics
23
The visualization in our system were implemented based on the Microsoft platform and .NET Framework using the software development tools of Microsoft visual studio, including .NET and ASP.NET., High charts Java Script libraries.
Searching, comparing, re-visualizing, sorting, and filtering interaction techniques were implemented for visualizations in our application, The purpose of our system to store data and indicators, for organizing, storing and presenting data in a uniform way, and present information in the form of tables, graphs and maps, and to facilitate data sharing. the application supports several tasks to do visualization.
System Design
IAOS 2014 Conference on Official Statistics
24
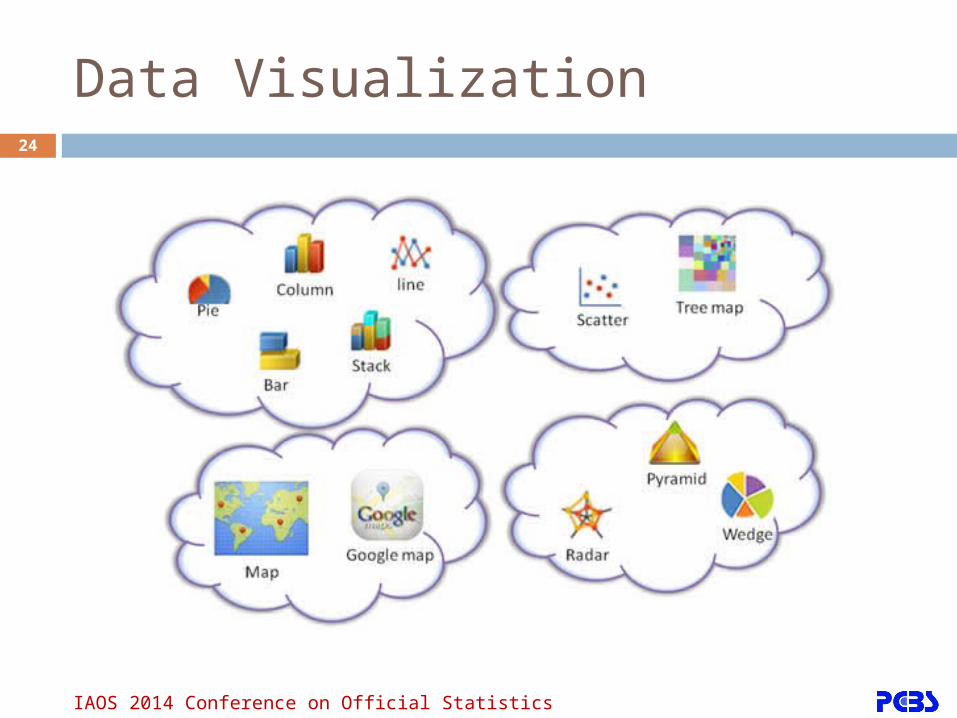
Data Visualization
IAOS 2014 Conference on Official Statistics
25
We make interviews to analyze the user requirements. Each type of users has their own concerns and expectations from the system. In order to identify user needs, interview with expert users have been done.
This step is done by making interview to get requirements before implementation phase of our system visualization from the end users, We collected feedbacks from interview with 13 participants. Participants were selected to be representative of the intended user community, including Statisticians, researchers, decision makers so that they could specify user requirements related to visualization, design appropriate functionalities, and develop a visualization system for statistical data.
Interview with expert users to specify users requirements
IAOS 2014 Conference on Official Statistics
26
A structured interview with pre-defined questions performed. 12 participants were asked to use the visualization techniques of the system to perform a number of preselected tasks that are related to participants work context. Participants were asked to think aloud while carrying out the tasks.
All questions were carefully selected in order to make conclusions about effectiveness, efficiency of the system, and the level of the user satisfaction
Interview with end users to evaluate the visualization and interaction techniques in the system
IAOS 2014 Conference on Official Statistics
27
This research aimed to introduce a new mapping algorithm and visualization system for matching statistical indicators based on common schema, heterogeneous data from different data sources integrated using the created algorithm before visual methods applied.We suggested new mapping algorithm based on hamming distance, edit distance and ontology, using our algorithm we enhanced integration and mapping of statistical data indicators from different sources.The system was successfully evaluated by different users and experts, statisticians, researchers, decision makers. The evaluation results have shown high levels for effectiveness, efficiency, and for the user satisfaction of the system.
Conclusion and Future Work
IAOS 2014 Conference on Official Statistics

28
Future work includes: To focus more on data mapping using ontology. Extending our mapping algorithm to handle more sophisticated mappings between ontologies (i.e., non 1-1 mappings).Also to focus more on collecting data from different sources since we focused as a case study on importing data from different excel sources (files),Future work includes also improving collaboration with visualization systemAdditional methods are required to support the users in finding good views on the data and in determining appropriate visualization techniques.We have to consider the 3D visualization of uncertain graph structures with uncertain attributes, which we think is a formidable challenge.
Conclusion and Future Work
IAOS 2014 Conference on Official Statistics
29
IAOS 2014 Conference on Official Statistics
ThanksMapping Techniques and Visualization of Statistical Indicators
Haitham Zeidan
Palestinian Central Bureau of Statistics