Embed Size (px)
Citation preview
TR
AN
SA
CT
ION
S O
N S
CIE
NC
E A
ND
TE
CH
NO
LO
GY
Transactions on Science and Technology Vol. 4, No. 4, 482 - 488, 2017
Anuar et al., 2017. Transactions on Science and Technology. 4(4), 482 - 488
Mapping Vegetation Cover of Acacia mangium Plantation by Age
Aqilah Nabihah Anuar1#, Ismail Jusoh1, Affendi Suhaili2, Mohamad Bodrul Munir1
1 Faculty of Resource Science and Technology, Universiti Malaysia Sarawak (UNIMAS), 94300 Kota Samarahan, Malaysia. 2 Forest Operation Branch, Forest Department Sarawak, Wisma Sumber Alam, Petra Jaya, 93660 Kuching, Sarawak, Malaysia.
# Corresponding author. E-Mail: [email protected] ; Tel: +60-124615093
ABSTRACT This paper aims to provide a method in mapping the vegetation cover of Acacia mangium plantation using the advanced survey technology of satellite remote sensing. This method would serve as an alternative to the conventional field sampling which is laborious and time consuming. Satellite images obtained from Landsat 8, provide the current view on vegetation cover of the whole plantation area. Two areas were targeted for the study which was area with A. mangium stands aged below 5 years old and another aged above 5 years old. Image analyses performed on Landsat 8 satellite image showed that vegetation coverage in area over 5 years old stands were significantly denser compared to within 5 years old stands. Low solar radiation (reflectance) was detected on area with high vegetation cover while higher radiation was detected on lesser vegetation cover. Overall findings of the study shows that the older A. mangium stand age greatly decreased the transmittance and reflectance of solar radiation in the visible light spectrum due to the increase in biomass. Hence, biomass played a key factor in distinguishing the vegetation covers between the two age classes (below 5 years old and above 5 years old). KEYWORDS: Vegetation cover; age; Acacia mangium; image processing; Landsat 8
Full Article - Environmental engineering Received 8 August 2017 Revised 12 September 2017 Accepted 8 October 2017 Online 28 December 2017 © Transactions on Science and Technology 2017
INTRODUCTION
Acacia mangium is a tropical lowland tree which had been introduced as one of the commercial
timber species used in making fiberboard, pulp and paper mills. The tree has superior ability to
colonize in many kind of sites such as degraded and non-degraded forest area. Therefore, Sarawak
Forest Department had planted 69% with acacia trees in 335,049 hectare of forest land for
reforestation up till 2014 (Wong et al., 2014). Based on previous studies from Thailand, China,
Indonesia and Malaysia, reforestation and afforestation were conducted by planting exotic and
native quick growing timber species in order to mitigate exploitation on naturally existed forest
resources (Suratman, 2003; Iglesias, 2007; Liu, et al, 2014). The new forest area can be assessed by
conventional method using forest stand parameters such as wood volume, biomass and basal area.
However conventional method for assessing the said parameters is difficult and time consuming
when covering a large forest area. The advance tool of remote sensing is likely to be an alternative
for conventional method, because remote sensing acquired information about an object without
direct contact with the object itself. Satellite remote sensing uses multi-spectral bands that provide a
summarized view on the whole planted area at an acceptance level of accuracy and cost-efficient
(Lehmann et al., 2017). Landsat satellites such as Landsat 4 Thematic Mapper (TM), Landsat 5 Multi
Spectral Scanner (MSS), Landsat 7 Enhance Thematic Mapper Plus (ETM+) and Landsat 8 Operator
Land Imager (OLI) have long been used in determining forest biomass and wood volume ever since
1989 (Sader et al., 1989; Lu et al., 2004; Gunlu et al., 2014 ). This study objective was to utilize satellite
images from Landsat 8 OLI to map the vegetation cover of Acacia mangium plantation in Bintulu,
Sarawak by age.
TR
AN
SA
CT
ION
S O
N S
CIE
NC
E A
ND
TE
CH
NO
LO
GY
Anuar et al., 2017. Transactions on Science and Technology. 4(4), 482 - 488 483
ISSN 2289-8786. http://transectscience.org/
METHODOLOGY
Study area
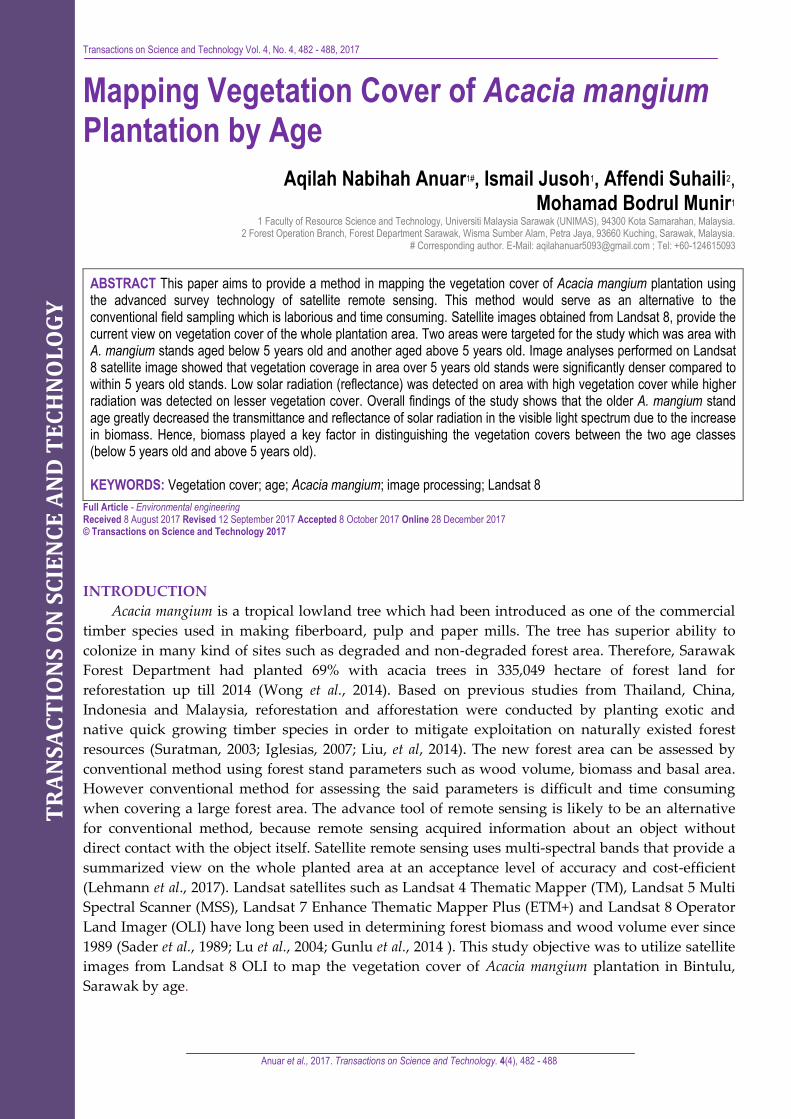
The study area was a reforested area, replanted with Acacia mangium trees located in Bintulu,
Sarawak, Malaysia (Figure 1). The plantation is owned by Daiken Sarawak Sdn. Bhd. Tree ages were
divided into two classes of below 5 years and over 5 years old.
Figure 1. Study site located in Bintulu, Sarawak, Malaysia
Image analysis
Landsat 8 data set, LC81190582016145LGN00 dated 6th June, 2016 was downloaded from United
States Geological Survey (USGS) database. Data set was chosen based on the duration of field
verification took place from March until September 2016, with the least cloud cover (below 20%).
Quantum GIS version 2.8.2 software was used to analyse the image data. The vegetation cover was
measured from the satellite image using object-based image analysis method (Blaschke, 2010).
Congedo (2016) colour composition method was used to improve interpretation of the vegetation
pixel. Similar pixels that represent bare soil and vegetation were grouped together through image
segmentation (Blaschke, 2010). The two classes of bare soil were road and harvested area while three
classes of vegetation were high, moderate and low vegetation cover. The division between the
vegetation classes were made based on field verifications, high vegetation cover area was
represented by the dominant acacias’ canopy cover, with an average of 141 tonnes/ha of
aboveground biomass, moderate vegetation cover class referred to young developing A. mangium
vegetation canopy, while low vegetation cover referred to riparian buffer area and other vegetation
aside from A. mangium within the plantation area. Subsequently, spectral angle mapping
classification algorithm was performed on the classified classes, and accuracy assessment was done
on these classes using Kappa index.
Digital Elevation Model (DEM) and contour mapping were generated using the data stored in
Google Earth Pro (Lehmann et al., 2017). Generation of DEM was made using SAGA (2.1.2) tool,
through natural neighbour interpolation (Childs, 2004). Interpolation on the elevation of the study
area helps reducing external noise that was caused by distortion and provide general view on the
elevation and other spatially-based phenomena of the sampling area (Childs, 2004). Differential
TR
AN
SA
CT
ION
S O
N S
CIE
NC
E A
ND
TE
CH
NO
LO
GY
Anuar et al., 2017. Transactions on Science and Technology. 4(4), 482 - 488 484
ISSN 2289-8786. http://transectscience.org/
comparison study between acacias aged below 5 years old and above 5 years old was conducted
after image analysis to illustrate the different between the studied age classes.
RESULTS AND DISCUSSION
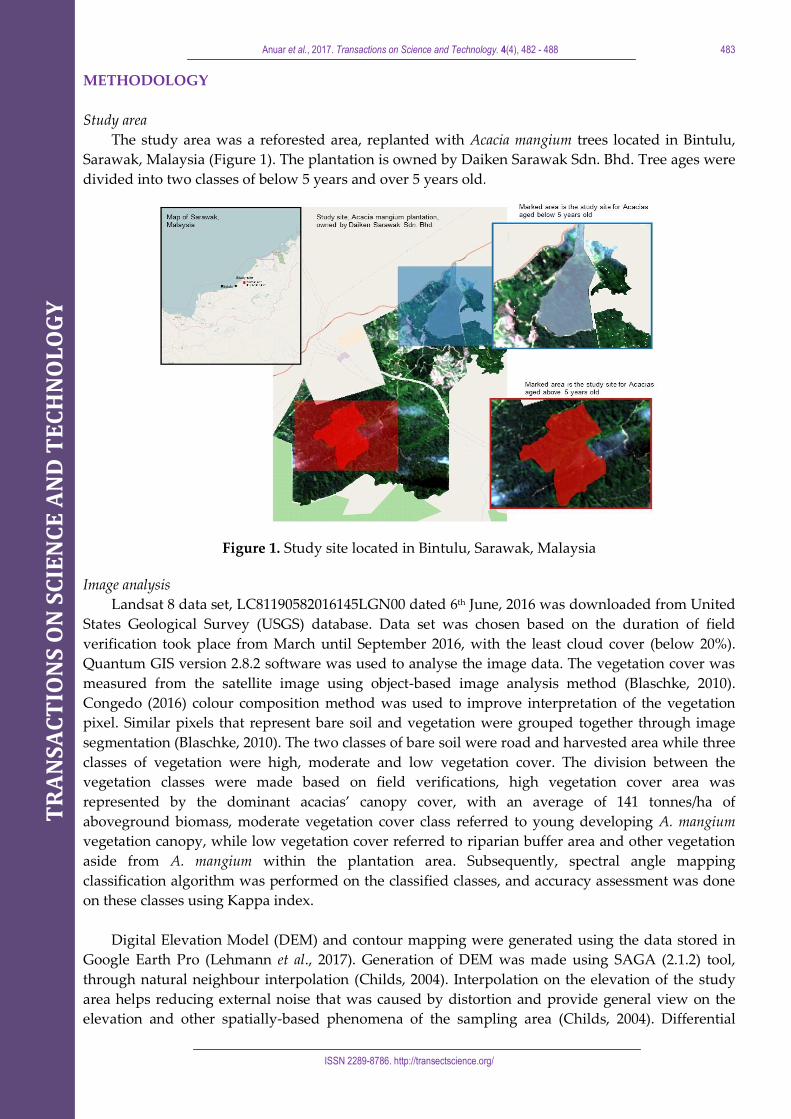
Figure 2 showed area of planting with acacias aged below 5 years, while Figure 3 showed the
area with acacias aged above 5 years old. Vegetation coverage was higher in the area with acacias
aged above 5 years old (Figure 3). Colour composite using true-colour and false-colour combinations
displayed the general principal of remote sensing when visible light interacted with vegetation.
Higher density of vegetation cover reflected less solar radiation, in which causing the darker area in
the images, mostly due to the presence of chlorophyll in leaf pigment (Gausman, et al., 1969). Leaves
of a tree, including the branches and stem are all part of a tree’s biomass. Through aging, acacias
increased in term of their heights and diameter at breast height (DBH). Heriansyah, et al. (2007)
reported that leaves biomass of A. mangium remained relatively unchanged when they reached
maturity stage, thus, leaving the stem and branches biomass to differentiate between the two age
classes. Meanwhile, bare soils reflected more solar radiation compared to vegetation (Basso, et al.,
2004). The brighter area in Figure 2 shows there were numerous areas represented bare soil and low
vegetation cover in the plantation area of acacias aged below 5 years old.
Figure 2 Colour composite image on acacias aged below 5 years old; (a) True-colour; (b) False-colour
Figure 3 Colour composite image on acacias aged above 5 years old; (a) True-colour; (b) False-colour
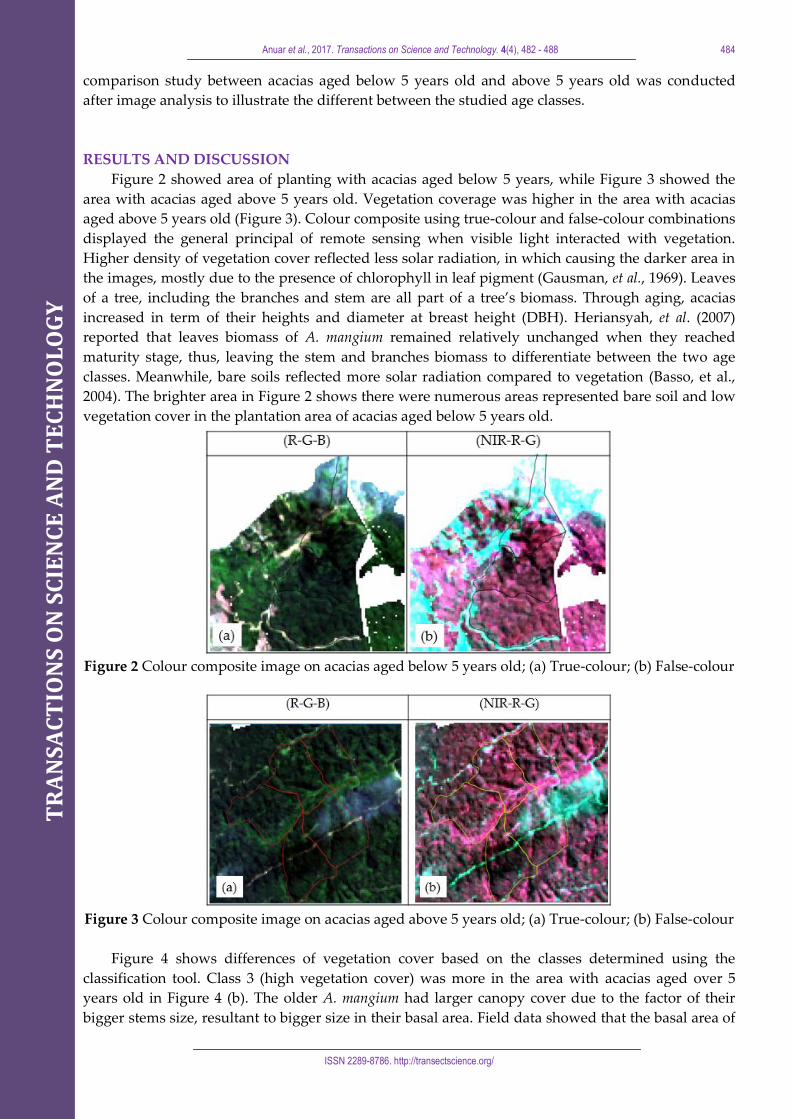
Figure 4 shows differences of vegetation cover based on the classes determined using the
classification tool. Class 3 (high vegetation cover) was more in the area with acacias aged over 5
years old in Figure 4 (b). The older A. mangium had larger canopy cover due to the factor of their
bigger stems size, resultant to bigger size in their basal area. Field data showed that the basal area of
TR
AN
SA
CT
ION
S O
N S
CIE
NC
E A
ND
TE
CH
NO
LO
GY
Anuar et al., 2017. Transactions on Science and Technology. 4(4), 482 - 488 485
ISSN 2289-8786. http://transectscience.org/
the acacia trees of over 5 years old were within 11 - 35 m² per hectare, and averaged at 21 m² per
hectare. Hence, spectral response can easily discriminated vegetation cover from low vegetation area
and bare soils. Accuracy assessment on the classification between the classes was 82.72 % and Kappa
analysis revealed an index of 0.73, which can be considered as acceptable according to Jenness &
Wynne (2007).
Figure 4. Classification map of the study area a) Acacias aged below 5 years old, b) Acacias aged
above 5 years old
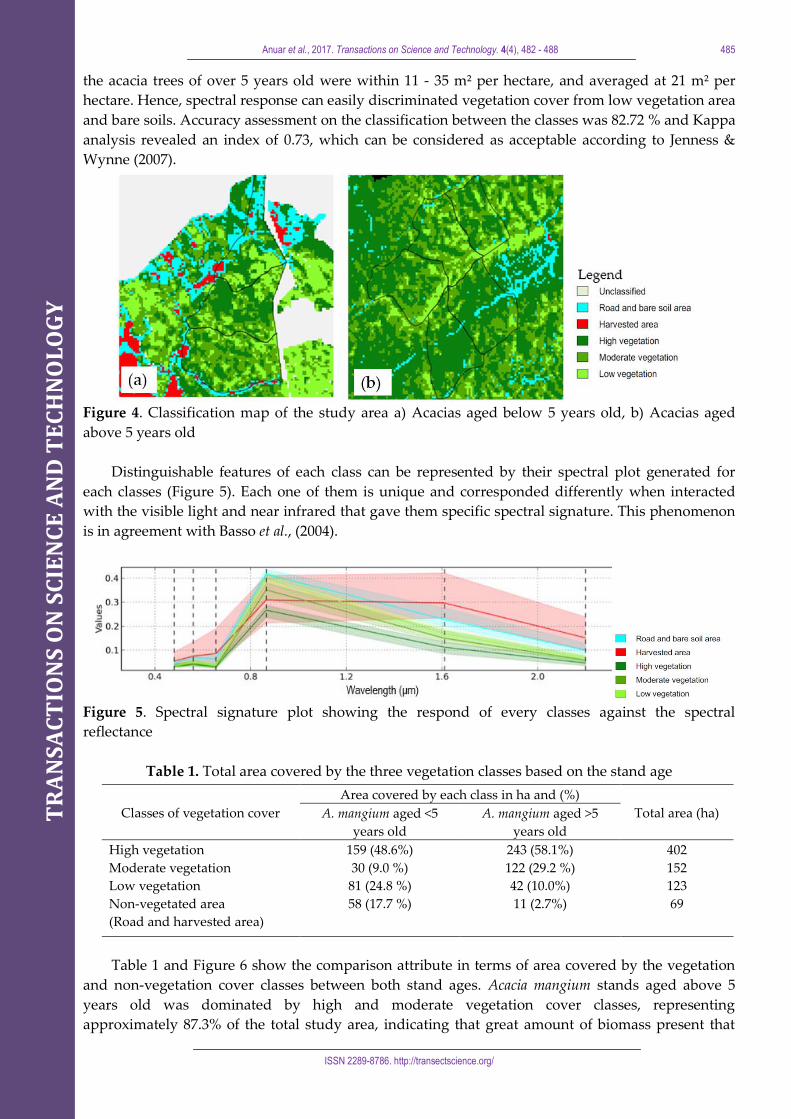
Distinguishable features of each class can be represented by their spectral plot generated for
each classes (Figure 5). Each one of them is unique and corresponded differently when interacted
with the visible light and near infrared that gave them specific spectral signature. This phenomenon
is in agreement with Basso et al., (2004).
Figure 5. Spectral signature plot showing the respond of every classes against the spectral
reflectance
Table 1. Total area covered by the three vegetation classes based on the stand age
Classes of vegetation cover
Area covered by each class in ha and (%)
Total area (ha) A. mangium aged <5
years old
A. mangium aged >5
years old
High vegetation 159 (48.6%) 243 (58.1%) 402
Moderate vegetation 30 (9.0 %) 122 (29.2 %) 152
Low vegetation 81 (24.8 %) 42 (10.0%) 123
Non-vegetated area
(Road and harvested area)
58 (17.7 %) 11 (2.7%) 69
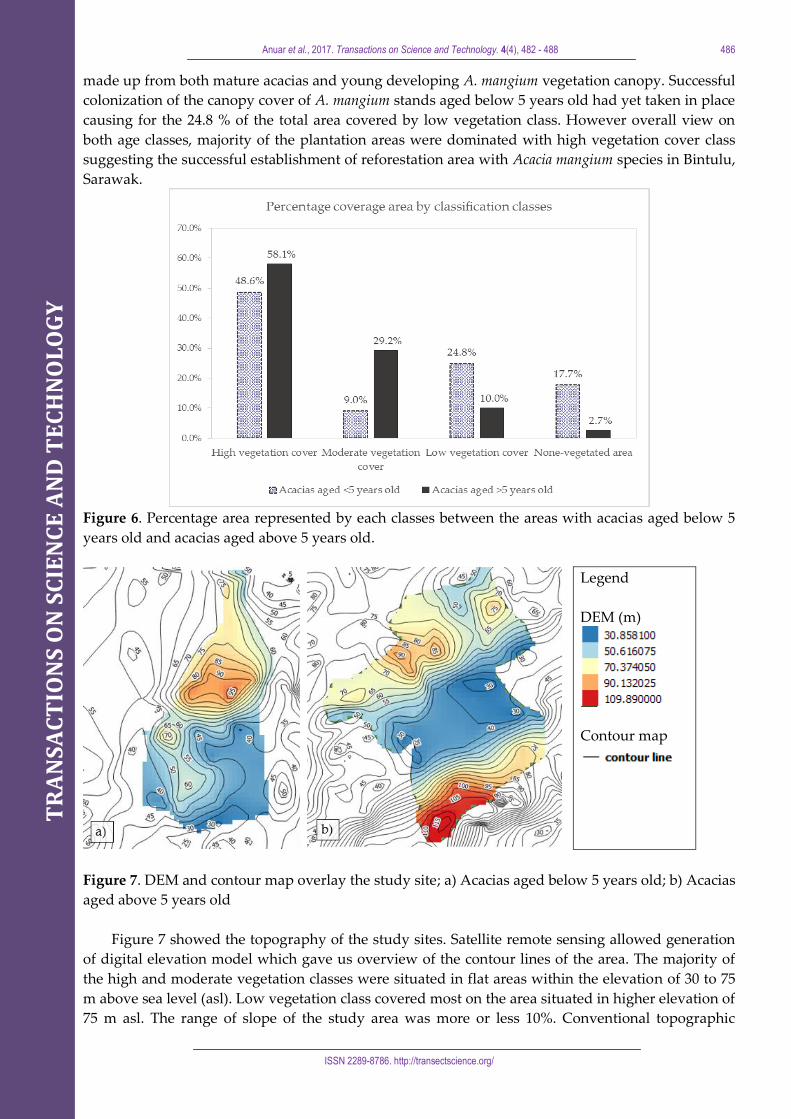
Table 1 and Figure 6 show the comparison attribute in terms of area covered by the vegetation
and non-vegetation cover classes between both stand ages. Acacia mangium stands aged above 5
years old was dominated by high and moderate vegetation cover classes, representing
approximately 87.3% of the total study area, indicating that great amount of biomass present that
TR
AN
SA
CT
ION
S O
N S
CIE
NC
E A
ND
TE
CH
NO
LO
GY
Anuar et al., 2017. Transactions on Science and Technology. 4(4), 482 - 488 486
ISSN 2289-8786. http://transectscience.org/
made up from both mature acacias and young developing A. mangium vegetation canopy. Successful
colonization of the canopy cover of A. mangium stands aged below 5 years old had yet taken in place
causing for the 24.8 % of the total area covered by low vegetation class. However overall view on
both age classes, majority of the plantation areas were dominated with high vegetation cover class
suggesting the successful establishment of reforestation area with Acacia mangium species in Bintulu,
Sarawak.
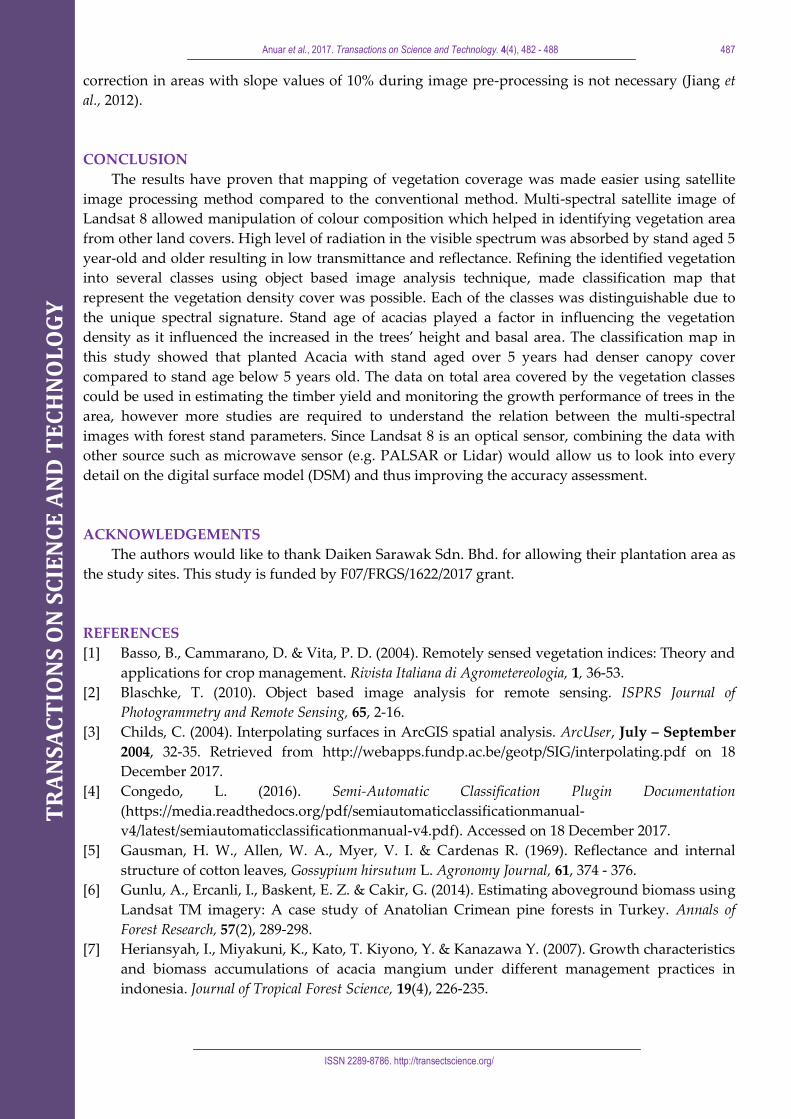
Figure 6. Percentage area represented by each classes between the areas with acacias aged below 5
years old and acacias aged above 5 years old.
Legend
DEM (m)
Contour map
Figure 7. DEM and contour map overlay the study site; a) Acacias aged below 5 years old; b) Acacias
aged above 5 years old
Figure 7 showed the topography of the study sites. Satellite remote sensing allowed generation
of digital elevation model which gave us overview of the contour lines of the area. The majority of
the high and moderate vegetation classes were situated in flat areas within the elevation of 30 to 75
m above sea level (asl). Low vegetation class covered most on the area situated in higher elevation of
75 m asl. The range of slope of the study area was more or less 10%. Conventional topographic
TR
AN
SA
CT
ION
S O
N S
CIE
NC
E A
ND
TE
CH
NO
LO
GY
Anuar et al., 2017. Transactions on Science and Technology. 4(4), 482 - 488 487
ISSN 2289-8786. http://transectscience.org/
correction in areas with slope values of 10% during image pre-processing is not necessary (Jiang et
al., 2012).
CONCLUSION
The results have proven that mapping of vegetation coverage was made easier using satellite
image processing method compared to the conventional method. Multi-spectral satellite image of
Landsat 8 allowed manipulation of colour composition which helped in identifying vegetation area
from other land covers. High level of radiation in the visible spectrum was absorbed by stand aged 5
year-old and older resulting in low transmittance and reflectance. Refining the identified vegetation
into several classes using object based image analysis technique, made classification map that
represent the vegetation density cover was possible. Each of the classes was distinguishable due to
the unique spectral signature. Stand age of acacias played a factor in influencing the vegetation
density as it influenced the increased in the trees’ height and basal area. The classification map in
this study showed that planted Acacia with stand aged over 5 years had denser canopy cover
compared to stand age below 5 years old. The data on total area covered by the vegetation classes
could be used in estimating the timber yield and monitoring the growth performance of trees in the
area, however more studies are required to understand the relation between the multi-spectral
images with forest stand parameters. Since Landsat 8 is an optical sensor, combining the data with
other source such as microwave sensor (e.g. PALSAR or Lidar) would allow us to look into every
detail on the digital surface model (DSM) and thus improving the accuracy assessment.
ACKNOWLEDGEMENTS
The authors would like to thank Daiken Sarawak Sdn. Bhd. for allowing their plantation area as
the study sites. This study is funded by F07/FRGS/1622/2017 grant.
REFERENCES
[1] Basso, B., Cammarano, D. & Vita, P. D. (2004). Remotely sensed vegetation indices: Theory and
applications for crop management. Rivista Italiana di Agrometereologia, 1, 36-53.
[2] Blaschke, T. (2010). Object based image analysis for remote sensing. ISPRS Journal of
Photogrammetry and Remote Sensing, 65, 2-16.
[3] Childs, C. (2004). Interpolating surfaces in ArcGIS spatial analysis. ArcUser, July – September
2004, 32-35. Retrieved from http://webapps.fundp.ac.be/geotp/SIG/interpolating.pdf on 18
December 2017.
[4] Congedo, L. (2016). Semi-Automatic Classification Plugin Documentation
(https://media.readthedocs.org/pdf/semiautomaticclassificationmanual-
v4/latest/semiautomaticclassificationmanual-v4.pdf). Accessed on 18 December 2017.
[5] Gausman, H. W., Allen, W. A., Myer, V. I. & Cardenas R. (1969). Reflectance and internal
structure of cotton leaves, Gossypium hirsutum L. Agronomy Journal, 61, 374 - 376.
[6] Gunlu, A., Ercanli, I., Baskent, E. Z. & Cakir, G. (2014). Estimating aboveground biomass using
Landsat TM imagery: A case study of Anatolian Crimean pine forests in Turkey. Annals of
Forest Research, 57(2), 289-298.
[7] Heriansyah, I., Miyakuni, K., Kato, T. Kiyono, Y. & Kanazawa Y. (2007). Growth characteristics
and biomass accumulations of acacia mangium under different management practices in
indonesia. Journal of Tropical Forest Science, 19(4), 226-235.
TR
AN
SA
CT
ION
S O
N S
CIE
NC
E A
ND
TE
CH
NO
LO
GY
Anuar et al., 2017. Transactions on Science and Technology. 4(4), 482 - 488 488
ISSN 2289-8786. http://transectscience.org/
[8] Iglesias, C. O. (2007). Determination of carbon sequestration and storage capacity of Eucalyptus
plantation in Sra Kaew Province, Thailand using remote sensing. MSc Thesis, Mahidol University,
Thailand.
[9] Jenness, J. & Wynne, J. J. (2007). Cohen’s Kappa and classification table metrics 2.1a: An ArcView 3x
extension for accuracy assessment of spatially-explicit models
(http://www.jennessent.com/downloads/Kappa_Manual_Online.pdf). Accessed on 18
December 2017.
[10] Jiang, K., Zhao, Y. & Geng, X. (2012). Topographic correction of ETM images based on
smoothed terrain. Journal of Electronics (China), 29 (3-4), 271-278.
[11] Lehmann, J. R. K., Prinz, T., Ziller, S. R., Thiele, J., Heringer, G., Meira-Netto, J. A. A. &
Buttschardt, T. K. (2017). Open-source processing and analysis of aerial imagery acquired with
a low-cost unmanned aerial system to support invasive plant management. Frontiers in
Environmental Science, 5, Article 44.
[12] Liu, L., Peng, D. & Wang, Z. (2014). Improving artificial forest biomass estimates using
afforestation age information from time series Landsat stacks. Environmental Monitoring
Assessment, 186, 7293-7306.
[13] Lu, D., Mausel, P., Brondizio, E., & Maron, E. (2004). Relationship between forest stand
parameters and Landsat TM spectral responses in the Brazilian Amazon Basin. Forest Ecology
and Management, 198, 147-167.
[14] Sader, S.A., Waide, R.B., Lawrence, W.T. & Joyce, A.T. (1989). Tropical forest biomass and
successional age class relationships to a vegetation index derived from Landsat TM data.
Remote Sensing of Environment, 28, 143156.
[15] Suratman, M. N. (2003). Applicability of Landsat TM Data for Inventorying and Monitoring of
Rubber (Hevea brasiliensis) Plantation in Selangor, Malaysa: Linkages to Policies. PhD Thesis. The
University of British Columbia.
[16] Wong, S. K., Ahmad, S., Bauk, R.A., Razali, B. & Bujang, A. W. (2014). The essential role of
forest plantations toward sustainability of wood production and wood-based industries in
Sarawak. 17th Malaysian Forestry Conference, Magellan Sutera Harbour Resort, 11-12 November
2014. Kota Kinabalu, Sabah Forestry Department.