Embed Size (px)
Citation preview

Maps are flat models of 3-D objects.
All flat maps distort the shapes and areas of land masses to some extent.
We will talk about 4 types of maps:Mercator ProjectionsConic ProjectionsGnomonic ProjectionsTopographic Maps

Similarities Between Maps
All maps contain:map legend explains what the symbols within a map represent
map scale the ratio between distances on a map and actual distances on the surface of Earth

Mercator Projections
A map that has parallel lines of latitude and longitude.
*when lines of longitude are projected as being parallel on a map, landmasses near the poles appear to be larger than they really are.
*but the shapes of the landmasses are shown accurately.
These maps are good for navigation of planes and
ships.
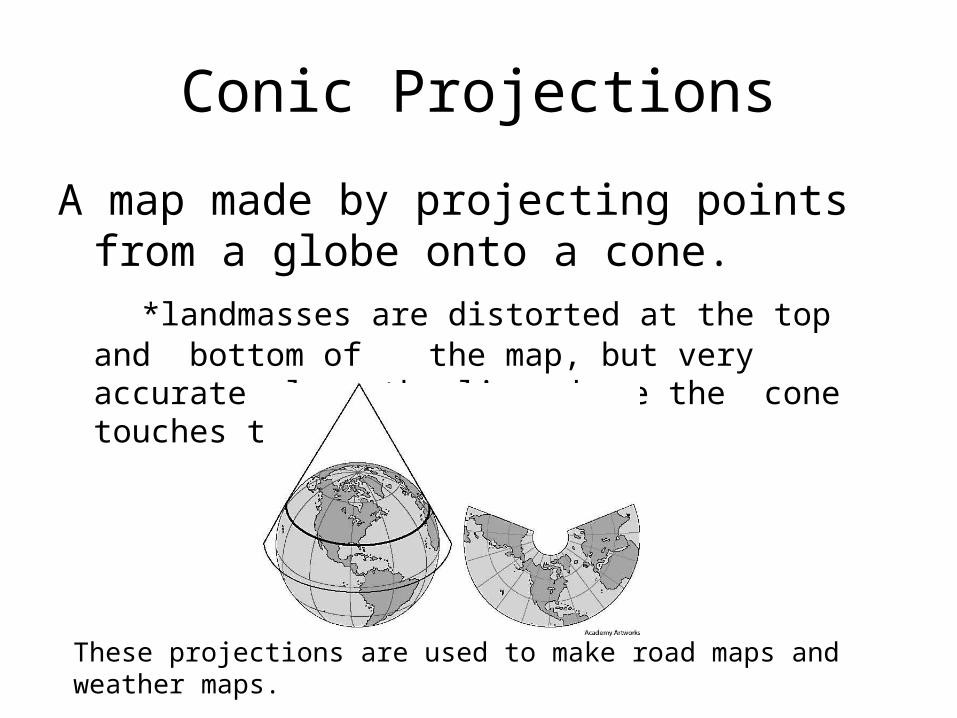
Conic Projections
A map made by projecting points from a globe onto a cone.
*landmasses are distorted at the top and bottom of the map, but very accurate along the line where the cone touches the earth
These projections are used to make road maps and weather maps.

Gnomonic Projections
A map made by projecting points and lines from a globe onto a piece of paper that touches the globe at one point.
*distort distances and direction between landmasses.
Good for plotting long distance trips by air because they show the earth’s great circles.
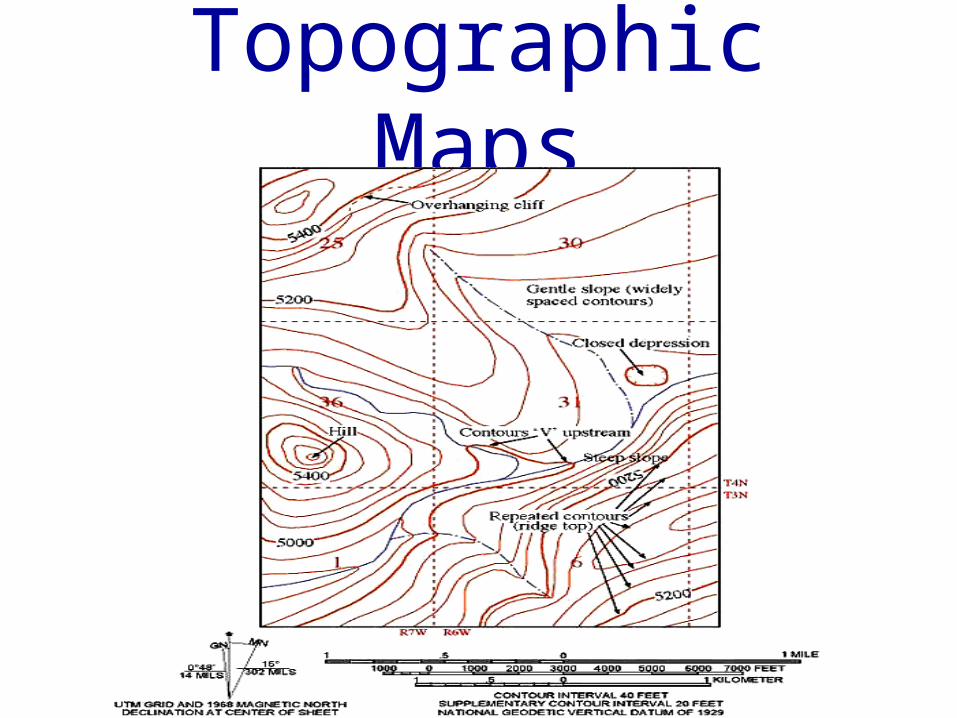
Topographic Maps
What is a Topographic Map?
In contrast to most maps, a topographic map
shows the shape of the Earth’s surface by using
contour lines.

Contours are imaginary lines that join points of equal elevation above or
below sea level.

The contour interval is the difference in elevation between two side-by-side contour lines.
The contour interval must be the same throughout the entire map!!
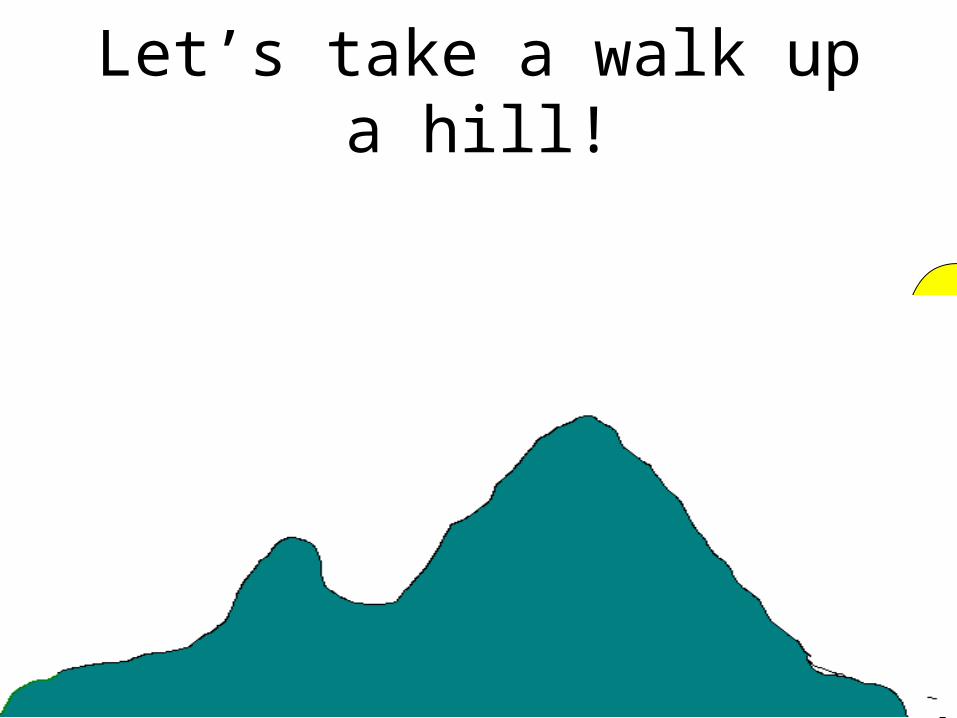
Let’s take a walk up a hill!

We’re now at an elevation of 100 meters.
100m

Let’s keep going!
100m

Now we’re at 200m.
100m
200m
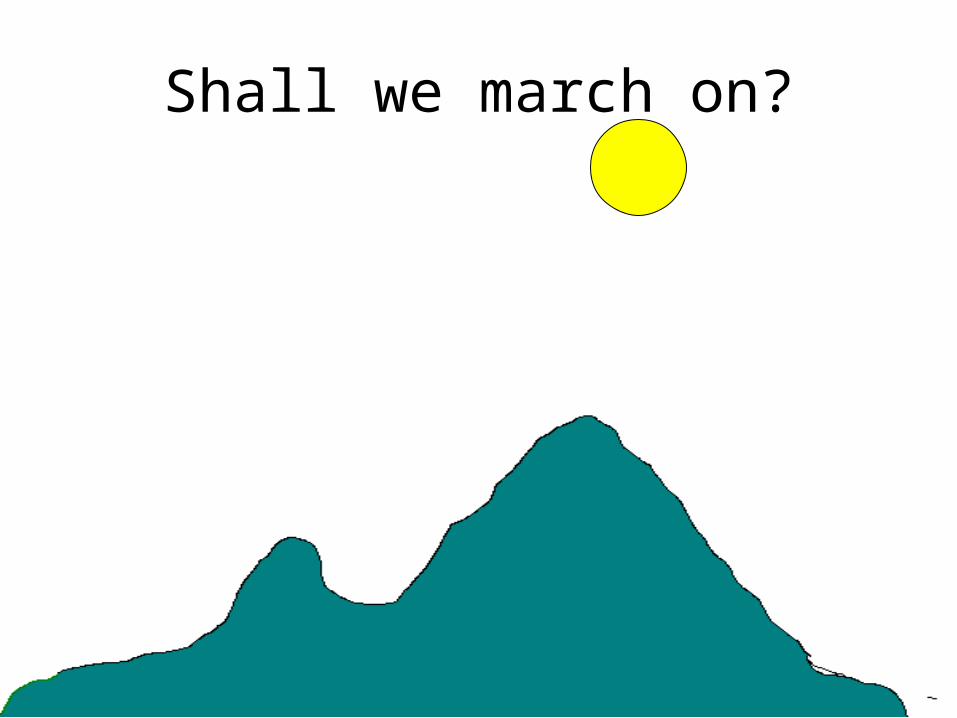
Shall we march on?
100m
200m
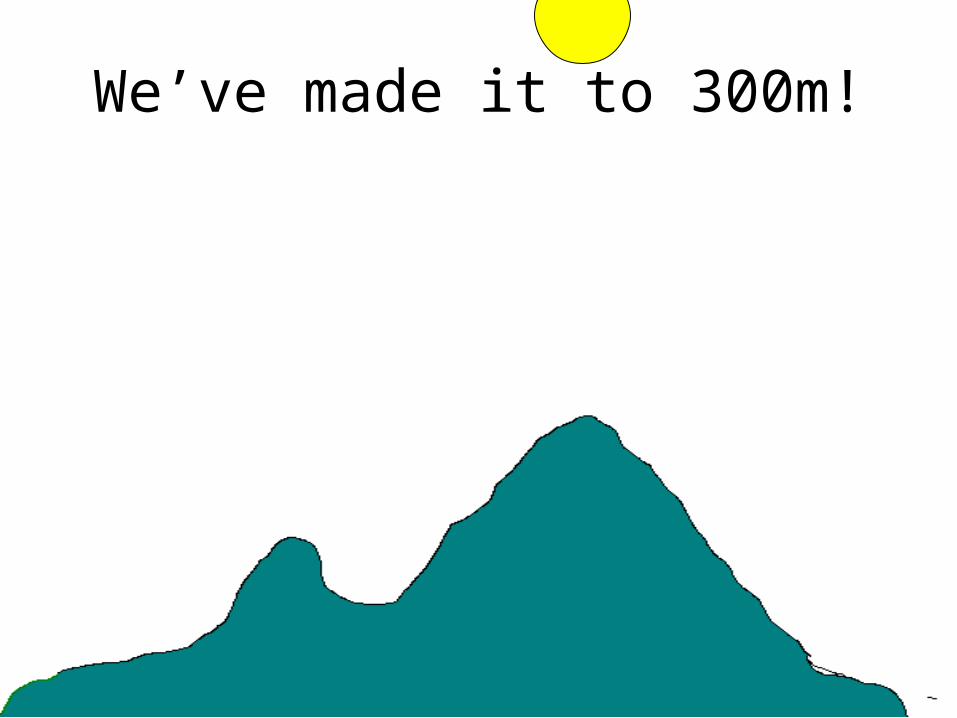
We’ve made it to 300m!
100m
200m
300m
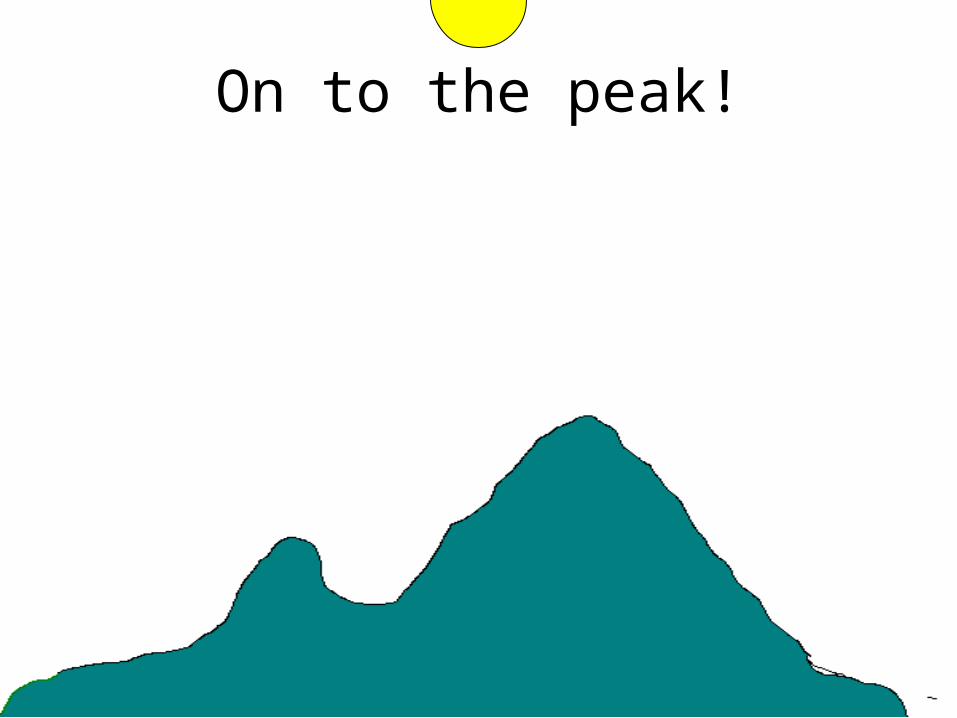
On to the peak!
100m
200m
300m

We’re on the peak, but what’s our elevation?
100m
200m
300m
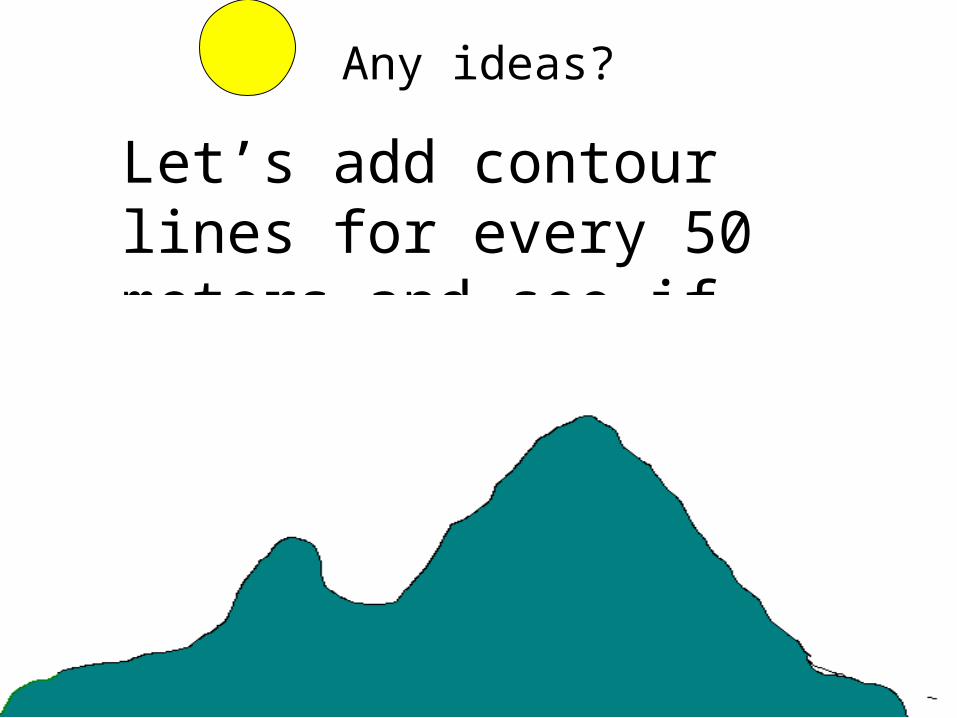
Any ideas?
100m
200m
300m
Let’s add contour lines for every 50 meters and see if that helps.
100m
200m
300m
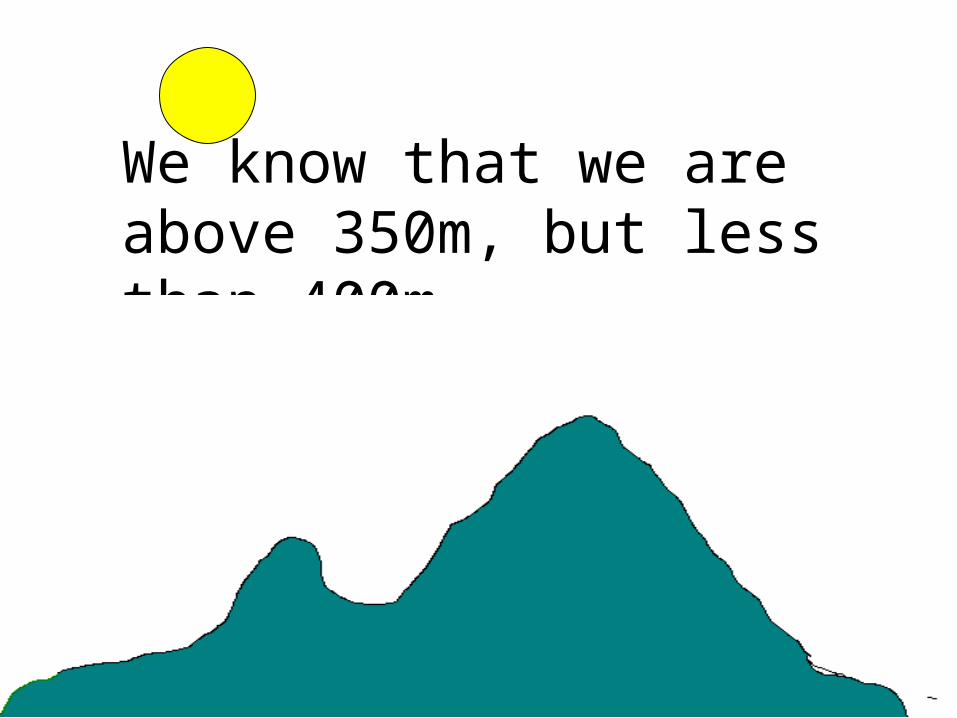
We know that we are above 350m, but less than 400m.
50m
150m
250m
350m
100m
200m
300m
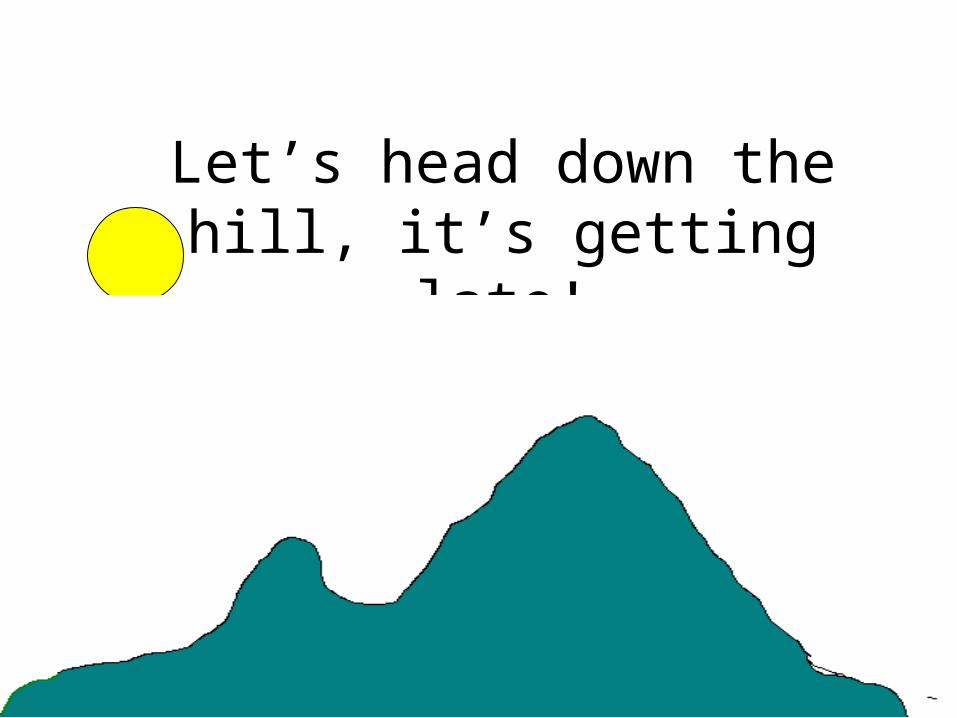
Let’s head down the hill, it’s getting late!
50m
150m
250m
350m

100m
200m
300m
Now what’s our elevation?
50m
150m
250m
350m
If you said somewhere between 200m and 250m you are right!

100m
200m
300m
Let’s try this again!
50m
150m
250m
350m
100m
200m
300m
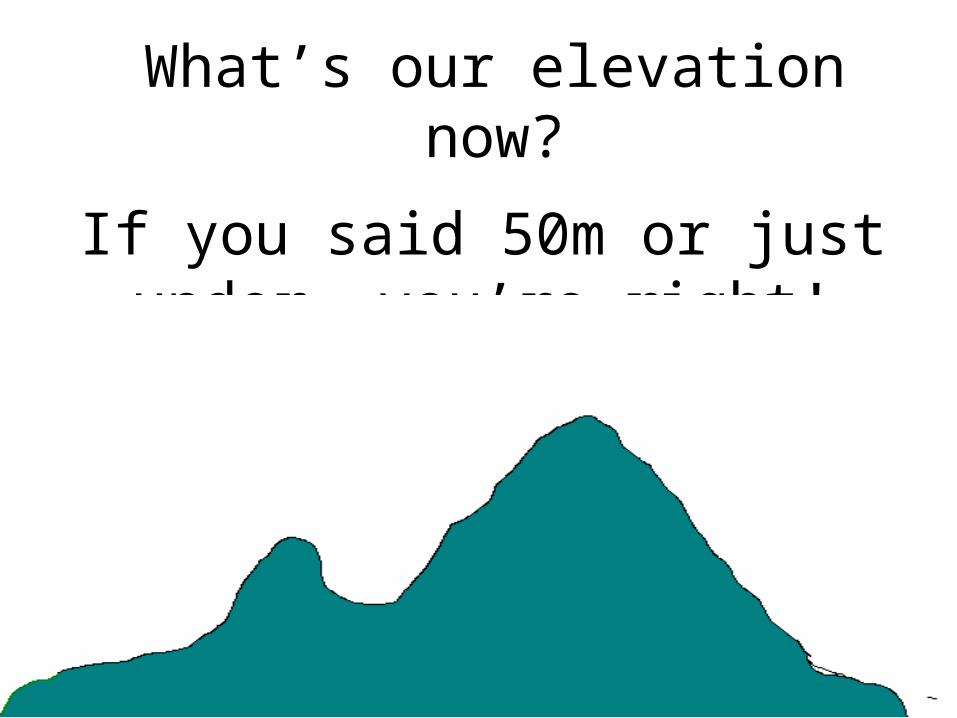
What’s our elevation now?
50m
150m
250m
350m
If you said 50m or just under, you’re right!

Let’s now look at the same hill, but the way we
might see it from an airplane!

Each color change represents a 50 meter increase.

Now, let’s try the same hike! Our elevation is 0 meters.
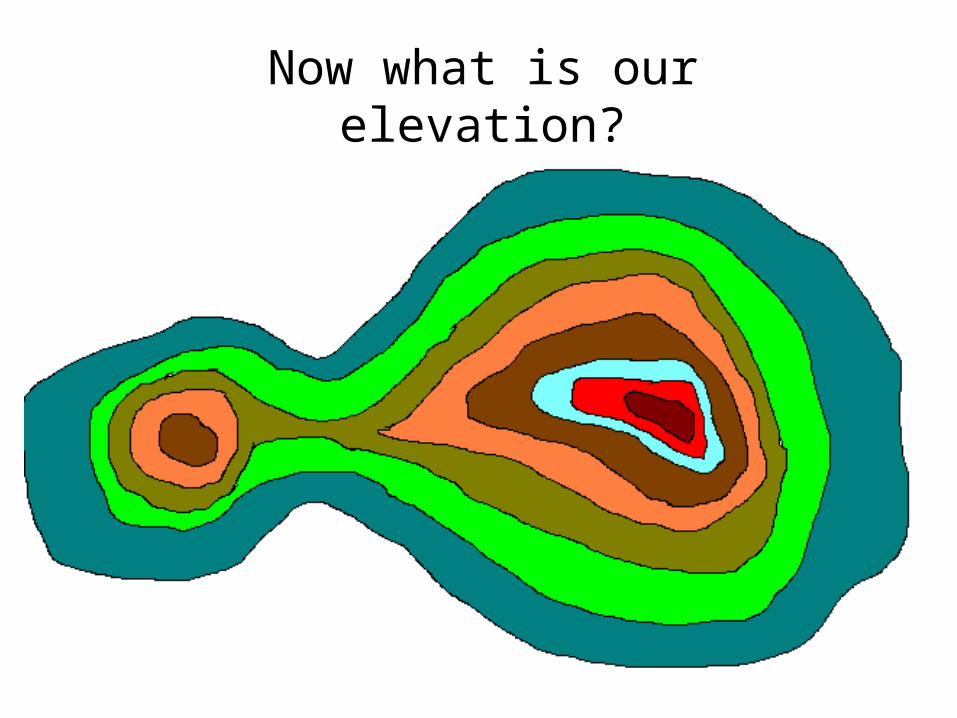
Now what is our elevation?
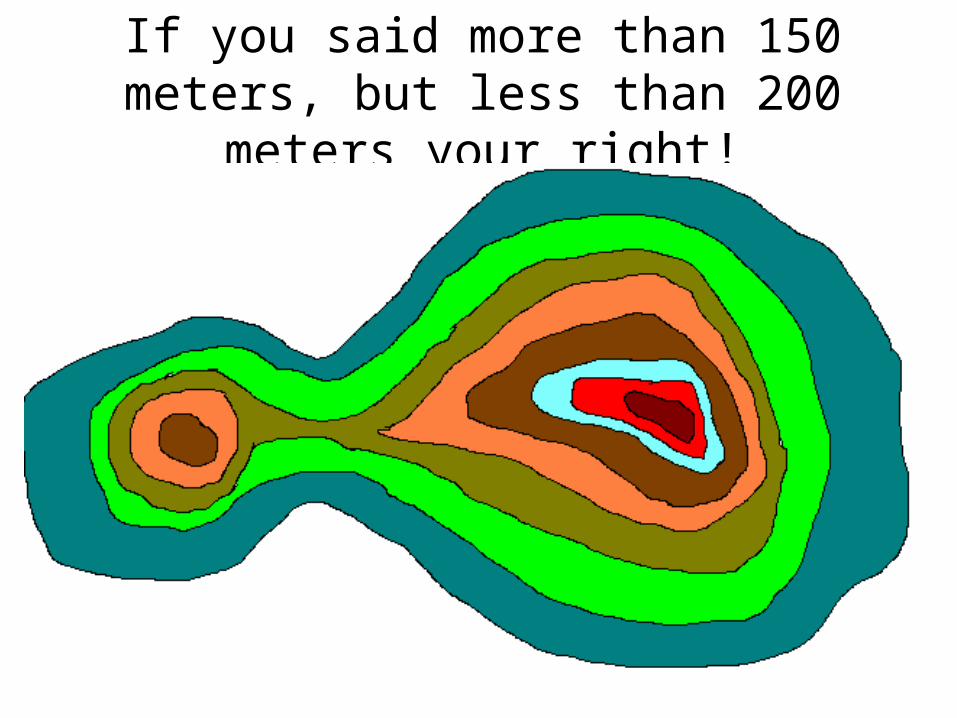
If you said more than 150 meters, but less than 200
meters your right!

Let’s go a little higher.
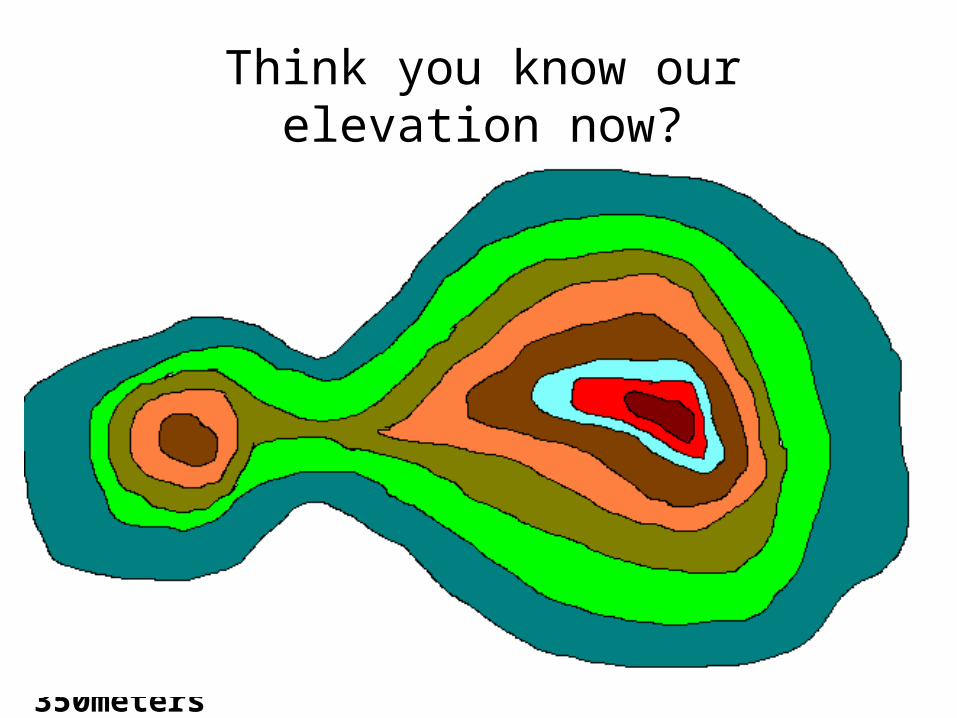
Think you know our elevation now?
More than 300meters
But less than 350meters

If we were standing on the peak, what would be our elevation?
•More than 350 meters, less than 400 meters

Let’s head down hill.
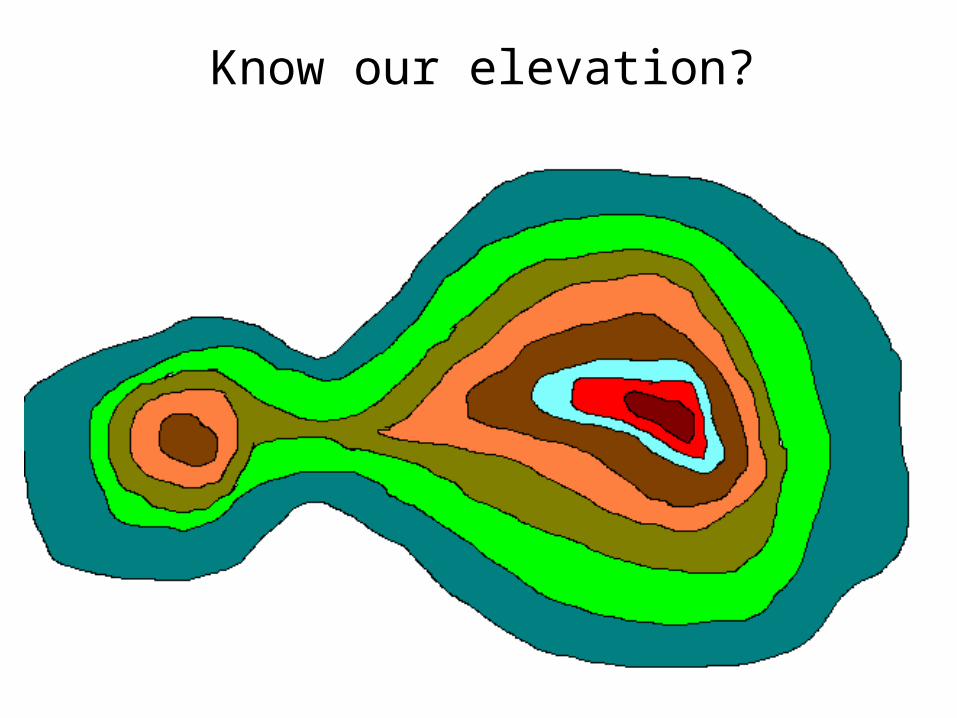
Know our elevation?

More than 100 meters,
less than 150 meters


What about a crater?
For landmarks like craters or other depressions, we use contour lines with hachures (HASH-ers).
The hachures point toward the lower elevation.
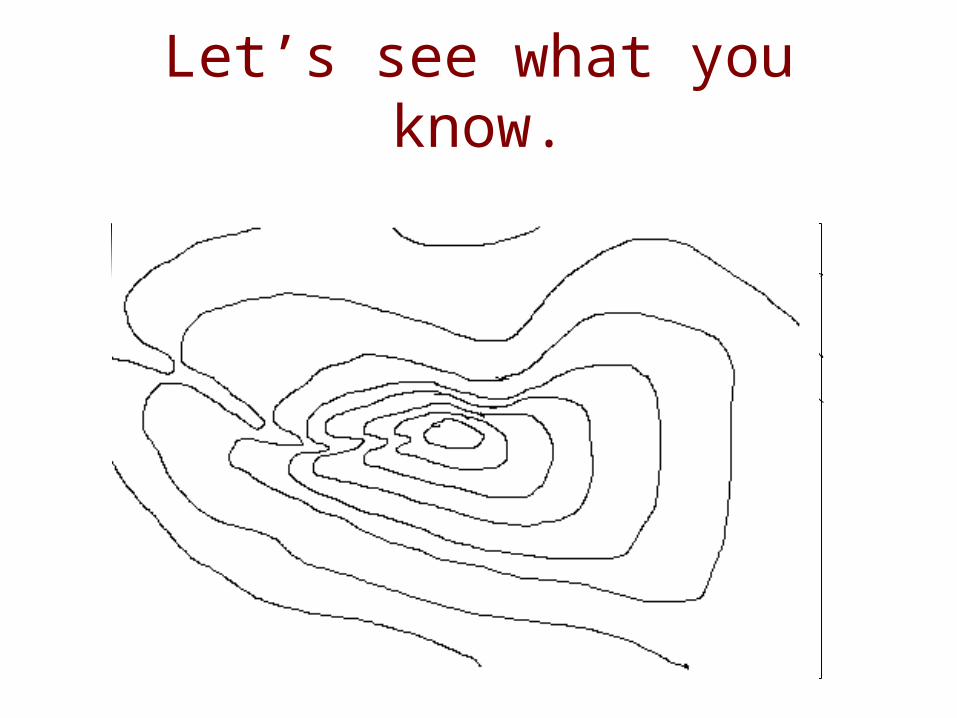
Let’s see what you know.
400m 800m
1000m
1200m
A
B
C
D
E
F
600m

Grab a piece of paper and write your answers to the following questions.
Ready?
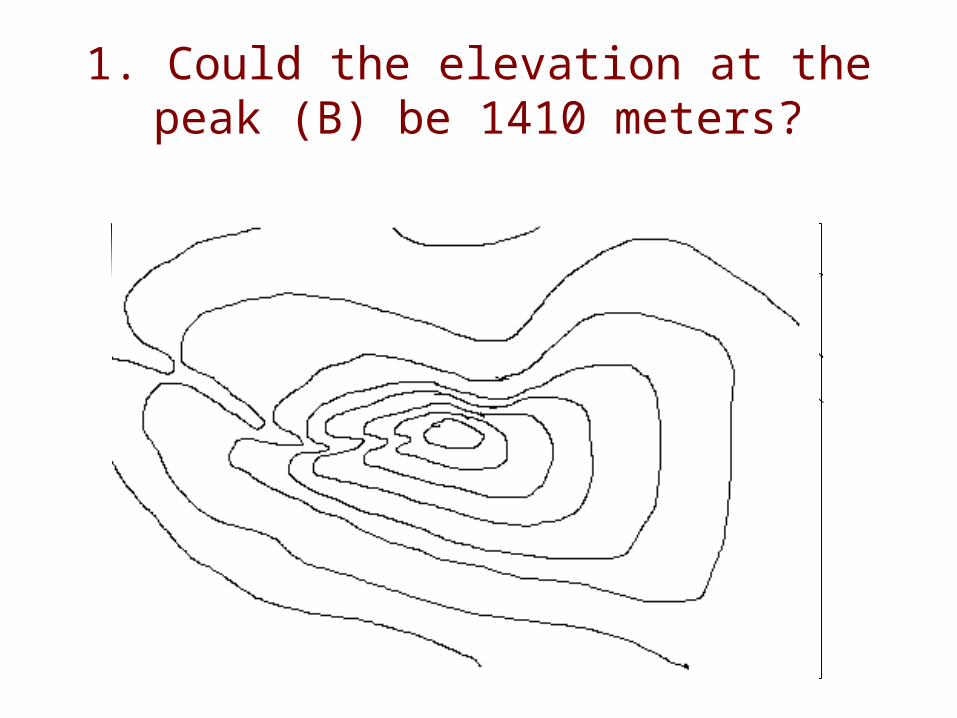
1. Could the elevation at the peak (B) be 1410 meters?
400m 800m
1000m
1200m
A
B
C
D
E
F
600m
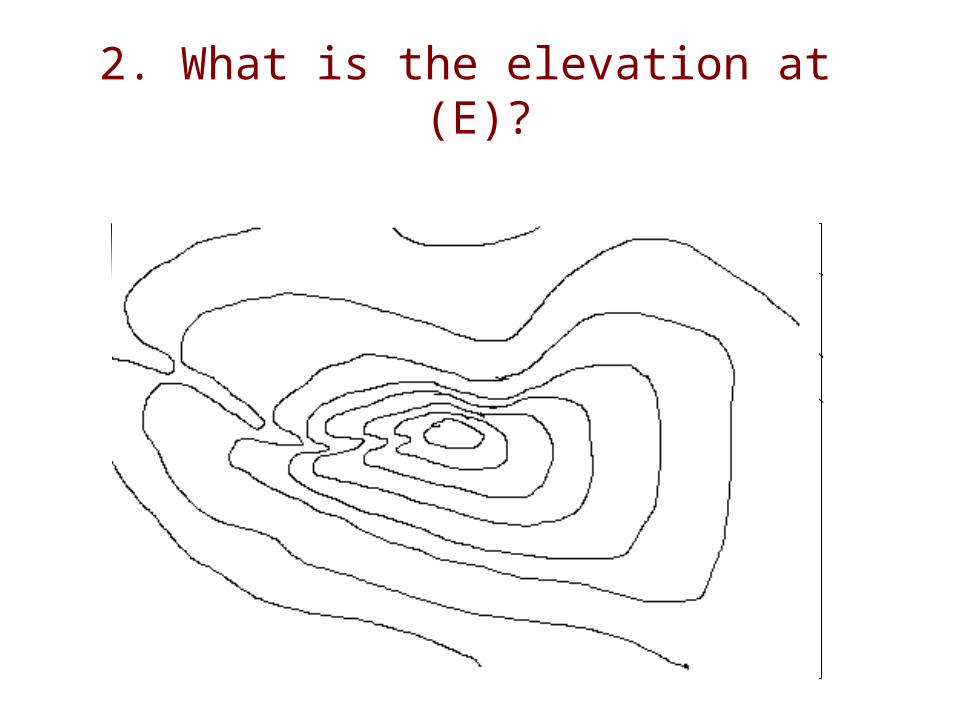
2. What is the elevation at (E)?
400m 800m
1000m
1200m
A
B
C
D
E
F
600m

3.What is the elevation difference between (A) and (B)?
400m 800m
1000m
1200m
A
B
C
D
E
F
600m
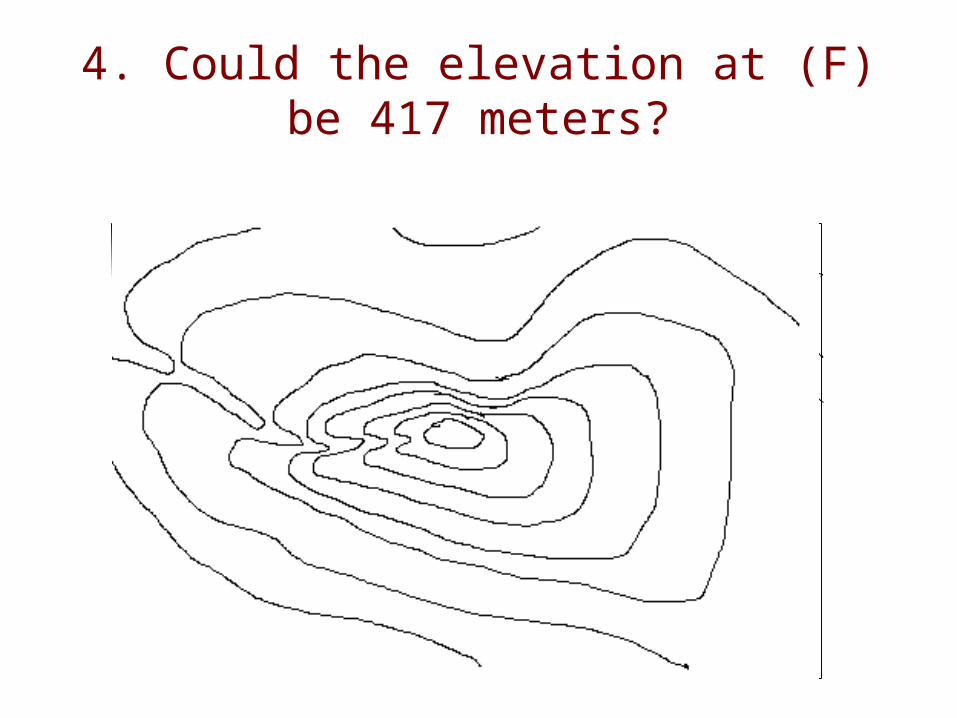
4. Could the elevation at (F) be 417 meters?
400m 800m
1000m
1200m
A
B
C
D
E
F
600m

5. If you walked a straight line from (D) to (C) would you walk over a
ridge or down a valley?
400m 800m
1000m
1200m
A
B
C
D
E
F
600m

6.Just looking at the map, would it be easier to head down from the peak going East, or going North?
400m 800m
1000m
1200m
A
B
C
D
E
F
600m
E
N
S
W
• 1. No :The elevation must be under 1400 meters, but over 1300 meters.• 2. about 400 meters
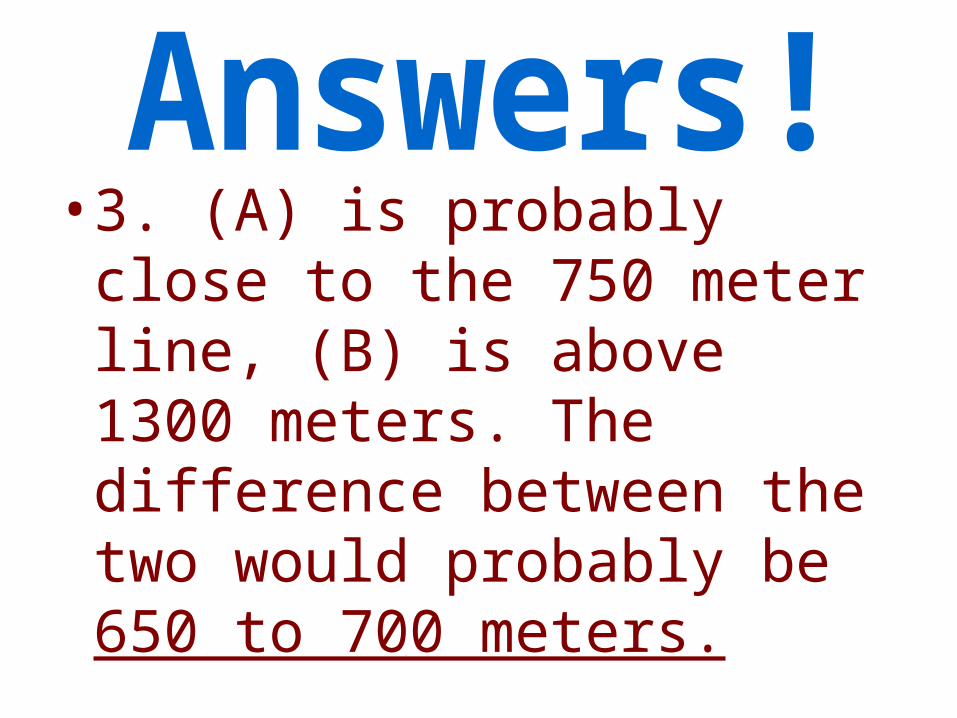
• 3. (A) is probably close to the 750 meter line, (B) is above 1300 meters. The difference between the two would probably be 650 to 700 meters.
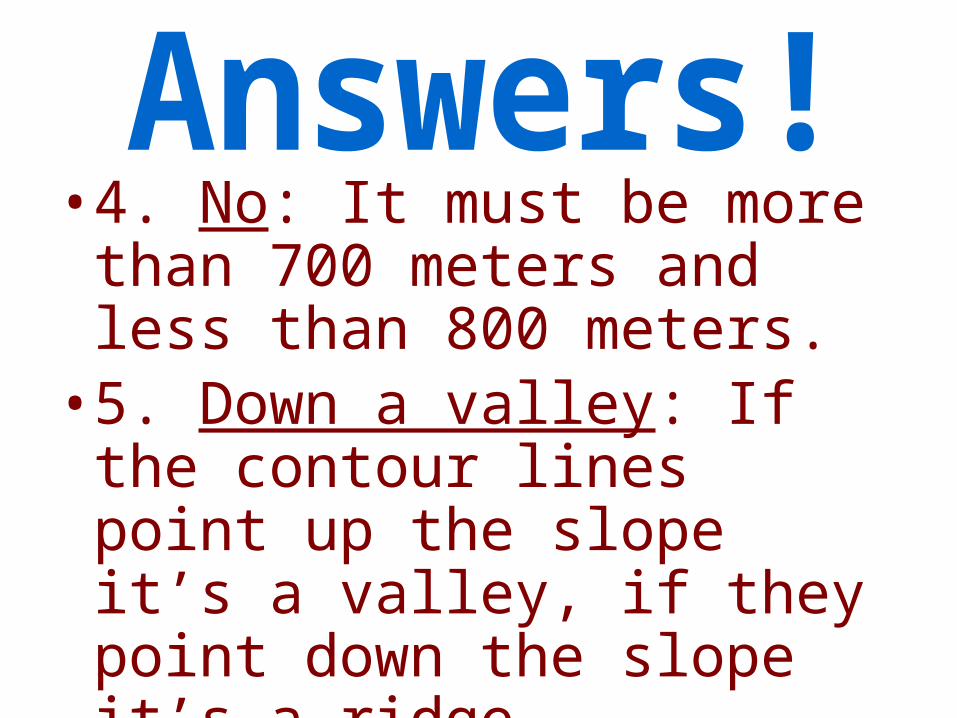
• 4. No: It must be more than 700 meters and less than 800 meters.• 5. Down a valley: If the contour lines point up the slope it’s a valley, if they point down the slope it’s a ridge.

• 6. East: When contour lines are close together that means there is a steep slope, the further apart the lines, the more gentile the slope and therefore an easier walk! Go east!
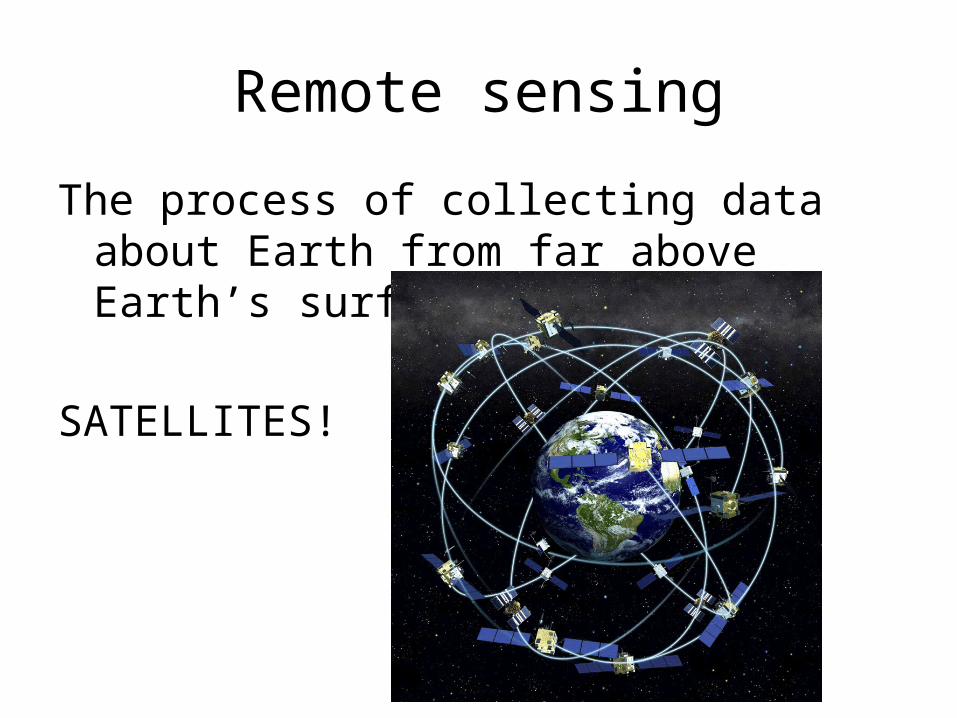
Remote sensing
The process of collecting data about Earth from far above Earth’s surface.
SATELLITES!
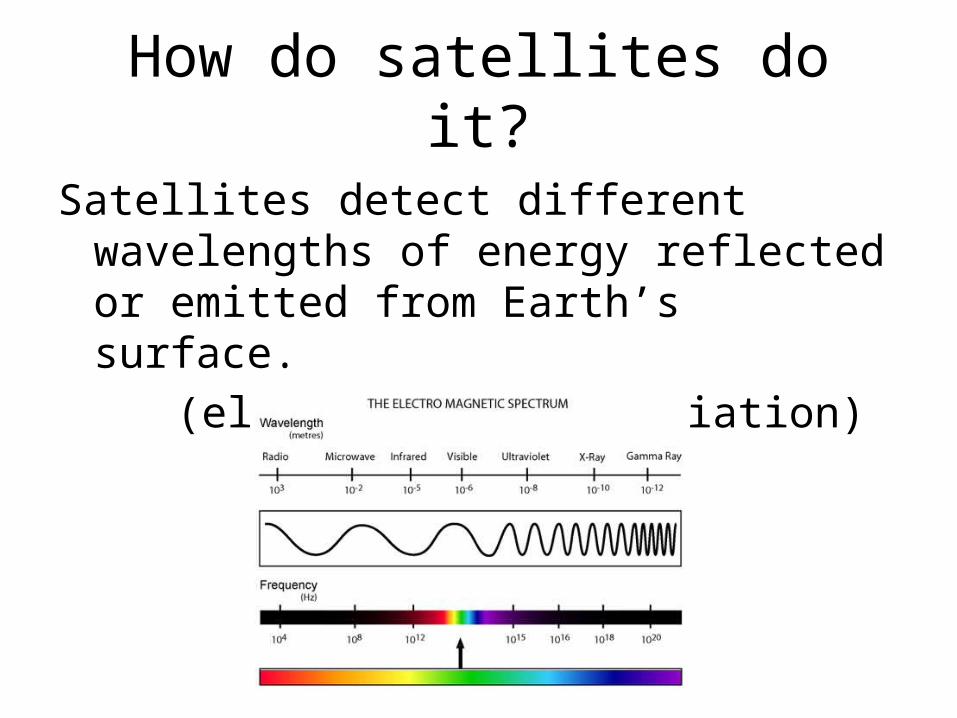
How do satellites do it?
Satellites detect different wavelengths of energy reflected or emitted from Earth’s surface.
(electromagnetic radiation)

What is electromagnetic radiation?
• Visible light• Gamma rays• X-rays• Ultraviolet light• Infrared waves• Radio waves• microwaves
All of these electromagnetic waves travel at the speed of light.
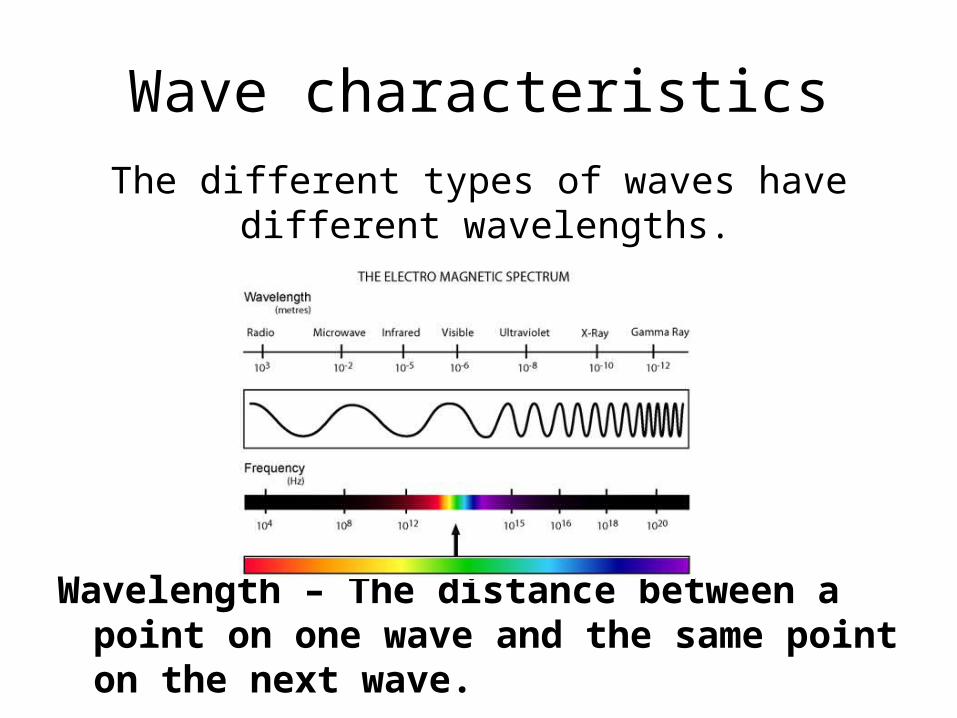
Wave characteristicsThe different types of waves have different
wavelengths.
Wavelength – The distance between a point on one wave and the same point on the next wave.
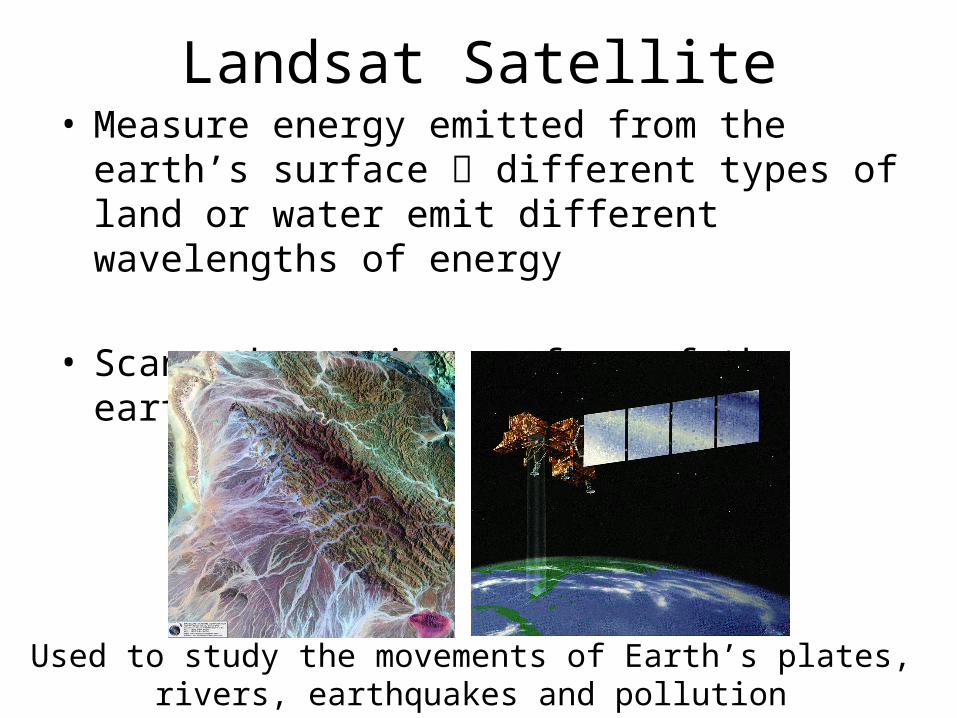
Landsat Satellite• Measure energy emitted from the earth’s surface
different types of land or water emit different wavelengths of energy
• Scans the entire surface of the earth in 16 days
Used to study the movements of Earth’s plates, rivers, earthquakes and pollution

The Global Positioning System (GPS)
• 24 satellites (and 3 spares) emit high frequency waves with information about the satellites’ positions.
• The handheld GPS unit picks up signals from several satellites at once, allowing the location to be pinpointed.
• The satellites can also relay information about elevation, direction and speed.
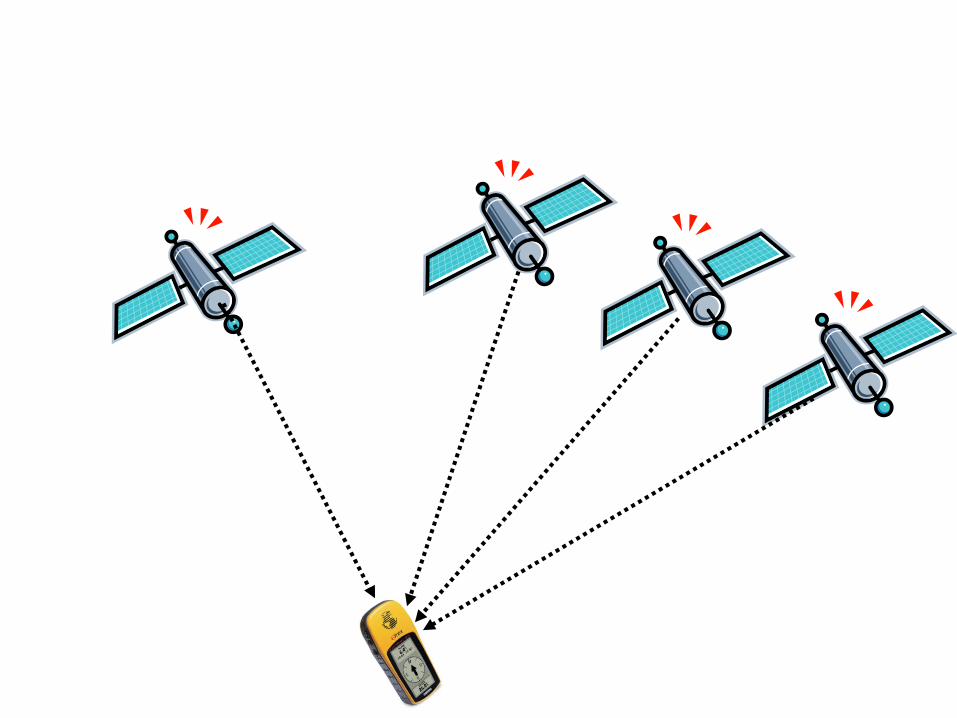

How GPS Works A fourth GPS is required to determine the exact location and elevation.
Sea Beam
Uses sonar to create a map of the ocean floor.
Sonar – a sound wave is sent out and the returning echo is received when after it bounces off an object.
Computers analyze information about the echo to determine information about the ocean floor.