Embed Size (px)
Citation preview
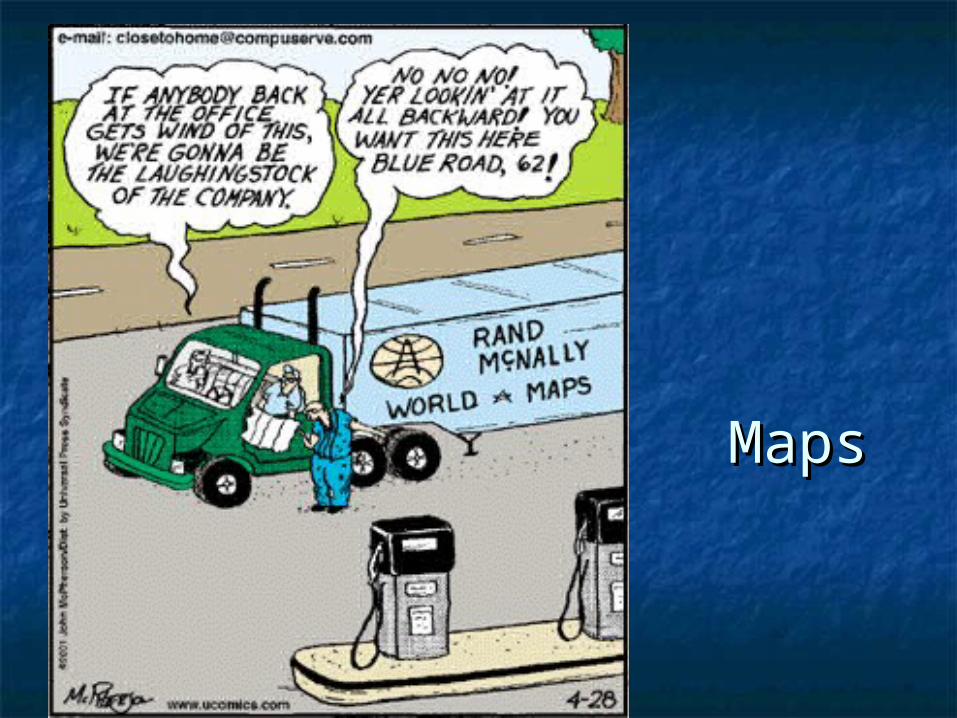
MapsMaps
Evolution of MapmakingEvolution of Mapmaking Babylonians – 2300 BC earliest surviving Babylonians – 2300 BC earliest surviving
maps written on clay tablets.maps written on clay tablets. AristotleAristotle – 384-322 BC demonstrated earth – 384-322 BC demonstrated earth
was spherical through maps.was spherical through maps. EratosthenesEratosthenes – 276-194 BC first person to use – 276-194 BC first person to use
the word the word geography.geography. Also the first person to Also the first person to correctly divide earth into 5 climatic regions.correctly divide earth into 5 climatic regions.
Ptolemy – 100-170 AD Ptolemy – 100-170 AD Guide to GeographyGuide to Geography Age of Exploration – by the 17th century, Age of Exploration – by the 17th century,
most continents and oceans were accurately most continents and oceans were accurately displayed.displayed.
Human Geography: Five Human Geography: Five ThemesThemes
LocationLocation – the space that is occupied in – the space that is occupied in the universe (absolute/relative).the universe (absolute/relative).
PlacePlace – physical and human – physical and human characteristics: space after humans.characteristics: space after humans.
Human/Environment InteractionsHuman/Environment Interactions – – how humans depend, modify, and adapt how humans depend, modify, and adapt to their environments.to their environments.
MovementMovement – how humans interact on – how humans interact on earth, the diffusion of religion or trade earth, the diffusion of religion or trade patterns through connections of patterns through connections of peoples.peoples.
RegionsRegions – an area with one or more – an area with one or more shared characteristics.shared characteristics.
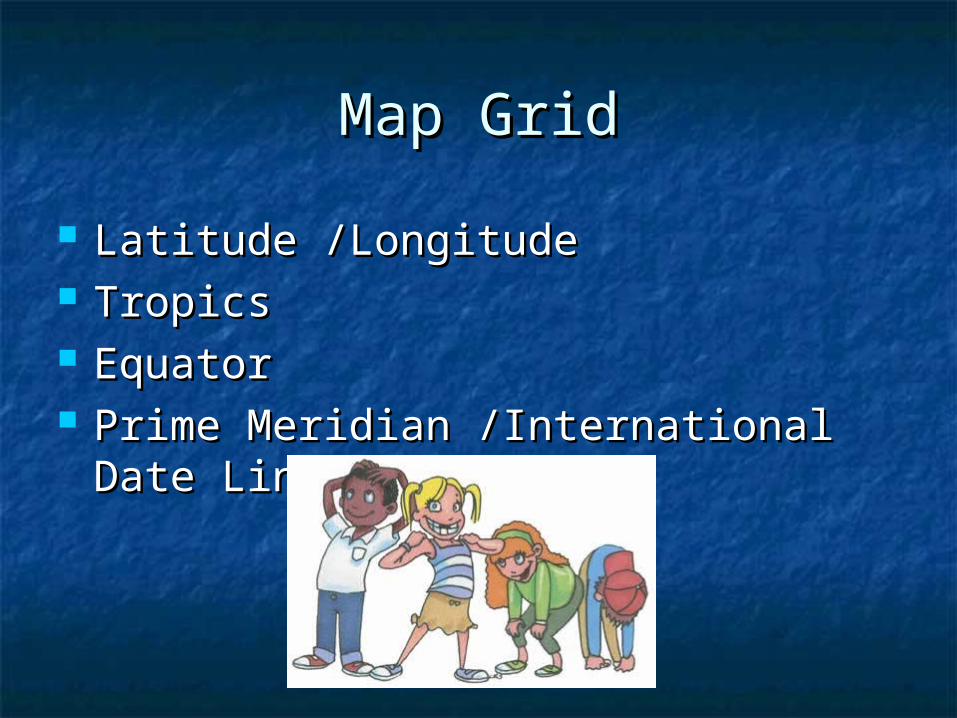
Map GridMap Grid
Latitude /LongitudeLatitude /Longitude Tropics Tropics EquatorEquator Prime Meridian /International Date Prime Meridian /International Date
LineLine
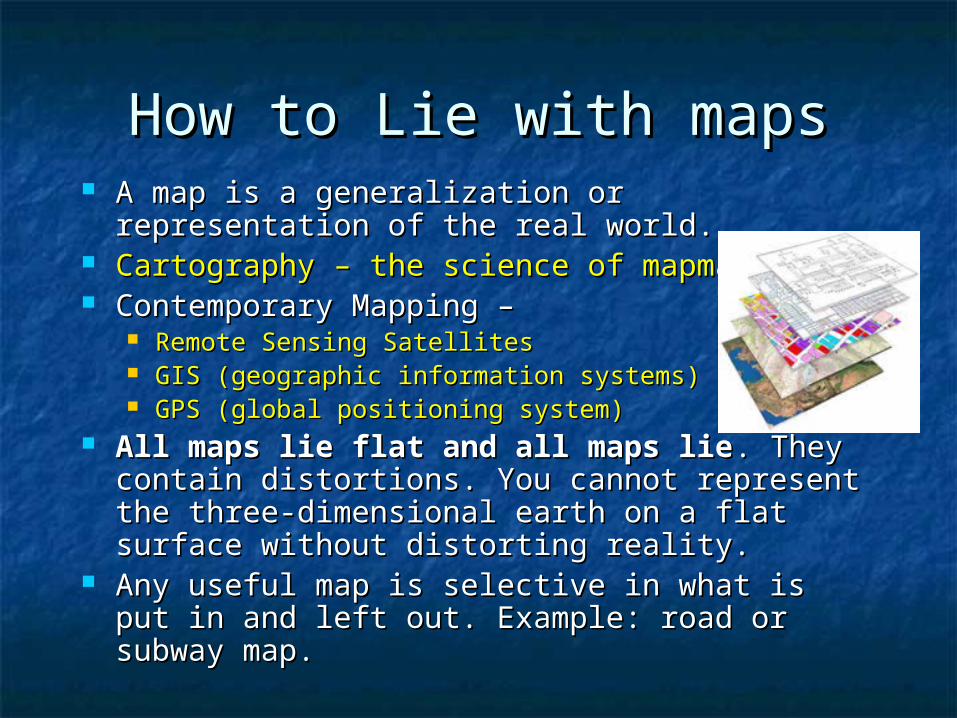
How to Lie with mapsHow to Lie with maps A map is a generalization or representation of A map is a generalization or representation of
the real world.the real world. Cartography – the science of mapmakingCartography – the science of mapmaking.. Contemporary Mapping – Contemporary Mapping –
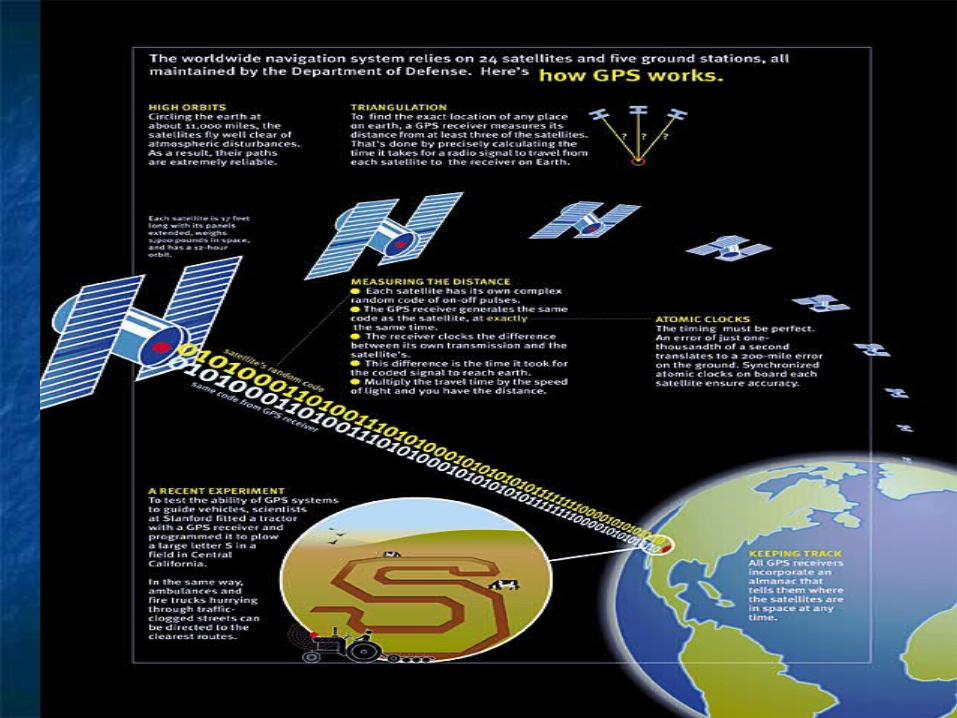
Remote Sensing SatellitesRemote Sensing Satellites GIS (geographic information systems)GIS (geographic information systems) GPS (global positioning system) GPS (global positioning system)
All maps lie flat and all maps lieAll maps lie flat and all maps lie. They . They contain distortions. You cannot represent the contain distortions. You cannot represent the three-dimensional earth on a flat surface three-dimensional earth on a flat surface without distorting reality.without distorting reality.
Any useful map is selective in what is put in Any useful map is selective in what is put in and left out. Example: road or subway map.and left out. Example: road or subway map.
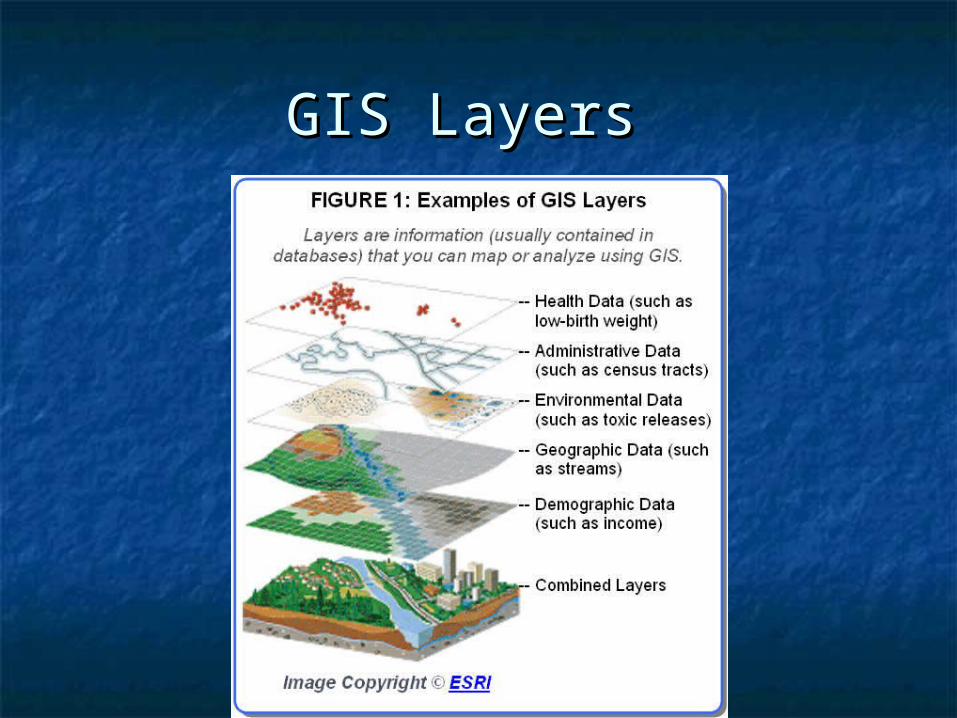
GIS Layers GIS Layers
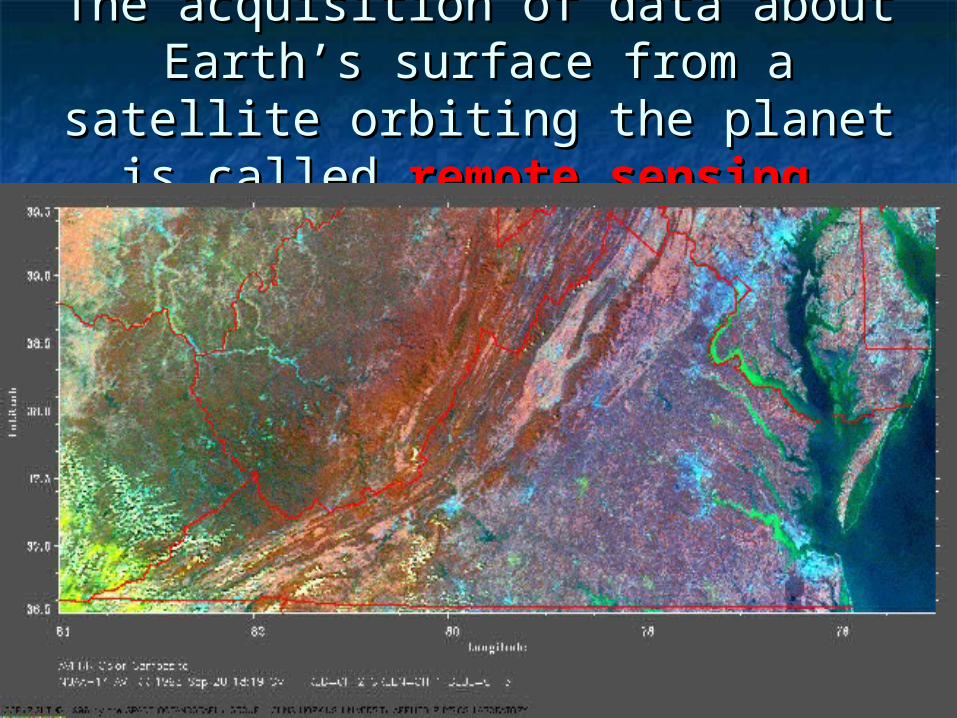
The acquisition of data about The acquisition of data about Earth’s surface from a satellite Earth’s surface from a satellite
orbiting the planet is called orbiting the planet is called remote sensingremote sensing..
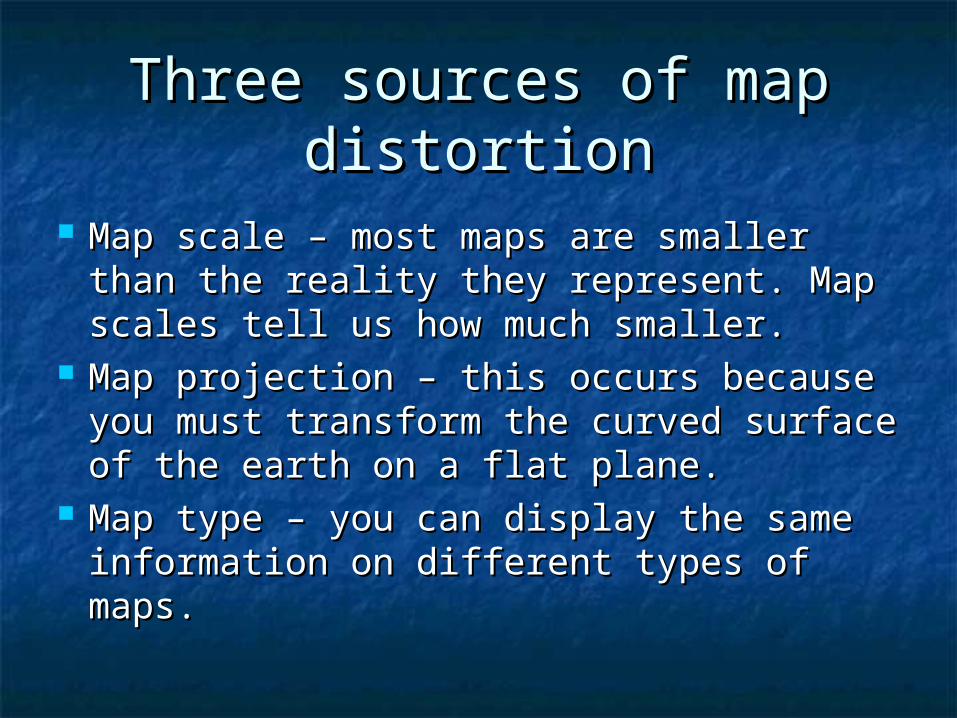
Three sources of map Three sources of map distortiondistortion
Map scale – most maps are smaller Map scale – most maps are smaller than the reality they represent. Map than the reality they represent. Map scales tell us how much smaller.scales tell us how much smaller.
Map projection – this occurs because Map projection – this occurs because you must transform the curved surface you must transform the curved surface of the earth on a flat plane.of the earth on a flat plane.
Map type – you can display the same Map type – you can display the same information on different types of maps.information on different types of maps.
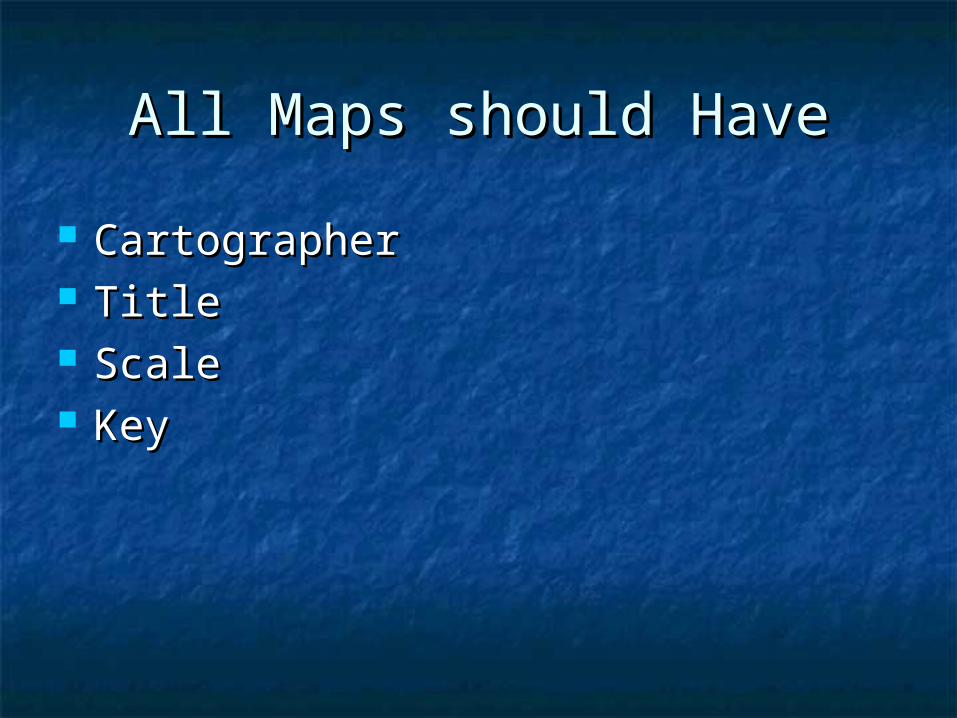
All Maps should HaveAll Maps should Have
CartographerCartographer TitleTitle ScaleScale KeyKey
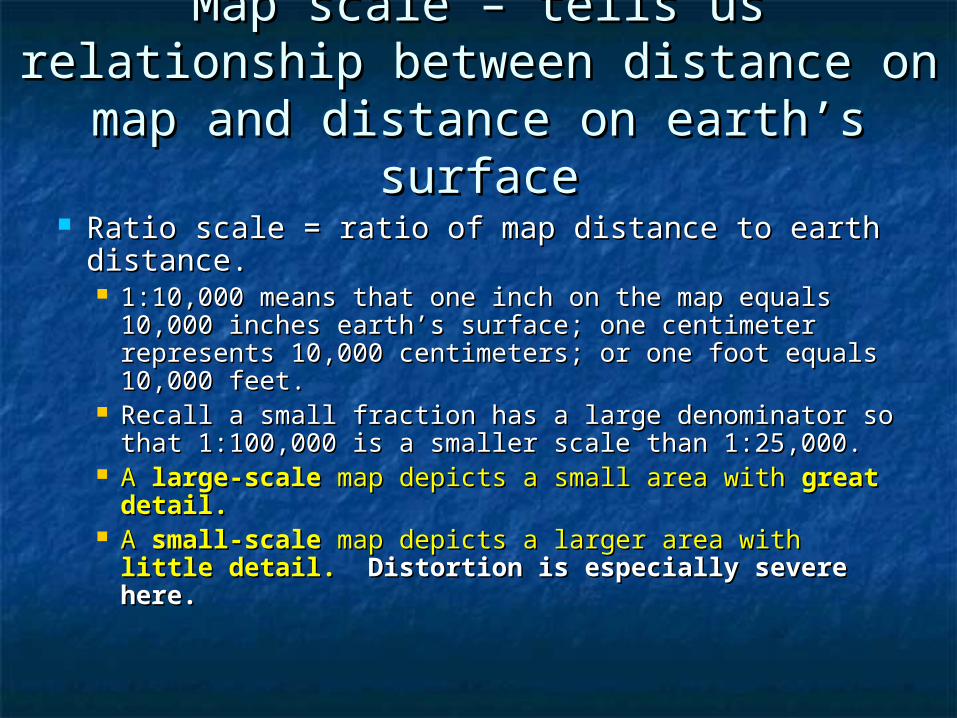
Map scale – tells us relationship Map scale – tells us relationship between distance on map and between distance on map and
distance on earth’s surfacedistance on earth’s surface
Ratio scale = ratio of map distance to earth Ratio scale = ratio of map distance to earth distance.distance. 1:10,000 means that one inch on the map equals 1:10,000 means that one inch on the map equals
10,000 inches earth’s surface; one centimeter 10,000 inches earth’s surface; one centimeter represents 10,000 centimeters; or one foot equals represents 10,000 centimeters; or one foot equals 10,000 feet.10,000 feet.
Recall a small fraction has a large denominator so Recall a small fraction has a large denominator so that 1:100,000 is a smaller scale than 1:25,000.that 1:100,000 is a smaller scale than 1:25,000.
A A large-scalelarge-scale map depicts a small area with map depicts a small area with great great detail.detail.
A A small-scalesmall-scale map depicts a larger area with map depicts a larger area with little little detail.detail. Distortion is especially severe here. Distortion is especially severe here.
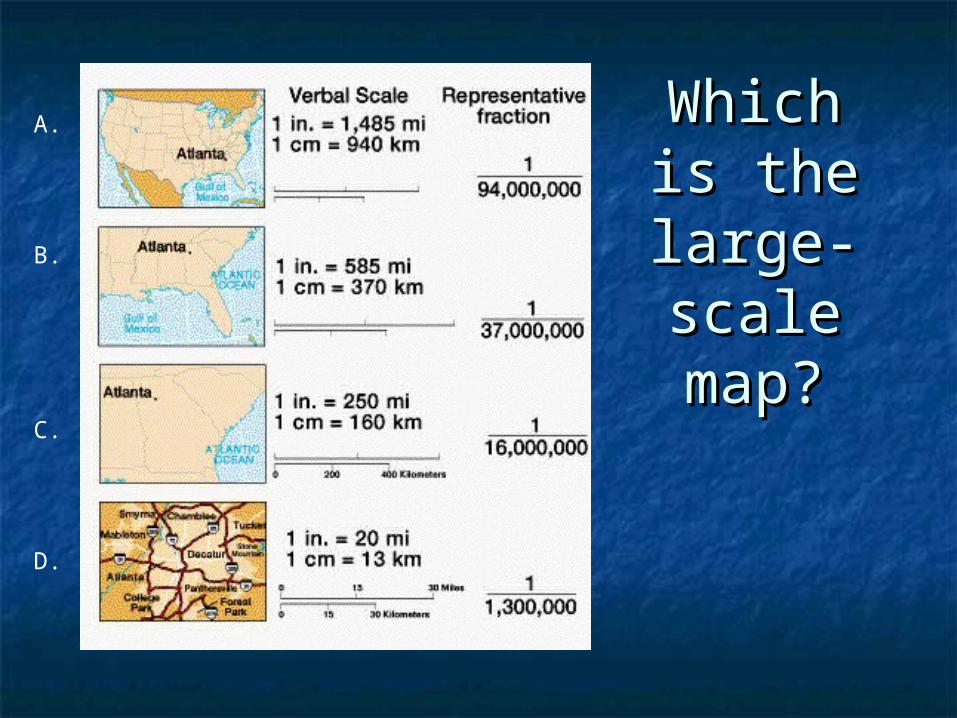
Which Which is the is the large-large-scale scale map?map?
A.
B.
C.
D.
Map scale continuedMap scale continued
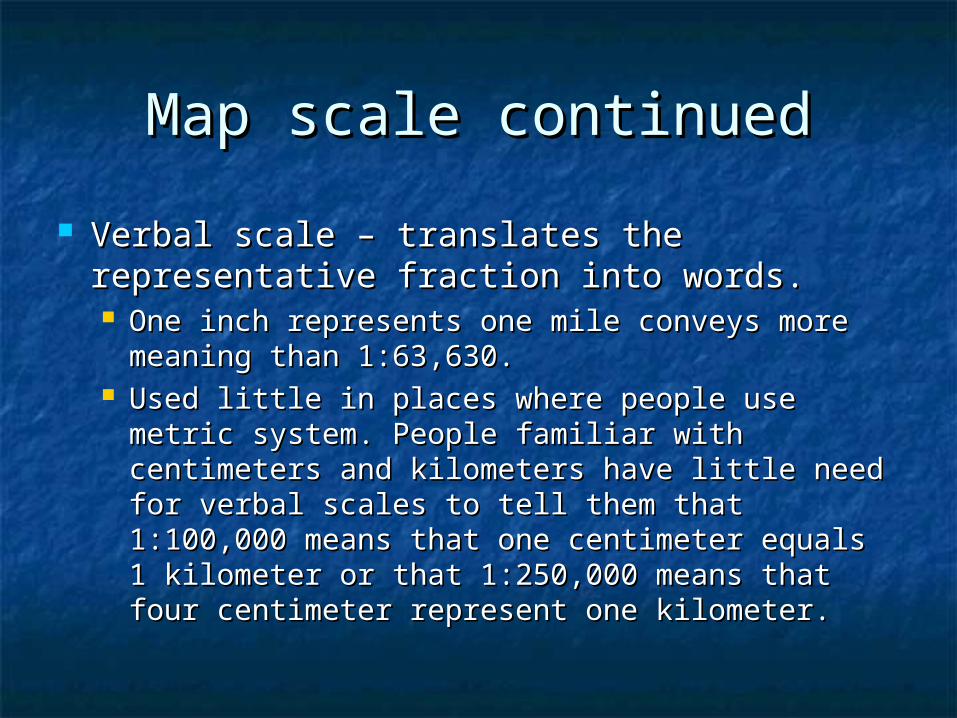
Verbal scale – translates the representative Verbal scale – translates the representative fraction into words.fraction into words. One inch represents one mile conveys more One inch represents one mile conveys more
meaning than 1:63,630.meaning than 1:63,630. Used little in places where people use metric Used little in places where people use metric
system. People familiar with centimeters and system. People familiar with centimeters and kilometers have little need for verbal scales to kilometers have little need for verbal scales to tell them that 1:100,000 means that one tell them that 1:100,000 means that one centimeter equals 1 kilometer or that 1:250,000 centimeter equals 1 kilometer or that 1:250,000 means that four centimeter represent one means that four centimeter represent one kilometer.kilometer.
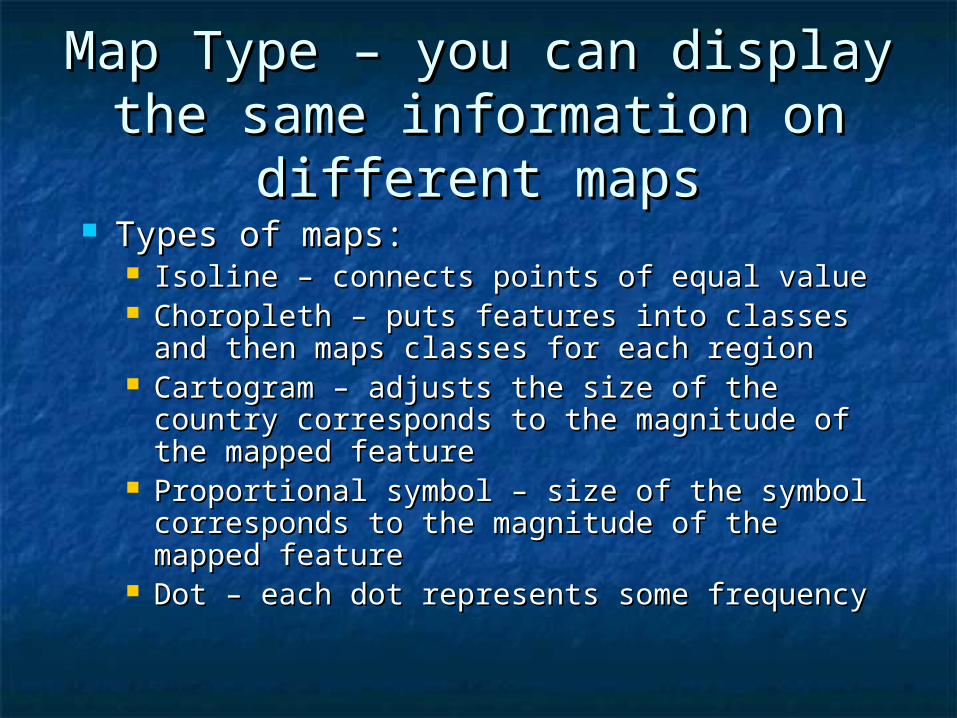
Map Type – you can display the Map Type – you can display the same information on different same information on different
mapsmaps Types of maps:Types of maps:
Isoline – connects points of equal valueIsoline – connects points of equal value Choropleth – puts features into classes and Choropleth – puts features into classes and
then maps classes for each regionthen maps classes for each region Cartogram – adjusts the size of the country Cartogram – adjusts the size of the country
corresponds to the magnitude of the mapped corresponds to the magnitude of the mapped featurefeature
Proportional symbol – size of the symbol Proportional symbol – size of the symbol corresponds to the magnitude of the mapped corresponds to the magnitude of the mapped featurefeature
Dot – each dot represents some frequencyDot – each dot represents some frequency
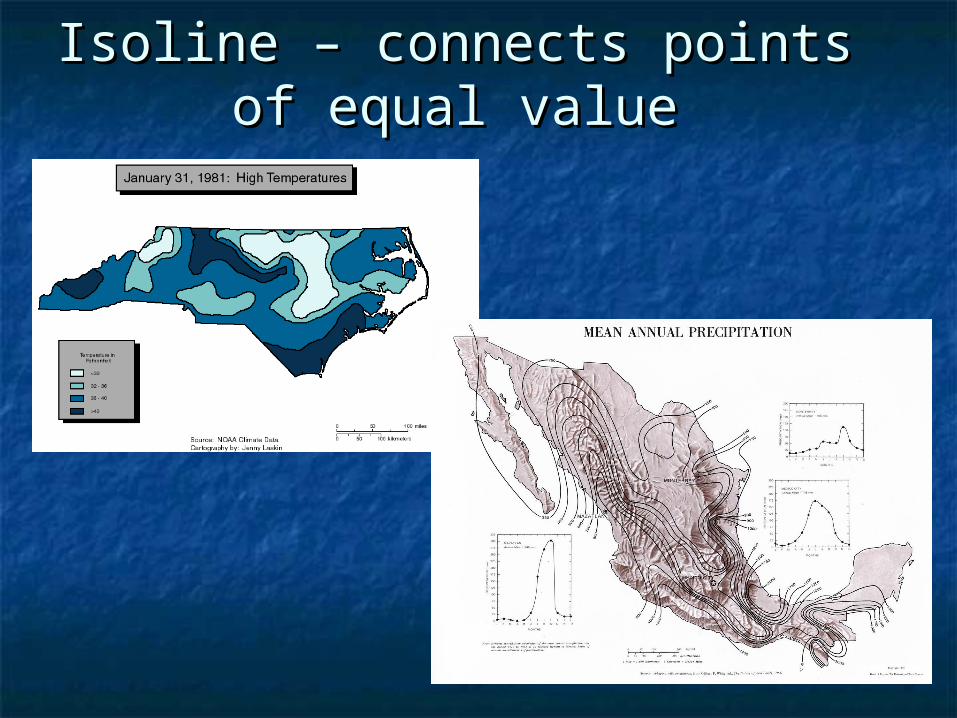
Isoline – connects points of Isoline – connects points of equal valueequal value
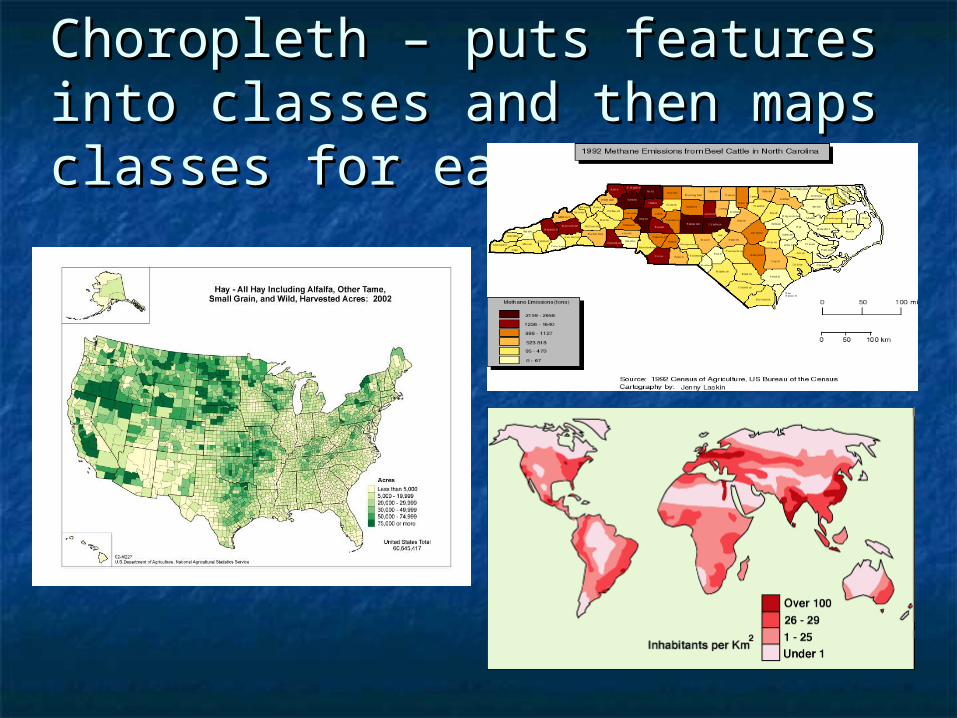
Choropleth – puts features into Choropleth – puts features into classes and then maps classes classes and then maps classes for each regionfor each region
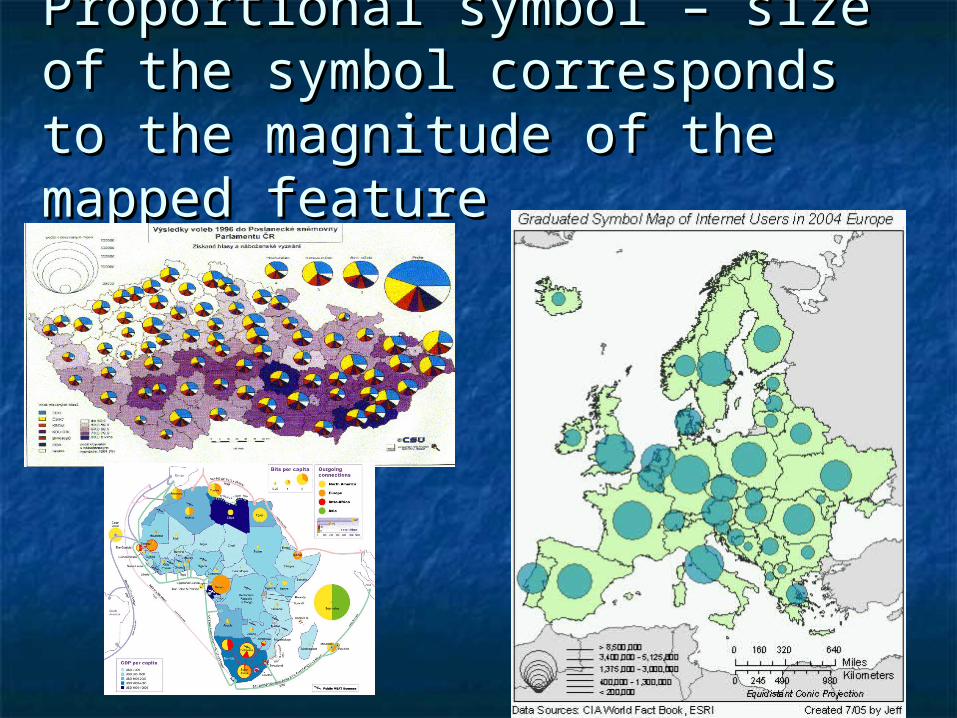
Proportional symbol – size of the Proportional symbol – size of the symbol corresponds to the symbol corresponds to the magnitude of the mapped magnitude of the mapped featurefeature
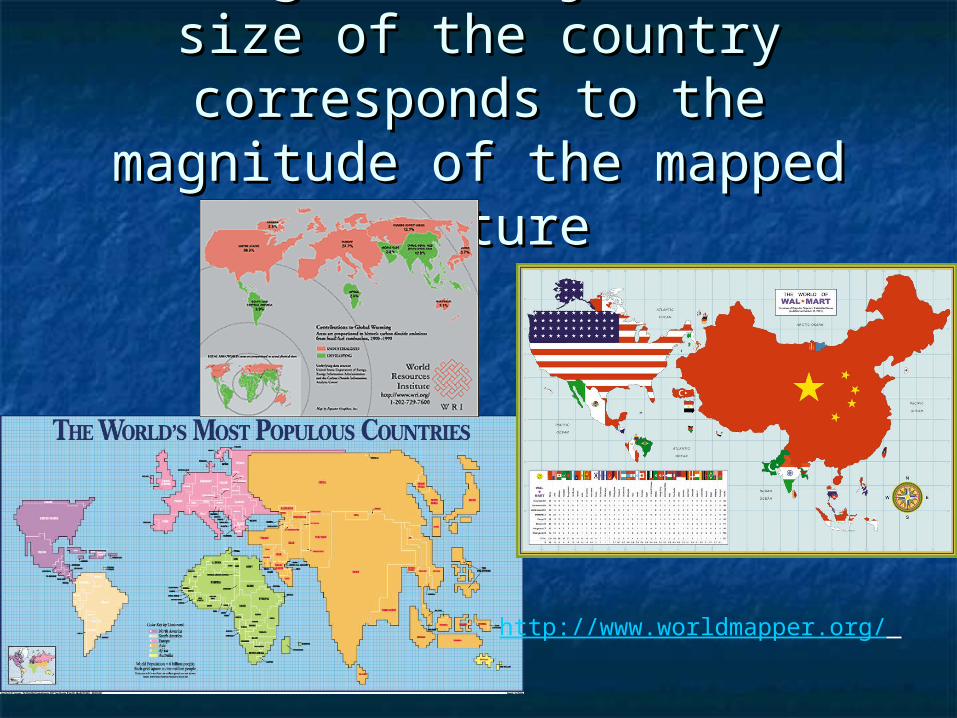
Cartogram – adjusts the size of Cartogram – adjusts the size of the country corresponds to the the country corresponds to the
magnitude of the mapped magnitude of the mapped featurefeature
http://www.worldmapper.org/
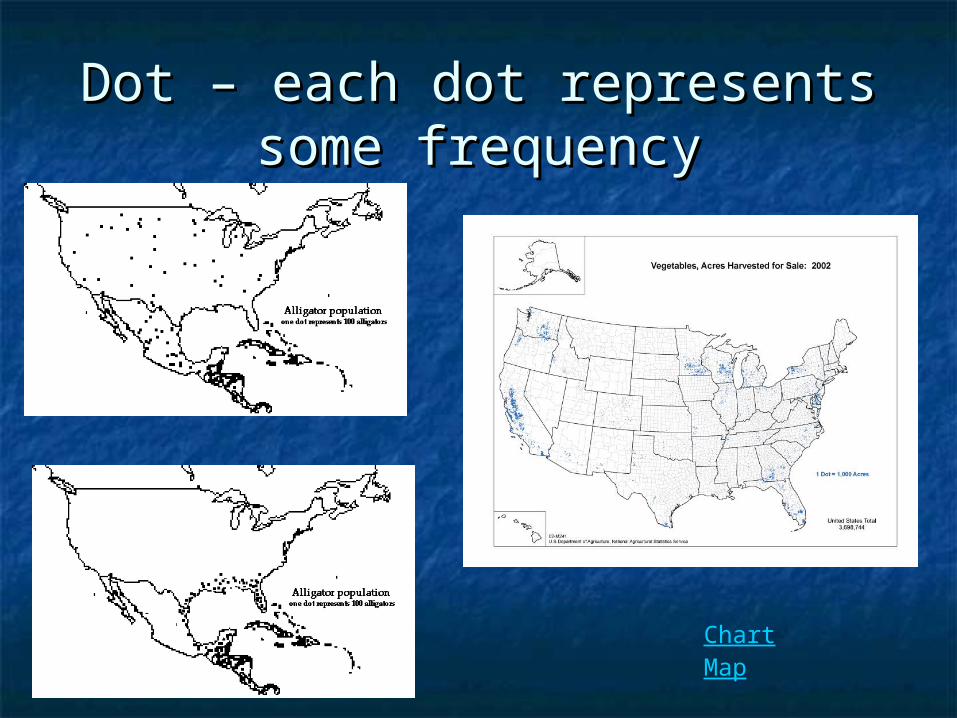
Dot – each dot represents Dot – each dot represents some frequencysome frequency
ChartMap
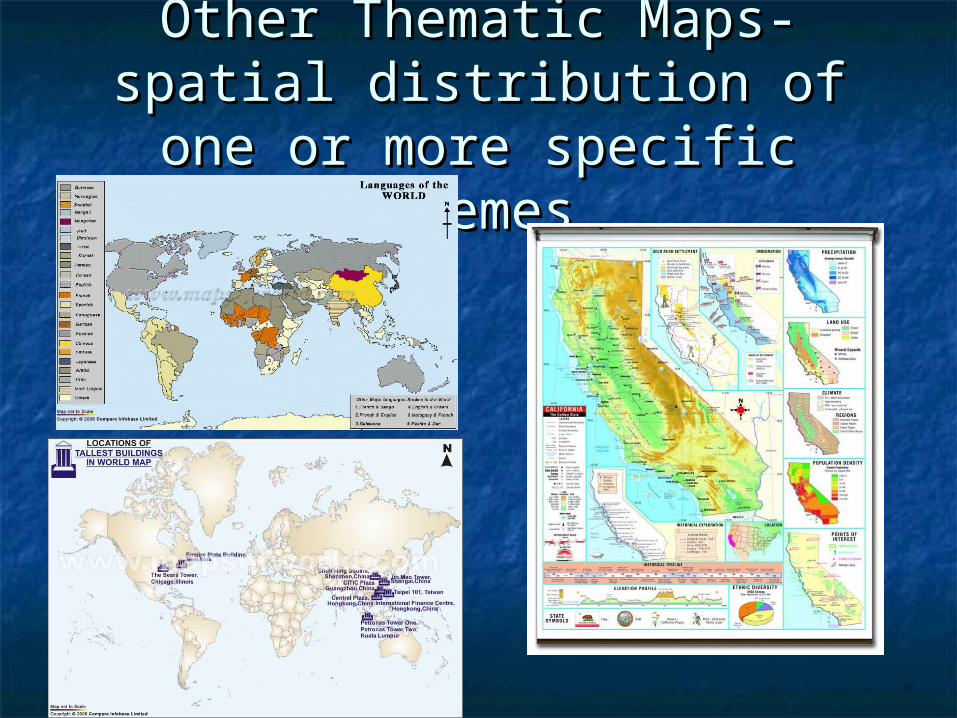
Other Thematic Maps- spatial Other Thematic Maps- spatial distribution of one or more distribution of one or more
specific themesspecific themes
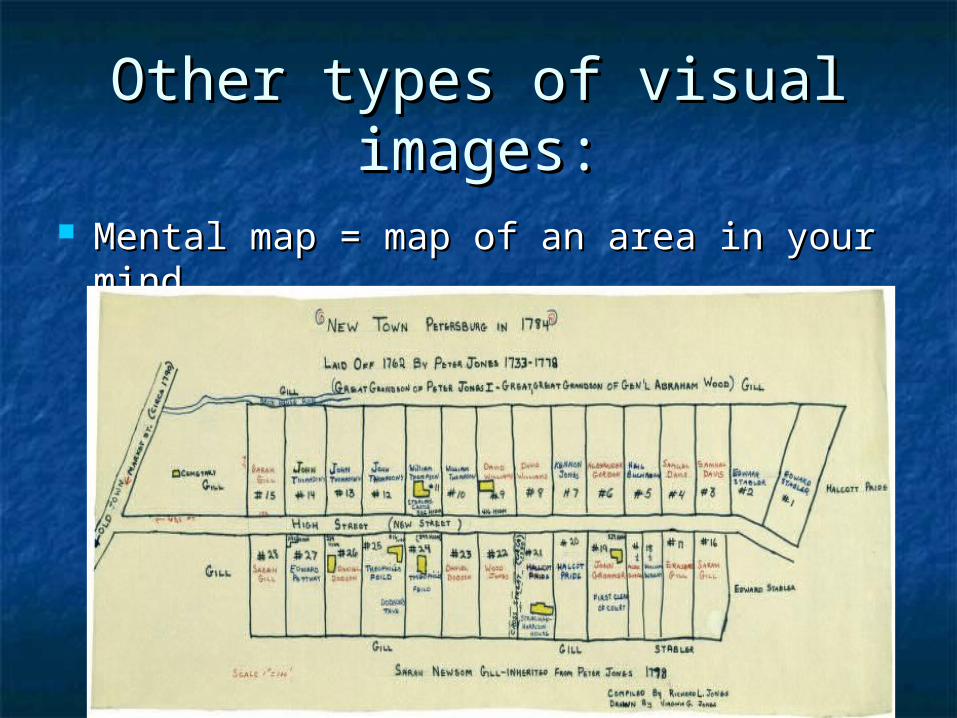
Other types of visual Other types of visual images:images:
Mental map = map of an area in your Mental map = map of an area in your mindmind