Embed Size (px)
Citation preview

MAR 1 4 1934
Federal i-tc .. ■: ;jnk
ffiSrRnancial DataTHE WEEK'S HIGHLIGHTS:t/ The civilian unemployment rate was 6.5 percent in February, down
from January’s rate of 6.7percent. Total civilian employment rose at a strong 2.9 percent annual rate in February.
Consumer installment credit outstanding increased at a 9.5 percent annual rate in January, following an increase of 12.2 percent in December. January’s total was up 7.1 percent from a year earlier.
t/ The composite index of leading indicators increased 0.3 percent in January. Eight of the 11 indicators contributed to the January increase. This was the sixth consecutive monthly increase.
/ Business productivity (output per hour) grew at a 7 percent annual rate in the fourth quarter of 1993, after increasing 3.5 percent in the third quarter. The fourth quarter increase hyw the largest since the second quarter of1983. For 1993, productivity rose 2.1 percent, down from 3.8 percent during 1992.
Views expressed do not necessarily reflect official positions of the Federal Reserve System.
U.S. Financial Data is published weekly by the Research and Public Information Division of the Federal Reserve Bank of St. Louis. The cost for a subscription is as follows:
One year (50 issues) $21 Two years (100 issues) $36To subscribe, please send your check or money order made payable to the Federal Reserve Bank of St. Louis to: Research and Public Information, Federal Reserve Bank of St. Louis, Post Office Box 66953, St. Louis, MO 63166-6953. DO NOT SEND CASH. Checks from foreign subscribers must be payable in U.S. dollars and, except for those from Canada, must be drawn on a U.S. bank.Information in this publication is also included in the Federal Reserve Economic Data (FRED) electronic bulletin board. You can access FRED with a personal computer and a modem at 314-621-1824.
Digitized for FRASER http://fraser.stlouisfed.org Federal Reserve Bank of St. Louis

2
Adjusted Monetary BaseAverages of Daily Figures
Seasonally AdjustedBillions of Dollars Billions of Dollars
1994 Billions
Dec 22 422.3— Jan 5 424.2
428.2Feb 2 431.4
433.9Mar 2 435.9
I 20 3 17 3 17 31 14 21 12 26 9 23 7 21 4 18 I IS 2! 13 27 10 24 8 22 5 19 2 16 2 16 30Jan Feb Mar Apr May Jun Jul Aug Sep Oct Nov Dec Jan Feb Mar
1993 1994Latest data plotted reserve maintenance period ending: March 2, 1994The adjusted monetary base is the sum of reservp accounts of financial institutions at Federal Reserve banks, currency in circulation (currpncy held by the public and in the vaults of all depository institutions! and an adjustment for reserve requirement ratio changes. The major sourcp of the adjusted monetary base is Federal Reserve credit. Data are computed by this bariV. A detailed description of the adjusted monetary base is available from this bank.Recent data are preliminary.
Adjusted Monetary Base
t .. , Compounded annual rates of change, average of two maintenance periods ending:To the average of 3/3/93 5/2B/93 8/4/93 * *two maintenanceperiods ending:
8/4/93 9.09/1/93 9.9 11.4
9/39/93 10.0 11.2 12.710/27/93 10.0 10.9 11.712/8/93 9.1 9.4 9.21/5/94 8.7 8.9 8.42/2/94 9.8 10.3 10.43/2/94 10.3 10.9 11.2
9/1/93 9/29/93 10/27/93 12/8/93 1/5/94
10.27.6 6.47.0 6.0 4.59.6 9.4 9.2 13.2
10.6 10.6 10.8 14.3
Prepared by Federal Reserve Bank of St. Louis
Digitized for FRASER http://fraser.stlouisfed.org Federal Reserve Bank of St. Louis

Money Stock (Ml) and Total Checkable DepositsAverages ot uaiiy FiguresBillions of Dollars Billions of DollarsSeasonally Adjusted
M11994 Billions
Jan 24 1136.3' 31 1136.1
Feb 7 1135.6 14 1139.1 21 1139.2. 28 1140.8
1135 -
M1 (left
right scale)
TCD1994 Billions
Jan 24 802.431 800.5
Feb 7 799.414 802.721 802.0 28 802.3
4 18 1 15 1 15 2§ 12 2i 10 24 7 21 5 1! 2 17 31 14 21Feb Mar Apr May Jun
1993 1994Latest data plotted week ending: February 28, 1994 Current data appear in the Federal Reserve Board's H.6 release.M1 is the sum of currency held by the nonbank public, demand deposits, other checkable deposits and travelers checks.Total checkable deposits is the sum of demand deposits and other checkable deposits at depository institutions.
Money Stock (Ml)
To the average of four weeks
Compounded annual rates of change, average of four weeks ending:3/1/93 5/31/93 7/26/93 8/30/93 9/27/93 10/25/93 11/29/93 12/27/93
ending:
7/26/93 12.48/30/93 11.9 10.29/27/93 11.8 10.5 10.6
10/25/93 11.5 10.2 10.0 10.111/29/93 11.3 10.2 10.1 10.3 9.712/27/93 10.9 9.8 9.5 9.4 8.8 8.81/31/94 10.4 9.2 8.8 8.6 7.9 7.7 6.22/28/94 10.0 8.8 8.4 8.1 7.5 7.2 5.9 5.6
Prepared by Federal Reserve Bank of St. Louis
3Digitized for FRASER http://fraser.stlouisfed.org Federal Reserve Bank of St. Louis

4
Adjusted ReservesBillions of Dollars Seasonally Adjusted Billions of Dollars
1994 Billions
Dec 22 101.2106 — Jan 5 102.2
16 105.5
6 20 3 17 3 17 31 14 21 12 21 9 23 7 21 4 18 1 15 29 13 27 10 24 8 22 5 19 2 II 2 18 30Jan Feb Mar Apr May Jun Jul Aug Sep Oct Nov Dec Jan Feb Mar
1993 1994
110
106
102
98
94
90
86
Latest data plotted two weeks ending: March 2, 1994
Adjusted reserves is the difference between adjusted monetary base and currency component of M1.
Adjusted Reeorvee
To the average ofCompounded annual rates of change, average of two maintenance periods ending:
3/3/93 5/26/93 8/4/93 9/1/93 9/29/93 10/27/93 12/8/93 1/5/94
periods ending:
8/4/93 4.79/1/93 8.0 13.1
9/29/93 7.8 11.6 16.810/27/93 8.3 11.7 15.2 9.412/8/93 5.9 7.5 7.5 2.2 0.51/5/94 5.4 6.6 6.1 1.7 0.4 -4.02/2/94 7.8 9.7 10.5 7.6 7.9 6.7 17.83/2/94 8.7 10.8 11.8 9.5 10.0 9.6 18.7 29.3
Prepared by Federal Reserve Bank of St Louis
Digitized for FRASER http://fraser.stlouisfed.org Federal Reserve Bank of St. Louis

Money Multiplier1/
Averages of Daily Figures Seasonally AdjustedRatio
Compounded annual rates of change, average of the four weeks ending February 28, 1994 from the four weeks ending: Mar 1, 1993 -0.3 May 24, 1993 -1.4 Aug 30, 1993 -2.4 Sep 27, 1993 -3.2 Oct 25, 1993 -2.9 Nov 22, 1993 -6.3 Jan 3, 1994-11.6
Ratio
Dec 20 2.671Jan 3
2.634Feb 14 2.622
2.615
4 18 1 15 1 15 2! 12 28 10 24 7 21 5 19 2 18 30 13 27 11 25 8 22 6 20 17 31 14 28 14 21Feb Mar Apr May Jun Jul Aug Sep Oct Nov Dec Feb Mar
1993Latest data plotted two weeks ending: February 28, 1994
Currency Component of M12/Averages of Daily Figures
Seasonally AdjustedBillions of Dollars340
330
320
310
300
290
1994
Billions of Dollars340-------- 1---------1-------- 1
Compounded annu rates of change, average of the fou weeks ending February 28. 1994 the four weeks en<Mar 1, 1993 1 May 31, 1993 1 Aug 30, 1993 1 SeD 27. 1993 1
al
r
ing:0.81.01.00.8
OcNovDe
25,29,27,
1993 1 1993 1 1993 1
1.32.75.3
1994
Jan 2 3
Bill!
4 321 327 324 321 328 33
___
jns
6.07.6B.3 — B.59.30.6
L_
" Feb122
330
320
3I0
300
2904 18 1 IS 1 15 29 12 26 10 24 7 21 5 19 2 It 30 13 27 11 25
Jan Feb Mar Apr May Jun Jul Aug Sep Oct1993
Latest data plotted week ending: February 28, 1994 1/ Ratio of M1 to adjusted monetary base2/ Current data appear in the Federal Reserve Board’s H.6 release.
8 22 6 20 3 17 31 14 21 14 21 Nov Dec Jan Feb Mar
1994
Prepared by Federal Reserve Bank of St. Louis
5Digitized for FRASER http://fraser.stlouisfed.org Federal Reserve Bank of St. Louis
6
Percentj.o
8.0
7.0
S.O
5.0
3.0
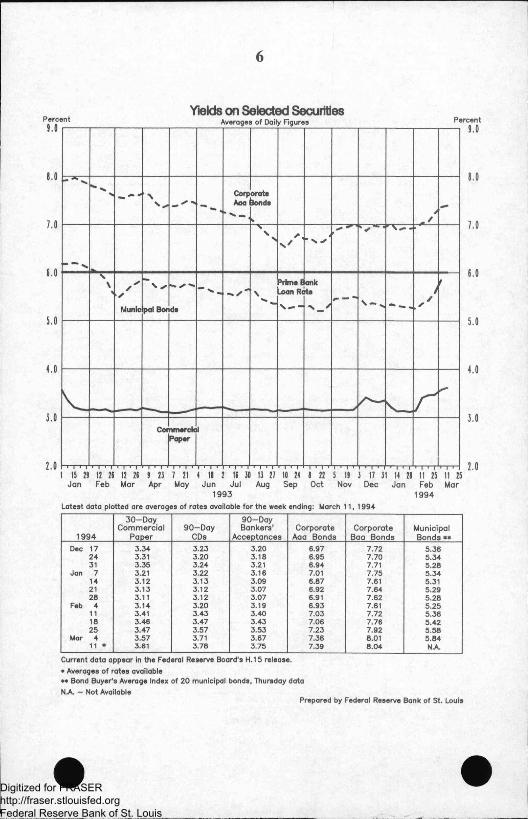
Yields on Selected SecuritiesAverages of Daily Figures
A
V mm \
** *«___________
oratefends
4r /
“ ** X
\\
n' ’ S ✓
<\ ✓/
/
Munic pal Bor d#
*rime B joan Re
N— -
ankte /1✓ /
✓
'
V
Coi nmerckPaper
1
Percent9.0
7.0
(.0
5.0
3.0
I 15 29 12 2! 12 29 9 23 7 21 4 II 2 19 30 13 27 10 24 9 22 5 19 3 17 31 14 29 It 25 11 25Jan Feb Mar Apr May Jun Jul Aug Sep Oct Nov Dec Jan Feb Mar
1993 1994
2.0
Latest data plotted are averages of rates available for the week ending: March 11, 1994
1994
30—Day Commercial
Paper90-Day
CDs
90-DayBankers'
AcceptancesCorporate
Aaa BondsCorporate
Baa BondsMunicipal Bonds **
Dec 17 3.34 3.23 3.20 6.97 7.72 5.3624 3.31 3.20 3.18 6.95 7.70 5.3431 3.35 3.24 3.21 6.94 7.71 5.28
Jan 7 3.21 3.22 3.16 7.01 7.75 5.3414 3.12 3.13 3.09 6.87 7.61 5.3121 3.13 3.12 3.07 6.92 7.64 5.2928 3.11 3.12 3.07 6.91 7.62 5.28
Feb 4 3.14 3.20 3.19 6.93 7.61 5.2511 3.41 3.43 3.40 7.03 7.72 5.3618 3.46 3.47 3.43 7.06 7.76 5.4225 3.47 3.57 3.53 7.23 7.92 5.58
Mar 4 3.57 3.71 3.67 7.36 8.01 5.8411 * 3.61 3.78 3.75 7.39 B.04 NA
Current data appear in the Federal Reserve Board's H.15 release.* Averages of rates available»* Bond Buyer’s Average Index of 20 municipal bonds, Thursday data N.A. - Not Available
Prepared by Federal Reserve Bank of St. Louis
Digitized for FRASER http://fraser.stlouisfed.org Federal Reserve Bank of St. Louis

Percent7.0
6.0
5.0
Selected Interest RatesAverages of Daily Figures
\\
\\ *s
V/
✓/
5-Treaeur
•\
-YearrSectirl
'-* V
ties
s'-4k
J/
f
/
\
FFederal jnde Ra •
\v> v V" - ,n (
>
. U M
Ti3—Mon eoeury
V
hbhi
Oiecour t Rate
Percent7.0
5.0
3.0
1 15 !! 1! 16 II 16 ) 23 7 21 6 11 2 16 36 13 27 10 26 I 22 5 I) 3 17 31 16 21 11 25 11 25Jan Feb Mar Apr May Jun Jul Aug Sep Oct Nov Dec Jan Feb Mar
1993 1994Latest data plotted are averages of rates available for the week ending: March 11,1994
1994Federal Funds **
3-MonthTreasury
Bill
1 —Year Treasury
Bill
5—Year Treasury Securities
10-Year Treasury Securities
Long-TermTreasurySecurities
Dec 17 2.94 3.04 3.47 5.18 5.82 6.2624 2.99 3.06 3.45 5.16 5.79 6.2431 2.99 3.02 3.45 5.14 5.77 6.22
Jan 7 3.00 3.05 3.46 5.21 5.85 6.3014 2.98 2.97 3.38 5.03 5.69 6.1521 3.13 2.96 3.36 5.06 5.74 6.172B 2.97 2.93 3.35 5.05 5.74 6.16
Feb 4 3.17 3.08 3.49 5.14 5.80 6.1811 3.20 3.25 3.69 5.36 5.94 6.3418 3.25 3.27 3.70 5.40 5.95 6.3925 3.25 3.35 3.82 5.60 6.15 6.59
Mar 4 3.28 3.47 3.95 5.74 6.29 6.7211 * 3.25 3.53 4.08 5.82 6.36 6.76
Current data appear in the Federal Reserve Board's H.15 release excluding long-term Treasury securities which are computed by this bank. Treasury bill yields are on a discount basis.* Averages of rates available** Seven-day averages for week ending two days earlier than date shown
Auction average (discount)Prepared by Federal Reserve Bank of St. Louis
7Digitized for FRASER http://fraser.stlouisfed.org Federal Reserve Bank of St. Louis

8
Money Stock (M2) and Non-M1 Components of M2Averages of Daily Figures
Seasonally Adjusted Billions of DollarsBillions of Dollars
M21994 Billions
Jan 24 3575.4 31 3570.2
_ Feb 7 3569.5. 14 3573.9 21 3565.2 28 3571.2
M2 (left scale)
Non-M1 M2
Non-M1 M2 1994 Billions
Jan 24 2439.1 31 2434.1
Feb 7 2433.9 14 2434.8 21 2426.0 28 2430.4
- 2325
4 II I 15 I 15 21 12 21 10 24 7 21 5 1! 2 16 30 13 27 25 8 22 20 3 17 31 14 28 14 28Feb Mar Apr May Jun Aug Sep Oct Nov Feb Mar
1993 1994Latest data plotted week ending: February 28, 1994 Current data appear in the Federal Reserve Board's H.6 release.M2 is the sum of M1, overnight RPs issued by all commercial banks, overnight Eurodollars issued to U.S. residents by foreign branches of U.S. banks, savings (including money market deposit accounts), small time deposits and general purpose and broker/dealer money market mutual funds. For more detail, see the H.6 release.
Money Stock (M2)
To the averageCompounded annual rates of change, average of four weeks ending:
3/1/93 5/31 /93 7/26/93 8/30/93 9/27/93 10/25/93 11/29/93 12/27/93
ending:
7/26/93 2.88/30/93 2.5 1.79/27/93 2.6 2.0 2.1
10/25/93 2.3 1.7 1.6 1.811/29/93 2.5 2.0 2.1 2.4 2.112/27/93 2.5 2.1 2.1 2.4 2.2 2.91/31/94 2.5 2.1 2.2 2.4 2.2 2.7 2.42/28/94 2.2 1.8 1.7 1.8 1.6 1.8 1.3 0.7
Prepared by Federal Reserve Bank of St. Louis
Digitized for FRASER http://fraser.stlouisfed.org Federal Reserve Bank of St. Louis
--------------- y
Billions of Dollars1315
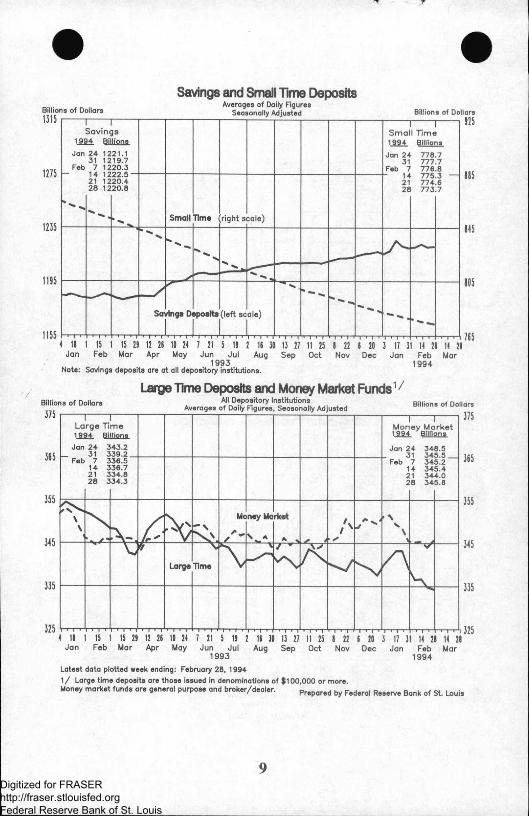
Savings and Small Time DepositsAverages of Daily Figures
Seasonally Adjusted Billions of Dollars925-------- 1---------1---------
Savings1994 Billions
Jan 24 1221.131 1219.7
Feb 7 1220.3
1 1Small Time1994 Billions
Jan 24 778.731 777.7
Feb 7 776.8WCNCN
»
/-C
MCM
/
20.420.8
1-^ Small Time right s sale)
2128
774773
67
***
Sa /Inga D
us posits (left sc
uale) - -.
1275
1235
1195
115
165
105
1155 705♦ II 1 15 1 15 29 12 26 10 26 7 21 5 1! 2 16 JO 13 27 II 25 I 22Jan Feb Mar Apr May Jun Jul Aug Sep Oct Nov
1993Note: Savings deposits are at all depository institutions.
6 20 J 17 31 16 21 16 21 Dec Jan Feb Mar
1994
Large Time Deposits and Money Market Funds1 /All Depository Institutions
Averages of Daily Figures, Seasonally AdjustedBillions of Dollars Billions of Dollars
Large Time Money Market 1994 Billions
Jan 24 348.5 31 345.5 _
Feb 7 345.214 345.4 21 344.028 345.6
1994 BillionsJan 24 343.2
31 339.2Feb 7 336.5
21 334.I
Feb Mar Apr May Jun Jul Aug Sep Oct
Latest data plotted week ending: February 28, 19941/ Large time deposits are those issued in denominations of $100,000 or more.Monsy markot funds ars general purpose and broker/dealer. Pr,par,d by Federal R„e„„ Bank ot st. Louis
9Digitized for FRASER http://fraser.stlouisfed.org Federal Reserve Bank of St. Louis

10
Total BorrowingsFrom Federal Reserve Banks
Billions of Dollars Billions of DollarsAverages of Daily Figures
1994 Billions
Feb 2 0.0519 0.045
16 0.145 23 0.046
Mar 2 0.044 ----9 0.024
i 20 3 17 3 17 31 H 21 12 26 9 23 7 21 1 18 1 15 2J 13 27 10 24 8 22 5 1! 2 16 2 If 30Jan Feb Mar Apr May Jun Jul Aug Sep Oct Nov Dec Jan Feb Mar
1993 1994
Billions of Dollars1.4
Adjustment + Seasonal BorrowingsFrom Federal Reserve Banks
Averages of Daily Figures--------- 1--------- 1---------
1994 Billions
Feb 2 0.9 0.(
16 0. 23 0.(
55154545
546544 — 524
1
9 0.(
l\ 1IA 1 l\j lv
Av\HT-TT
-------- -1 * WTT-T T-l Ky EA '
Billions of Dollars1.4
1.2
1.0
0.8
0.6
0.4
0.2
1.2
1.0
0.4
0.2
0.0i 20Jan
1 17 3 17 31 11 21 12 20 0 23 7 21 4 18 1Feb Mar Apr May Jun Jul Aug
1993
1S 29 13 27 10 24 1 22 5 19 2 10 2 1! JOSep Oct Nov Dec Jan Feb Mar
1994
Latest data plotted week ending: March 9, 1994
Prepared by Federal Reserve Bank of St. Louis
Digitized for FRASER http://fraser.stlouisfed.org Federal Reserve Bank of St. Louis
T
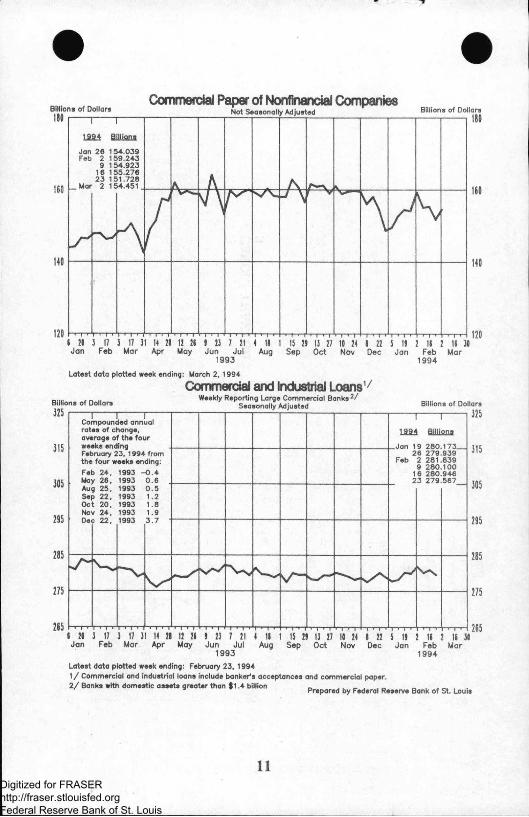
Commercial Paper of Nonfinancial CompaniesNot Seaaonolty AdjustedBillions of Dollars Billions of Dollars
Feb 2 159.2439 154.923
16 155.27623 151.728
Mar 2 154.451
I 2D 3 17 3 17 31 14 21 12 2D J 23 7 21Jan Feb Mar Apr May Jun Jul
1993
4 18 1 15 29 13 27 10 24 8 22 5 19 2 ID 2 16 30Aug Sep Oct Nov Dec Jan Feb Mar
1994Latest data plotted week ending: March 2, 1994
Commercial and Industrial Loans17Weakly Reporting Large Commercial Banks2/
BHhons of Dollars Seasonally Adjusted Billians af Dollars325
315
--------1-------- 1----------Compounded ann rates of change, average of the foi weeks ending February 23, 1994 the four weeks enFeb 24. 1993 - May 26, 1993 Aug 25, 1993 Sep 22, 1993 Oct 20, 1993 Nov 24, 1993
ual
ir1 994
I
Billions
9 280.173_ 6 279.9392 281.8399 280.1006 280.9463 279.567
fromding:0.40.6
2Feb
12
0.51.21.81.9
315
305
205
205
275
205
- 305
295
285
275
205I II 3 17 3 17 II 14 21 12 21Jan Feb Mar Apr May
! 23 7 21 4 11 I 15 2! 13 27 10 24 I 22 5 IIJun Ju! Aug Sep Oct Nov Dec Jan
1993
rn-r-2 14 2 11 31
Feb Mar 1994
Latest data plotted week ending: February 23, 19941/ Commercial and industrial loans include bonkeris acceptances and commercial paper.2/ Banks with domestic assets greater than $1.4 billion „ , , , , ,, .
Prepared by Federal Reserve Bank of St. Louis
11Digitized for FRASER http://fraser.stlouisfed.org Federal Reserve Bank of St. Louis

Dollar's Trade-Weighted Exchange Index1973-100 1973-100Averages of Daily Figures
1994 1973-100
f 20 3 17 3 17 11 14 21 12 28 ! 23 7 21 4 18 15 28 13 27 10 24 8 22 5 1) 2 If 2 If 30Feb Mar Apr May Jun Jul Aug Sep Oct Nov Dec Feb Mar
1993 1994
Latest data plotted week ending: March 9. 1994Current data appear in the Federal Reserve Board's H.10 release.Data are weighted averages of the foreign-currency price of the U.S. dollar, computed U9ing 10 industrial country currencies.
Prepared by Federal Reserve Bank of St. Louis
d§
(»UR
Digitized for FRASER http://fraser.stlouisfed.org Federal Reserve Bank of St. Louis