Embed Size (px)
Citation preview

applied to Port Development and Inland Waterway Transport
Wytze de Boer
March 12, 2018
CHALLINGING WIND AND WAVES
2
applied to port development and inland waterway transport
AGENDA
1. Introduction Wytze de Boer, MARIN
2. Port design & Manoeuvring Simulation (Barranquilla)
3. Inland ship design
4. Operational performance, CoVADEM

1.1 INTRO WYTZE DE BOER
3
• Msc Naval Architecture (1983), MBA (1998)
• Inland waterway transport at Ministry of Transport and Public Works
• “Drifted away” to railways, public transport, financial service industry
• 2013: “Back in the harbour” at MARIN, the inland waterway team;
Optimisation of inland ships. Projects on the intersection of Inland Waterway Transport (IWT) and logistics. Research projects, among others: modelling manoeuvring behaviour of inland ships, modelling the inland waterway traffic flow on Dutch waterways.

1.2 MARIN CLIENTS/DOMAINS
4
Offshore contractors / installation Vessel operators Tugs / Tow operation
Offshore production / monitoring Design & Engineering Port & Waterway design, Safety
Offload / terminal design & operation Inland Waterway Transportation Navies & Governements
FLNGFLNG

1.3 SOME FACTS AND FIGURES
5
• Independent research institute
• Since 1932
• 60 – 100 model tests/yr
• Located in Wageningen (NL), Ede (NL),
Houston (USA)
• Joint Venture in China
• Agent in Brazil
• 8 research facilities
• 5 basins
• 2 full bridge simulators plus separate tug bridge
simulators – single and coupled use
• Calculation clusters ( >4000 cores)
• About 350 employees

1.4 OUR “HEADQUARTERS”
6
video DT, Offsh

2.1 DIFFERENT TOOLS & VIEWPOINTS
Computations
Model testing
Full scale Simulation/Training

2.0 MANOEUVRING SIMULATION
8
Example lock entrance

2.1 EXAMPLE BARRANQUILLA (2016)
9
Evaluation of nautical feasibility of the proposed terminal
1. Exploring and evaluation of various aspects (desk study)
2. Focus on safety of manoeuvring to/from Royal Port using
Real-time manoeuvring simulations
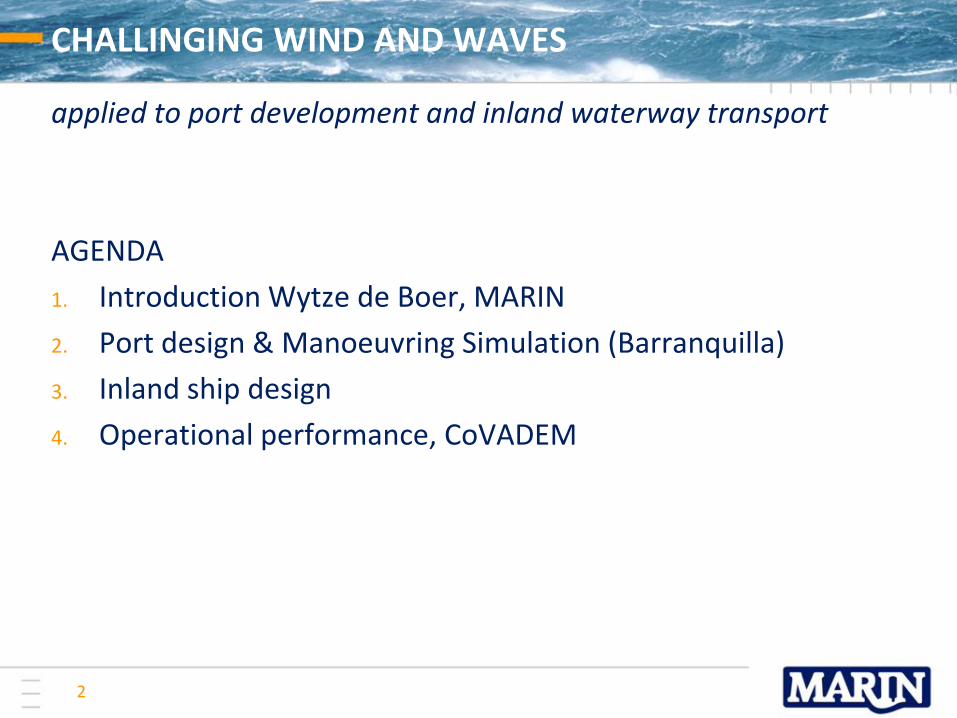
2.2 STUDY OF LOCAL SITUATION
10
1. Two seasons:
• December to April: wind speeds up to 15 m/s ENE directions and low to average river discharges
• May to October: wind speeds up to 10 m/s from more variable directions and average to high river discharges
2. The current speed governed by the river discharge, water levels by the sea
• Current speeds main channel: 0.5 m/s (low discharge) to 3 m/s
• Tidal water level variation about 0.3 m at spring tide
3. Wind is predominantly from NE to E, occasionally S to SW
• wind speeds up to about 15 m/s for ENE; 10 m/s for S to SW
4. Waves just outside the river mouth are predominantly from N Up to Hs = 3.5 – 4 m with peak period around Tp = 10.5 s.

2.3 PORT OF BARRANQUILLA
11
Initial sketch
Optimized plan
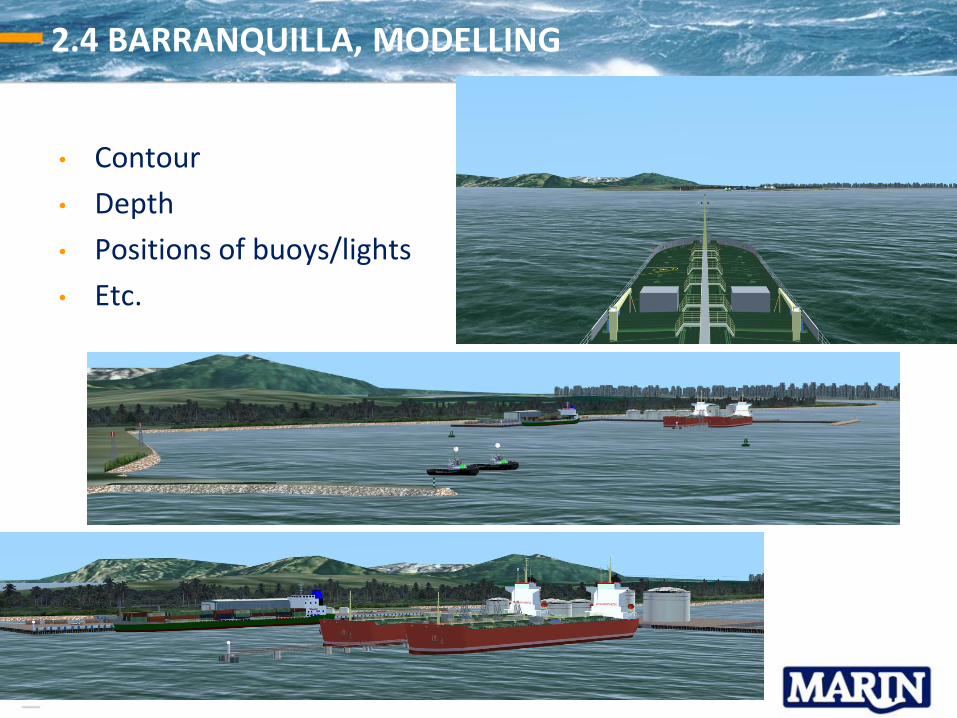
2.4 BARRANQUILLA, MODELLING
12
• Contour
• Depth
• Positions of buoys/lights
• Etc.

2.5 MODELLING THE SHIPS
13
• Ownship (vessel sailing)
• Tanker 200x32 m, draughts of 10 m (partial load) and 6 m (ballast)
• Tugs
• Instructor operated tugs, automated procedures for approach
• Vector force based on capability diagram
• Targets (other traffic, moored or sailing)
These ships restricts manoeuvring space

2.6 FINDINGS
14
1. Manoeuvres to / from the new Royal Port can be carried out safely with the considered tanker of 200x32 m
2. Manoeuvring is possible for the following conditions:
• River discharge up to 11,080 m3/s (3 m/s in main channel)
• Wind speed up to 17 m/s (33 kn); 18 m/s (35 kn, port limit) is also feasible
• Two ASD tugs of about 65 t bollard pull required; third tug standby and ready for use

2.7 FINDINGS
15
6. Berthing is done bow out: more safe
• Escape during berthing is easier
• Anchor can be used in emergency
• Emergency departure from berth in case of calamity
7. Arrival strategy
• First: turn over port sailing forward
• Easier: turn astern over starboard, use current on bow for turning

2.8 FINDINGS
16
7. Strategy arrival manoeuvre (cont.)
• Sail into the area with low currents by heading for the Digue Guia
• Stop the vessel on the line between the head of the jetty and the light on the western breakwater
• Turn astern into turning circle in one smooth manoeuvre;
• Continue the smooth turn and sail astern towards the berth; don’t use tugs (as if the ship is a barge).

2.9 FINDINGS
17
• Effect of training!
Training of the pilots for the new manoeuvres is essential
• Manoeuvres completely new for pilots
• Quite different from present operations in the river
• Include tug masters on free-sailing tugs in training
video 03

3.0 INLAND SHIP DESIGN
18
1. Design for operation
2. Optimisation of hull and propellor
3. Operational performance
In Europe we face (also):
1. longer periods of low water
2. lowering emissions zero emission
3. development of autonomous sailing
3.1 CONCEPT SELECTION (1)
19
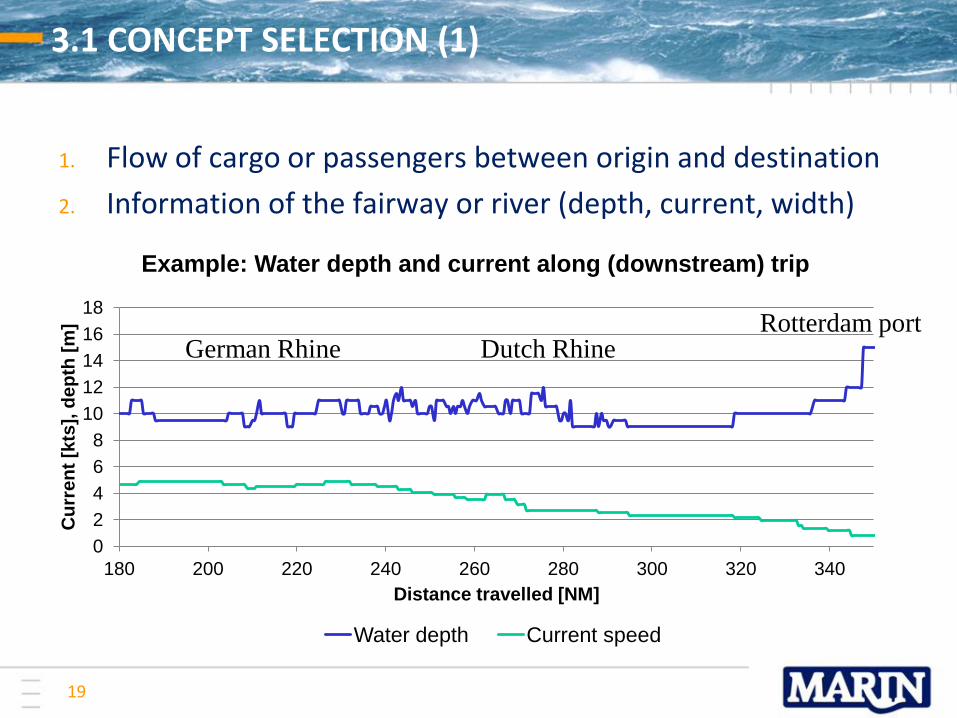
1. Flow of cargo or passengers between origin and destination
2. Information of the fairway or river (depth, current, width)
0
2
4
6
8
10
12
14
16
18
180 200 220 240 260 280 300 320 340
Cu
rre
nt
[kts
], d
ep
th [
m]
Distance travelled [NM]
Example: Water depth and current along (downstream) trip
Water depth Current speed
German Rhine Dutch Rhine Rotterdam port

3.2 CONCEPT SELECTION (2)
20
1. Vessel type (push-barge convoy, self-propelled vessels)
2. Number of ships
3. Compare for fuel consumption, speed, flexibility
0
200
400
600
800
1000
1200
1400
1600
180 200 220 240 260 280 300 320 340
Pro
pu
lsio
n p
ow
er
[kW
]
Distance travelled [NM]
Example: Propulsion power along (downstream) trip

3.3 SHIP DESIGN IN LOGISTIC CHAIN (COUPLED UNIT)
21
Rotterdam Nijmegen
Duisburg
Munster
Berlin
1
2 3
4 5 6
Magdenburg
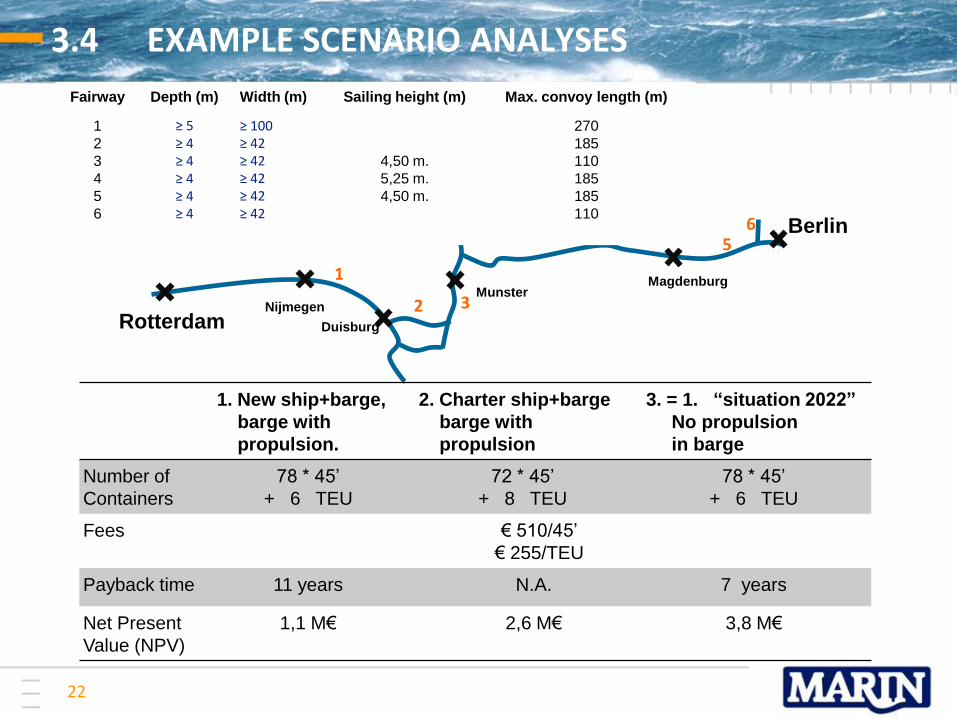
3.4 EXAMPLE SCENARIO ANALYSES
22
1. New ship+barge,
barge with
propulsion.
2. Charter ship+barge
barge with
propulsion
3. = 1. “situation 2022”
No propulsion
in barge
Number of
Containers
78 * 45’
+ 6 TEU
72 * 45’
+ 8 TEU
78 * 45’
+ 6 TEU
Fees € 510/45’
€ 255/TEU
Payback time 11 years N.A. 7 years
Net Present
Value (NPV)
1,1 M€
2,6 M€ 3,8 M€
Fairway Depth (m) Width (m) Sailing height (m) Max. convoy length (m)
1
2
3
4
5
6
≥ 5 ≥ 4
≥ 4
≥ 4
≥ 4
≥ 4
≥ 100
≥ 42 ≥ 42 ≥ 42 ≥ 42 ≥ 42
4,50 m.
5,25 m.
4,50 m.
270
185
110
185
185
110
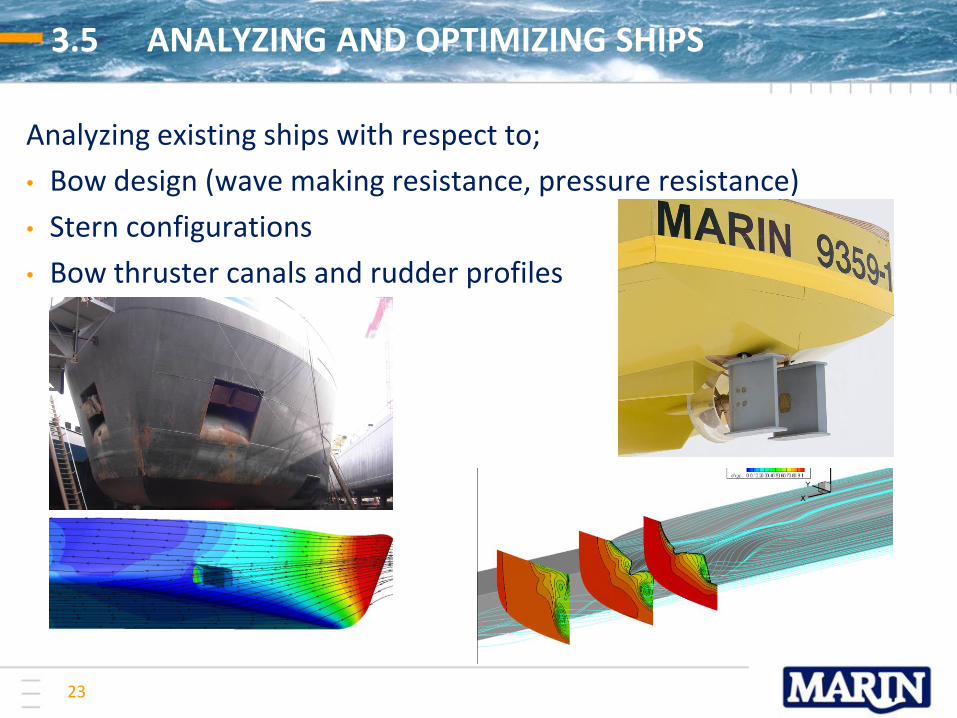
3.5 ANALYZING AND OPTIMIZING SHIPS
23
Analyzing existing ships with respect to;
• Bow design (wave making resistance, pressure resistance)
• Stern configurations
• Bow thruster canals and rudder profiles
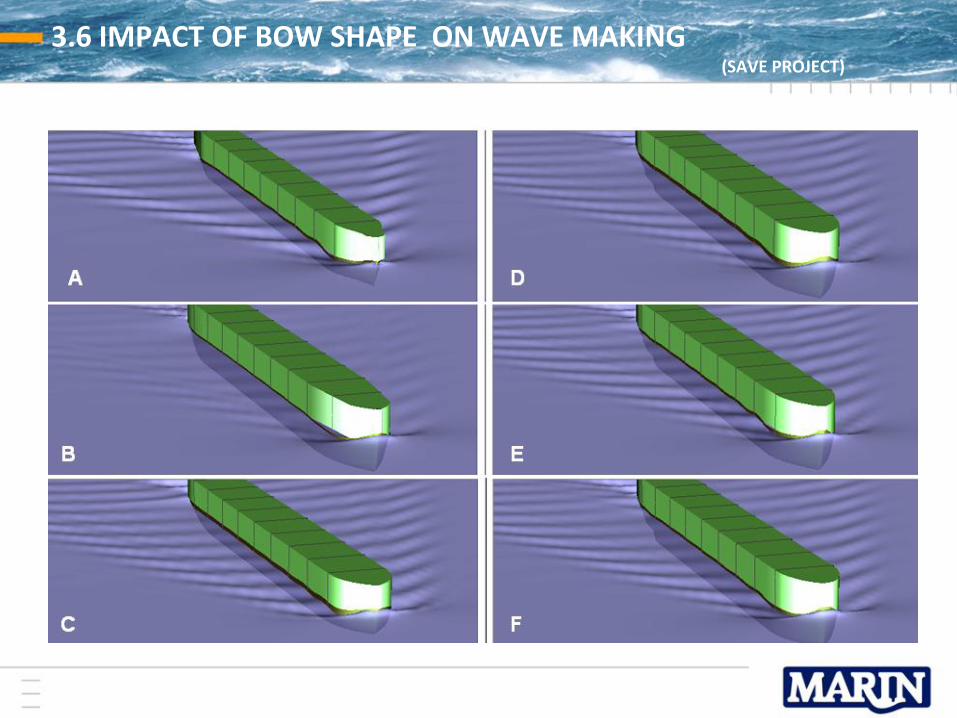
3.6 IMPACT OF BOW SHAPE ON WAVE MAKING (SAVE PROJECT)
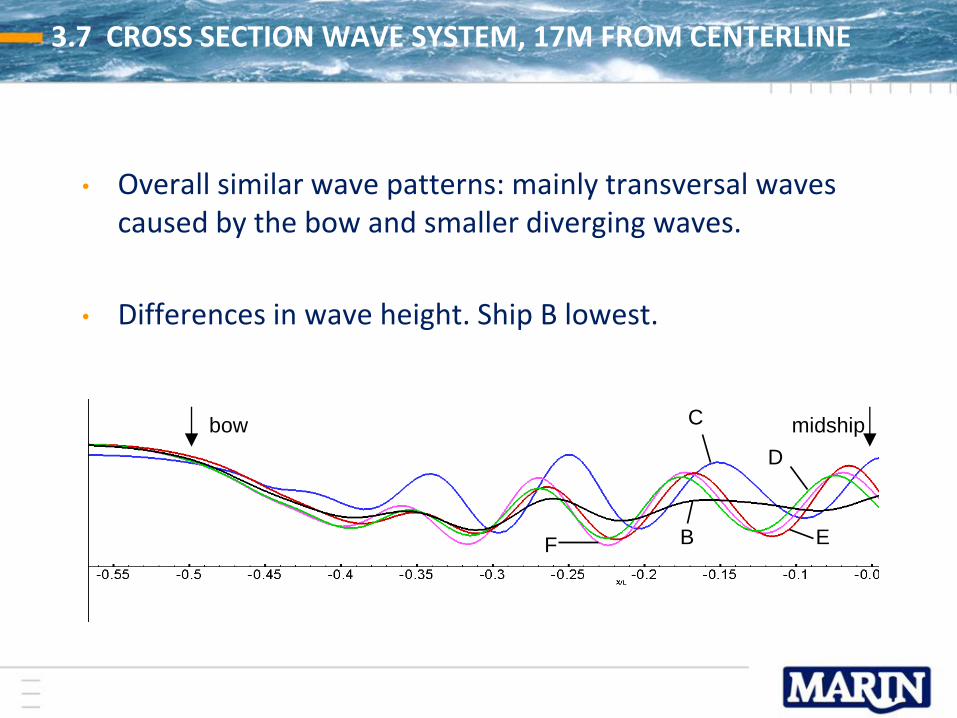
3.7 CROSS SECTION WAVE SYSTEM, 17M FROM CENTERLINE
• Overall similar wave patterns: mainly transversal waves caused by the bow and smaller diverging waves.
• Differences in wave height. Ship B lowest.
bow midship
B E
D
C
F

The differences are small !
Water line 2.0 m, Ship A (oranje), B (black), C (blue), D (green), E (red), F (purple)
3.8 SHAPE OF THE WATERLINES IN THE BOW

3.9 PRESSURE DISTRIBUTION ON THE BOW

3.10 RECENT EXAMPLE: PREPARED FOR HYDROGEN?
28
90m container ship, electric engine around the propeller shaft, generators in “container box shaped” engine rooms in the fore ship, at both sides of the hold, see picture left below.
Engine rooms

3.11 AFT SHIP, TYPICAL DESIGNS WITH TUNNEL AND NOZZLE
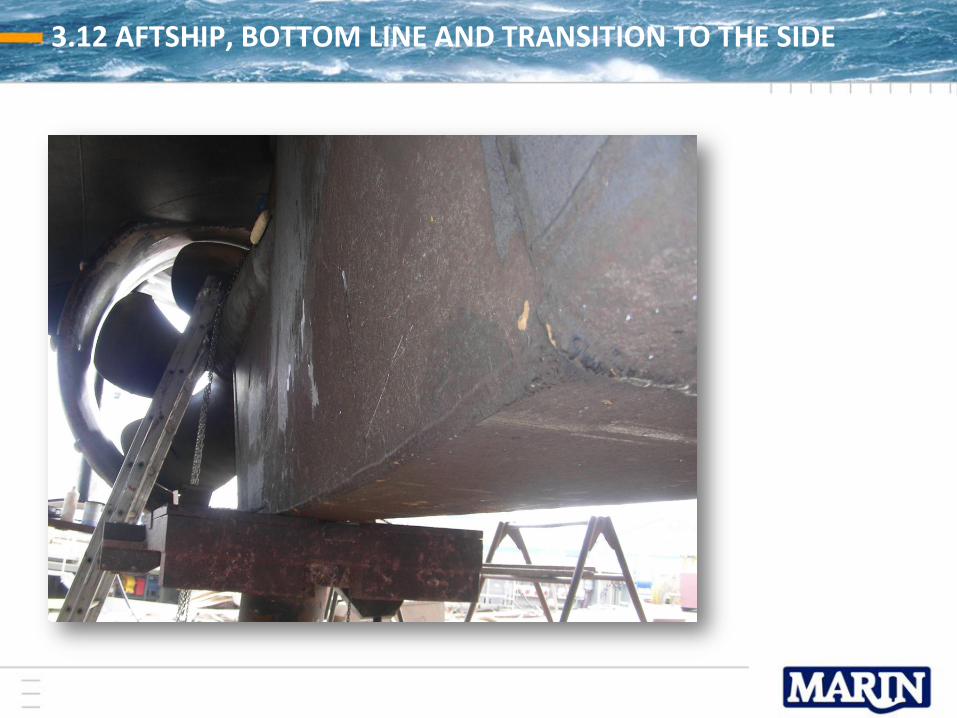
3.12 AFTSHIP, BOTTOM LINE AND TRANSITION TO THE SIDE

3.13 RESEARCH!
31
Topships: a joint industry project to develop a method for improving the hydrodynamic design of an inland ship.
Participants besides MARIN:
The focus
is on the stern, determining impact of different parameters characterizing the stern.
Y - propellor
L - stern

3.14 TUNNEL – NOZZLE CONFIGURATIONS
32
Example research
Inland ship
Without actuator disc
With actuator disc With actuator disc
Without actuator disc
Dynamic pressure coefficient distribution with limiting streamlines for
hull C1711K, ballast condition (left)
hull C1711J, ballast condition (below)
Without actuator disc Without actuator disc
With actuator disc With actuator disc

3.15 PROPELLER DESIGN
33

4.1 OPERATIONAL PERFORMANCE
34
Co-operative Depth Measurements, operational performance

4.2 COVADEM- COLLECTION OF DATA
CARGO
LOAD

4.3 COVADEM NETWORK OF SHIPS
Over 50 Vessels, 6 of them measure also fuel consumption

4.4 WATERDEPTH MAP & APPS FOR PARTICIPANTS
Actual waterdepth chart, derived of ships measurements, corrected for sinkage/trim and applying riverbed models