Embed Size (px)
DESCRIPTION
Â
Citation preview

Grand Strand Market Report Contents Active Inventory 2
SFR Inventory Trends 3
Condo Inventory Trends 4
Closed Sales – SFR 5
Avg. Sales Price – SFR 6
Median Sales Price – SFR 7
Median Sales Price – SFR (Distressed & Non-Distressed) 8
Median Sales Price – SFR (Cash & Conventional Transactions) 9
SFR Sales – (% Cash vs. % Conventional) 10
Sales to List Price Ratio – SFR 11
Closed Sales – Condo 12
Avg. Sales Price – Condo 13
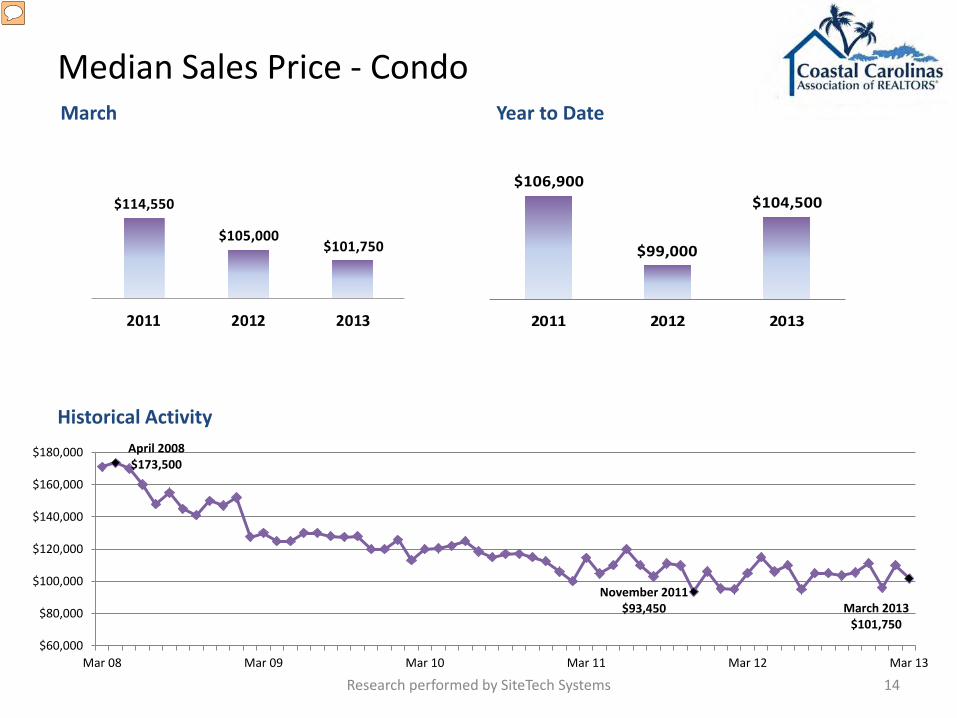
Median Sales Price – Condo 14
Median Sales Price–Condo (Distressed & Non-Distressed) 15
Median Sales Price – Condo (Cash & Conventional Transactions) 16
Condo Sales – (% Cash vs. % Conventional) 17
Sales to List Price Ratio – Condo 18
Closed Sales – Residential Lot 19
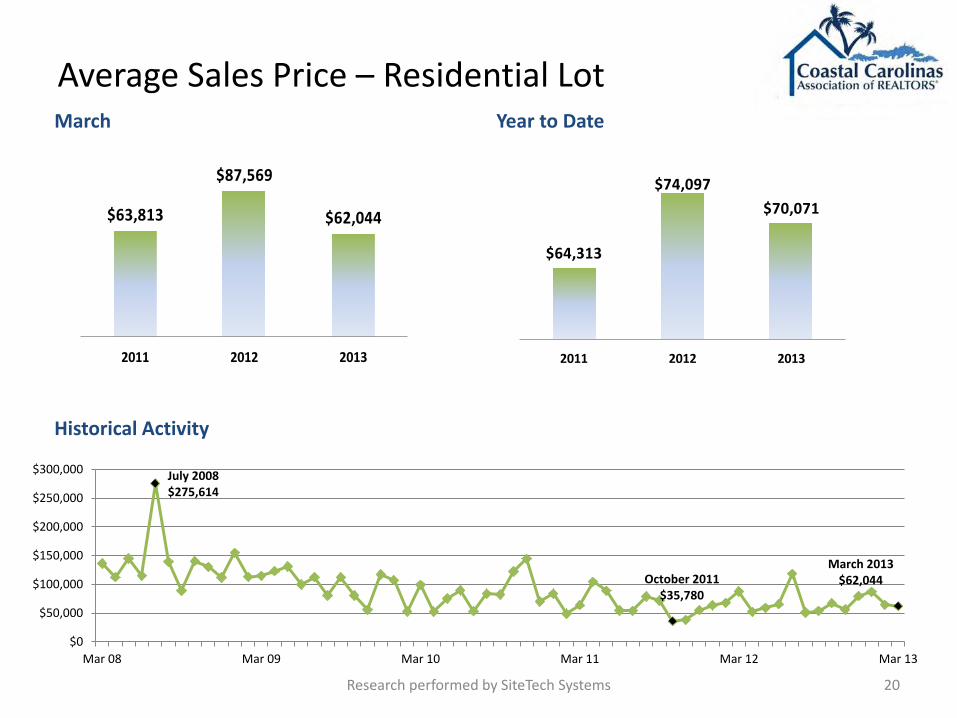
Avg. Sales Price – Residential Lot 20
Median Sales Price – Residential Lot 21
Median Sales Price – Res. Lot (Non-Distressed) 22
Sold to List Price Ratio – Residential Lot 23
Distressed Inventory 24
Distressed Sales 25
March 2013
Research powered by SiteTech Systems
Solid First Quarter for Grand Strand Real Estate Activity…..sales activity up double digits and sales prices have stabilized and rebounded The momentum for the last half of 2012 carried into the first quarter of 2013 in both Single Family Residential (SFR) and Condo activity. In March, SFR sales volume was up 11.6% as compared to March, 2012. This solid growth translated to Year to Date (YTD) sales to be up 11.6% to prior year levels. SFR inventory maintained it seasonal increase and is now 4.6% higher than March 2012 levels. Non distressed listings continued to decline and now represent 12.6% of all SFR listings. Continuing its trend from February, SFR median sales price was $176,000. YTD, the SFR median sales price is $174,990 which is up 3.5% from its 2012 level. The improvement in median sales price is driven by a reduction in the percentage of distressed sales. For condos, the listing inventory increased seasonally but is down 11.7% from its 2012 level. Distressed condo listings continue to decline and are down 33% from its prior year’s level. Condo sales remained strong, up 3.7% for March 2012. YTD, condo sales are up 9.3% from their 2012 level. Driven by cash and distressed sales prices, the median sales price for condos slid to $101,750. However, the YTD median sales price of condo sales are up 4.5% from 2012. After a strong 2012, residential lot sales activity has slowed and are down 8.1% from their 2012 levels. The median sales price of residential lots have remained stable at approximately $35,000.

Grand Strand Active Inventory
Single Family Residential # Listings
Horry Co. 4,000
Georgetown Co. 869
Total 4,869
Average List Price $332,569
Median List Price $224,900
Condo/Townhome # Listings
Horry Co. 3,819
Georgetown Co. 412
Total 4,231
Average List Price $185,137
Median List Price $132,500
Horry Co.
G’town Co.
Less than $150k 1,122 92
$150k - $250k 1,451 188
$250k - $500k 1,075 312
$500k - $1.0 MM 255 157
$1 MM + 97 120
Horry Co.
G’town Co.
Less than $100k 1,304 52
$100k - $150k 972 102
$150k - $200k 601 68
$200k - $400k 715 98
$400k -$750k 183 62
$750+ 44 30
Distribution by Price Range
2 Research performed by SiteTech Systems
Residential Lot # Listings
Horry Co. 1,735
Georgetown Co. 762
Total 2,497
Average List Price $122,981
Median List Price $59,900
Horry Co.
G’town Co.
Less than $25k 294 76
$25k - $50k 680 93
$50k - $75k 249 83
$75k-100k 145 111
$100k-175k 170 149
$175k -250k 82 120
$250k+ 115 130

Grand Strand SFR Inventory Trends
Research performed by SiteTech Systems 3
March 2011 5,033
March 2012 4,656
March 2013 4,869
4,000
4,200
4,400
4,600
4,800
5,000
5,200
5,400
# of
Lis
tings
Grand Strand SFR Inventory
March 2011 873 March 2012
816
March 2013 612
600
650
700
750
800
850
900
950
# of
Dis
tres
sed
List
ings
Grand Strand Distressed SFR Listings

Grand Strand Condo Inventory Trends
Research performed by SiteTech Systems 4
March 2011 5,105
March 2012 4,789
March 2013 4,231
4,0004,2004,4004,6004,8005,0005,2005,4005,600
# of
Lis
tings
Grand Strand Condo Inventory
March 2011 928
March 2012 828
March 2013 556
550600650700750800850900950
1000
# of
Dis
tres
sed
Grand Strand Distressed Condo Listings
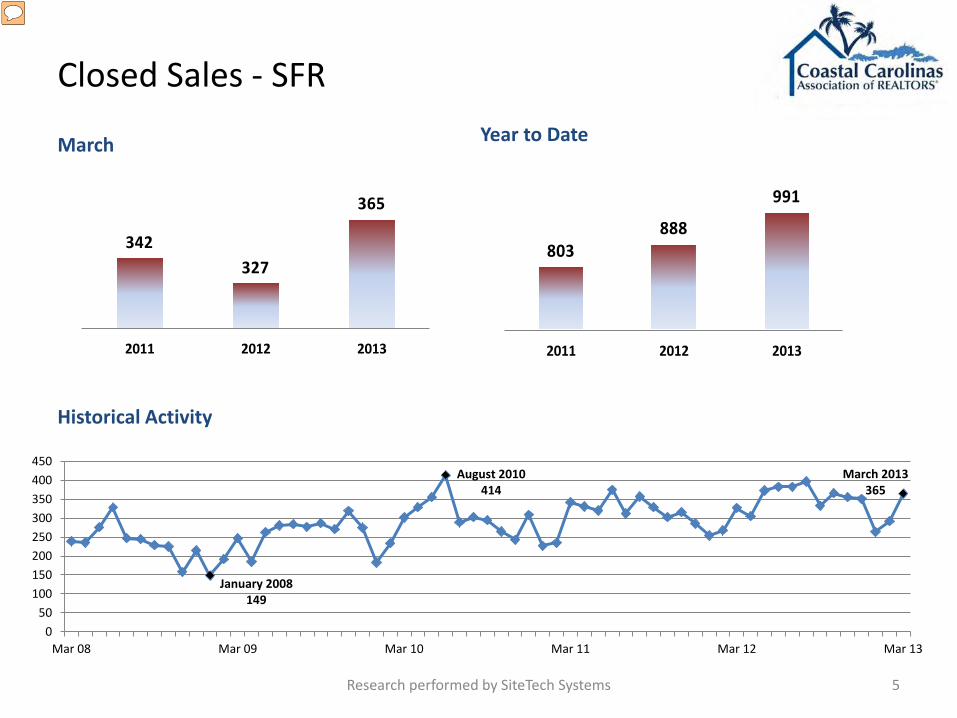
Closed Sales - SFR
March Year to Date
Historical Activity
5 Research performed by SiteTech Systems
342327
365
2011 2012 2013
January 2008 149
August 2010 414
March 2013 365
050
100150200250300350400450
Mar 08 Mar 09 Mar 10 Mar 11 Mar 12 Mar 13
803888
991
2011 2012 2013

Average Sales Price - SFR March Year to Date
Historical Activity
6 Research performed by SiteTech Systems
$240,700
$225,022 $227,943
2011 2012 2013
$226,323
$218,549$221,693
2011 2012 2013
September 2008 $314,788
September 2012 $197,947
March 2013 $227,943
$150,000$170,000$190,000$210,000$230,000$250,000$270,000$290,000$310,000$330,000
Mar 08 Mar 09 Mar 10 Mar 11 Mar 12 Mar 13

Median Sales Price - SFR March
$185,050
$164,445
$176,000
2011 2012 2013
Year to Date
Historical Activity
7 Research performed by SiteTech Systems
$172,000$169,900
$174,990
2011 2012 2013
April 2008 $225,000
November 2012 $154,950
March 2013 $176,000
$150,000
$160,000
$170,000
$180,000
$190,000
$200,000
$210,000
$220,000
$230,000
Mar 08 Mar 09 Mar 10 Mar 11 Mar 12 Mar 13

Median Sales Price – SFR Distressed & Non-Distressed
8 Research performed by SiteTech Systems
100,000
125,000
150,000
175,000
200,000
225,000
250,000
Non-Distressed
Distressed
Combined

Median Sales Price – SFR Cash & Conventional Transactions
9 Research performed by SiteTech Systems
$125,000
$135,000
$145,000
$155,000
$165,000
$175,000
$185,000
$195,000
$205,000
$215,000
$225,000
Mar-11 May-11 Jul-11 Sep-11 Nov-11 Jan-12 Mar-12 May 12 Jul-12 Sep-12 Nov-12 Jan-13 Mar-13
Cash
Conventional
Combined

SFR Sales % Cash vs. % Conventional
Research performed by SiteTech Systems 10
0.0%
10.0%
20.0%
30.0%
40.0%
50.0%
60.0%
70.0%
80.0%
% Cash
% Conventional

Sold to List Price Ratio - SFR March
88%89%
93%
2011 2012 2013
Year to Date
Historical Activity
11 Research performed by SiteTech Systems
88%90%
92%
2011 2012 2013
Mar’-April 2008 92%
April 2011 86%
March 2013 93%
82
84
86
88
90
92
94
Mar 08 Mar 09 Mar 10 Mar 11 Mar 12 Mar 13

Closed Sales - Condo March
374
326338
2011 2012 2013
Year to Date
Historical Activity
12 Research performed by SiteTech Systems
821836
914
2011 2012 2013
January 2009 117
May 2012 383 March 2013
338
050
100150200250300350400450
Mar 08 Mar 09 Mar 10 Mar 11 Mar 12 Mar 13

Average Sales Price - Condo March Year to Date
Historical Activity
13 Research performed by SiteTech Systems
$138,258
$126,869
$132,833
2011 2012 2013
$144,486
$129,825 $129,718
2011 2012 2013
March 08 $228,044
December 2010 $105,000
March 2013 $129,718
$0
$50,000
$100,000
$150,000
$200,000
$250,000
Mar 08 Mar 09 Mar 10 Mar 11 Mar 12 Mar 13
Median Sales Price - Condo March
$114,550
$105,000 $101,750
2011 2012 2013
Year to Date
Historical Activity
14 Research performed by SiteTech Systems
$106,900
$99,000
$104,500
2011 2012 2013
April 2008 $173,500
November 2011 $93,450 March 2013
$101,750
$60,000
$80,000
$100,000
$120,000
$140,000
$160,000
$180,000
Mar 08 Mar 09 Mar 10 Mar 11 Mar 12 Mar 13

Median Sales Price – Condo Distressed & Non-Distressed
15 Research performed by SiteTech Systems
$60,000
$70,000
$80,000
$90,000
$100,000
$110,000
$120,000
$130,000
$140,000M
ar-1
1
Apr-
11
May
-11
Jun-
11
Jul-1
1
Aug-
11
Sep-
11
Oct
-11
Nov
-11
Dec-
11
Jan-
12
Feb-
12
Mar
-12
Apr-
12
May
-12
Jun-
12
Ju1-
12
Aug-
12
Sep-
12
Oct
-12
Nov
-12
Dec-
12
Jan-
13
Feb-
13
Mar
-13
Non-Distressed
Distressed
Combined

Median Sales Price – Condo Cash & Conventional Transactions
16 Research performed by SiteTech Systems
$50,000
$70,000
$90,000
$110,000
$130,000
$150,000
$170,000
Mar
-11
Apr-
11
May
-11
Jun-
11
Jul-1
1
Aug-
11
Sep-
11
11-O
ct
11-N
ov
Dec-
11
Jan-
12
12-F
eb
Mar
-12
Apr-
12
May
-12
Jun-
12
Jul-1
2
Aug-
12
Sep-
12
Oct
-12
Nov
-12
Dec-
12
Jan-
13
Feb-
13
Mar
-13
Cash
Conventional
Combined

Condo Sales % Cash vs. % Conventional
Research performed by SiteTech Systems 17
0.0%
10.0%
20.0%
30.0%
40.0%
50.0%
60.0%
70.0%
80.0%
Mar
-11
Apr-
11
May
-11
Jun-
11
Jul-1
1
Aug-
11
11-S
ep
11-O
ct
11-N
ov
Dec-
11
Jan-
12
12-F
eb
Mar
-12
Apr-
12
May
-12
Jun-
12
Jul-1
2
Aug-
12
Sep-
12
Oct
-12
Nov
-12
Dec-
12
Jan-
13
Feb-
13
Mar
-13
% Cash
% Conventional

Sold to List Price Ratio - Condo March
86%87%
89%
2011 2012 2013
Year to Date
Historical Activity
18 Research performed by SiteTech Systems
87%86%
89%
2011 2012 2013
Feb’-March 2009 81%
August 2012 91%
March 2013 89%
78
80
82
84
86
88
90
92
Mar 08 Mar 09 Mar 10 Mar 11 Mar 12 Mar 13

Closed Sales – Residential Lot
74
8978
2011 2012 2013
Year to Date
Historical Activity
19
March
Research performed by SiteTech Systems
155
234215
2011 2012 2013
January 2009 11
May 2012 121
March 2013 78
0
20
40
60
80
100
120
140
Mar 08 Mar 09 Mar 10 Mar 11 Mar 12 Mar 13
Average Sales Price – Residential Lot March Year to Date
Historical Activity
20 Research performed by SiteTech Systems
$63,813
$87,569
$62,044
2011 2012 2013
$64,313
$74,097 $70,071
2011 2012 2013
July 2008 $275,614
October 2011 $35,780
March 2013 $62,044
$0
$50,000
$100,000
$150,000
$200,000
$250,000
$300,000
Mar 08 Mar 09 Mar 10 Mar 11 Mar 12 Mar 13

Median Sales Price – Residential Lot March
$38,000
$35,000 $34,500
2011 2012 2013
Year to Date
Historical Activity
21 Research performed by SiteTech Systems
$38,000
$35,000 $34,000
2011 2012 2013
May 2008 $106,000
November 2011 $15,000
March 2013 $34,500
$0
$20,000
$40,000
$60,000
$80,000
$100,000
$120,000
Mar 08 Mar 09 Mar10 Mar 11 Mar 12 Mar 13

Median Sales Price – Res. Lot (Non-Distressed) March
$55,775 $53,000
$35,000
2011 2012 2013
Year to Date
Historical Activity
22 Research performed by SiteTech Systems
$41,500
$45,000 $45,000
2011 2012 2013
August 2011 $83,000
October 2011 $23,250
March 2013 $35,000
$- $10,000 $20,000 $30,000 $40,000 $50,000 $60,000 $70,000 $80,000 $90,000

Sold to List Price Ratio – Residential Lot March Year to Date
72%
70%
77%
2011 2012 2013
Historical Activity
23 Research performed by SiteTech Systems
76%
72%
79%
2011 2012 2013
June 2008 93%
November 2011 47%
March 2013 79%
40
50
60
70
80
90
100
Mar 08 Mar 09 Mar 10 Mar 11 Mar 12 Mar 13

Grand Strand Distressed Inventory
Single Family Residential # Listings
Horry Co. 545
Georgetown Co. 67
Total 612
Average List Price $192,396
Median List Price $139,900
Condo/Townhome # Listings
Horry Co. 516
Georgetown Co. 40
Total 556
Average List Price $120,701
Median List Price $89,500
Horry Co.
G’town Co.
Less than $150k 308 27
$150k - $250k 134 23
$250k - $500k 82 10
$500k - $1.0 MM 18 6
$1 MM + 3 1
Distribution by Price Range
24 Research performed by SiteTech Systems
Residential Lot # Listings
Horry Co. 215
Georgetown Co. 85
Total 300
Average List Price $63,679
Median List Price $34,950
Horry Co.
G’town Co.
Less than $25k 73 21
$25k - $50k 83 17
$50k - $75k 28 10
$75k-100k 10 14
$100k-175k 14 13
$175k -250K 3 6
$250K + 4 4
Horry Co.
G’town Co.
Less than $100k 312 16
$100k - $150k 85 8
$150k - $200k 53 4
$200k - $400k 57 8
$400k -$750k 8 4
$750+ 1 -

Distressed Sales Total
Mar May Jul Sep Nov Jan Mar
SFR
Mar May Jul Sep Nov Jan Mar
Condo
25 Research performed by SiteTech Systems
Mar May Jul Sep Nov Jan Mar
% Total Sales
33 28 28 29 29 29 29
23 25 25 27 28 24
Mar May Jul Sept Nov Jan Mar

Be sure to check out our new website for daily updates and breaking news in the real estate and financial markets, also…
“Like” us on Facebook – www.facebook.com/SiteTechSystems
Follow us on Twitter – @SiteTechSystems
www.sitetechsystems.com

Monthly Indicators A RESEARCH TOOL PROVIDED BY THE COASTAL CAROLINAS ASSOCIATION OF REALTORS®
March 2013 Quick Facts
23456789
10111213
All data comes from the Coastal Carolinas Association of REALTORS® Multiple Listing Service. Provided by South Carolina REALTORS®. Powered by 10K Research and Marketing. | 1
+ 3.6%Change in
Closed SalesSingle-Family Only
Click on desired metric to jump to that page.
With spring here in all its bounty, it's time to renew, refresh and revive our understanding of what's fueling the ongoing market recovery. First, tightened inventory levels combined with strong demand are fueling price gains in many areas. Second, consumer demand is shifting from distressed properties to conventional homes. Third, record-low mortgage rates and rising rents are supporting housing recovery. Let's check the local scene.
New Listings in the Coastal Carolinas region were up 9.4 percent for detached homes but decreased 9.5 percent for condos. Pending Sales increased 37.4 percent for single-family homes and 7.8 percent for condos.
The Median Sales Price was up 3.1 percent to $165,000 for single-family properties but decreased 5.2 percent to $97,750 for condo units. Months Supply of Inventory decreased 25.2 percent for single-family units and 30.4 percent for townhouse-condo units.
On the economic front, things inched forward. We saw a minor but important upward revision to Q4-2012 GDP growth that put us back in positive territory. In the political arena, key debates over the deficit, marriage, gun law, immigration reform and tax policy rage onward. The squeaky wheel gets the grease, and with this emerging housing recovery, there are no imminent housing-related bills. Perhaps that's a good thing.
- 4.2%Change in
Closed SalesCondo Only
- 0.1%Change in
Closed SalesAll Properties
Single-Family Market OverviewCondo Market OverviewNew ListingsPending SalesClosed SalesDays On Market Until Sale
Months Supply of Inventory
Median Sales PriceAverage Sales PricePercent of List Price ReceivedHousing Affordability IndexInventory of Homes for Sale
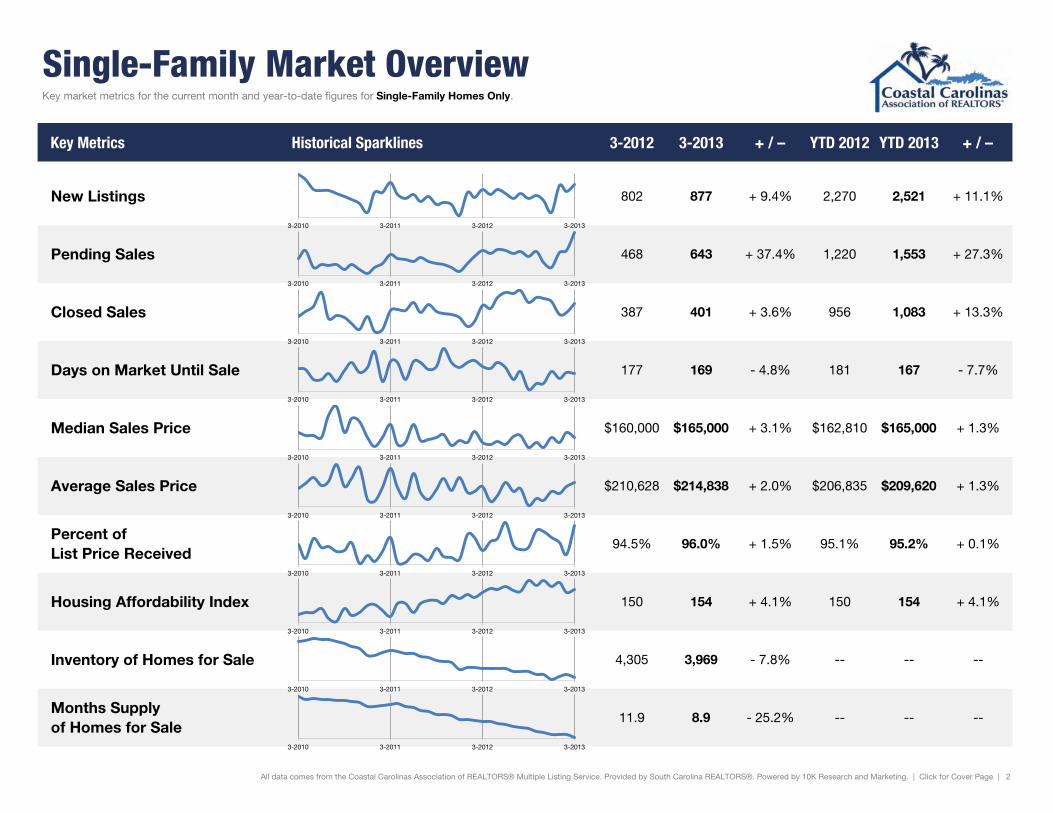
Single-Family Market Overview
Key Metrics Historical Sparklines 3-2012 3-2013 + / – YTD 2012 YTD 2013 + / –
All data comes from the Coastal Carolinas Association of REALTORS® Multiple Listing Service. Provided by South Carolina REALTORS®. Powered by 10K Research and Marketing. | Click for Cover Page | 2
11.9
154 + 4.1%
- 7.8%
- 25.2%
3,969
8.9
150
--
-- --
--
--Months Supplyof Homes for Sale
Inventory of Homes for Sale
$162,810 $165,000
+ 0.1%
- 4.8% 181 167 - 7.7%
+ 1.3%
+ 1.5% 95.1% 95.2%
+ 2.0%
+ 3.1%
+ 11.1%
468 643 + 37.4% 1,220 1,553 + 27.3%
2,521802 877 + 9.4% 2,270
387 401 + 3.6% 956
New Listings
Pending Sales
Closed Sales
94.5% 96.0%
Housing Affordability Index
Days on Market Until Sale
Median Sales Price
Average Sales Price
Percent ofList Price Received
$210,628
Key market metrics for the current month and year-to-date figures for Single-Family Homes Only.
1,083 + 13.3%
150
4,305
177 169
154 + 4.1%
--
$206,835 $209,620 + 1.3%
$160,000 $165,000
$214,838
3-2010 3-2011 3-2012 3-2013
3-2010 3-2011 3-2012 3-2013
3-2010 3-2011 3-2012 3-2013
3-2010 3-2011 3-2012 3-2013
3-2010 3-2011 3-2012 3-2013
3-2010 3-2011 3-2012 3-2013
3-2010 3-2011 3-2012 3-2013
3-2010 3-2011 3-2012 3-2013
3-2010 3-2011 3-2012 3-2013
3-2010 3-2011 3-2012 3-2013
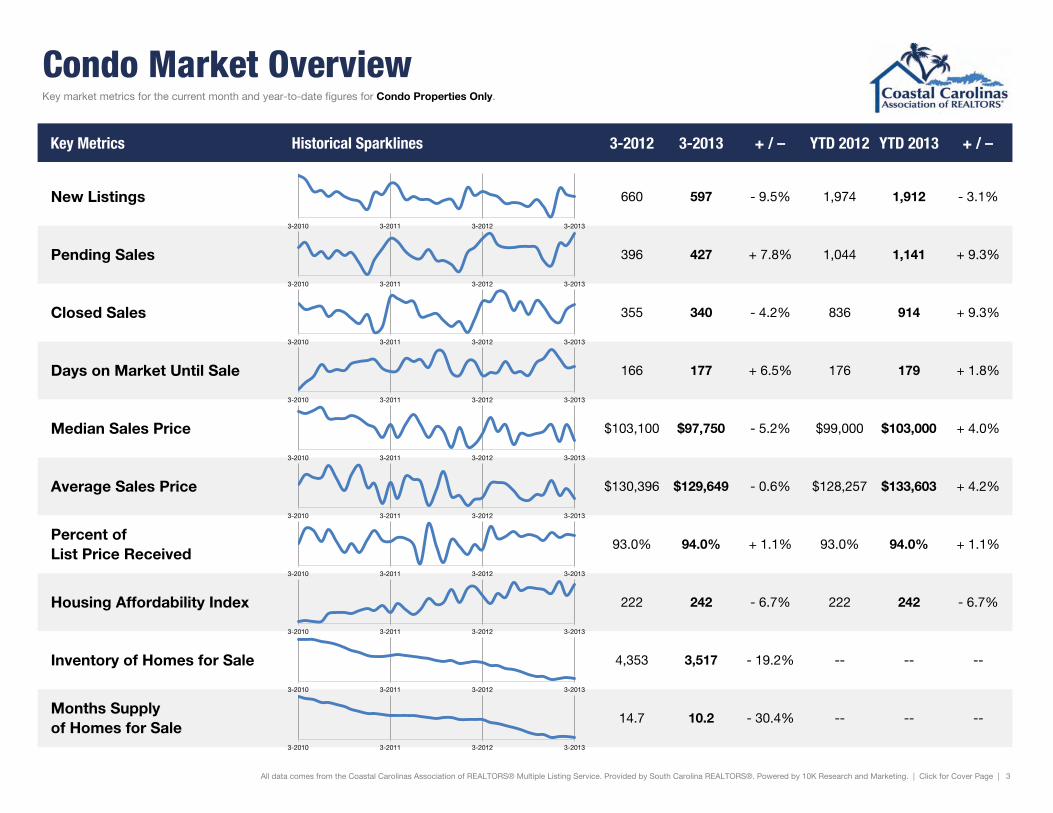
Condo Market Overview
Key Metrics Historical Sparklines 3-2012 3-2013 + / – YTD 2012 YTD 2013 + / –
All data comes from the Coastal Carolinas Association of REALTORS® Multiple Listing Service. Provided by South Carolina REALTORS®. Powered by 10K Research and Marketing. | Click for Cover Page | 3
--
Months Supplyof Homes for Sale
14.7 10.2 - 30.4% -- -- --
Inventory of Homes for Sale 4,353 3,517 - 19.2% -- --
+ 1.1%
Housing Affordability Index 222 242 - 6.7% 222 242 - 6.7%
Percent ofList Price Received
93.0% 94.0% + 1.1% 93.0% 94.0%
+ 4.0%
Average Sales Price $130,396 $129,649 - 0.6% $128,257 $133,603 + 4.2%
Median Sales Price $103,100 $97,750 - 5.2% $99,000 $103,000
+ 9.3%
Days on Market Until Sale 166 177 + 6.5% 176 179 + 1.8%
Closed Sales 355 340 - 4.2% 836 914
Key market metrics for the current month and year-to-date figures for Condo Properties Only.
- 3.1%
Pending Sales 396 427 + 7.8% 1,044 1,141 + 9.3%
New Listings 660 597 - 9.5% 1,974 1,912
3-2010 3-2011 3-2012 3-2013
3-2010 3-2011 3-2012 3-2013
3-2010 3-2011 3-2012 3-2013
3-2010 3-2011 3-2012 3-2013
3-2010 3-2011 3-2012 3-2013
3-2010 3-2011 3-2012 3-2013
3-2010 3-2011 3-2012 3-2013
3-2010 3-2011 3-2012 3-2013
3-2010 3-2011 3-2012 3-2013
3-2010 3-2011 3-2012 3-2013

New Listings
MonthSingle-Family
YoYChg.
CondoYoYChg.
April 740 0.0% 617 - 15.8%
May 807 + 17.5% 598 + 7.9%
June 755 + 2.7% 504 - 15.4%
July 688 + 6.2% 519 - 5.8%
August 755 + 6.3% 498 - 10.8%
September 688 + 14.3% 457 - 9.3%
October 731 + 15.7% 549 + 1.3%
November 664 + 9.8% 467 - 16.3%
December 505 + 10.5% 338 - 23.7%
January 863 + 13.0% 700 - 0.7%
February 781 + 10.9% 615 + 1.0%
March 877 + 9.4% 597 - 9.5%
Total 8,854 + 9.5% 6,562 - 8.2%
+
All data comes from the Coastal Carolinas Association of REALTORS® Multiple Listing Service. Provided by South Carolina REALTORS®. Powered by 10K Research and Marketing. | Click for Cover Page | 4
A count of the properties that have been newly listed on the market in a given month.
902
759 802
660
877
597
Single-Family Condo
March
0
250
500
750
1,000
1,250
1-2004 1-2005 1-2006 1-2007 1-2008 1-2009 1-2010 1-2011 1-2012 1-2013
Historical New Listing Activity Single-Family Condo
-9.5% -13.0% +9.4% -11.1%
2013 2012 2011 2013 2012 2011
2,437
2,030
2,270
1,974
2,521
1,912
Single-Family Condo
Year to Date
-3.1% -2.8% +11.1% -6.9%
2013 2012 2011 2013 2012 2011

Pending Sales
MonthSingle-Family
YoYChg.
CondoYoYChg.
April 436 + 12.7% 427 + 13.6%
May 475 + 23.7% 357 + 13.0%
June 466 + 28.4% 342 + 23.0%
July 436 + 10.1% 343 + 26.6%
August 462 + 29.8% 349 + 5.8%
September 408 + 19.3% 347 + 32.4%
October 461 + 38.9% 338 + 31.0%
November 347 + 16.4% 263 + 11.9%
December 302 + 15.3% 227 + 18.2%
January 445 + 30.5% 363 + 17.1%
February 465 + 13.1% 351 + 3.8%
March 643 + 37.4% 427 + 7.8%
Total 5,346 + 23.2% 4,189 + 16.1%
+
All data comes from the Coastal Carolinas Association of REALTORS® Multiple Listing Service. Provided by South Carolina REALTORS®. Powered by 10K Research and Marketing. | Click for Cover Page | 5
A count of the properties on which contracts have been accepted in a given month.
426 397
468
396
643
427
Single-Family Condo
March
0
250
500
750
1,000
1,250
1-2004 1-2005 1-2006 1-2007 1-2008 1-2009 1-2010 1-2011 1-2012 1-2013
Historical Pending Sales Activity Single-Family Condo
+7.8% -0.3% +37.4% +9.9%
2013 2012 2011 2013 2012 2011
1,061 999
1,220
1,044
1,553
1,141
Single-Family Condo
Year to Date
+9.3% +4.5% +27.3% +15.0%
2013 2012 2011 2013 2012 2011

Closed Sales
MonthSingle-Family
YoYChg.
CondoYoYChg.
April 370 + 1.1% 355 - 4.8%
May 429 + 19.2% 405 + 14.7%
June 457 + 12.8% 393 + 10.7%
July 452 + 29.5% 312 + 9.9%
August 468 + 19.4% 356 + 23.2%
September 402 + 13.9% 292 - 2.0%
October 434 + 26.5% 362 + 36.6%
November 427 + 26.7% 333 + 39.3%
December 411 + 27.2% 277 + 6.9%
January 335 + 22.7% 254 + 21.0%
February 347 + 17.2% 320 + 18.1%
March 401 + 3.6% 340 - 4.2%
Total 4,933 + 17.9% 4,057 + 13.0%
+
All data comes from the Coastal Carolinas Association of REALTORS® Multiple Listing Service. Provided by South Carolina REALTORS®. Powered by 10K Research and Marketing. | Click for Cover Page | 6
A count of the actual sales that have closed in a given month.
362 379 387
355
401
340
Single-Family Condo
March
0
250
500
750
1,000
1,250
1-2004 1-2005 1-2006 1-2007 1-2008 1-2009 1-2010 1-2011 1-2012 1-2013
Historical Closed Sales Activity Single-Family Condo
-4.2% -6.3% +3.6% +6.9%
2013 2012 2011 2013 2012 2011
857 828
956
836
1,083
914
Single-Family Condo
Year to Date
+9.3% +1.0% +13.3% +11.6%
2013 2012 2011 2013 2012 2011

Days on Market Until Sale
MonthSingle-Family
YoYChg.
CondoYoYChg.
April 175 - 3.8% 170 - 1.0%
May 182 + 13.0% 170 - 9.3%
June 176 - 4.4% 183 - 0.2%
July 162 - 11.3% 169 - 8.5%
August 172 - 1.0% 171 - 2.8%
September 149 - 16.1% 166 - 15.3%
October 157 - 21.3% 182 - 6.8%
November 157 - 14.2% 187 + 10.7%
December 172 - 2.7% 199 + 20.3%
January 163 - 10.9% 188 + 2.6%
February 170 - 8.2% 175 - 4.8%
March 169 - 4.8% 177 + 6.5%
Total 167 - 7.3% 178 - 1.1%
+
All data comes from the Coastal Carolinas Association of REALTORS® Multiple Listing Service. Provided by South Carolina REALTORS®. Powered by 10K Research and Marketing. | Click for Cover Page | 7
Average number of days between when a property is listed and when an offer is accepted in a given month.
184
171 177
166 169 177
Single-Family Condo
March
0
50
100
150
200
250
300
350
400
1-2004 1-2005 1-2006 1-2007 1-2008 1-2009 1-2010 1-2011 1-2012 1-2013
Historical Days on Market Until Sale Single-Family Condo
+6.5% -2.9% -4.8% -3.6%
2013 2012 2011 2013 2012 2011
180 176 181
176 167
179
Single-Family Condo
Year to Date
+1.8% +0.1% -7.7% +0.7%
2013 2012 2011 2013 2012 2011

Median Sales Price
MonthSingle-Family
YoYChg.
CondoYoYChg.
April 158,000 + 0.0% 115,500 + 15.5%
May 161,000 + 0.6% 105,000 - 4.5%
June 158,000 - 11.2% 110,000 - 6.4%
July 165,500 + 2.0% 95,000 - 13.6%
August 166,275 + 2.3% 102,897 + 3.0%
September 154,900 - 5.7% 102,000 - 6.2%
October 159,900 - 4.5% 103,000 - 1.9%
November 155,000 - 1.3% 104,500 + 13.6%
December 164,505 + 1.4% 110,000 + 2.3%
January 159,900 0.0% 97,000 + 3.7%
February 170,100 - 0.2% 110,000 + 15.8%
March 165,000 + 3.1% 97,750 - 5.2%
Median 160,318 - 2.1% 106,000 - 0.9%
+
All data comes from the Coastal Carolinas Association of REALTORS® Multiple Listing Service. Provided by South Carolina REALTORS®. Powered by 10K Research and Marketing. | Click for Cover Page | 8
Median price point for all closed sales, not accounting for seller concessions, in a given month.
$178,000
$109,950
$160,000
$103,100
$165,000
$97,750
Single-Family Condo
March
$75,000
$100,000
$125,000
$150,000
$175,000
$200,000
$225,000
$250,000
$275,000
1-2004 1-2005 1-2006 1-2007 1-2008 1-2009 1-2010 1-2011 1-2012 1-2013
Historical Median Sales Price Single-Family Condo
-5.2% -6.2% +3.1% -10.1%
2013 2012 2011 2013 2012 2011
$167,000
$105,000
$162,810
$99,000
$165,000
$103,000
Single-Family Condo
Year to Date
+4.0% -5.7% +1.3% -2.5%
2013 2012 2011 2013 2012 2011

Average Sales Price
MonthSingle-Family
YoYChg.
CondoYoYChg.
April 193,856 - 7.3% 143,335 + 10.5%
May 200,760 + 2.2% 143,856 - 3.7%
June 215,229 - 4.5% 142,841 - 2.6%
July 205,259 + 0.9% 136,806 - 5.8%
August 208,073 + 6.4% 129,716 + 5.1%
September 188,817 - 9.1% 128,539 - 6.6%
October 197,277 - 10.3% 133,098 - 13.7%
November 194,581 - 5.4% 133,763 + 1.3%
December 205,273 - 7.2% 146,179 + 10.0%
January 202,825 - 0.2% 132,793 + 7.7%
February 210,094 + 2.4% 138,392 + 7.0%
March 214,838 + 2.0% 129,649 - 0.6%
Average 188,547 - 1.6% 136,814 + 0.3%
+
All data comes from the Coastal Carolinas Association of REALTORS® Multiple Listing Service. Provided by South Carolina REALTORS®. Powered by 10K Research and Marketing. | Click for Cover Page | 9
Average sales price for all closed sales, not accounting for seller concessions, in a given month.
$231,185
$143,768
$210,628
$130,396
$214,838
$129,649
Single-Family Condo
March
$100,000
$150,000
$200,000
$250,000
$300,000
$350,000
1-2004 1-2005 1-2006 1-2007 1-2008 1-2009 1-2010 1-2011 1-2012 1-2013
Historical Average Sales Price Single-Family Condo
- 0.6% - 9.3% + 2.0% - 8.9%
2013 2012 2011 2013 2012 2011
$214,071
$138,482
$206,835
$128,257
$209,620
$133,603
Single-Family Condo
Year to Date
+ 4.2% - 7.4% + 1.3% - 3.4%
2013 2012 2011 2013 2012 2011

Percent of List Price Received
MonthSingle-Family
YoYChg.
CondoYoYChg.
April 95.1% + 1.3% 94.7% + 1.0%
May 95.2% + 1.4% 93.7% - 0.1%
June 96.1% + 1.9% 93.9% + 0.6%
July 94.9% + 0.6% 94.3% + 2.6%
August 94.6% + 0.7% 93.9% - 1.1%
September 94.8% + 0.1% 94.0% + 0.9%
October 95.7% + 1.5% 93.9% + 2.1%
November 95.6% + 1.6% 93.6% - 0.1%
December 95.3% + 1.3% 94.2% + 1.1%
January 95.0% - 0.5% 93.8% + 1.3%
February 94.3% - 1.0% 94.1% + 0.9%
March 96.0% + 1.5% 94.0% + 1.1%
Average 91.3% + 2.8% 89.0% + 1.9%
+
All data comes from the Coastal Carolinas Association of REALTORS® Multiple Listing Service. Provided by South Carolina REALTORS®. Powered by 10K Research and Marketing. | Click for Cover Page | 10
Percentage found when dividing a property’s sales price by its last list price, then taking the average for all properties sold in a given month, not accounting for seller concessions.
95.3% 93.5% 94.5% 93.0% 96.0% 94.0%
Single-Family Condo
March
90%
92%
94%
96%
98%
100%
1-2004 1-2005 1-2006 1-2007 1-2008 1-2009 1-2010 1-2011 1-2012 1-2013
Historical Percent of List Price Received Single-Family Condo
+1.1% -0.5% +1.5% -0.8%
2013 2012 2011 2013 2012 2011
94.7% 93.8% 95.1% 93.0% 95.2% 94.0%
Single-Family Condo
Year to Date
+1.1% -0.8% +0.1% +0.4%
2013 2012 2011 2013 2012 2011

Housing Affordability Index
MonthSingle-Family
YoYChg.
CondoYoYChg.
April 154 + 21.7% 207 + 16.9%
May 154 + 12.1% 225 + 0.6%
June 157 + 11.2% 219 + 15.6%
July 153 + 22.5% 246 + 16.8%
August 152 + 11.1% 232 + 25.3%
September 163 + 7.6% 237 + 7.1%
October 158 + 15.2% 234 + 15.1%
November 163 + 14.5% 233 + 11.7%
December 157 + 11.0% 226 + 0.1%
January 161 + 9.5% 249 + 8.7%
February 150 + 9.2% 222 + 6.1%
March 154 + 4.1% 242 - 6.7%
Average 156 + 12.5% 231 + 9.8%
+
This index measures housing affordability for the region. An index of 120 means the median household income was 120% of what is necessary to qualify for the median-priced home under prevailing interest rates. A higher number means greater affordability.
All data comes from the Coastal Carolinas Association of REALTORS® Multiple Listing Service. Provided by South Carolina REALTORS®. Powered by 10K Research and Marketing. | Click for Cover Page | 11
124
190
150
222
154
242
Single-Family Condo
March
75
100
125
150
175
200
225
250
275
1-2008 1-2009 1-2010 1-2011 1-2012 1-2013
Historical Housing Affordability Index Single-Family Condo
-6.7% +17.2% +4.1% +10.4%
2013 2012 2011 2013 2012 2011
124
190
150
222
154
242
Single-Family Condo
Year to Date
-6.7% +17.2% +4.1% +10.4%
2013 2012 2011 2013 2012 2011

Inventory of Homes for Sale
MonthSingle-Family
YoYChg.
CondoYoYChg.
April 4,306 - 11.7% 4,222 - 11.2%
May 4,290 - 10.9% 4,187 - 11.4%
June 4,279 - 11.1% 4,067 - 13.5%
July 4,202 - 10.9% 3,978 - 14.3%
August 4,208 - 10.0% 3,889 - 14.5%
September 4,189 - 8.2% 3,737 - 16.5%
October 4,081 - 10.0% 3,664 - 17.5%
November 4,090 - 9.4% 3,630 - 18.5%
December 3,925 - 7.6% 3,474 - 19.2%
January 4,011 - 7.0% 3,548 - 19.1%
February 4,078 - 5.5% 3,597 - 18.1%
March 3,969 - 7.8% 3,517 - 19.2%
Average 3,164 - 8.8% 3,594 - 19.0%
+
All data comes from the Coastal Carolinas Association of REALTORS® Multiple Listing Service. Provided by South Carolina REALTORS®. Powered by 10K Research and Marketing. | Click for Cover Page | 12
The number of properties available for sale in active status at the end of a given month.
4,917 4,717 4,305 4,353
3,969 3,517
Single-Family Condo
March
500
1,500
2,500
3,500
4,500
5,500
6,500
1-2004 1-2005 1-2006 1-2007 1-2008 1-2009 1-2010 1-2011 1-2012 1-2013
Historical Inventory of Homes for Sale Single-Family Condo
-19.2% -7.7% -7.8% -12.4%
2013 2012 2011 2013 2012 2011

Months Supply of Inventory
MonthSingle-Family
YoYChg.
CondoYoYChg.
April 11.8 - 22.6% 14 - 11.4%
May 11.5 - 21.8% 13.8 - 11.9%
June 11.2 - 23.1% 13.1 - 16.4%
July 10.9 - 22.1% 12.6 - 18.8%
August 10.7 - 22.4% 12.3 - 19.3%
September 10.5 - 20.9% 11.5 - 23.5%
October 9.9 - 24.3% 11.1 - 27.1%
November 9.9 - 24.2% 10.9 - 28.7%
December 9.4 - 22.9% 10.3 - 29.6%
January 9.4 - 23.2% 10.4 - 29.6%
February 9.5 - 21.4% 10.5 - 28.9%
March 8.9 - 25.2% 10.2 - 30.4%
Average 8.1 - 26.6% 10.3 - 30.3%
+
All data comes from the Coastal Carolinas Association of REALTORS® Multiple Listing Service. Provided by South Carolina REALTORS®. Powered by 10K Research and Marketing. | Click for Cover Page | 13
The inventory of homes for sale at the end of a given month, divided by the average monthly pending sales from the last 12 months.
15.0 15.7
11.9
14.7
8.9 10.2
Single-Family Condo
March
0
5
10
15
20
25
30
1-2005 1-2006 1-2007 1-2008 1-2009 1-2010 1-2011 1-2012 1-2013
Historical Months Supply of Inventory Single-Family Condo
-30.4% -6.8% -25.2% -20.8%
2013 2012 2011 2013 2012 2011

March 2013 Quick Facts
$150,001 to $200,000 3 Bedrooms
234567
Housing Supply Overview
+ 16.8% + 19.0%With a full quarter worth of data, the keen market watcher is tracking just how 2013 is stacking up. For the 12-month period spanning April 2012 through March 2013, Closed Sales in the Coastal Carolinas region were up 15.5 percent overall. The price range with the largest gain in sales was the $150,001 to $200,000 range, where they increased 16.8 percent.
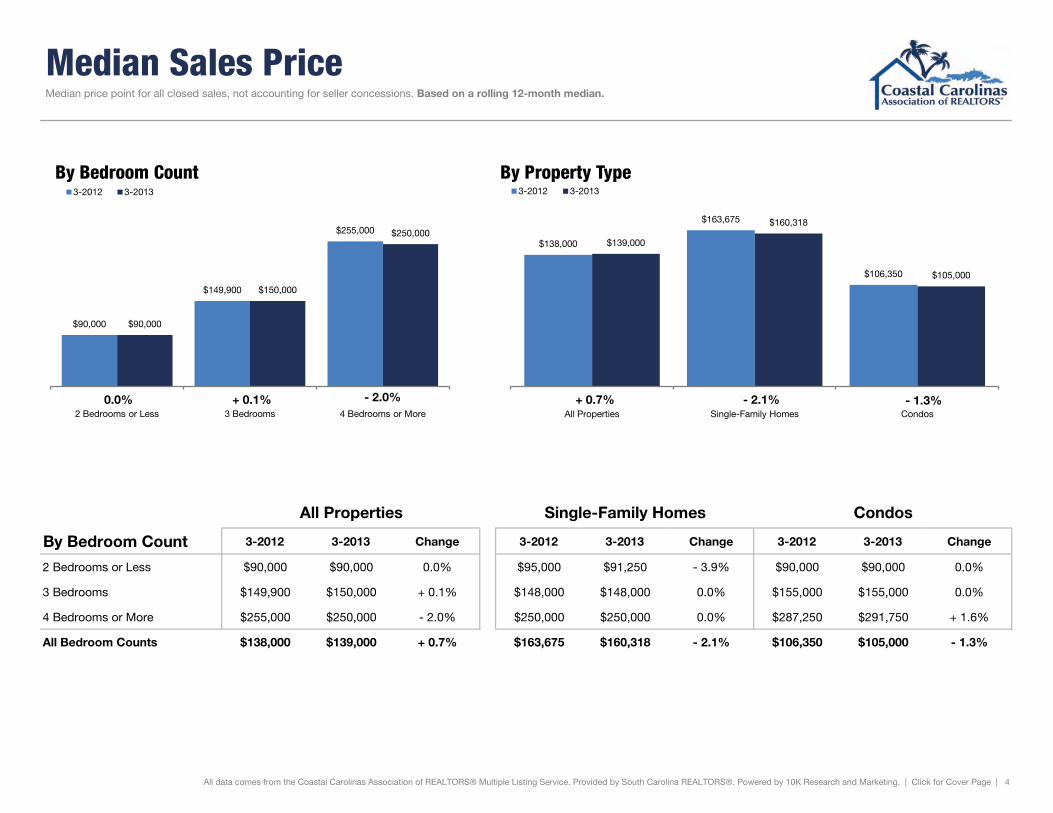
The overall Median Sales Price was up 0.7 percent to $139,000. The property type with the smallest price decline was the Condo segment, where prices decreased 1.3 percent to $105,000. The price range that tended to sell the quickest was the $150,000 and Below range at 159 days; the price range that tended to sell the slowest was the $300,001 and Above range at 213 days.
Market-wide, inventory levels were down 13.5 percent. The property type that lost the least inventory was the Single-Family segment, where it decreased 7.8 percent. That amounts to 8.9 months supply for Single-Family homes and 10.2 months supply for Condos.
+ 18.9%
Click on desired metric to jump to that page.
Price Range With the Strongest Sales:
Bedroom Count With Strongest Sales:
Property Type With Strongest Sales:
Single-Family Homes
A RESEARCH TOOL PROVIDED BY THE COASTAL CAROLINAS ASSOCIATION OF REALTORS®
Closed SalesDays on Market Until SaleMedian Sales PricePercent of List Price ReceivedInventory of Homes for SaleMonths Supply of Inventory
All data comes from the Coastal Carolinas Association of REALTORS® Multiple Listing Service. Provided by South Carolina REALTORS®. Powered by 10K Research and Marketing. | 1

Closed Sales
By Price Range 3-2012 3-2013 Change 3-2012 3-2013 Change 3-2012 3-2013 Change
$150,000 and Below 4,112 4,796 + 16.6% 1,721 2,114 + 22.8% 2,391 2,682 + 12.2%
$150,001 to $200,000 1,346 1,572 + 16.8% 864 1,007 + 16.6% 482 565 + 17.2%
$200,001 to $250,000 800 898 + 12.3% 534 603 + 12.9% 266 295 + 10.9%
$250,001 to $300,000 545 626 + 14.9% 380 436 + 14.7% 165 190 + 15.2%
$300,001 and Above 932 1,040 + 11.6% 685 773 + 12.8% 247 267 + 8.1%
All Price Ranges 7,735 8,932 + 15.5% 3,661 4,356 + 19.0% 3,374 3,767 + 11.6%
By Bedroom Count 3-2012 3-2013 Change 3-2012 3-2013 Change 3-2012 3-2013 Change
2 Bedrooms or Less 2,286 2,605 + 14.0% 251 327 + 30.3% 2,035 2,278 + 11.9%
3 Bedrooms 3,809 4,527 + 18.9% 2,693 3,204 + 19.0% 1,116 1,323 + 18.5%
4 Bedrooms or More 1,368 1,535 + 12.2% 1,240 1,401 + 13.0% 128 134 + 4.7%
All Bedroom Counts 7,735 8,932 + 15.5% 3,661 4,356 + 19.0% 3,374 3,767 + 11.6%
A count of the actual sales that have closed. Based on a rolling 12-month total.
All data comes from the Coastal Carolinas Association of REALTORS® Multiple Listing Service. Provided by South Carolina REALTORS®. Powered by 10K Research and Marketing. | Click for Cover Page | 2
All Properties Single-Family Homes Condos
4,112
1,346
800 545
932
4,796
1,572
898 626
1,040
$150,000 and Below
$150,001 to $200,000
$200,001 to $250,000
$250,001 to $300,000
$300,001 and Above
By Price Range 3-2012 3-2013
2,286
3,809
1,368
2,605
4,527
1,535
2 Bedrooms or Less
3 Bedrooms 4 Bedrooms or More
By Bedroom Count 3-2012 3-2013
+ 16.6%
3,661 3,374
4,356
3,767
Single-Family Homes Condos
By Property Type 3-2012 3-2013
+ 16.8% + 12.3% + 14.9% + 11.6% + 19.0% + 11.6% + 14.0% + 18.9% + 12.2%

Days on Market Until Sale
By Price Range 3-2012 3-2013 Change 3-2012 3-2013 Change 3-2012 3-2013 Change
$150,000 and Below 169 159 - 5.9% 170 153 - 10.2% 168 164 - 2.4%
$150,001 to $200,000 187 174 - 7.1% 174 155 - 10.9% 210 207 - 1.3%
$200,001 to $250,000 182 184 + 1.0% 176 176 + 0.5% 195 199 + 2.2%
$250,001 to $300,000 198 187 - 5.5% 190 181 - 4.9% 222 206 - 7.1%
$300,001 and Above 214 213 - 0.2% 215 210 - 2.3% 208 222 + 6.6%
All Price Ranges 180 172 - 4.7% 180 167 - 7.3% 180 178 - 1.3%
By Bedroom Count 3-2012 3-2013 Change 3-2012 3-2013 Change 3-2012 3-2013 Change
2 Bedrooms or Less 176 171 - 2.9% 180 153 - 15.1% 175 173 - 1.1%
3 Bedrooms 177 168 - 5.0% 174 161 - 7.6% 184 186 + 1.0%
4 Bedrooms or More 197 186 - 5.5% 193 184 - 4.7% 229 204 - 11.1%
All Bedroom Counts 180 172 - 4.7% 180 167 - 7.3% 180 178 - 1.3%
Average number of days between when a property is listed and when an offer is accepted. Based on a rolling 12-month average.
All data comes from the Coastal Carolinas Association of REALTORS® Multiple Listing Service. Provided by South Carolina REALTORS®. Powered by 10K Research and Marketing. | Click for Cover Page | 3
All Properties Single-Family Homes Condos
169 187 182
198 214
159 174
184 187
213
$150,000 and Below
$150,001 to $200,000
$200,001 to $250,000
$250,001 to $300,000
$300,001 and Above
By Price Range 3-2012 3-2013
176 177
197
171 168
186
2 Bedrooms or Less
3 Bedrooms 4 Bedrooms or More
By Bedroom Count 3-2012 3-2013
- 5.9%
180 180
167
178
Single-Family Homes Condos
By Property Type 3-2012 3-2013
- 7.1% + 1.0% - 5.5% - 0.2% - 7.3% - 1.3% - 2.9% - 5.0% - 5.5%
Median Sales Price
By Bedroom Count 3-2012 3-2013 Change 3-2012 3-2013 Change 3-2012 3-2013 Change
2 Bedrooms or Less $90,000 $90,000 0.0% $95,000 $91,250 - 3.9% $90,000 $90,000 0.0%
3 Bedrooms $149,900 $150,000 + 0.1% $148,000 $148,000 0.0% $155,000 $155,000 0.0%
4 Bedrooms or More $255,000 $250,000 - 2.0% $250,000 $250,000 0.0% $287,250 $291,750 + 1.6%
All Bedroom Counts $138,000 $139,000 + 0.7% $163,675 $160,318 - 2.1% $106,350 $105,000 - 1.3%
Median price point for all closed sales, not accounting for seller concessions. Based on a rolling 12-month median.
All data comes from the Coastal Carolinas Association of REALTORS® Multiple Listing Service. Provided by South Carolina REALTORS®. Powered by 10K Research and Marketing. | Click for Cover Page | 4
All Properties Single-Family Homes Condos
$90,000
$149,900
$255,000
$90,000
$150,000
$250,000
2 Bedrooms or Less 3 Bedrooms 4 Bedrooms or More
By Bedroom Count 3-2012 3-2013
$138,000
$163,675
$106,350
$139,000
$160,318
$105,000
All Properties Single-Family Homes Condos
By Property Type 3-2012 3-2013
- 2.1% - 1.3% 0.0% + 0.1% + 0.7% - 2.0%

Percent of List Price Received
By Price Range 3-2012 3-2013 Change 3-2012 3-2013 Change 3-2012 3-2013 Change
$150,000 and Below 93.3% 93.9% + 0.6% 93.5% 94.3% + 0.9% 93.2% 93.6% + 0.4%
$150,001 to $200,000 95.0% 96.1% + 1.2% 95.7% 96.7% + 1.0% 93.8% 95.0% + 1.3%
$200,001 to $250,000 94.6% 95.8% + 1.3% 95.5% 96.4% + 0.9% 92.8% 94.5% + 1.8%
$250,001 to $300,000 95.1% 96.1% + 1.1% 96.0% 96.5% + 0.5% 92.5% 94.7% + 2.4%
$300,001 and Above 93.6% 94.7% + 1.2% 93.5% 94.5% + 1.1% 93.9% 95.1% + 1.3%
All Price Ranges 93.9% 94.7% + 0.9% 94.4% 95.2% + 0.8% 93.3% 94.0% + 0.8%
By Bedroom Count 3-2012 3-2013 Change 3-2012 3-2013 Change 3-2012 3-2013 Change
2 Bedrooms or Less 92.9% 93.3% + 0.4% 91.2% 92.1% + 1.0% 93.1% 93.5% + 0.4%
3 Bedrooms 94.5% 95.4% + 1.0% 94.9% 95.7% + 0.8% 93.6% 94.8% + 1.3%
4 Bedrooms or More 93.8% 95.0% + 1.3% 93.8% 95.0% + 1.3% 93.4% 95.2% + 1.9%
All Bedroom Counts 93.9% 94.7% + 0.9% 94.4% 95.2% + 0.8% 93.3% 94.0% + 0.8%
Percentage found when dividing a property’s sales price by its last list price, then taking the average for all properties sold, not accounting for seller concessions. Based on a rolling 12-month average.
All data comes from the Coastal Carolinas Association of REALTORS® Multiple Listing Service. Provided by South Carolina REALTORS®. Powered by 10K Research and Marketing. | Click for Cover Page | 5
All Properties Single-Family Homes Condos
93.3%
95.0%
94.6%
95.1%
93.6% 93.9%
96.1% 95.8%
96.1%
94.7%
$150,000 and Below
$150,001 to $200,000
$200,001 to $250,000
$250,001 to $300,000
$300,001 and Above
By Price Range 3-2012 3-2013
92.9%
94.5%
93.8%
93.3%
95.4%
95.0%
2 Bedrooms or Less
3 Bedrooms 4 Bedrooms or More
By Bedroom Count 3-2012 3-2013
+ 0.6%
94.4%
93.3%
95.2%
94.0%
Single-Family Homes Condos
By Property Type 3-2012 3-2013
+ 1.2% + 1.3% + 1.1% + 1.2% + 0.8% + 0.8% + 0.4% + 1.0% + 1.3%

Inventory of Homes for Sale
By Price Range 3-2012 3-2013 Change 3-2012 3-2013 Change 3-2012 3-2013 Change
$150,000 and Below 3,730 3,063 - 17.9% 1,291 1,093 - 15.3% 2,439 1,970 - 19.2%
$150,001 to $200,000 1,387 1,205 - 13.1% 744 676 - 9.1% 643 529 - 17.7%
$200,001 to $250,000 894 839 - 6.2% 537 547 + 1.9% 357 292 - 18.2%
$250,001 to $300,000 646 566 - 12.4% 387 364 - 5.9% 259 202 - 22.0%
$300,001 and Above 2,001 1,813 - 9.4% 1,346 1,289 - 4.2% 655 524 - 20.0%
All Price Ranges 8,658 7,486 - 13.5% 4,305 3,969 - 7.8% 4,353 3,517 - 19.2%
By Bedroom Count 3-2012 3-2013 Change 3-2012 3-2013 Change 3-2012 3-2013 Change
2 Bedrooms or Less 2,767 2,282 - 17.5% 277 245 - 11.6% 2,490 2,037 - 18.2%
3 Bedrooms 3,792 3,267 - 13.8% 2,419 2,205 - 8.8% 1,373 1,062 - 22.7%
4 Bedrooms or More 1,840 1,705 - 7.3% 1,609 1,518 - 5.7% 231 187 - 19.0%
All Bedroom Counts 8,658 7,486 - 13.5% 4,305 3,969 - 7.8% 4,353 3,517 - 19.2%
The number of properties available for sale in active status at the end of the most recent month. Based on one month of activity.
All data comes from the Coastal Carolinas Association of REALTORS® Multiple Listing Service. Provided by South Carolina REALTORS®. Powered by 10K Research and Marketing. | Click for Cover Page | 6
All Properties Single-Family Homes Condos
3,730
1,387
894 646
2,001
3,063
1,205
839 566
1,813
$150,000 and Below
$150,001 to $200,000
$200,001 to $250,000
$250,001 to $300,000
$300,001 and Above
By Price Range 3-2012 3-2013
2,767
3,792
1,840
2,282
3,267
1,705
2 Bedrooms or Less
3 Bedrooms 4 Bedrooms or More
By Bedroom Count 3-2012 3-2013
- 17.9%
4,305 4,353 3,969
3,517
Single-Family Homes Condos
By Property Type 3-2012 3-2013
- 13.1% - 6.2% - 12.4% - 9.4% - 7.8% - 19.2% - 17.5% - 13.8% - 7.3%

Months Supply of Inventory
By Price Range 3-2012 3-2013 Change 3-2012 3-2013 Change 3-2012 3-2013 Change
$150,000 and Below 10.7 7.3 - 31.8% 8.6 5.9 - 31.6% 12.3 8.4 - 31.5%
$150,001 to $200,000 12.0 8.5 - 28.9% 10.0 7.3 - 27.0% 15.6 10.9 - 30.3%
$200,001 to $250,000 13.3 10.2 - 23.1% 11.7 9.5 - 18.4% 16.9 11.9 - 29.6%
$250,001 to $300,000 13.5 10.3 - 23.5% 11.9 9.2 - 23.0% 16.8 13.3 - 20.7%
$300,001 and Above 25.0 19.5 - 22.1% 22.7 18.3 - 19.7% 31.6 23.4 - 25.9%
All Price Ranges 13.1 9.5 - 27.9% 11.9 8.9 - 25.2% 14.7 10.2 - 30.4%
By Bedroom Count 3-2012 3-2013 Change 3-2012 3-2013 Change 3-2012 3-2013 Change
2 Bedrooms or Less 14.4 10.2 - 29.1% 12.0 9.0 - 25.6% 14.7 10.3 - 29.5%
3 Bedrooms 11.6 8.1 - 30.1% 10.4 7.6 - 26.9% 14.5 9.4 - 35.4%
4 Bedrooms or More 15.8 12.2 - 22.8% 15.2 11.9 - 21.9% 22.0 15.8 - 28.2%
All Bedroom Counts 13.1 9.5 - 27.9% 11.9 8.9 - 25.2% 14.7 10.2 - 30.4%
The inventory of homes for sale at the end of the most recent month, based on one month of activity, divided by the average monthly pending sales from the last 12 months.
All data comes from the Coastal Carolinas Association of REALTORS® Multiple Listing Service. Provided by South Carolina REALTORS®. Powered by 10K Research and Marketing. | Click for Cover Page | 7
All Properties Single-Family Homes Condos
10.7 12.0
13.3 13.5
25.0
7.3 8.5
10.2 10.3
19.5
$150,000 and Below
$150,001 to $200,000
$200,001 to $250,000
$250,001 to $300,000
$300,001 and Above
By Price Range 3-2012 3-2013
14.4
11.6
15.8
10.2
8.1
12.2
2 Bedrooms or Less
3 Bedrooms 4 Bedrooms or More
By Bedroom Count 3-2012 3-2013
- 31.8%
11.9
14.7
8.9
10.2
Single-Family Homes Condos
By Property Type 3-2012 3-2013
- 28.9% - 23.1% - 23.5% - 22.1% - 25.2% - 30.4% - 29.1% - 30.1% - 22.8%