Embed Size (px)
Citation preview
CROP INSURANCE
Reducing Subsidies for Highest Income Participants Could Save Federal Dollars with Minimal Effect on the Program
Report to Congressional Requesters
March 2015
GAO-15-356
United States Government Accountability Office
United States Government Accountability Office
Highlights of GAO-15-356, a report to congressional requesters
March 2015
CROP INSURANCE Reducing Subsidies for Highest Income Participants Could Save Federal Dollars with Minimal Effect on the Program
Why GAO Did This Study The federally subsidized crop insurance program helps about 1 million participants manage the risk inherent in farming. In recent years, the government’s costs for the crop insurance program have increased substantially, and these costs have come under scrutiny as the nation’s budgetary pressures have been increasing. Unlike farm and conservation programs, the crop insurance program provides the same level of subsidies to participants regardless of their income.
GAO was asked to examine the potential effects of reducing premium subsidies for the highest income crop insurance participants. This report examines: (1) the percentage and characteristics of participants that would be affected; (2) the impact, if any, on the crop insurance program; and (3) how USDA could implement a reduction in premium subsidies for the highest income participants. GAO analyzed RMA crop insurance data and FSA data on compliance with income limits from 2009 through 2013 (most recent year of available data), analyzed RMA data to examine the impact on the program and calculate potential savings, reviewed agency guidance and industry and academic publications, and interviewed USDA officials and stakeholders.
What GAO Recommends To reduce the cost of the crop insurance program and achieve budgetary savings for deficit reduction or other purposes, Congress should consider reducing premium subsidies for the highest income participants. In written comments, USDA stated that it had no comments on the draft report.
What GAO Found About 1 percent of crop insurance participants would have been affected if premium subsidies had been reduced for the highest income participants from 2009 through 2013, based on GAO’s analysis of data from the U.S. Department of Agriculture’s (USDA) Risk Management Agency (RMA) and Farm Service Agency (FSA). The highest income participants were those with incomes that exceeded limits in place for farm and conservation programs. In terms of characteristics, the highest income participants insured more farmland and had more premium subsidies provided on their behalf than other participants from 2009 through 2013. However, all crop insurance participants generally insured major crops, such as corn, soybeans, and wheat, while the highest income participants were more likely to insure specialty crops such as fruits, vegetables, and nursery crops. The highest income participants also made similar choices as other participants in terms of the type of crop insurance and the levels of coverage they chose.
Reducing crop insurance subsidies for the highest income participants would have a minimal effect on the program and save millions of dollars. RMA is directed by law to adopt rates and coverages that will improve the actuarial soundness of the crop insurance program. Actuarial soundness under the program means that premiums are adequate to cover expected claims and a reasonable reserve. Based on GAO’s analysis of agency data, participants’ premiums generally corresponded to their likelihood of collecting claims payments, regardless of their income level. Also, the highest income participants account for only about 1 percent of the premiums in the program. As a result, their decisions to stay in or leave the program would likely not affect the crop insurance program’s actuarial soundness at the national level. If premium subsidies had been reduced by 15 percentage points for the highest income participants from 2009 through 2013, the federal government would have saved more than $70 million over the 5-year period, according to GAO’s analysis of agency data. The current income limit, enacted in 2014 for farm and conservation programs, would likely affect fewer crop insurance participants than did the previous limit. Consequently, the savings would be smaller.
USDA could use existing procedures to implement a reduction in subsidies for the highest income participants. FSA has procedures to verify participants’ compliance with income limits applicable to some farm and conservation programs. About two-thirds of crop insurance participants, on average, participated in programs that had income limits from 2009 through 2013 and would not need to provide additional information. Opportunities exist for RMA to access FSA’s eligibility data system and work with insurance companies to apply the reduction in premium subsidies for the highest income participants. According to RMA officials, administering a provision that would reduce premium subsidies for the highest income participants would pose some challenges. For example, RMA and FSA would need to reconcile certain data on participants that are subject to the income limit. However, USDA is developing procedures to administer conservation compliance requirements in the Agricultural Act of 2014 that could help administer a premium subsidy reduction for the highest income crop insurance participants.
View GAO-15-356. For more information, contact Anne-Marie Fennell at (202) 512-3841 or [email protected].
Page i GAO-15-356 Crop Insurance Subsidies
Letter 1
Background 6 Few Crop Insurance Participants Would Have Been Affected if
Subsidies Were Reduced for the Highest Income Participants from 2009 through 2013 9
Reducing Crop Insurance Subsidies for the Highest Income Participants Would Have Minimal Effect on the Program and Save Millions of Dollars 17
USDA Could Use Existing Procedures to Reduce Crop Insurance Subsidies for the Highest Income Participants 23
Conclusions 26 Matter for Congressional Consideration 26 Agency Comments and Our Evaluation 27
Appendix I Objectives, Scope, and Methodology 28
Appendix II Farm Service Agency’s Procedures for Administering Income Limits for Farm and Conservation Programs 33
Appendix III Average Number and Percentage of the Highest Income Crop Insurance Participants by State, 2009 through 2013 36
Appendix IV Characteristics of Crop Insurance Participants, 2009 through 2013 39
Appendix V Summary of Potential Actions and Estimated Savings for the Crop Insurance Program, 2012-2015 42
Appendix VI Comments from the U.S. Department of Agriculture 43
Appendix VII GAO Contact and Staff Acknowledgments 44
Contents
Page ii GAO-15-356 Crop Insurance Subsidies
Related GAO Products 45
Tables
Table 1: Crop Insurance Participants by Income Level, 2009 through 2013 10
Table 2: Highest Income Crop Insurance Participants in Five States, 2009 through 2013 14
Table 3: Measures That Reflect Risk for Crop Insurance Participants, 2004 through 2013 20
Table 4: Average Number and Percentages of Highest Income Crop Insurance Participants by State, 2009 through 2013 36
Table 5: Average Annual Number and Percentages of Highest Income Participants and Other Participants, 2009 through 201339
Table 6: Selected Characteristics per Participant for Highest Income and Other Participants, 2009 through 2013 40
Table 7: Highest Income Participants and Other Participants’ Choices in Insurance Protection, 2009 through 2013 41
Table 8: GAO Reports on Potential Savings in the Crop Insurance Program, 2012 through 2015 42
Figure
Figure 1: Highest Income and Other Crop Insurance Participants’ Percentage of Premiums by Crop, 2009 through 2013 15
Page iii GAO-15-356 Crop Insurance Subsidies
Abbreviations AGI adjusted gross income ASB Actuarial Standards Board FSA Farm Service Agency IRS Internal Revenue Service NRCS Natural Resources Conservation Service RMA Risk Management Agency USDA U.S. Department of Agriculture
This is a work of the U.S. government and is not subject to copyright protection in the United States. The published product may be reproduced and distributed in its entirety without further permission from GAO. However, because this work may contain copyrighted images or other material, permission from the copyright holder may be necessary if you wish to reproduce this material separately.
Page 1 GAO-15-356 Crop Insurance Subsidies
441 G St. N.W. Washington, DC 20548
March 18, 2015
The Honorable Ron Johnson Chairman Committee on Homeland Security and Governmental Affairs United States Senate
The Honorable James Lankford Chairman Subcommittee on Regulatory Affairs and Federal Management Committee on Homeland Security and Governmental Affairs United States Senate
Federally subsidized crop insurance, which about 1 million participants purchase to help manage the risk inherent in farming, has become one of the most important programs in the farm safety net. Under the federal crop insurance program, participants can insure against losses caused by poor crop yields resulting from natural causes, declines in crop prices, or both, for each insurable crop they produce. The U.S. Department of Agriculture’s (USDA) Risk Management Agency (RMA) has overall responsibility for administering the crop insurance program. RMA partners with 19 private insurance companies that sell and service the insurance policies and share a percentage of the risk of loss and opportunity for gain associated with each policy. The federal government pays for (1) part of participants’ crop insurance premiums, which averaged about 62 percent of total premiums in 2014, and (2) administrative and operating expenses to insurance companies to cover the expense of selling and servicing crop insurance policies.
In recent years, the government’s costs for the federal crop insurance program have increased substantially. Federal costs for the program averaged $3.8 billion annually for fiscal years 2004 through 2008 and increased to $8.5 billion annually for fiscal years 2009 through 2014. Those costs are expected to average $8.9 billion per year for fiscal years 2015 through 2024, according to the Congressional Budget Office.1
1This estimate includes projected costs associated with new crop insurance provisions in the Agricultural Act of 2014.
At the same time, farm income has been high. According to USDA’s Economic
Page 2 GAO-15-356 Crop Insurance Subsidies
Research Service, net farm income reached a high of $129 billion in 2013, and although it is forecast to fall from that record beginning in 2014, it remains above the average of the 2001 to 2010 decade. Further, other measures of financial well-being for the farm sector have been strong. For example, farm real estate values increased by 83 percent from 2005 through 2014, and farm debt, relative to equity and assets, has decreased, to some of the lowest levels since the 1950s, according to USDA.2 With increasing constraints on the federal budget, the cost to the federal government of the crop insurance program has come under scrutiny. In an October 2013 review of the federal government’s long-term fiscal outlook, we concluded that current fiscal policy is unsustainable over the long term and that addressing future fiscal challenges will require looking at the entire range of federal activities and making difficult choices in setting priorities.3 In 2012 and 2013 reports, we suggested that Congress should consider reducing crop insurance costs by limiting the amount of premium subsidies that an individual participant can receive each year, reducing premium subsidy rates for all farmers, or using some combination of limiting and reducing these subsidies.4 In August 2014, we suggested that Congress should consider reducing the level of federal premium subsidies for revenue crop insurance policies,5 and in February 2015, we recommended that RMA increase its adjustments of premium rates in areas with higher crop production risks.6
The federal crop insurance program provides the same level of premium subsidies to participants regardless of their income. In contrast, since 2003, benefits from farm and conservation programs administered by
2USDA, National Agricultural Statistics Service, Land Values and Cash Rents 2009 Summary (Washington, D.C.: Aug. 4, 2009) and USDA, National Agricultural Statistics Service, Land Values 2014 Summary (Washington, D.C.: Aug. 1, 2014). 3GAO, Fiscal Exposures: Improving Cost Recognition in the Federal Budget, GAO-14-28 (Washington, D.C.: Oct. 29, 2013). 4GAO, Crop Insurance: Savings Would Result from Program Changes and Greater Use of Data Mining, GAO-12-256 (Washington, D.C.: Mar. 13, 2012) and 2013 Annual Report: Actions Needed to Reduce Fragmentation, Overlap, and Duplication and Achieve Other Financial Benefits, GAO-13-279SP (Washington, D.C.: Apr. 9, 2013). 5GAO, Crop Insurance: Considerations in Reducing Federal Premium Subsidies, GAO-14-700 (Washington, D.C.: Aug. 8, 2014). 6GAO, Crop Insurance: In Areas with Higher Crop Production Risks, Costs Are Greater and Premiums May Not Cover Expected Losses, GAO-15-215 (Washington, D.C.: Feb. 9, 2015).
Page 3 GAO-15-356 Crop Insurance Subsidies
USDA’s Farm Service Agency (FSA) and the Natural Resources Conservation Service (NRCS) were not available to individuals or legal entities with incomes exceeding certain limits. Under the 2014 farm bill, participants in those programs are not eligible for farm and conservation payments if their 3-year average adjusted gross income (AGI) exceeds $900,000.7 This income limit also applies to participants in the Noninsured Crop Disaster Assistance Program, which provides insurance-like protection for crops that are not covered by the federal crop insurance program. During the debate leading up to passage of the Agricultural Act of 2014 (the 2014 farm bill), which shifted emphasis and funding from traditional farm programs to the crop insurance program, various proposals were offered that would have reduced premium subsidies for crop insurance participants with incomes exceeding a certain limit.8
You asked us to examine the potential effects of a provision that would reduce premium subsidies for crop insurance participants with incomes exceeding a certain limit.
However, none were included in the final version of the 2014 farm bill. Some stakeholders expressed concern that high-income participants represent less risk than the other participants, and that they would drop out of the program if their premium subsidies were reduced, threatening the financial soundness and viability of the entire program. They also said that these proposals could be difficult for USDA to implement, particularly for entities that had multiple members, all of which would have been subject to income limits under the proposals. However, other stakeholders said that the proposals would have saved the federal government money and not adversely affected the program or its participants.
9
7The $900,000 income limit applies to conservation program payments beginning in fiscal year 2015.
This report examines, if premium subsidies were reduced for participants with the highest incomes, (1) the percentage and characteristics of participants that would be affected; (2) the impact, if any, on the crop insurance program; and (3) how USDA could implement a reduction in premium subsidies for the highest income participants.
8Pub. L. No. 113-79, 128 Stat. 649; see e.g., H. Conf. Rpt. 113-333, p. 554. 9This request was originally made by Senator Tom Coburn, former Ranking Member, Committee on Homeland Security and Governmental Affairs.
Page 4 GAO-15-356 Crop Insurance Subsidies
To address these objectives, we reviewed relevant provisions of the Food, Conservation, and Energy Act of 2008 (2008 farm bill)10 and the 2014 farm bill;11 other legislation; and USDA regulations. To address the first objective, we matched RMA data on crop insurance participants’ characteristics and FSA data on participants’ compliance with income limits for farm and conservation programs from 2009 through 2013, the most recent years available. We used the FSA data because they were the most complete data available on participants’ general income levels. In matching the two datasets, we identified crop insurance participants that were in both datasets and determined the percentage of participants whose incomes exceeded limits in effect under the 2008 farm bill.12 For this group, which included about two-thirds of crop insurance participants, we also analyzed RMA data to identify other characteristics of the participants, including their location, the crops they insured, and the insurance plans they selected. Because we did not have FSA data for about one-third of crop insurance participants,13
To address the second objective, we identified potential effects on the financial soundness of the program and calculated potential government
we supplemented our analysis with USDA’s annual survey data about the income and other characteristics of a sample of U.S. farm operations from 2009 through 2012, the most recent years available.
10Pub. L. No. 110-246, 122 Stat. 1651. 11Pub. L. No. 113-79. 12The 2008 farm bill set separate limits for a participant’s farm income and nonfarm income; both were based on adjusted gross income, averaged over 3 years. The limits varied by program and changed over time, but generally stated that farm program participants could not receive payments if their 3-year average adjusted nonfarm income exceeded $500,000 or their 3-year average adjusted farm income exceeded $750,000. Conservation program participants generally could not receive payments if their 3-year average adjusted nonfarm income exceeded $1 million, unless at least two-thirds of their 3-year average adjusted income was farm income. Participants were subject to one or more of these limits depending on which programs they took part in, and in which years. For our analysis, we considered crop insurance participants to be “highest income” when FSA data showed that they were noncompliant with any income limits to which they were subject; these data did not specify which income limit or limits had been exceeded in each case. We refer to “other participants” as those for which we have FSA data showing that their incomes did not exceed income limits in effect for farm and conservation programs from 2009 through 2013. 13FSA data were only available for crop insurance participants that also participated in or applied for benefits from farm and conservation programs subject to income limits from 2009 through 2013.
Page 5 GAO-15-356 Crop Insurance Subsidies
savings. To identify any effects on the financial soundness of the crop insurance program, we analyzed RMA data on loss experiences of, and premiums paid for, (1) participants with the highest incomes, those whose incomes exceeded limits under the 2008 farm bill, and (2) other participants, from 2004 through 2013. We chose this time period to capture variability in weather and other factors that change over time, such as crop prices. To determine potential savings, we analyzed RMA and FSA data to estimate the amount of subsidies paid on behalf of participants with incomes that exceeded the limits from 2009 through 2013, and we calculated the savings that would have resulted if these subsidies were reduced by 15 percentage points (the amount proposed in a Senate-passed bill) or eliminated.14
To address the third objective, we reviewed USDA regulations, guidance, and other documents and prior GAO reports for information on how FSA implements income limits for farm and conservation programs and how RMA, FSA, and NRCS are implementing other provisions for crop insurance participants. We also interviewed RMA, FSA, and NRCS officials regarding the implementation of income limits and other provisions. A more detailed discussion of our objectives, scope, and methodology is presented in appendix I.
We chose this time period because recent years more closely reflect current program provisions and participation levels. In addition, we reviewed USDA and other studies and interviewed RMA officials, actuarial professionals, and academics regarding the potential effects of reducing premium subsidies for the highest income participants and the costs of the crop insurance program.
For the data used in our analyses, we reviewed agency documentation related to the data systems, interviewed knowledgeable officials, and reviewed applicable internal controls information to evaluate the reliability of these data. In each case, we concluded that the data were sufficiently reliable for the purposes of this report. We conducted this performance audit from December 2013 to March 2015 in accordance with generally accepted government auditing standards. Those standards require that we plan and perform the audit to obtain sufficient, appropriate evidence to
14In our estimate of government costs, we did not include administrative and operating expenses because we assumed that participants made the same insurance plan choices, in which case, these costs would not change. We did not include underwriting gains or losses because of the unpredictability of natural events and market price changes that affect such gains or losses.
Page 6 GAO-15-356 Crop Insurance Subsidies
provide a reasonable basis for our findings and conclusions based on our audit objectives. We believe that the evidence obtained provides a reasonable basis for our findings and conclusions based on our audit objectives.
Farmers are exposed to financial losses because of production risks—droughts, floods, and other natural disasters—as well as variations in the market prices of their crops. Through the federal crop insurance program, participants can insure against losses on more than 100 crops. These crops include five major crops (corn, cotton, grain sorghum, soybeans, and wheat), which accounted for 86 percent of the program premiums in 2013, minor crops (field crops other than major crops and livestock), and specialty crops (fruits, vegetables, nursery crops, and tree nuts). Crop insurance participants may be individuals or legal entities—such as trusts, partnerships, and corporations—and members of an entity may share ownership of an insurance policy.
Participants can generally select various types of crop insurance policies, including yield-based plans, which protect against declines in production, and revenue-based plans, which protect against declines in production, price, or both. Some plans, however, are not available for all crops or in all locations. Participants may also choose between two types of coverage: (1) catastrophic coverage, which insures 50 percent of normal yield and 55 percent of the estimated market price of the crop, and (2) additional or “buy-up” coverage, which insures 50 percent to 85 percent of normal yield and up to 100 percent of the estimated market price of the crop. Beginning in 2015, participants have the option of buying insurance policies designed to reimburse “shallow losses,” to cover the portion of losses that is applied toward meeting a plan’s deductible. In addition, participants may choose what type of units (certain number of acres for a specific crop) to insure. Basic units cover all plantings of a crop in a single county with the same tenant and landlord; optional units are basic units divided into smaller units by township section; and enterprise units cover all plantings of a single crop in a county, regardless of the tenant and landlord structure. Enterprise units are generally more geographically diverse, so this type of unit is less risky and is charged a lower premium.
The federal government has played an active role in helping to mitigate the effects of production risks on farm income by promoting the use of crop insurance through subsidies of premiums. The federal government’s premium and administrative expense subsidies for crop insurance policies are not payments to participants, but they can be considered a financial
Background
Page 7 GAO-15-356 Crop Insurance Subsidies
benefit to participants. Without a premium subsidy, crop insurance participants would have to pay the full amount of the policy premium. And, without an administrative expense subsidy, premiums would likely be higher because insurance companies would have to reflect the full cost of administering the policies in those premiums. The federal government provides crop insurance premium subsidies in part to achieve high participation and coverage levels. High participation and coverage levels may reduce or eliminate the need for congressionally authorized ad hoc disaster programs to help farmers recover from natural disasters, which can be costly. For example, under three separate ad hoc disaster programs, USDA provided $7 billion in payments to farmers whose crops were damaged or destroyed by natural disasters from 2001 to 2007. In 2012, Congress did not enact ad hoc disaster assistance legislation despite a major drought affecting a large portion of the United States.
Congress sets premium subsidy rates, meaning the percentage of the premium paid by the government. Premium subsidy rates vary by the level of insurance coverage, the type of units covered by the policy, and the geographic diversity of crops insured. For most policies, the statutory subsidy rates range from 38 percent to 80 percent of the premiums. On average, premium subsidy rates were 62 percent in 2014 for these policies. The two new shallow loss insurance plans have premium subsidy rates of 80 percent and 65 percent. For catastrophic coverage, the federal government pays 100 percent of premiums, and participants pay a $300 administrative fee for each crop that they insure in each county. Administrative expense subsidies, which are paid to insurance companies, are determined as a percentage of total premiums and vary by policy type.
Unlike the crop insurance program, for more than a decade, USDA’s farm and conservation programs have had statutory income limits setting the maximum amount of income that participants can earn and still remain eligible for program payments. Participants subject to the income limits are individuals, entities, and members of entities. The 2008 farm bill set separate limits for an individual’s or a legal entity’s farm income and nonfarm income, and those limits were in effect from 2009 through 2013, but the limits changed in the 2014 farm bill.15
15 Pub. L. No. 113-79 § 1605.
The income subject to both limits was based on AGI, as defined by the Internal Revenue Service
Page 8 GAO-15-356 Crop Insurance Subsidies
(IRS), or a comparable measure, and averaged over the 3 most recent tax years. These limits varied by program and changed over time but, in general, they specified that participants in farm programs could not receive payments if their nonfarm income exceeded $500,000 or if their farm income exceeded $750,000. Participants in conservation programs generally could not receive benefits if their nonfarm income exceeded $1 million, unless at least two-thirds of their total AGI was farm income. The 2014 farm bill established a single income limit of $900,000 for farm and conservation programs.16
Although the crop insurance program has no income limits for its participants, Congress has considered establishing an income threshold above which participants would receive reduced subsidies. In the Senate-passed version of the 2014 farm bill, crop insurance participants with AGI in excess of $750,000, averaged over 3 years, would have had their premium subsidies reduced by 15 percentage points. Implementation of this provision would have been contingent on the results of a study on the limitation’s effects.
Appendix II provides additional information about the income limits established under the 2008 farm bill and FSA’s enforcement of these limits.
17 The House of Representatives adopted a resolution that supported the provision in the Senate-passed version of the farm bill,18 but the provision was not included in the final version of the farm bill. Also, in the House of Representatives, an amendment to its version of the farm bill was proposed that would have eliminated premium subsidies for participants with average AGI exceeding $250,000, but the amendment was defeated.19
Other changes, however, were incorporated into the 2014 farm bill, including a conservation compliance provision for the crop insurance program. Specifically, the conservation compliance provision states that,
16We suggested that Congress consider simplifying the income limits, for example by establishing a single limit. See GAO, Farm Programs: Additional Steps Needed to Help Prevent Payments to Participants Whose Incomes Exceed Limits, GAO-13-741 (Washington, D.C.: Aug. 29, 2013). 17The provision would not have reduced subsidies for catastrophic coverage. S. 954, 113th Cong. § 11033, (as passed by Senate, June 10, 2012). 18H. Res. 379, 113th Cong. 19The provision would not have eliminated subsidies for catastrophic coverage. H. Amdt. 216, proposing to amend H.R. 1947, 113th Cong. (June 19, 2013) defeated 208-217.
Page 9 GAO-15-356 Crop Insurance Subsidies
to be eligible for premium subsidies, crop insurance participants that plant certain crops on land that is prone to erosion must have a conservation plan, and participants must not convert wetlands for crop production.
About 1 percent of crop insurance participants would have been affected if subsidies were reduced for the highest income participants. These participants had some characteristics that differed from other crop insurance participants but overall had characteristics similar to other participants.20
Specifically, the highest income participants insured more farmland and were provided more in premium subsidies than other participants, on average. In general, however, the highest income crop insurance participants and other participants insured farmland in the same states, insured major crops most frequently, and made similar choices about insurance protection.
About 1 percent of crop insurance participants that also applied for farm and conservation programs with income limits would have been affected if subsidies had been reduced for the highest income participants from 2009 through 2013, based on our analysis of RMA and FSA data. The number of highest income crop insurance participants was about 7,500 annually on average but, as shown in table 1, the annual number decreased from 2009 through 2013. An FSA official told us that this decrease in recent years may be the result of fewer crop insurance participants applying for farm and conservation programs after they had been determined ineligible for these programs’ payments because of their income. As a result, this analysis may understate the annual number of
20In this report, we refer to the “highest income participants” as those crop insurance participants for which we have FSA data showing that their incomes exceeded the income limits in effect for farm and conservation programs from 2009 through 2013. Participants were subject to one or more of these limits depending on which programs they took part in, and in which years. The limits were based on AGI averaged over 3 years and generally stated that farm program participants could not receive some payments if their nonfarm income exceeded $500,000 or their farm income exceeded $750,000. Conservation program participants generally could not receive payments if their nonfarm income exceeded $1 million. Because these limits applied to individuals, in some cases, married couples filing jointly could potentially earn up to twice these amounts without exceeding the income limits. We refer to “other participants” as those for which we have FSA data showing that their incomes did not exceed income limits in effect for farm and conservation programs from 2009 through 2013.
Few Crop Insurance Participants Would Have Been Affected if Subsidies Were Reduced for the Highest Income Participants from 2009 through 2013
About 1 Percent Would Have Been Affected if Subsidies Were Reduced for the Highest Income Crop Insurance Participants
Page 10 GAO-15-356 Crop Insurance Subsidies
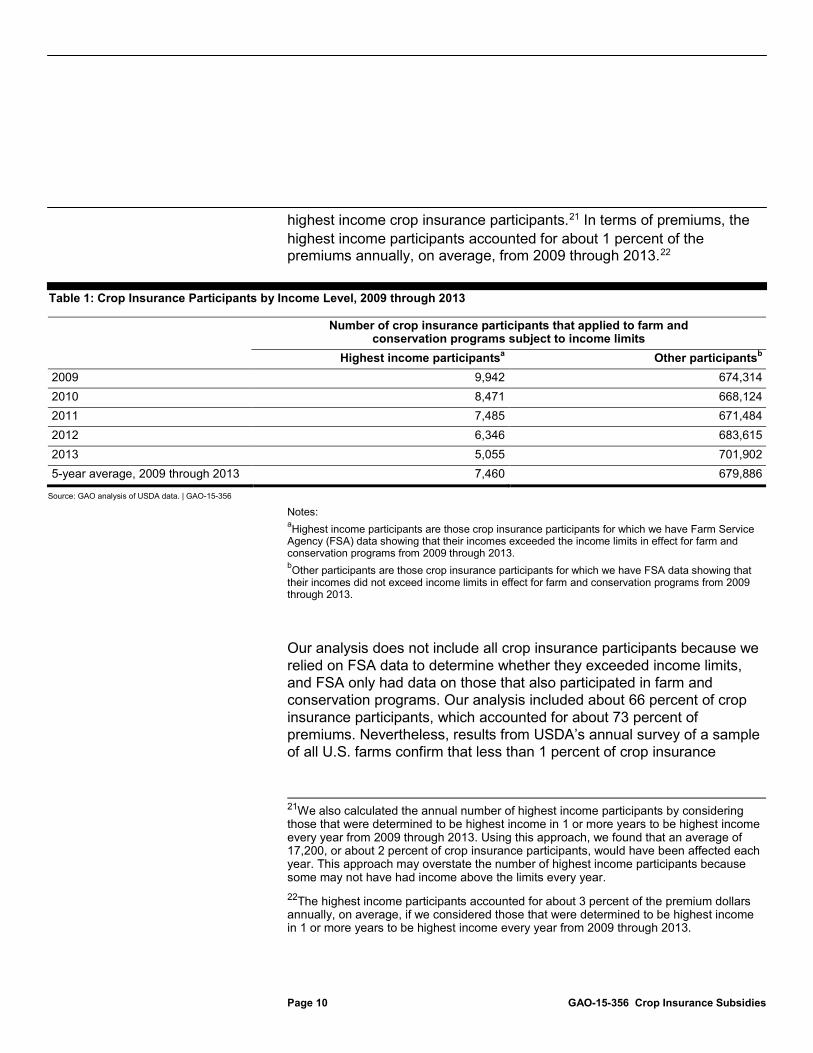
highest income crop insurance participants.21 In terms of premiums, the highest income participants accounted for about 1 percent of the premiums annually, on average, from 2009 through 2013.22
Table 1: Crop Insurance Participants by Income Level, 2009 through 2013
Number of crop insurance participants that applied to farm and conservation programs subject to income limits
Highest income participantsa Other participantsb 2009 9,942 674,314 2010 8,471 668,124 2011 7,485 671,484 2012 6,346 683,615 2013 5,055 701,902 5-year average, 2009 through 2013 7,460 679,886
Source: GAO analysis of USDA data. | GAO-15-356
Notes: aHighest income participants are those crop insurance participants for which we have Farm Service Agency (FSA) data showing that their incomes exceeded the income limits in effect for farm and conservation programs from 2009 through 2013. bOther participants are those crop insurance participants for which we have FSA data showing that their incomes did not exceed income limits in effect for farm and conservation programs from 2009 through 2013.
Our analysis does not include all crop insurance participants because we relied on FSA data to determine whether they exceeded income limits, and FSA only had data on those that also participated in farm and conservation programs. Our analysis included about 66 percent of crop insurance participants, which accounted for about 73 percent of premiums. Nevertheless, results from USDA’s annual survey of a sample of all U.S. farms confirm that less than 1 percent of crop insurance
21We also calculated the annual number of highest income participants by considering those that were determined to be highest income in 1 or more years to be highest income every year from 2009 through 2013. Using this approach, we found that an average of 17,200, or about 2 percent of crop insurance participants, would have been affected each year. This approach may overstate the number of highest income participants because some may not have had income above the limits every year. 22The highest income participants accounted for about 3 percent of the premium dollars annually, on average, if we considered those that were determined to be highest income in 1 or more years to be highest income every year from 2009 through 2013.
Page 11 GAO-15-356 Crop Insurance Subsidies
participants would have been affected from 2009 through 2012, the most recent year for which survey data were available.23
Our analysis also does not include data from 2014, which were not available when we conducted our review. The number of participants affected would have been smaller if the $900,000 income limit that went into effect for farm programs in 2014 had applied to crop insurance participants. According to preliminary FSA data, fewer than one-half of 1 percent of farm program participants were found to exceed this limit in 2014.
The highest income participants insured more farmland and had more premium subsidies provided on their behalf than other participants from 2009 through 2013. The highest income participants each insured about 490 acres of farmland on average, compared with about 310 acres insured by the other participants.24 The highest income participants were also associated with larger farms compared with other participants. On average, the highest income participants were associated with policies insuring about 2,920 acres, while other participants were associated with policies insuring about 1,330 acres.25
23USDA, National Agricultural Statistics Service, Agricultural Resource Management Survey, 2009-2012. This estimate is based on the reported income of U.S. farms that had crop insurance expenditures. The income was adjusted to make it comparable to the AGI used in eligibility determinations for USDA farm and conservation programs, such as by attributing income to individuals within a household and making certain allowable deductions.
The highest income participants also had more premium subsidies provided on their behalf than other participants. Specifically, each of the highest income participants had an average of about $8,500 in premium subsidies provided on their behalf each year, while other participants had an average of about $7,480 each year. Premiums, and hence premium subsidies, are based on the value of the insured crops, and would be greater if more acres were insured and the crop values were higher. In some cases, the highest income participants insured considerably more acres and had considerably more than the average amount of premium subsidies provided on their behalf. Some examples we identified from USDA data and our analysis of the
24To determine this estimate, we attributed acres to participants based on the participant’s ownership share in the policy. 25To calculate this estimate, we determined the total number of acres insured by policies associated with the highest income participants and other participants, regardless of how many participants may have been listed on the policies.
Highest Income Crop Insurance Participants Insured More Farmland and Had More Premium Subsidies Provided on Their Behalf Than Other Participants
Page 12 GAO-15-356 Crop Insurance Subsidies
highest income crop insurance participants from 2009 through 2013 included the following:
• One of the participants insured an average of more than 150,000 acres annually in multiple states. This participant grew major, minor, and specialty crops, and operated livestock farms and other business enterprises.26
• The participants with the 10 highest dollar amounts in premium subsidies each insured an average of about 39,000 acres, had an average of about $2.6 million in premium subsidies provided on their behalf, and collected about $2.5 million in claims payments during the 5-year period.
About $6.1 million in premium subsidies were provided on behalf of this participant, and the participant also collected about $4.0 million in claims payments during the 5-year period.
Some of the highest income participants received income from operating large farms, but others received some of their income from nonfarming sources, according to our analysis. For example, more than 70 of the crop insurance participants we identified as among the highest income during 1 or more years from 2009 through 2013 were managers or professionals, including attorneys, executives, or physicians. Four others, who had net worth over $1.5 billion each in 2013, earned their wealth from a variety of sources in addition to farming, such as mining, real estate, sports, and information technology, according to publicly available information. Those participants each insured an average of about 18,200 acres, had approximately $118,400 in premium subsidies provided on their behalf, and collected about $38,300 in claims payments during the 5-year period. Further, participants that operated farms with higher annual gross sales ($250,000 or more) were more likely to have employment in nonfarm professions with higher wages, according to a USDA study.27
26In this report, we refer to corn, cotton, grain sorghum, soybeans, and wheat as “major crops.” These were the top five crops in terms of premiums from 2009 through 2013 in the crop insurance program. Minor crops include field crops (other than major crops) and livestock. Specialty crops are fruit, vegetables, nursery, and tree nuts. 27USDA, Economic Research Service, The Off-Farm Occupations of U.S. Farm Operators and Their Spouses, Economic Information Bulletin No. 117 (Washington, D.C.: September 2013).
Page 13 GAO-15-356 Crop Insurance Subsidies
About half of the highest income participants and 38 percent, on average, of the other participants in the crop insurance program reported an address in five states (Texas, Kansas, Illinois, Iowa, and California), according to our analysis of USDA data from 2009 through 2013.28
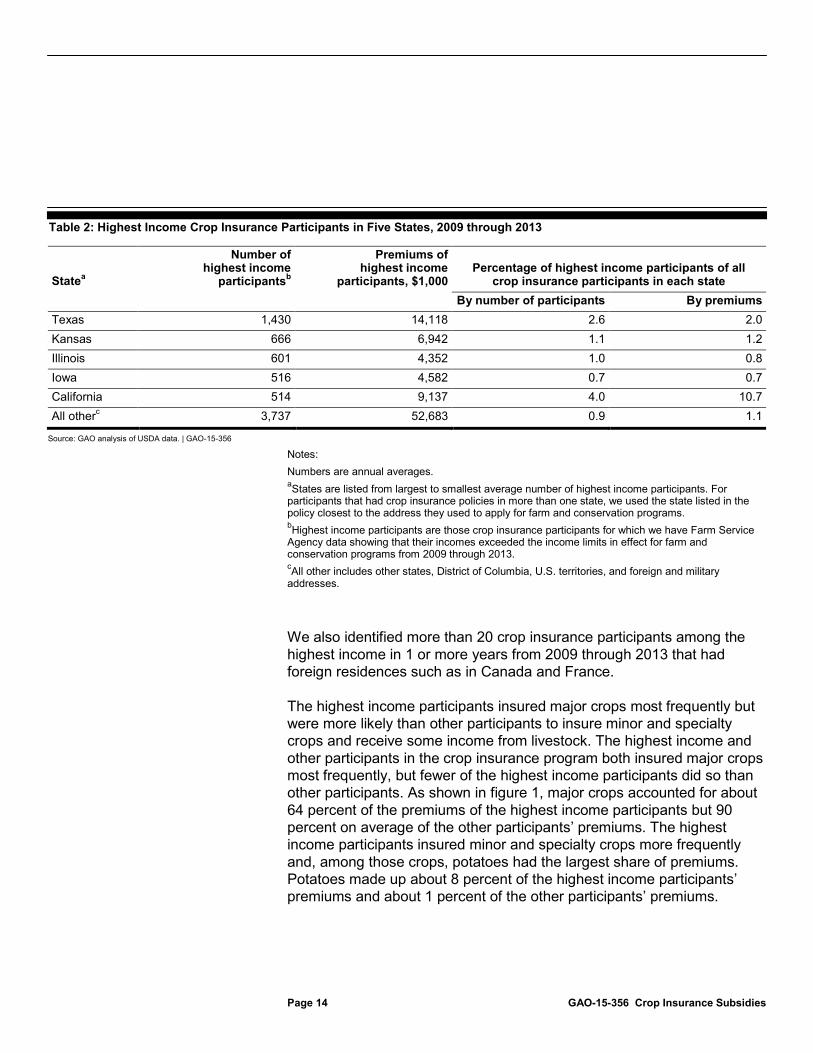
The highest income participants made up an average of about 1 percent of crop insurance participants in three of these five states, as shown in table 2, similar to the share of highest income crop insurance participants nationwide. Of these five states, California had the largest percentage of highest income participants in the state. In terms of premiums, the highest income participants accounted for 1 percent of the premiums in three of these five states, similar to the highest income crop insurance participants’ share of premiums nationwide. They accounted for about 11 percent of the premiums in California and 2 percent of the premiums in Texas. The higher share of premiums in California may be partially the result of the type of crops grown there. Specifically, specialty crops are commonly grown in California, and such crops are often higher value and associated with higher premiums. In Texas, FSA officials said there may be additional sources of revenue for landowners who farm, such as revenue from oil and gas development on their land. Appendix III contains a complete list of the numbers and percentages of the highest income participants in each state.
28For participants that had crop insurance policies in more than one state, we used the state listed in the policy closest to the address they used to apply for farm and conservation programs.
Highest Income Crop Insurance Participants and Other Participants Generally Insured Farmland in the Same States and Insured Major Crops Most Frequently
Page 14 GAO-15-356 Crop Insurance Subsidies
Table 2: Highest Income Crop Insurance Participants in Five States, 2009 through 2013
Statea
Number of highest income
participantsb
Premiums of highest income
participants, $1,000 Percentage of highest income participants of all
crop insurance participants in each state By number of participants By premiums Texas 1,430 14,118 2.6 2.0 Kansas 666 6,942 1.1 1.2 Illinois 601 4,352 1.0 0.8 Iowa 516 4,582 0.7 0.7 California 514 9,137 4.0 10.7 All otherc 3,737 52,683 0.9 1.1
Source: GAO analysis of USDA data. | GAO-15-356
Notes: Numbers are annual averages. aStates are listed from largest to smallest average number of highest income participants. For participants that had crop insurance policies in more than one state, we used the state listed in the policy closest to the address they used to apply for farm and conservation programs. bHighest income participants are those crop insurance participants for which we have Farm Service Agency data showing that their incomes exceeded the income limits in effect for farm and conservation programs from 2009 through 2013. cAll other includes other states, District of Columbia, U.S. territories, and foreign and military addresses.
We also identified more than 20 crop insurance participants among the highest income in 1 or more years from 2009 through 2013 that had foreign residences such as in Canada and France.
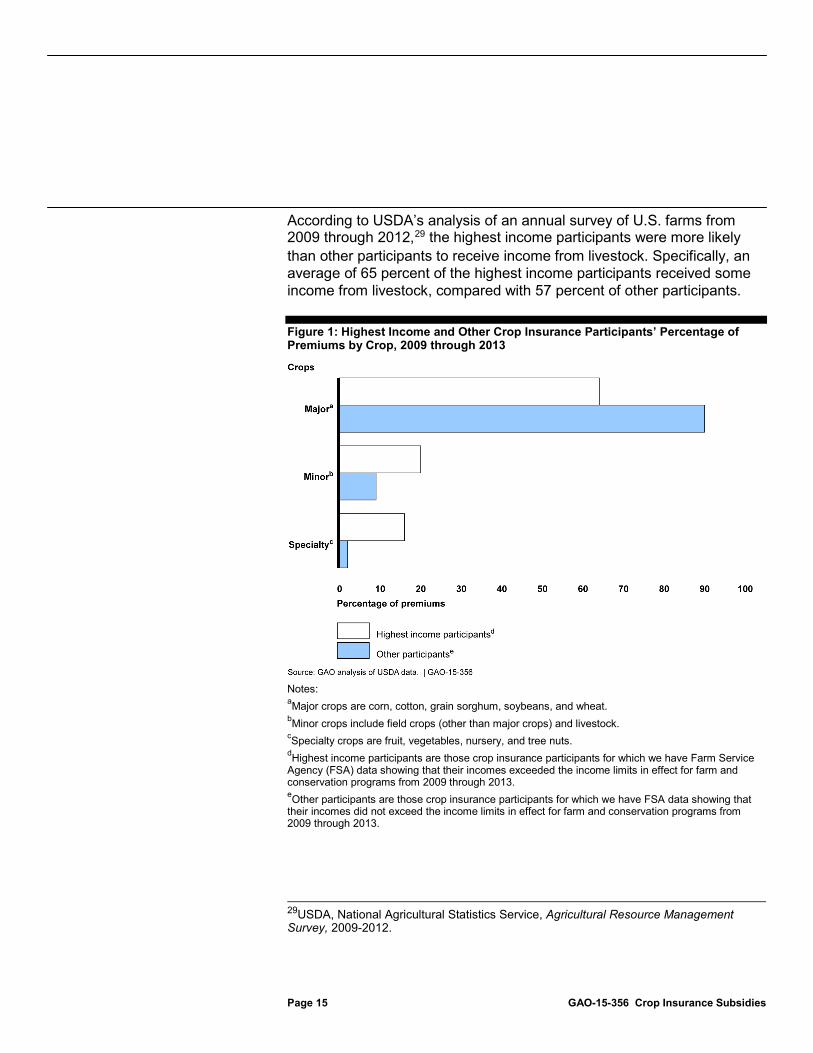
The highest income participants insured major crops most frequently but were more likely than other participants to insure minor and specialty crops and receive some income from livestock. The highest income and other participants in the crop insurance program both insured major crops most frequently, but fewer of the highest income participants did so than other participants. As shown in figure 1, major crops accounted for about 64 percent of the premiums of the highest income participants but 90 percent on average of the other participants’ premiums. The highest income participants insured minor and specialty crops more frequently and, among those crops, potatoes had the largest share of premiums. Potatoes made up about 8 percent of the highest income participants’ premiums and about 1 percent of the other participants’ premiums.
Page 15 GAO-15-356 Crop Insurance Subsidies
According to USDA’s analysis of an annual survey of U.S. farms from 2009 through 2012,29
Figure 1: Highest Income and Other Crop Insurance Participants’ Percentage of Premiums by Crop, 2009 through 2013
the highest income participants were more likely than other participants to receive income from livestock. Specifically, an average of 65 percent of the highest income participants received some income from livestock, compared with 57 percent of other participants.
Notes: aMajor crops are corn, cotton, grain sorghum, soybeans, and wheat. bMinor crops include field crops (other than major crops) and livestock. cSpecialty crops are fruit, vegetables, nursery, and tree nuts. dHighest income participants are those crop insurance participants for which we have Farm Service Agency (FSA) data showing that their incomes exceeded the income limits in effect for farm and conservation programs from 2009 through 2013. eOther participants are those crop insurance participants for which we have FSA data showing that their incomes did not exceed the income limits in effect for farm and conservation programs from 2009 through 2013.
29USDA, National Agricultural Statistics Service, Agricultural Resource Management Survey, 2009-2012.
Page 16 GAO-15-356 Crop Insurance Subsidies
In selecting insurance plans, a majority of the highest income and other participants both chose revenue plans, rather than yield plans from 2009 through 2013, but a smaller percentage of highest income participants picked revenue plans.30
In selecting coverage levels, a majority of the highest income and other participants chose to insure 65 to 75 percent of the expected value of their crops from 2009 through 2013.
Revenue plans, which protect farmers against crop revenue loss from declines in production or price, are the most popular plan type. Revenue plans accounted for an average of about 58 percent of the highest income participants’ premiums and 82 percent of the premiums of other participants. One reason the highest income participants may have chosen revenue plans less often than other participants was because they insured minor crops and specialty crops more frequently, based on our analysis of USDA data, and not all those crops are eligible for revenue plans, according to RMA documents. For major crops only, revenue plans accounted for nearly the same percentage of the highest income participants’ and other participants’ premiums (about 88 and 90 percent, respectively), according to our analysis.
31
In selecting crop insurance units, both the highest income and other participants chose optional units more often than basic or enterprise units from 2009 through 2013.
The highest income participants chose catastrophic coverage and coverage levels lower than 65 percent more often than other participants. They were less likely to choose coverage levels higher than 75 percent than other participants. This may be because the highest income participants insured specialty crops more frequently, and these crops are more likely to be irrigated, which reduces the likelihood of losses due to drought, according to academic and industry publications.
32
30Determined based on the premium dollars associated with revenue or yield plans.
Specifically, optional units accounted for 45
31Crop insurance participants can choose either catastrophic coverage, which insures 50 percent of normal yield and 55 percent of the estimated market price of the crop, or “buy-up” coverage, which provides higher levels of coverage. Buy-up coverage levels are available from 50 percent through 85 percent of normal yield and up to 100 percent of the estimated market price. 32Optional units cover all plantings in a single county of a crop with the same tenant and landlord, divided into smaller units by township section. Basic units cover all plantings in a single county of a crop with the same tenant and landlord. Enterprise units include all land for a single crop in a county, regardless of the tenant and landlord structure.
Highest Income Participants and Other Participants Made Similar Choices about Crop Insurance Protection
Page 17 GAO-15-356 Crop Insurance Subsidies
percent of the highest income participants’ premiums and 43 percent of the other participants’ premiums. Crop insurance participants using optional units have a higher probability of claiming losses because these units are associated with less geographic diversity than basic units. Enterprise units accounted for 30 percent of the premiums of the highest income participants and 39 percent of the premiums of the other participants. In general, enterprise units are regarded as less risky because compared with basic or optional units they include more land and so reflect more geographic diversity. Appendix IV contains additional information on the characteristics of crop insurance participants.
If crop insurance subsidies had been reduced for participants with the highest incomes from 2009 through 2013, the crop insurance program, including its actuarial soundness, would not likely be affected, according to our analysis of FSA and RMA data. In addition, the government would have saved tens of millions of dollars over the 5-year period. The savings would have been greater or smaller if other factors changed, such as participants’ choices about insurance protection, crop prices, participants’ income, or policy provisions.
Reducing Crop Insurance Subsidies for the Highest Income Participants Would Have Minimal Effect on the Program and Save Millions of Dollars
Page 18 GAO-15-356 Crop Insurance Subsidies
RMA is directed by law to adopt rates and coverages that will improve the actuarial soundness of the crop insurance program.33 For the federal crop insurance program, actuarial soundness means that the amount expected to be paid for claims is not greater than the portion of premiums collected that are designated to cover anticipated losses and a reasonable reserve.34
We determined that if Congress enacted statutory provisions to reduce premium subsidies for the highest income participants, it would most likely not affect the actuarial soundness or viability of the program because, based on our analysis of FSA and RMA data, the highest income participants (1) do not represent a lower risk to the program than participants in the remaining pool, (2) would be unlikely to leave the program, and (3) represent only about 1 percent of all participants and premiums in the program.
In addition, one of RMA’s goals is to continue to expand participation, according to its fiscal years 2011 to 2015 strategic plan.
First, our analysis of several measures that reflect risk indicates that the highest income participants do not represent a lower risk to the program at the national level than do other crop insurance participants. One measure that reflects risk— the average ratio of claims payments to total premiums, known as the loss ratio—was 0.84 for the highest income participants and 0.82 for other participants, from 2004 through 2013, suggesting that premiums were commensurate with claims payments, regardless of the income level of the participants.
Another measure that reflects risk─the loss cost ratio, which is a measure of claims payments per unit of liability─was lower for the highest income
33Federal Crop Insurance Act § 508(i)(1) (codified at 7 U.S.C. § 1508(i)(1)). Specifically, the law directs RMA to adopt rates and coverages that will improve the actuarial soundness of RMA’s insurance operations. In addition, the law directs RMA to fix premium rates for all plans of insurance that are actuarially sufficient to attain an expected loss ratio of not greater than 1.0. 7 U.S.C. § 1508(d)(1). The law defines “loss ratio” to mean the ratio of the amount paid by RMA for claims, to that portion of the premium designated for anticipated losses and a reasonable reserve, other than that portion of the premium designated for operating and administrative expenses. 7 U.S.C. § 1502(b)(8). 34The Actuarial Standards Board (ASB), which is the standards-setting entity of the U.S. actuarial profession, has noted that the phrase “actuarial soundness” has different meanings in different contexts, and that its meaning in a particular context might be imposed by an entity outside of the actuarial profession (e.g., a statute). The ASB’s standards state that if an actuary defines a process or result as “actuarially sound,” the actuary should define the meaning of “actuarially sound” in that context.
The Crop Insurance Program Would Likely Remain Actuarially Sound if Subsidies Were Reduced for the Highest Income Participants
Page 19 GAO-15-356 Crop Insurance Subsidies
participants than for other participants. However, according to our analysis, the difference could be explained by the participants’ choices in insurance plans, suggesting that the highest income participants do not represent a lower risk to the program. Specifically, from 2004 through 2013, the average loss cost ratio was about 6.3 percent for the highest income participants and 8.5 percent for other participants. The lower loss cost ratio for the highest income participants reflects, in part, that they chose yield, rather than revenue, insurance more often than did other participants. With yield insurance, which covers losses resulting from declines in production, participants have a lower likelihood of making a claim than with revenue insurance.35
One other measure that reflects risk, the premium rate, was about 7.5 percent charged to highest income participants compared with 10.5 percent charged to other participants. As with the loss cost ratio, this difference is in part a reflection of participants’ choices in insurance plans. Also, the lower premium rate for the highest income participants corresponds to their lower likelihood of filing claims (which results in part from their choices in insurance plans), so the portion of premiums designated for losses for the highest income participants nationwide would not be likely to surpass the amount of money needed to cover their claims. Table 3 summarizes data on loss ratio, loss cost ratio, and premium rates for the highest income and other participants from 2004 through 2013.
Revenue insurance, which covers losses resulting from declines in production, price, or both, was picked more frequently by other participants. The highest income participants also chose lower coverage levels, including catastrophic coverage, more often than did other participants and, with lower coverage levels participants are less likely to make claims under crop insurance policies.
35In this report, we use the phrase “likelihood of making claims” to denote both the probability of making claims and the amount claimed.
Page 20 GAO-15-356 Crop Insurance Subsidies
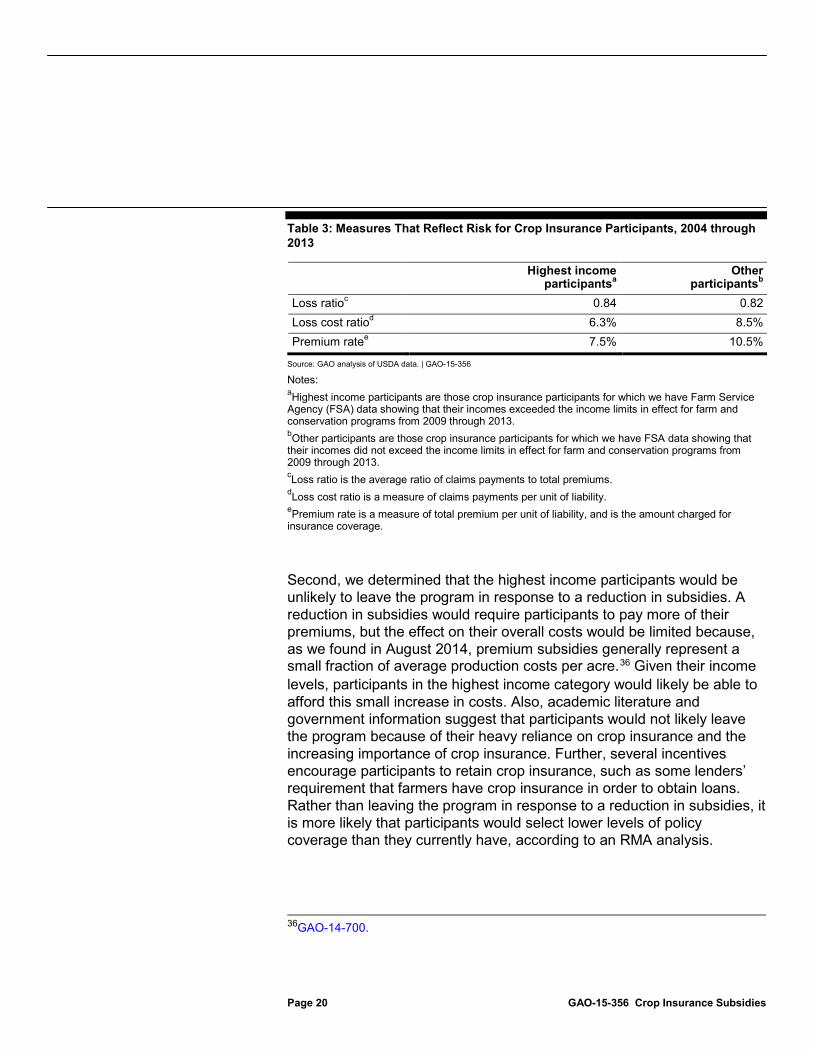
Table 3: Measures That Reflect Risk for Crop Insurance Participants, 2004 through 2013
Highest income
participantsa Other
participantsb Loss ratioc 0.84 0.82 Loss cost ratiod 6.3% 8.5% Premium ratee 7.5% 10.5%
Source: GAO analysis of USDA data. | GAO-15-356
Notes: aHighest income participants are those crop insurance participants for which we have Farm Service Agency (FSA) data showing that their incomes exceeded the income limits in effect for farm and conservation programs from 2009 through 2013. bOther participants are those crop insurance participants for which we have FSA data showing that their incomes did not exceed the income limits in effect for farm and conservation programs from 2009 through 2013. cLoss ratio is the average ratio of claims payments to total premiums. dLoss cost ratio is a measure of claims payments per unit of liability. ePremium rate is a measure of total premium per unit of liability, and is the amount charged for insurance coverage.
Second, we determined that the highest income participants would be unlikely to leave the program in response to a reduction in subsidies. A reduction in subsidies would require participants to pay more of their premiums, but the effect on their overall costs would be limited because, as we found in August 2014, premium subsidies generally represent a small fraction of average production costs per acre.36
36
Given their income levels, participants in the highest income category would likely be able to afford this small increase in costs. Also, academic literature and government information suggest that participants would not likely leave the program because of their heavy reliance on crop insurance and the increasing importance of crop insurance. Further, several incentives encourage participants to retain crop insurance, such as some lenders’ requirement that farmers have crop insurance in order to obtain loans. Rather than leaving the program in response to a reduction in subsidies, it is more likely that participants would select lower levels of policy coverage than they currently have, according to an RMA analysis.
GAO-14-700.
Page 21 GAO-15-356 Crop Insurance Subsidies
Third, if all of the highest income participants left the crop insurance program, the actuarial soundness of the program would not likely be affected because the highest income participants represent only about 1 percent of all participants and about 1 percent of premiums in the program. In addition, since their premiums generally correspond to their likelihood of collecting claims payments, their decisions to stay in or leave the program would not affect its actuarial soundness at the national level. Consequently, RMA would not generally need to raise premium rates for participants remaining in the pool.
If crop insurance premium subsidies had been reduced by 15 percentage points for the highest income participants that applied to farm and conservation programs with income limits each year from 2009 through 2013, the federal government would have saved more than $70 million over the 5-year period, according to our analysis of FSA and RMA data.37 If premium subsidies had been eliminated altogether for this group of highest income participants, the federal government would have saved about $290 million over the 5-year period. However, these estimates may understate what the actual savings would have been because, as mentioned earlier, our analysis does not cover all crop insurance participants.38 For example, our analysis does not include participants that decided not to apply for farm and conservation programs after they realized their incomes were too high but did participate in the crop insurance program.39
37In our estimate, we calculated the government savings that would have resulted if premium subsidies were reduced by 15 percentage points, excluding catastrophic policies, because these calculations were consistent with proposals raised during the 2014 farm bill debate.
Furthermore, the crop insurance program is expanding with the new shallow loss programs under the 2014 farm bill, and savings would be higher if these programs were subject to a subsidy reduction for the highest income participants. The savings estimate we discuss in this report is one of several such estimates we have calculated in reports on the crop insurance program; these estimates are summarized in appendix V.
38Our analysis covers about 66 percent of crop insurance participants, which accounted for about 73 percent of the premiums, and our analysis does not estimate savings for the remaining participants and premiums. 39FSA does not have data on participants that did not apply for farm and conservation programs, so their number is not known.
Reducing Subsidies for the Highest Income Participants Would Have Saved Millions from 2009 through 2013
Page 22 GAO-15-356 Crop Insurance Subsidies
Other factors, such as participants’ choices about insurance protection, could also affect the amount of savings. For example, if some of the highest income participants selected less expensive insurance plans or lower coverage levels, or if they left the program in response to a reduction in subsidies, the potential savings would be greater because the total amount of federal premium subsidies would decrease. Participants’ decisions could be influenced by multiple factors, including the availability of other risk management tools to protect against crop and revenue losses. For example, some risk management tools—such as forward contracts that lock in a price to be paid on a future date—are not generally available for all crops. Other risk management tools for participants include producing a diverse range of crops and livestock, working in off-farm occupations, or accruing enough savings to self-insure, according to some agricultural economists.
In addition to participants’ choices, several other factors could influence federal government savings, such as crop prices, participants’ income, or policy provisions. If crop prices changed, savings could be smaller or larger because premiums are affected by crop prices and, as the value of the crops being insured goes up or down, so do crop insurance premiums. Since premium subsidies are a set percentage of the premiums, these subsidy amounts would rise or fall along with premium amounts. If participants’ incomes changed, the number of participants with incomes exceeding a given threshold could also change, affecting the amount of federal government savings. Policy provisions could also influence savings by specifying an income threshold or reduction in subsidies that differs from the ones used in our analysis. For example, the $900,000 income limit for individuals that went into effect for farm programs in 2014 affected less than one-half of 1 percent of farm program participants, according to preliminary FSA data. If this limit applied to crop insurance participants, and one-half of 1 percent of these participants had their premium subsidies reduced by 15 percentage points, assuming other factors did not change, the federal government would save about $35 million over 5 years.
Page 23 GAO-15-356 Crop Insurance Subsidies
USDA could use existing procedures without adding requirements for a majority of crop insurance participants if a statutory provision were enacted directing USDA to reduce premium subsidies for the highest income participants. According to FSA officials, FSA has existing procedures to administer income limits for farm and conservation programs that could be used to identify the highest income crop insurance participants if such a provision were enacted. According to RMA officials, even with information from FSA, RMA and the insurance companies could face some challenges in administering a provision that would reduce premium subsidies for the highest income participants. However, RMA has procedures in place or under development that may help administer a premium subsidy reduction for the highest income participants.
FSA, in cooperation with the IRS, has existing procedures to verify participants’ compliance with income limits applicable to farm and conservation programs. FSA officials told us that these procedures could be used to identify the highest income participants in the crop insurance program, if required. As we reported in August 2013, FSA and the IRS implemented an income verification process in 2009.40 As part of this process, applicants certify whether their income is above or below the limits and provide consent for the IRS to disclose certain tax-related information to FSA.41 Entities that participate in farm and conservation programs identify their members and the percentage share they comprise in the entity because individuals, entities, and all members of those entities are subject to income limits. FSA also verifies compliance with the income limits for applicants that only participate in NRCS’s conservation programs. NRCS accesses FSA’s eligibility data system—used to document whether applicants comply with requirements including income limits and are eligible for program benefits—to determine applicants’ compliance with income limits.42
40
FSA has existing procedures to safeguard the privacy and confidentiality of applicants’ income information, according to agency documents. Appendix II contains
GAO-13-741. 41According to the memorandum of understanding between the IRS and USDA, IRS does not provide specific income figures to USDA, only an indication of whether participants had income above or below the limits. 42FSA is responsible for administering the majority of farm program payments while NRCS administers payments for most conservation programs. Many farm and conservation programs are subject to income limits.
USDA Could Use Existing Procedures to Reduce Crop Insurance Subsidies for the Highest Income Participants
Page 24 GAO-15-356 Crop Insurance Subsidies
additional information on the procedures that FSA uses to administer income limits for farm and conservation programs.
If premium subsidies were reduced for the highest income crop insurance participants, a majority of crop insurance participants would not need to provide additional information to FSA, according to our analysis of agency data from 2009 through 2013. About two-thirds of crop insurance participants, on average, also participated in farm and conservation programs that have income limits. In order to be eligible for these programs, participants complete forms certifying their compliance with the limits. This information could be used for the crop insurance program if a similar provision were enacted. The approximately one-third of crop insurance participants that do not already provide information to FSA would need to complete a form certifying that their income was below the limits and authorizing FSA to verify this information. Entities also would need to provide FSA with information about their entity structure and their members if they do not already provide that information. As we found, in September 2013, participants in certain farm programs have had to submit this information and update it as needed.43
If premium subsidies were reduced for the highest income crop insurance participants, there are opportunities for RMA to work with FSA to obtain access to FSA’s eligibility data system. This would allow RMA to identify crop insurance participants with the highest income. Administering the reduction of premium subsidies would involve
FSA is currently responsible for determining whether participants have incomes exceeding the limits for both FSA and NRCS programs. FSA officials told us that they could also make these determinations for crop insurance participants that are not participating in farm and conservation programs, if needed.
• informing crop insurance participants and insurance companies of the requirements, including when participants need to certify their income and provide other needed information to FSA, and
• calculating the appropriate premium subsidy amount for each crop insurance participant.
43GAO, Farm Programs: Changes Are Needed to Eligibility Requirements for Being Actively Involved in Farming, GAO-13-781 (Washington, D.C.: Sept. 26, 2013).
Page 25 GAO-15-356 Crop Insurance Subsidies
RMA officials told us that administering a provision that would reduce premium subsidies for the highest income participants would pose some challenges, but these could be addressed through discussions with FSA and the insurance companies. For example, RMA and FSA would need to reconcile their data on entities because members of entities—which are subject to income limits—may be reported differently for crop insurance and farm and conservation programs, according to RMA officials. Additionally, RMA officials said crop insurance participants’ income status would need to be known in advance of the application for or renewal of crop insurance policies, to allow insurance companies to quote accurate premiums and participants to make informed decisions about their insurance protection.
RMA has existing procedures to administer the eligibility requirements of the crop insurance program and to reduce benefits, including premium subsidies, under certain conditions. Some of these procedures may be similar to those that would be needed to reduce premium subsidies for the highest income participants. For example, RMA’s regulations and guidance direct insurance companies to proportionally or fully reduce coverage in policies where some or all members of an entity are ineligible for crop insurance.44 In addition, RMA revised its procedures to comply with a modification in the 2014 farm bill that calls for reducing program benefits, including premium subsidies, for some crop insurance participants that newly till land in certain states.45
RMA, FSA, and NRCS are also developing procedures to administer the conservation compliance requirements in the 2014 farm bill that may help administer premium subsidy reductions for the highest income crop insurance participants. Agency officials told us that they expect to promulgate program rules and issue guidance for implementation in 2015.
Specifically, the insurance companies are responsible for reporting when a crop insurance participant tills land covered in the provision, according to RMA officials.
44Certain persons are ineligible to participate in crop insurance, such as persons who have delinquent debt or individuals who are not U.S. citizens, U.S. noncitizen nationals, or qualified aliens. 7 C.F.R. §400.679. 45Crop insurance participants in Iowa, Minnesota, Montana, Nebraska, North Dakota, and South Dakota that till more than 5 acres of native sod—land that has not been previously tilled—to grow an annual crop have premium subsidies cut in half and other benefits reduced. The reductions apply during the first 4 crop years that the native sod acreage is covered by crop insurance.
Page 26 GAO-15-356 Crop Insurance Subsidies
The 2014 farm bill expanded conservation compliance requirements, applicable to farm program payments since 1985, to crop insurance premium subsidies, that had been excluded from the requirement since 1996. Under the 2014 farm bill, participants are prohibited from receiving premium subsidies if they produce agricultural commodities on land that is prone to erosion without implementing an approved conservation plan or obtaining an exemption or if they convert a wetland to grow agricultural commodities. All crop insurance participants must certify their compliance with conservation requirements by submitting a one-time form to FSA. Some participants may also need to take additional steps, such as developing and implementing a conservation plan that has been reviewed and approved by the NRCS. To administer these requirements, FSA and RMA officials said that they are currently expanding their information sharing capabilities. For example, FSA and RMA officials told us that they expect RMA will have access to FSA’s eligibility data system.
The federal crop insurance program plays a critical role in helping participants manage the risk that is inherent in farming. The federal government has promoted the use of crop insurance through premium subsidies in part to achieve high participation and coverage levels. However, as budgetary pressures persist, it is crucial that federal resources are targeted as effectively as possible. Reducing premium subsidies for the highest income crop insurance participants presents an opportunity to save millions of taxpayer dollars with minimal effect on participants and the program. From 2009 through 2013, if the income thresholds in effect for farm and conservation programs had applied to crop insurance, we estimate that about 1 percent of crop insurance participants would have exceeded the thresholds and had their subsidies reduced. These participants would still have access to crop insurance and, given their income level, they would be able to afford the higher premiums if their subsidies were reduced. Further, reducing subsidies for the highest income participants would not likely affect the program’s actuarial soundness or viability. USDA has existing procedures and some under development that would help it implement a reduction in premium subsidies for the highest income participants.
To reduce the cost of the crop insurance program and achieve budgetary savings for deficit reduction or other purposes, Congress should consider reducing premium subsidies for the highest income participants.
Conclusions
Matter for Congressional Consideration
Page 27 GAO-15-356 Crop Insurance Subsidies
We provided a draft of this report for review and comment to USDA. In its written comments, reproduced in appendix VI, USDA said it had no comment on the draft report.
We are sending copies of this report to the appropriate congressional committees; the Secretary of Agriculture; the Director, Office of Management and Budget; and other interested parties. In addition, the report is available at no charge on the GAO website at http://www.gao.gov.
If you or your staff members have any questions about this report, please contact me at (202) 512-3841 or [email protected]. Contact points for our Offices of Congressional Relations and Public Affairs may be found on the last page of this report. GAO staff who made key contributions to this report are listed in appendix VII.
Anne-Marie Fennell Director, Natural Resources and Environment
Agency Comments and Our Evaluation
Appendix I: Objectives, Scope, and Methodology
Page 28 GAO-15-356 Crop Insurance Subsidies
Our objectives were to determine, if premium subsidies were reduced for participants with the highest incomes, (1) the percentage and characteristics of participants that would be affected; (2) the impact, if any, on the crop insurance program; and (3) how the U.S. Department of Agriculture (USDA) could implement a reduction in premium subsidies for the highest income participants.
To address the first objective, we matched Risk Management Agency (RMA) data on crop insurance participants, including individuals, entities, and members of entities, and the Farm Service Agency (FSA) data on farm and conservation programs’ participants from 2009 through 2013. We used the FSA data because the agency had data on participants’ compliance with income limits for farm and conservation programs. We chose this time frame because FSA had implemented procedures to verify the income of program participants starting in 2009, and 2013 was the most recent year available.
We identified crop insurance participants that were in both the RMA and FSA datasets, either directly or through an entity, to determine whether they exceeded income limits in effect for farm and conservation programs. For this group, which included about two-thirds of crop insurance participants, we determined the percentage of participants whose incomes exceeded limits in the Food, Conservation, and Energy Act of 2008. Specifically, these limits included, depending on the program, average adjusted gross farm income of $750,000; average adjusted gross nonfarm income of $500,000; or average adjusted gross nonfarm income of $1 million, unless at least two-thirds of the average adjusted gross income was average adjusted gross farm income. For 2012 and 2013 only, there was an additional limit of average adjusted gross income of $1 million, including both farm income and nonfarm income, applied for certain farm payments. We identified the number of participants that FSA determined to be ineligible because their incomes exceeded statutory limits, and we considered those the “highest income participants.” We did not determine, for each statutory limit, the number of participants with incomes exceeding it because some participants were subject to multiple income limits, and FSA data did not always specify which limit or limits had been exceeded by a given participant. We included in our estimates of the number of highest income participants those that had catastrophic coverage policies. We also used a second analytical approach in which we assumed participants that exceeded income limits in at least 1 year, exceeded the limits during all 5 years. This approach allowed us to include some of the highest income participants that may have left farm and conservation programs because
Appendix I: Objectives, Scope, and Methodology
Appendix I: Objectives, Scope, and Methodology
Page 29 GAO-15-356 Crop Insurance Subsidies
they were identified as exceeding income limits. We considered this to be an upper estimate because some of these participants may have left for other reasons.
We analyzed RMA data to identify the characteristics of these and other participants for which we had income information, including the states listed on their policies, the crops they insured, and the insurance plans and coverage they selected. Some crop insurance participants had shares in multiple policies in more than one state. In those cases, when determining the number and percentage of participants in each state, we used the state on the crop insurance policy closest to the address in FSA’s records. The address in the FSA records is generally the participant’s residence or business address, according to an FSA official. We used premiums as the basis of our analysis for the crops and insurance plans and coverage, and we assigned the dollars proportionally based on the share of the policy or policies insured by the participants. For example, if a policy had two individuals listed as policyholders, we assigned 50 percent of the premium for that policy to each one. If a single individual had shares in multiple policies, we added up his or her shares to determine the total premiums attributed to that individual. Unless otherwise indicated, the data we report are based on crop years.
We used additional sources of information to corroborate our analysis of RMA and FSA data, including USDA survey data,1
1USDA, National Agricultural Statistics Service, Agricultural Resource Management Survey, 2009-2012.
agency documents and reports, information from other sources such as state and state university reports and company websites, and interviews with USDA officials. Because about one-third of crop insurance participants did not participate in farm and conservation programs, we did not have FSA data on their income. To learn about the income and characteristics of the entire population of crop insurance participants, we therefore analyzed USDA survey data of a sample of U.S. farm operations from 2009 through 2012, the latest year available. Specifically, we reviewed data for U.S. farm operations that had crop insurance expenditures. Of these farm operations, we compared operations that reported exceeding any of the income limits in effect for farm and conservation programs with those that reported exceeding none of them. We analyzed RMA program information such as RMA’s summary of business reports and crop policy
Appendix I: Objectives, Scope, and Methodology
Page 30 GAO-15-356 Crop Insurance Subsidies
provisions to determine the extent to which different insurance options were available for certain crops. For illustrative examples of the highest income crop insurance participants, we used publicly available sources of information such as company web sites. For example, we used information from the websites of companies to identify the professions of the highest income crop insurance participants. In addition, we interviewed FSA, RMA, and Economic Research Service officials regarding the number and characteristics of the highest income participants and other participants in the crop insurance program.
To address the second objective, we reviewed RMA’s authorizing legislation and analyzed RMA data to determine the effects, if any, on the actuarial soundness of the program if premium subsidies were reduced for the highest income crop insurance participants and savings to the federal government. To calculate the effect, if any, on the actuarial soundness of the crop insurance program, we analyzed the value of the crops insured, loss experiences of, and premiums provided on behalf of (1) the highest income participants and (2) other participants, from 2004 through 2013. Specifically, we analyzed data on three measures that reflect risk (loss ratio, loss cost ratio, and premium rate) to determine whether the highest income participants represented a lower risk to the program than other participants. We reviewed USDA and other studies and interviewed agency officials, academics, and actuarial professionals to consider whether the highest income participants would be likely to leave the crop insurance program if their subsidies were reduced, and we used our findings about the percentage of crop insurance participants who would be affected to assess the potential effects on the program if the highest income participants did leave.
We chose the 10-year time frame to capture the effects of factors that can change from year to year, such as crop prices, and others that are infrequent, such as extreme weather. There are trade-offs in choosing the number of years of data to examine. A group of actuarial experts told us that using 5 years of data is not enough to cover the weather cycle, while using older data is less relevant because the crop insurance program has changed, and that at least 10 years of data are needed. Also, RMA, in its most recent study of its methodology for setting premium rates in 2010, found that its methodology was sound but concluded that the agency should place more weight on loss experience from more recent years to better account for current risks faced by farmers. Because we did not have complete income information for 10 years, we assumed that participants that had incomes that exceeded the limits in 1 or more years from 2009 through 2013 were highest income for the entire period. This
Appendix I: Objectives, Scope, and Methodology
Page 31 GAO-15-356 Crop Insurance Subsidies
method assumes that any participant identified as highest income from 2009 through 2013 was highest income from 2004 through 2013. This does not take into account that some of these participants may not have been highest income in each of those years. Also, there may be participants that were not identified as highest income in 2009 through 2013 but that were highest income from 2004 through 2008. For these estimates, the data we report are based on crop years. In addition, we reviewed USDA studies, our prior reports, and other studies. We also interviewed RMA officials, academics, and actuarial professionals regarding the costs of the crop insurance program and the potential effects on the actuarial soundness and participation in crop insurance if premium subsidies were reduced for the highest income participants.
To calculate the potential government savings if premium subsidies were reduced for the highest income participants, we analyzed RMA and FSA data to estimate the amount of subsidies paid on behalf of participants with incomes that exceeded the limits from 2009 through 2013, and we calculated the savings that would have resulted (excluding catastrophic policies) if these subsidies were reduced by 15 percentage points or eliminated.2 These calculations were consistent with proposals raised during the 2014 farm bill debate.3
To address the third objective, we reviewed USDA documents and our prior reports to determine how USDA could administer a provision that would reduce premium subsidies for the highest income crop insurance participants. We reviewed the Agricultural Act of 2014, USDA regulations and guidance, and we interviewed RMA, FSA, and NRCS officials to determine how the agencies are implementing conservation compliance for crop insurance and to obtain an update from FSA on how it is administering income limits for farm and conservation programs. We
We estimated the savings that would have resulted if the subsidies were eliminated to provide an upper estimate for the potential savings. We chose the 5-year time period because recent years more closely reflect current program provisions and participation levels.
2In our estimate of government costs, we did not include administrative and operating expenses because we assumed that participants made the same insurance plan choices, in which case these costs would not change. We did not include underwriting gains or losses because of the unpredictability of natural events and market price changes that affect these gains or losses. 3See e.g., S. 954, 113th Cong., § 11033 (as passed by Senate, June 10, 2012).
Appendix I: Objectives, Scope, and Methodology
Page 32 GAO-15-356 Crop Insurance Subsidies
reviewed industry and academic publications and testimonies to identify challenges that may be posed by administering a provision that would reduce premium subsidies for the highest income participants. We also interviewed RMA and FSA officials regarding the potential feasibility of administering such a provision and potential challenges.
For the data used in our analyses, we generally reviewed agency documentation, such as guidance, handbooks, and reports related to the data systems, interviewed knowledgeable officials, and reviewed applicable internal controls information to evaluate the reliability of these data. In each case, we concluded that the data were sufficiently reliable for the purposes of this report. We conducted this performance audit from December 2013 to March 2015 in accordance with generally accepted government auditing standards. Those standards require that we plan and perform the audit to obtain sufficient, appropriate evidence to provide a reasonable basis for our findings and conclusions based on our audit objectives. We believe that the evidence obtained provides a reasonable basis for our findings and conclusions based on our audit objectives.
Appendix II: Farm Service Agency’s Procedures for Administering Income Limits for Farm and Conservation Programs
Page 33 GAO-15-356 Crop Insurance Subsidies
The Food, Conservation, and Energy Act of 2008 (2008 farm bill), modified eligibility rules for many farm and conservation programs, including setting separate income limits for an individual’s or legal entity’s farm income and nonfarm income.1 In October 2008, we recommended that the Farm Service Agency (FSA) work with the Internal Revenue Service (IRS) to develop a system for verifying income eligibility for all recipients of farm payments. FSA, in cooperation with IRS, implemented procedures for verifying whether farm and conservation program participants’ incomes exceeded statutory limits starting in 2009.2
Under the 2008 farm bill, income limits for farm and conservation programs were based on adjusted gross income (AGI) limits averaged over the 3 most recent tax years. Specifically, participants were not eligible to receive some farm payments if their average adjusted gross nonfarm income exceeded $500,000; another type of farm payment if their average adjusted gross farm income exceeded $750,000; and conservation payments if their average adjusted gross nonfarm income exceeded $1 million, unless at least 66.66 percent of their average AGI was average adjusted gross farm income. Further, for 2012 and 2013 only, a $1 million average limit on total AGI, both farm and nonfarm, applied for certain farm payments. Because these income limits applied to individuals, under certain conditions, a married couple could collectively earn up to $2 million in average AGI and be eligible for certain farm payments in 2012 and 2013. The 2008 farm bill also allowed the U.S. Department of Agriculture (USDA) to waive the income limit for conservation payments in cases involving environmentally sensitive land of special significance.
In 2014, FSA made changes to incorporate income limits applicable to farm and conservation programs in the Agricultural Act of 2014 (2014 farm bill), and made other adjustments to its procedures.
FSA developed procedures to apply the income limits to program participants, as we found in August 2013.3
1Pub. L. No. 110-246 § 1604(a), 110 Stat. 1651, 1741 (amending 7 U.S.C. § 1308-3a(b)).
Starting in 2009, all applicants to farm and conservation programs have had to both (1) certify their compliance with income limits and (2) provide written consent for the IRS
2 GAO-13-741. 3 GAO-13-741.
Appendix II: Farm Service Agency’s Procedures for Administering Income Limits for Farm and Conservation Programs
Appendix II: Farm Service Agency’s Procedures for Administering Income Limits for Farm and Conservation Programs
Page 34 GAO-15-356 Crop Insurance Subsidies
to release certain information to FSA to verify their income. In 2009 and 2010, participants provided the certification and consent in two separate forms; starting in 2011, they could use a single form. Participants that chose not to submit a consent form were ineligible for farm and conservation programs subject to income limits and had to refund all payments received under these programs. For participants that provided consent, IRS used its tax database to estimate farm income and nonfarm income according to USDA instructions. IRS computer programs compared these income estimates against the 2008 farm bill’s income limits to identify participants that may have exceeded these limits, and IRS provided the resulting list to FSA. FSA then notified potentially ineligible participants to give them the opportunity to provide documentation, such as tax returns, if they believed their income did not exceed the eligibility limits. FSA state offices were to review the information provided and determine whether participants had income exceeding the limits. FSA also deemed participants to be noncompliant with the limits if they (1) provided an acknowledgment that their incomes exceeded the limits or (2) did not respond at all. FSA state offices informed their state-level Natural Resources Conservation Service (NRCS) counterparts of participants that were determined to have exceeded income limits for conservation programs, so that NRCS could recover any overpayments made to participants in its programs.
Under the 2008 farm bill, FSA also established procedures to apply income limits to entities, members of entities, and couples who filed joint returns, according to FSA’s regulations and handbook on payment eligibility, payment limitations, and average AGI.4
4USDA, FSA Handbook, Payment Eligibility, Payment Limitation, and Average AGI, for State and County Offices, 4-PL (Washington, D.C.: August 2014).
Entities had to provide a form including information about the entity, its members, and the percentage ownership share of each member, and update it as needed. FSA required this information to verify entities’ compliance with provisions other than income limits that are applicable to farm programs. Compliance with income limits was tracked through four levels of legal entity ownership. If some individuals or entities within the four levels did not comply with the income limits, payments were reduced by an amount commensurate with the ineligible share. For married couples who filed joint tax returns, FSA considered the joint income levels to make eligibility determinations, unless a certified public accountant or attorney provided a
Appendix II: Farm Service Agency’s Procedures for Administering Income Limits for Farm and Conservation Programs
Page 35 GAO-15-356 Crop Insurance Subsidies
statement of what each individual’s income would have been had the couple filed separate tax returns.
FSA is revising its procedures to incorporate the income limit enacted in the 2014 farm bill and to help improve its operation, although the procedures established to implement the limits under the 2008 farm bill will generally remain in place. FSA is updating its forms, handbook, and eligibility data system to reflect the revised procedures. These changes were made because the 2014 farm bill now includes an average AGI limit of $900,000, calculated over the 3 most recent tax years, rather than multiple limits, and makes no distinction between farm and nonfarm income. According to FSA officials, this limit is expected to simplify the administration of income limits. FSA is also making changes aimed at improving its operation. For example, starting in December 2014, FSA has announced that it has largely automated its process for ensuring it has certification and consent forms on file for all participants subject to income limits.
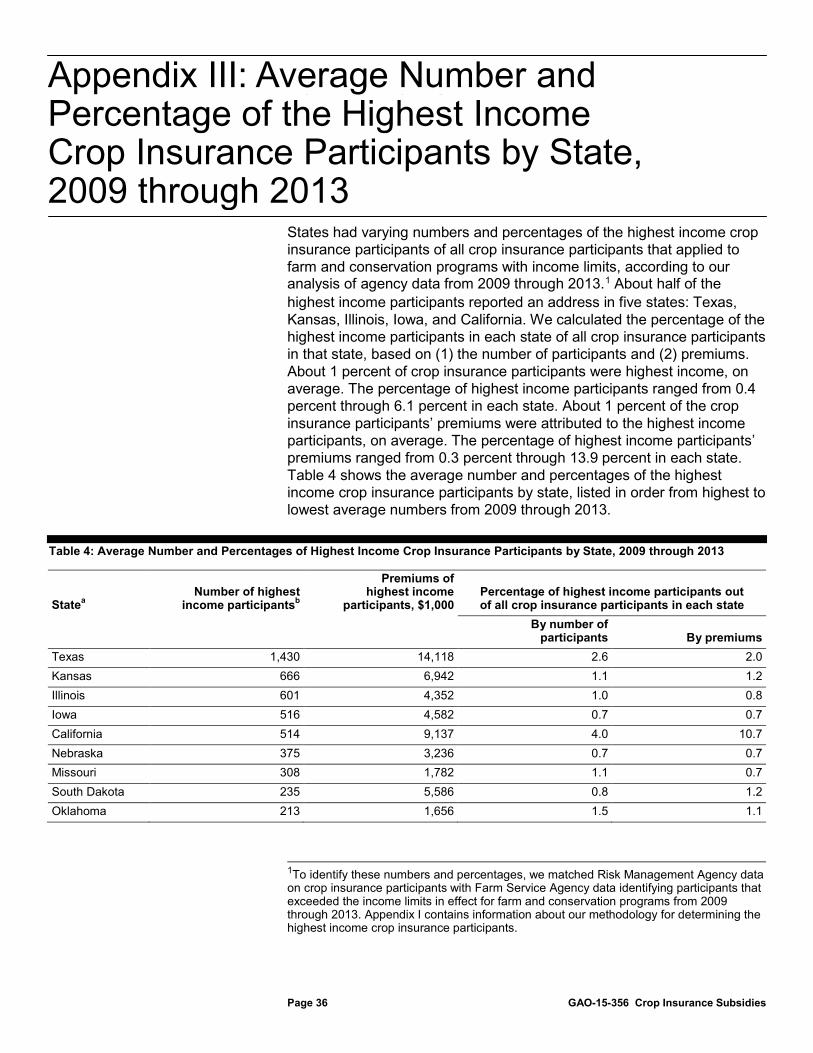
Appendix III: Average Number and Percentage of the Highest Income Crop Insurance Participants by State, 2009 through 2013
Page 36 GAO-15-356 Crop Insurance Subsidies
States had varying numbers and percentages of the highest income crop insurance participants of all crop insurance participants that applied to farm and conservation programs with income limits, according to our analysis of agency data from 2009 through 2013.1
Table 4: Average Number and Percentages of Highest Income Crop Insurance Participants by State, 2009 through 2013
About half of the highest income participants reported an address in five states: Texas, Kansas, Illinois, Iowa, and California. We calculated the percentage of the highest income participants in each state of all crop insurance participants in that state, based on (1) the number of participants and (2) premiums. About 1 percent of crop insurance participants were highest income, on average. The percentage of highest income participants ranged from 0.4 percent through 6.1 percent in each state. About 1 percent of the crop insurance participants’ premiums were attributed to the highest income participants, on average. The percentage of highest income participants’ premiums ranged from 0.3 percent through 13.9 percent in each state. Table 4 shows the average number and percentages of the highest income crop insurance participants by state, listed in order from highest to lowest average numbers from 2009 through 2013.
Statea Number of highest
income participantsb
Premiums of highest income
participants, $1,000 Percentage of highest income participants out of all crop insurance participants in each state
By number of participants By premiums
Texas 1,430 14,118 2.6 2.0 Kansas 666 6,942 1.1 1.2 Illinois 601 4,352 1.0 0.8 Iowa 516 4,582 0.7 0.7 California 514 9,137 4.0 10.7 Nebraska 375 3,236 0.7 0.7 Missouri 308 1,782 1.1 0.7 South Dakota 235 5,586 0.8 1.2 Oklahoma 213 1,656 1.5 1.1
1To identify these numbers and percentages, we matched Risk Management Agency data on crop insurance participants with Farm Service Agency data identifying participants that exceeded the income limits in effect for farm and conservation programs from 2009 through 2013. Appendix I contains information about our methodology for determining the highest income crop insurance participants.
Appendix III: Average Number and Percentage of the Highest Income Crop Insurance Participants by State, 2009 through 2013
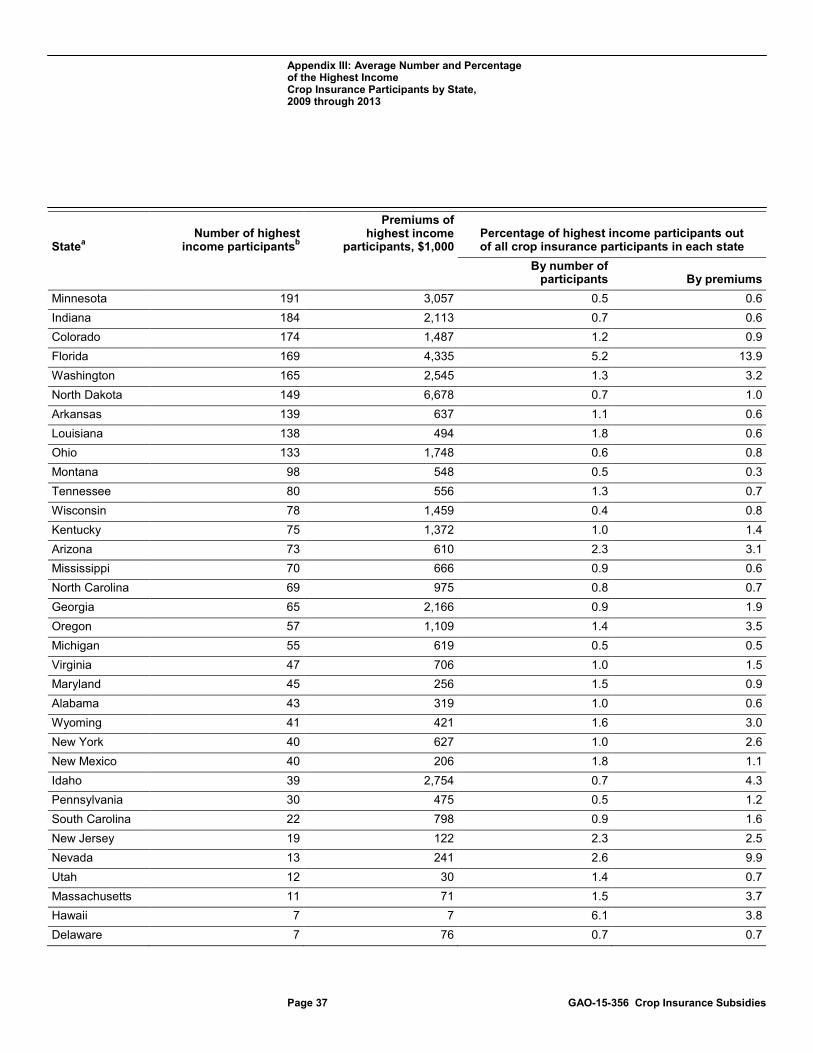
Appendix III: Average Number and Percentage of the Highest Income Crop Insurance Participants by State, 2009 through 2013
Page 37 GAO-15-356 Crop Insurance Subsidies
Statea Number of highest
income participantsb
Premiums of highest income
participants, $1,000 Percentage of highest income participants out of all crop insurance participants in each state
By number of participants By premiums
Minnesota 191 3,057 0.5 0.6 Indiana 184 2,113 0.7 0.6 Colorado 174 1,487 1.2 0.9 Florida 169 4,335 5.2 13.9 Washington 165 2,545 1.3 3.2 North Dakota 149 6,678 0.7 1.0 Arkansas 139 637 1.1 0.6 Louisiana 138 494 1.8 0.6 Ohio 133 1,748 0.6 0.8 Montana 98 548 0.5 0.3 Tennessee 80 556 1.3 0.7 Wisconsin 78 1,459 0.4 0.8 Kentucky 75 1,372 1.0 1.4 Arizona 73 610 2.3 3.1 Mississippi 70 666 0.9 0.6 North Carolina 69 975 0.8 0.7 Georgia 65 2,166 0.9 1.9 Oregon 57 1,109 1.4 3.5 Michigan 55 619 0.5 0.5 Virginia 47 706 1.0 1.5 Maryland 45 256 1.5 0.9 Alabama 43 319 1.0 0.6 Wyoming 41 421 1.6 3.0 New York 40 627 1.0 2.6 New Mexico 40 206 1.8 1.1 Idaho 39 2,754 0.7 4.3 Pennsylvania 30 475 0.5 1.2 South Carolina 22 798 0.9 1.6 New Jersey 19 122 2.3 2.5 Nevada 13 241 2.6 9.9 Utah 12 30 1.4 0.7 Massachusetts 11 71 1.5 3.7 Hawaii 7 7 6.1 3.8 Delaware 7 76 0.7 0.7
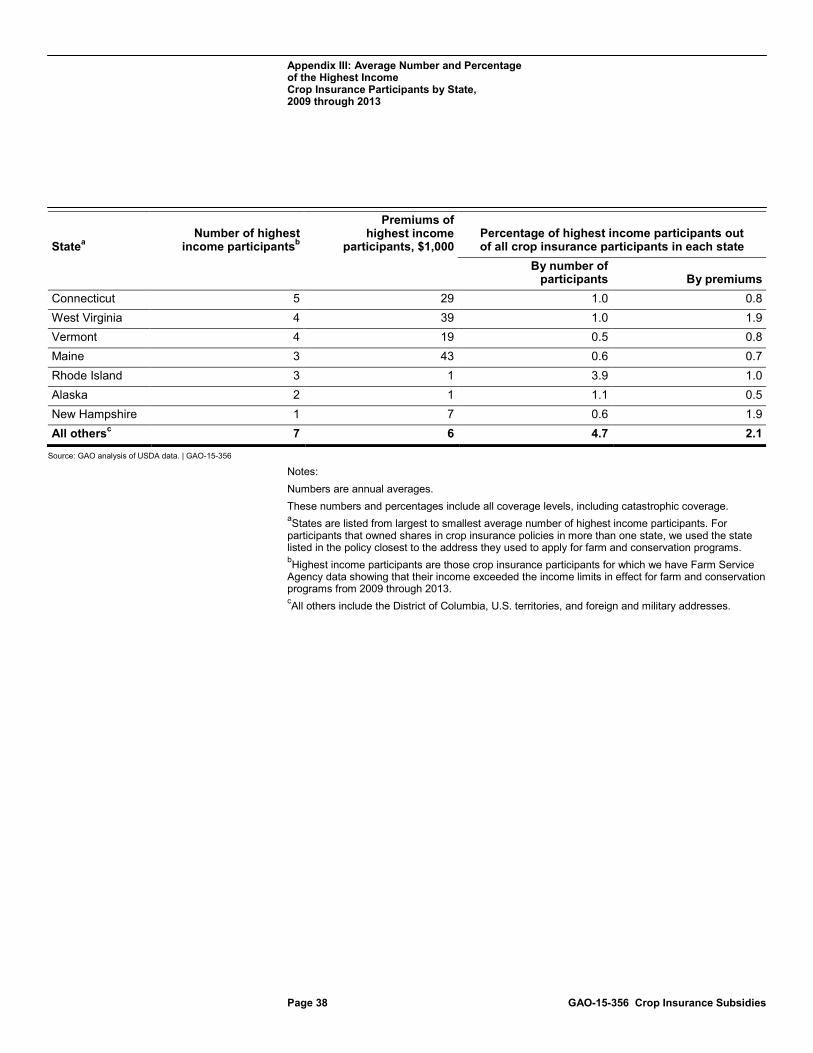
Appendix III: Average Number and Percentage of the Highest Income Crop Insurance Participants by State, 2009 through 2013
Page 38 GAO-15-356 Crop Insurance Subsidies
Statea Number of highest
income participantsb
Premiums of highest income
participants, $1,000 Percentage of highest income participants out of all crop insurance participants in each state
By number of participants By premiums
Connecticut 5 29 1.0 0.8 West Virginia 4 39 1.0 1.9 Vermont 4 19 0.5 0.8 Maine 3 43 0.6 0.7 Rhode Island 3 1 3.9 1.0 Alaska 2 1 1.1 0.5 New Hampshire 1 7 0.6 1.9 All othersc 7 6 4.7 2.1
Source: GAO analysis of USDA data. | GAO-15-356
Notes: Numbers are annual averages. These numbers and percentages include all coverage levels, including catastrophic coverage. aStates are listed from largest to smallest average number of highest income participants. For participants that owned shares in crop insurance policies in more than one state, we used the state listed in the policy closest to the address they used to apply for farm and conservation programs. bHighest income participants are those crop insurance participants for which we have Farm Service Agency data showing that their income exceeded the income limits in effect for farm and conservation programs from 2009 through 2013. cAll others include the District of Columbia, U.S. territories, and foreign and military addresses.
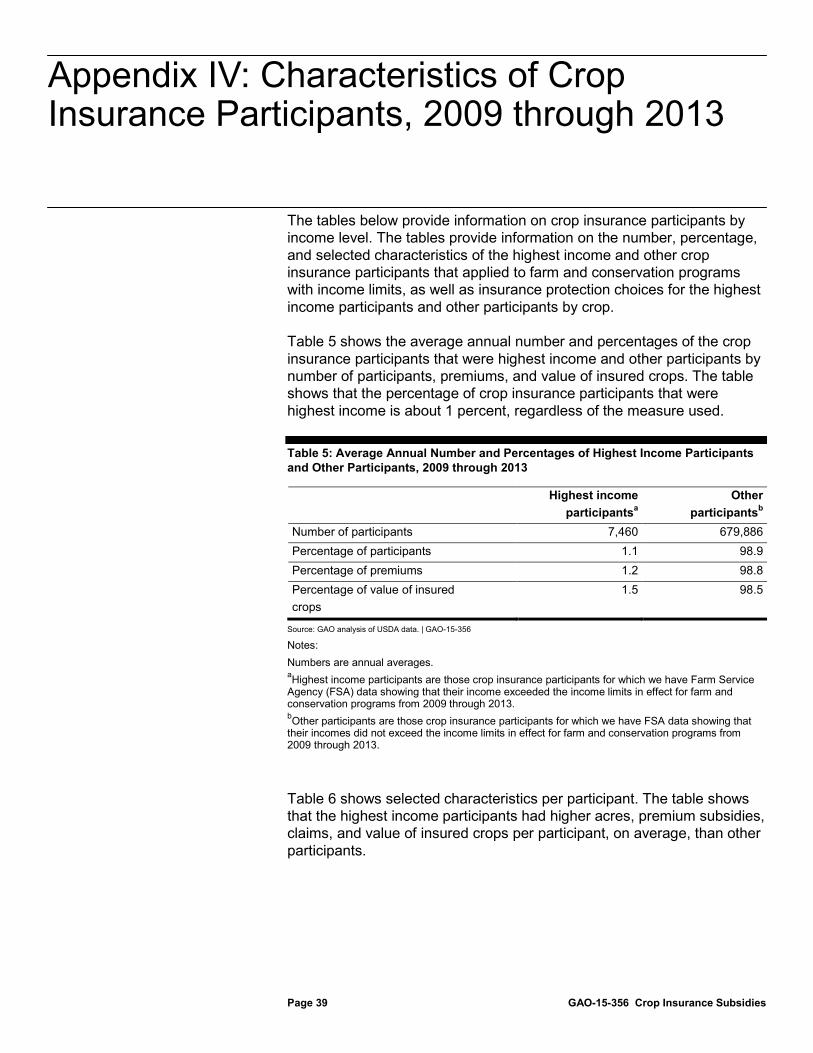
Appendix IV: Characteristics of Crop Insurance Participants, 2009 through 2013
Page 39 GAO-15-356 Crop Insurance Subsidies
The tables below provide information on crop insurance participants by income level. The tables provide information on the number, percentage, and selected characteristics of the highest income and other crop insurance participants that applied to farm and conservation programs with income limits, as well as insurance protection choices for the highest income participants and other participants by crop.
Table 5 shows the average annual number and percentages of the crop insurance participants that were highest income and other participants by number of participants, premiums, and value of insured crops. The table shows that the percentage of crop insurance participants that were highest income is about 1 percent, regardless of the measure used.
Table 5: Average Annual Number and Percentages of Highest Income Participants and Other Participants, 2009 through 2013
Highest income
participantsa Other
participantsb Number of participants 7,460 679,886 Percentage of participants 1.1 98.9 Percentage of premiums 1.2 98.8 Percentage of value of insured crops
1.5 98.5
Source: GAO analysis of USDA data. | GAO-15-356
Notes: Numbers are annual averages. aHighest income participants are those crop insurance participants for which we have Farm Service Agency (FSA) data showing that their income exceeded the income limits in effect for farm and conservation programs from 2009 through 2013. bOther participants are those crop insurance participants for which we have FSA data showing that their incomes did not exceed the income limits in effect for farm and conservation programs from 2009 through 2013.
Table 6 shows selected characteristics per participant. The table shows that the highest income participants had higher acres, premium subsidies, claims, and value of insured crops per participant, on average, than other participants.
Appendix IV: Characteristics of Crop Insurance Participants, 2009 through 2013
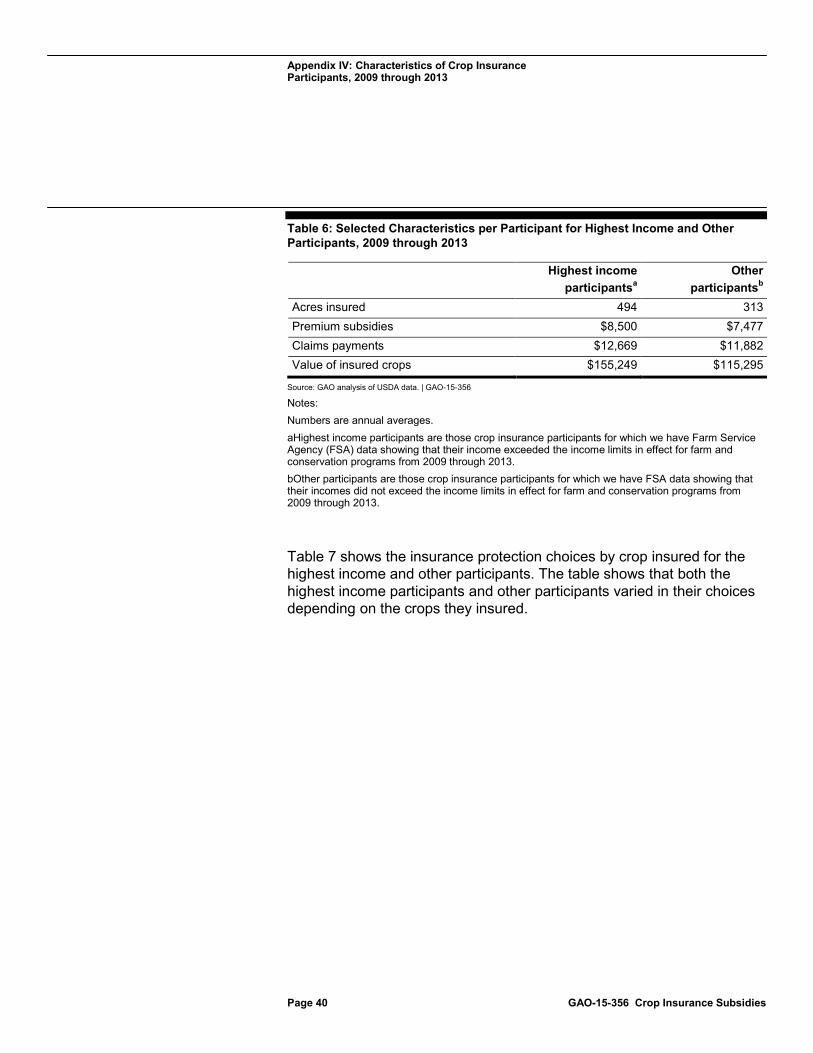
Appendix IV: Characteristics of Crop Insurance Participants, 2009 through 2013
Page 40 GAO-15-356 Crop Insurance Subsidies
Table 6: Selected Characteristics per Participant for Highest Income and Other Participants, 2009 through 2013
Highest income participantsa
Other participantsb
Acres insured 494 313 Premium subsidies $8,500 $7,477 Claims payments $12,669 $11,882 Value of insured crops $155,249 $115,295
Source: GAO analysis of USDA data. | GAO-15-356
Notes: Numbers are annual averages. aHighest income participants are those crop insurance participants for which we have Farm Service Agency (FSA) data showing that their income exceeded the income limits in effect for farm and conservation programs from 2009 through 2013. bOther participants are those crop insurance participants for which we have FSA data showing that their incomes did not exceed the income limits in effect for farm and conservation programs from 2009 through 2013.
Table 7 shows the insurance protection choices by crop insured for the highest income and other participants. The table shows that both the highest income participants and other participants varied in their choices depending on the crops they insured.
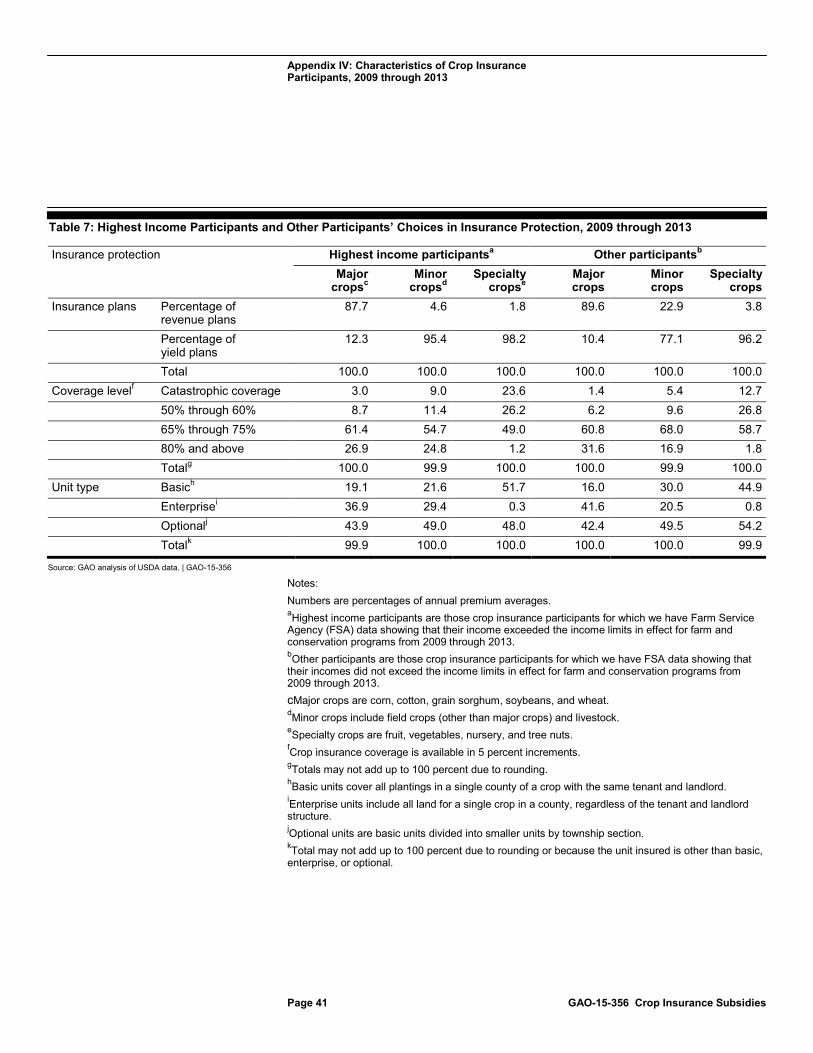
Appendix IV: Characteristics of Crop Insurance Participants, 2009 through 2013
Page 41 GAO-15-356 Crop Insurance Subsidies
Table 7: Highest Income Participants and Other Participants’ Choices in Insurance Protection, 2009 through 2013
Insurance protection Highest income participantsa Other participantsb Major
cropsc Minor
cropsd Specialty
cropse Major crops
Minor crops
Specialty crops
Insurance plans Percentage of revenue plans
87.7 4.6 1.8 89.6 22.9 3.8
Percentage of yield plans
12.3 95.4 98.2 10.4 77.1 96.2
Total 100.0 100.0 100.0 100.0 100.0 100.0 Coverage levelf Catastrophic coverage 3.0 9.0 23.6 1.4 5.4 12.7 50% through 60% 8.7 11.4 26.2 6.2 9.6 26.8 65% through 75% 61.4 54.7 49.0 60.8 68.0 58.7 80% and above 26.9 24.8 1.2 31.6 16.9 1.8 Totalg 100.0 99.9 100.0 100.0 99.9 100.0 Unit type Basich 19.1 21.6 51.7 16.0 30.0 44.9 Enterprisei 36.9 29.4 0.3 41.6 20.5 0.8 Optionalj 43.9 49.0 48.0 42.4 49.5 54.2 Totalk 99.9 100.0 100.0 100.0 100.0 99.9
Source: GAO analysis of USDA data. | GAO-15-356
Notes: Numbers are percentages of annual premium averages. aHighest income participants are those crop insurance participants for which we have Farm Service Agency (FSA) data showing that their income exceeded the income limits in effect for farm and conservation programs from 2009 through 2013. bOther participants are those crop insurance participants for which we have FSA data showing that their incomes did not exceed the income limits in effect for farm and conservation programs from 2009 through 2013. cMajor crops are corn, cotton, grain sorghum, soybeans, and wheat. dMinor crops include field crops (other than major crops) and livestock. eSpecialty crops are fruit, vegetables, nursery, and tree nuts. fCrop insurance coverage is available in 5 percent increments. gTotals may not add up to 100 percent due to rounding. hBasic units cover all plantings in a single county of a crop with the same tenant and landlord. iEnterprise units include all land for a single crop in a county, regardless of the tenant and landlord structure. jOptional units are basic units divided into smaller units by township section. kTotal may not add up to 100 percent due to rounding or because the unit insured is other than basic, enterprise, or optional.
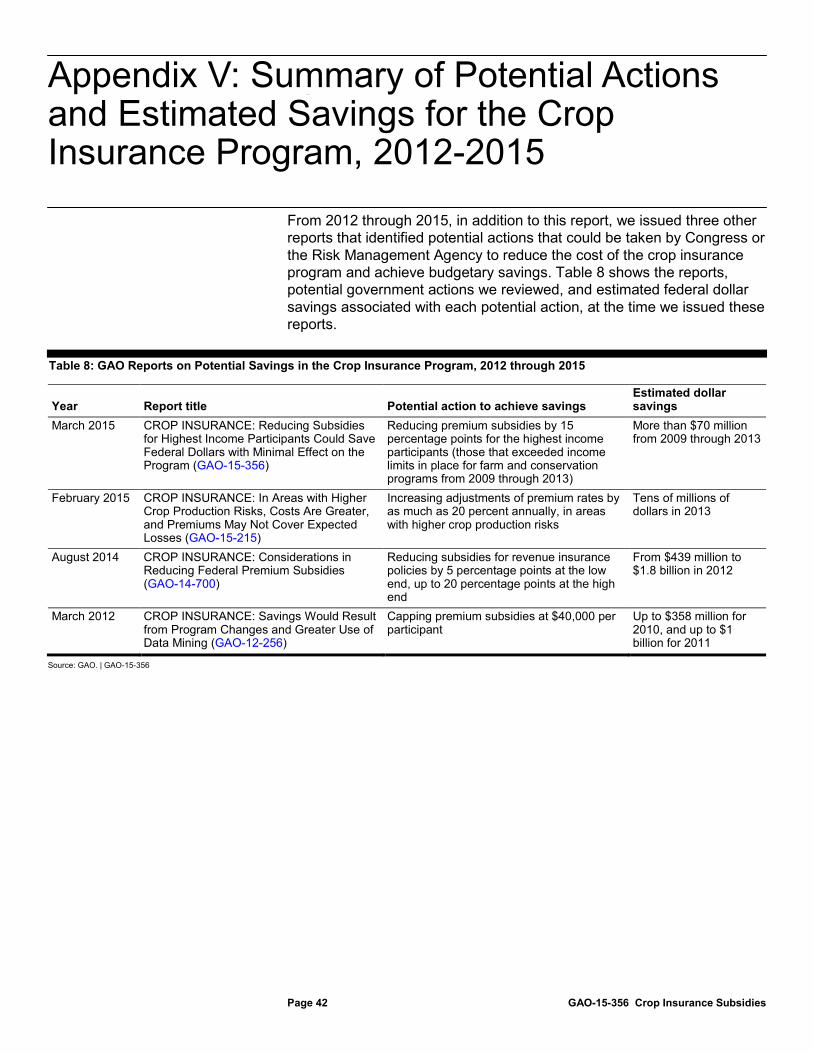
Appendix V: Summary of Potential Actions and Estimated Savings for the Crop Insurance Program, 2012-2015
Page 42 GAO-15-356 Crop Insurance Subsidies
From 2012 through 2015, in addition to this report, we issued three other reports that identified potential actions that could be taken by Congress or the Risk Management Agency to reduce the cost of the crop insurance program and achieve budgetary savings. Table 8 shows the reports, potential government actions we reviewed, and estimated federal dollar savings associated with each potential action, at the time we issued these reports.
Table 8: GAO Reports on Potential Savings in the Crop Insurance Program, 2012 through 2015
Year Report title Potential action to achieve savings Estimated dollar savings
March 2015 CROP INSURANCE: Reducing Subsidies for Highest Income Participants Could Save Federal Dollars with Minimal Effect on the Program (GAO-15-356)
Reducing premium subsidies by 15 percentage points for the highest income participants (those that exceeded income limits in place for farm and conservation programs from 2009 through 2013)
More than $70 million from 2009 through 2013
February 2015 CROP INSURANCE: In Areas with Higher Crop Production Risks, Costs Are Greater, and Premiums May Not Cover Expected Losses (GAO-15-215)
Increasing adjustments of premium rates by as much as 20 percent annually, in areas with higher crop production risks
Tens of millions of dollars in 2013
August 2014 CROP INSURANCE: Considerations in Reducing Federal Premium Subsidies (GAO-14-700)
Reducing subsidies for revenue insurance policies by 5 percentage points at the low end, up to 20 percentage points at the high end
From $439 million to $1.8 billion in 2012
March 2012 CROP INSURANCE: Savings Would Result from Program Changes and Greater Use of Data Mining (GAO-12-256)
Capping premium subsidies at $40,000 per participant
Up to $358 million for 2010, and up to $1 billion for 2011
Source: GAO. | GAO-15-356
Appendix V: Summary of Potential Actions and Estimated Savings for the Crop Insurance Program, 2012-2015
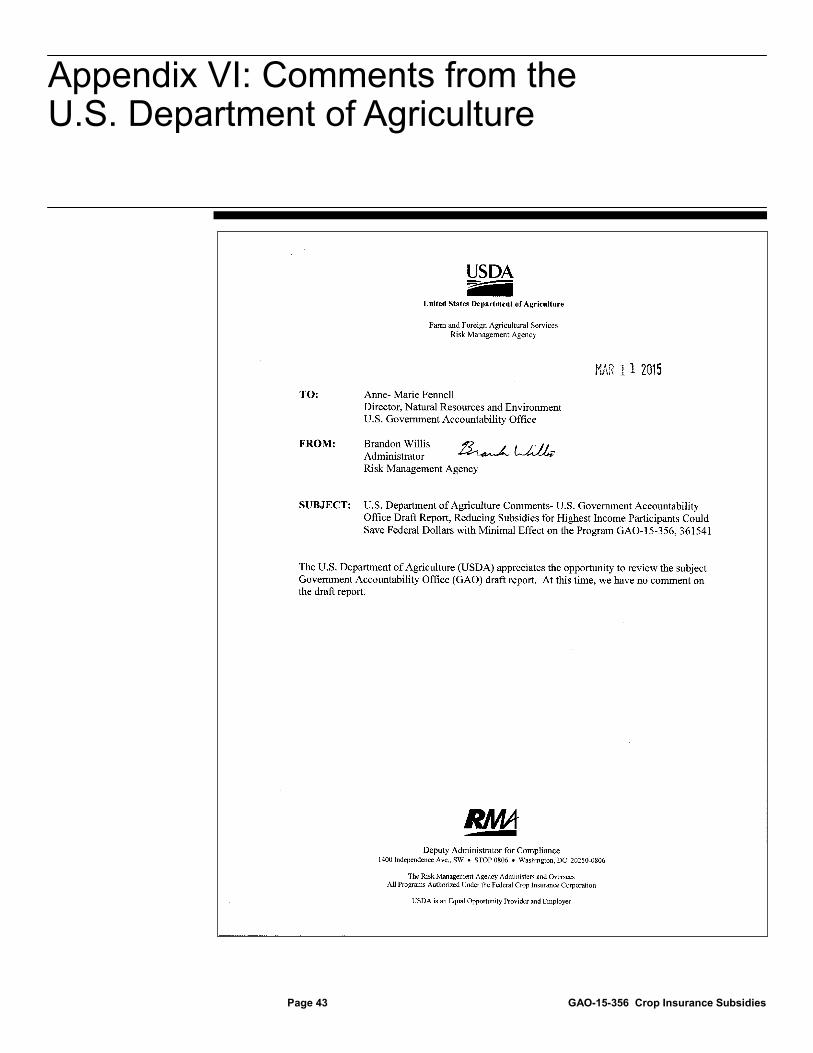
Appendix VI: Comments from the U.S. Department of Agriculture
Page 43 GAO-15-356 Crop Insurance Subsidies
Appendix VI: Comments from the U.S. Department of Agriculture
Appendix VII: GAO Contact and Staff Acknowledgments
Page 44 GAO-15-356 Crop Insurance Subsidies
Anne-Marie Fennell, (202) 512-3841 or [email protected]
In addition to the individual named above, Susan Offutt (Chief Economist), Frank Todisco (Chief Actuary), Thomas Cook (Assistant Director), Cheryl Arvidson, Kevin Bray, Christine Feehan, Michael Kendix, Anne Rhodes-Kline, and Ruth Solomon made key contributions to this report.
Appendix VII: GAO Contact and Staff Acknowledgments
GAO Contact
Staff Acknowledgments
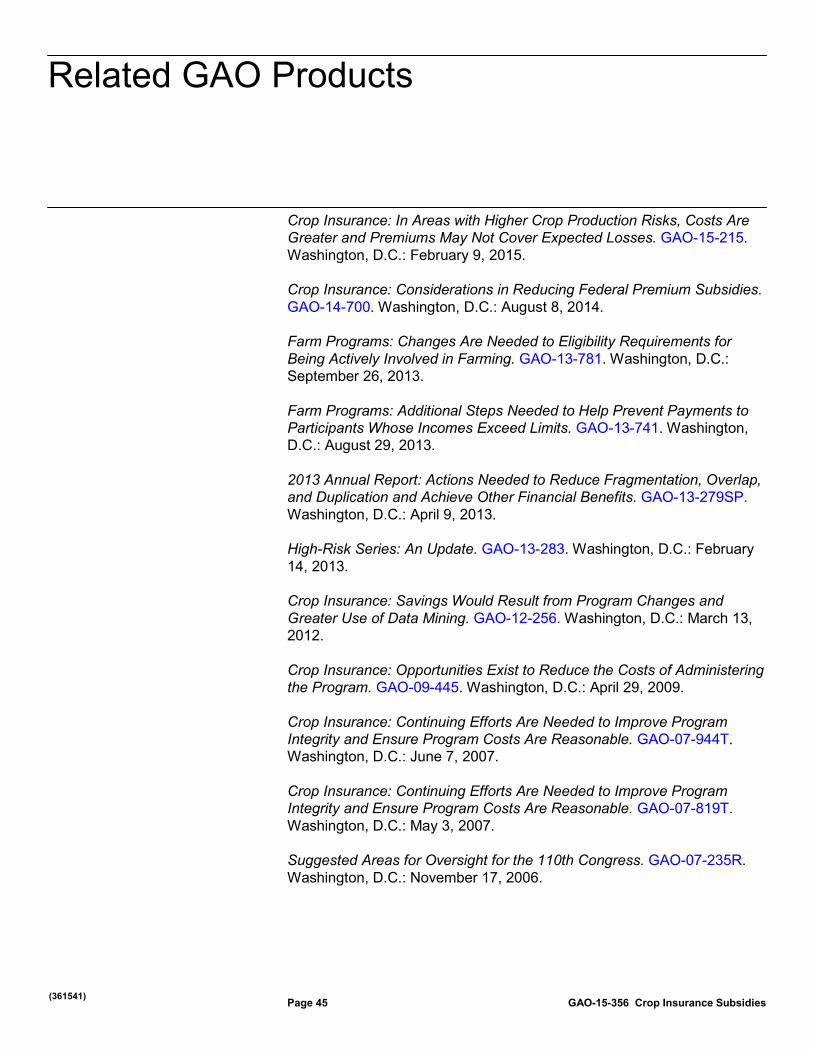
Related GAO Products
Page 45 GAO-15-356 Crop Insurance Subsidies
Crop Insurance: In Areas with Higher Crop Production Risks, Costs Are Greater and Premiums May Not Cover Expected Losses. GAO-15-215. Washington, D.C.: February 9, 2015.
Crop Insurance: Considerations in Reducing Federal Premium Subsidies. GAO-14-700. Washington, D.C.: August 8, 2014.
Farm Programs: Changes Are Needed to Eligibility Requirements for Being Actively Involved in Farming. GAO-13-781. Washington, D.C.: September 26, 2013.
Farm Programs: Additional Steps Needed to Help Prevent Payments to Participants Whose Incomes Exceed Limits. GAO-13-741. Washington, D.C.: August 29, 2013.
2013 Annual Report: Actions Needed to Reduce Fragmentation, Overlap, and Duplication and Achieve Other Financial Benefits. GAO-13-279SP. Washington, D.C.: April 9, 2013.
High-Risk Series: An Update. GAO-13-283. Washington, D.C.: February 14, 2013.
Crop Insurance: Savings Would Result from Program Changes and Greater Use of Data Mining. GAO-12-256. Washington, D.C.: March 13, 2012.
Crop Insurance: Opportunities Exist to Reduce the Costs of Administering the Program. GAO-09-445. Washington, D.C.: April 29, 2009.
Crop Insurance: Continuing Efforts Are Needed to Improve Program Integrity and Ensure Program Costs Are Reasonable. GAO-07-944T. Washington, D.C.: June 7, 2007.
Crop Insurance: Continuing Efforts Are Needed to Improve Program Integrity and Ensure Program Costs Are Reasonable. GAO-07-819T. Washington, D.C.: May 3, 2007.
Suggested Areas for Oversight for the 110th Congress. GAO-07-235R. Washington, D.C.: November 17, 2006.
Related GAO Products
(361541)
The Government Accountability Office, the audit, evaluation, and investigative arm of Congress, exists to support Congress in meeting its constitutional responsibilities and to help improve the performance and accountability of the federal government for the American people. GAO examines the use of public funds; evaluates federal programs and policies; and provides analyses, recommendations, and other assistance to help Congress make informed oversight, policy, and funding decisions. GAO’s commitment to good government is reflected in its core values of accountability, integrity, and reliability.
The fastest and easiest way to obtain copies of GAO documents at no cost is through GAO’s website (http://www.gao.gov). Each weekday afternoon, GAO posts on its website newly released reports, testimony, and correspondence. To have GAO e-mail you a list of newly posted products, go to http://www.gao.gov and select “E-mail Updates.”
The price of each GAO publication reflects GAO’s actual cost of production and distribution and depends on the number of pages in the publication and whether the publication is printed in color or black and white. Pricing and ordering information is posted on GAO’s website, http://www.gao.gov/ordering.htm.
Place orders by calling (202) 512-6000, toll free (866) 801-7077, or TDD (202) 512-2537.
Orders may be paid for using American Express, Discover Card, MasterCard, Visa, check, or money order. Call for additional information.
Connect with GAO on Facebook, Flickr, Twitter, and YouTube. Subscribe to our RSS Feeds or E-mail Updates. Listen to our Podcasts. Visit GAO on the web at www.gao.gov.
Contact:
Website: http://www.gao.gov/fraudnet/fraudnet.htm E-mail: [email protected] Automated answering system: (800) 424-5454 or (202) 512-7470
Katherine Siggerud, Managing Director, [email protected], (202) 512-4400, U.S. Government Accountability Office, 441 G Street NW, Room 7125, Washington, DC 20548
Chuck Young, Managing Director, [email protected], (202) 512-4800 U.S. Government Accountability Office, 441 G Street NW, Room 7149 Washington, DC 20548
GAO’s Mission
Obtaining Copies of GAO Reports and Testimony
Order by Phone
Connect with GAO
To Report Fraud, Waste, and Abuse in Federal Programs
Congressional Relations
Public Affairs
Please Print on Recycled Paper.