Embed Size (px)
Citation preview
First Edition : March 2018
Completed By :
Academics Department
The Institute of Cost Accountants of India.
Published By :
Directorate of Studies
The Institute of Cost Accountants of India
12, Sudder Street, Kolkata – 700 016
Copyright of these study notes is reserved by the Institute of Cost Accountants
of India and prior permission from the Institute is necessary for reproduction of
the whole or any part thereof.
Work Book
Directorate of Studies, The Institute of Cost Accountants of India (Statutory Body under an Act of Parliament)
COST & MANAGEMENT ACCOUNTING
AND
FINANCIAL MANAGEMENT
INTERMEDIATE
GROUP – II
PAPER – 10
INDEX
Sl. No. Section A – Cost & Management Accounting Page No.
1 Cost & Management Accounting 1 – 4
2 Decision Making Tools 5 – 26
3 Budgeting & Budgetary Control 27 – 33
4 Standard Costing and Variance Analysis 34 – 43
5 Learning Curve 44 – 45
Section B – Financial Management
6 Introduction to Financial Management 46 – 49
7 Tools for Financial Analysis & Planning 50 – 57
8 Working Capital Management 58 – 68
9 Cost of Capital, Capital Structure Theories, Dividend Decisions &
Leverage Analysis
69 – 83
10 Capital Budgeting 84 - 95


Work Book : Cost & Management Accounting and Financial Management
Directorate of Studies, The Institute of Cost Accountants of India (Statutory Body under an Act of Parliament) Page 1
Study Note – 1
COST AND MANAGEMENT ACCOUNTING
Section - I
1. Answer the following questions:
(a) Choose the correct answer from the given four alternatives. [1x 6 = 6]
(1) Management Accounting is an integral part of management concerned with_______ information.
(a) identifying, presenting and interpreting
(b) identifying and presenting
(c) identifying
(d) None of the above
(2) Management Accounting is related with _____________.
(a) formulating strategy
(b) planning and controlling activities
(c) optimizing the use of resources
(d) All of the above
(3) Despite the development of Management Accounting as an effective discipline to improve the
managerial performance, it has some limitations. Which of the following is a limitation of
management accounting?
(a) Psychological Resistance
(b) Physiological Resistance
(c) Both of the above
(d) None of the above
(4) The primary objective of Management Accounting is to _______________.
(a) maximize profits
(b) minimize losses
(c) maximize profits or minimize losses
(d) All of the above
(5) Management accounting is concerned with data collection from _____________.
(a) internal sources
(b) external sources
(c) internal and external sources
(d) internal or external sources
Work Book : Cost & Management Accounting and Financial Management
Directorate of Studies, The Institute of Cost Accountants of India (Statutory Body under an Act of Parliament) Page 2
(6) ‗Management Accounting is concerned with accounting information, which is useful to the
management.‘ — This definition is given by ______________.
(a) Robert N. Anthony
(b) Brown and Howard
(c) CIMA
(d) The Institute of Chartered Accountants of England and Wales
Ans: 1-a; 2-d; 3-a; 4-d; 5-c; 6-a
(b) Match the statement in column I with the most appropriate statement in column II:
Column I Column II
1. Management Accounting a. suitable information to internal and external users
2. Fiduciary Accounting b. suitable information to operation management
3. Financial Accounting c. suitable information to internal users
4. Cost Accounting d. suitable information to third party
Ans: 1-c; 2-d; 3-a; 4-b
(c) State whether the following statements are true or false:
(1) Management Accounting is a traditional approach to accounting
(2) The information in the management accounting system is used for three different purposes.
(3) Management accounting helps in decision making only, not in strategic decision making.
(4) The scope of Management Accounting is broader than the scope of Cost Accounting.
(5) As the reports generated by management accounting are not used by any external party, the
business enterprises don‘t need to take care of GAAP.
(6) Management accounting records are kept for public.
1-F;2-T;3-F;4-T;5-T;6-F
Section - II
2. Short notes on
(a) Objectives of Management Accounting
Management accounting comprises the preparation of financial reports for management groups such
as shareholders, creditors, regulatory agencies and tax authorities. The fundamental objective of
management accounting is to enable management to maximize profits or minimize losses. Following are
the important objectives or purposes of management accounting:
Work Book : Cost & Management Accounting and Financial Management
Directorate of Studies, The Institute of Cost Accountants of India (Statutory Body under an Act of Parliament) Page 3
1. Policy formulation- Policy formulation and planning are the primary functions of management. The
object of management accounting is to supply necessary data to the management for formulating
plans. The figure supplied and opinion given by the management accountant helps management
in policy formulation.
2. Helpful in decision making- The management is required to take various important decisions.
Management accounting techniques help in collecting and analyzing data relating to cost, volume
and profit which provide a base for taking sound decision.
3. Helpful in controlling- Management accounting is a useful device of managerial control. Various
accounting techniques such as standard costing and budgetary control are helpful in controlling
performance. The actual results are compared with pre-determined targets to know the deviations.
4. Motivation- Another important objective of management accounting is to help the management in
selecting best alternatives of doing the things. Delegation of authority as well as responsibility
increases the job satisfaction of employees and encourages them to look forward.
5. Interpretation of financial information- Financial information is of technical nature and must be
presented in such a way that it can be easily understood. It is the duty of management accountant
who uses statistical devices like charts, diagrams etc. so that the information can be easily
understandable.
(b) Strategic management accounting
The term ‗strategic management accounting‘ applies to the identification, measurement and
communication of cost data in all these situations where the organisation is being judged against the
performance of competitors.
The traditional approach to management accounting has been to regard internal decision makers as
inward looking. This has led to developing techniques for identifying, measuring and communicating
costs where only internal comparisons have been thought relevant. Those techniques remain useful in
some cases and are sufficiently widely used to justify studying them in an introductory course.
However, the later years of the twentieth century brought an increasing awareness that company
managers must be outward looking. They must form a strategy for their business that has regard to what
competitors are achieving. This requires management accounting to identify measure and
communicate data on the company relative to data for other similar companies. Managers must
consider competitive forces such as the threat of new entrants, substitute products or services, rivalry
within the industry and the relative bargaining strength of suppliers and customers. Managers must also
consider how their organisation adds value in creating its product. There is a flow of business activity
from research and development through production, marketing, distribution and after-sales support. This
chain of activities creates costs which must be compared with the value added by the organisation.
Strategic management accounting uses different approaches/techniques to achieve strategy execu-
tion, to develop integrated approaches to performance measurement. Some of the strategic tools for
performance measurement are Target Costing, Kaizen Costing, Life Cycle Costing, Theory of constraints
(TOC), Bench Marking etc.
Work Book : Cost & Management Accounting and Financial Management
Directorate of Studies, The Institute of Cost Accountants of India (Statutory Body under an Act of Parliament) Page 4
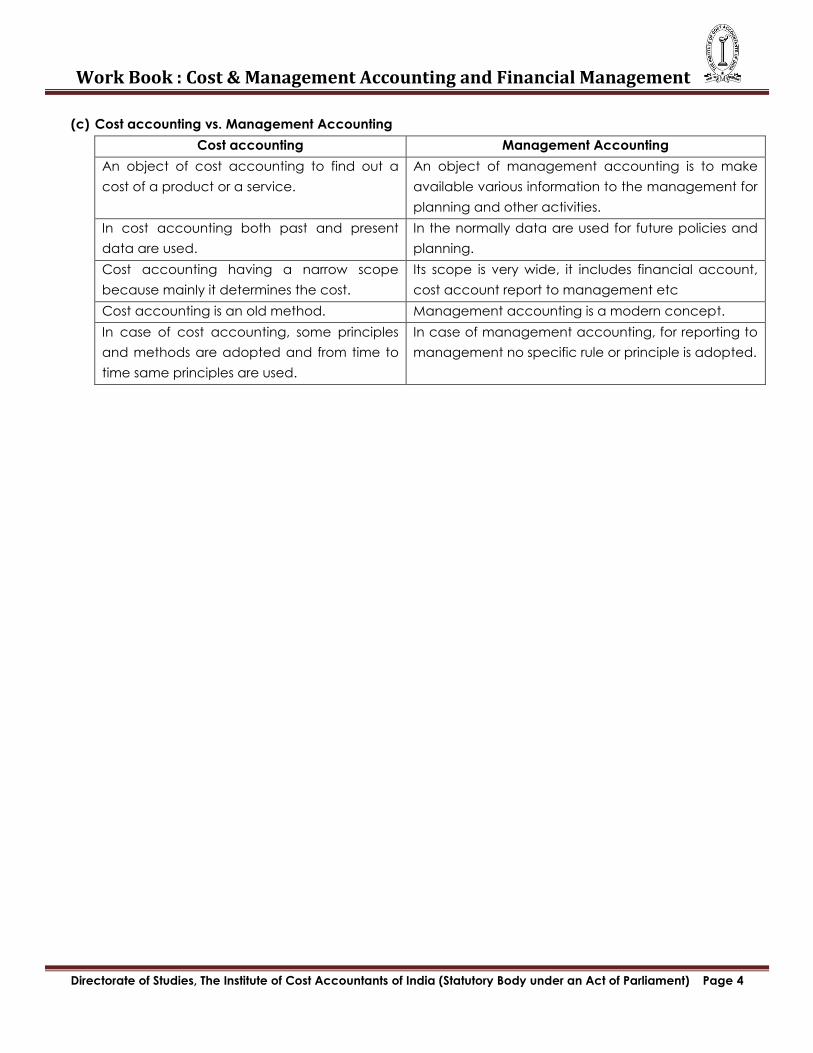
(c) Cost accounting vs. Management Accounting
Cost accounting Management Accounting
An object of cost accounting to find out a
cost of a product or a service.
An object of management accounting is to make
available various information to the management for
planning and other activities.
In cost accounting both past and present
data are used.
In the normally data are used for future policies and
planning.
Cost accounting having a narrow scope
because mainly it determines the cost.
Its scope is very wide, it includes financial account,
cost account report to management etc
Cost accounting is an old method. Management accounting is a modern concept.
In case of cost accounting, some principles
and methods are adopted and from time to
time same principles are used.
In case of management accounting, for reporting to
management no specific rule or principle is adopted.
Work Book : Cost & Management Accounting and Financial Management
Directorate of Studies, The Institute of Cost Accountants of India (Statutory Body under an Act of Parliament) Page 5
Study Note – 2
DECISION MAKING TOOLS
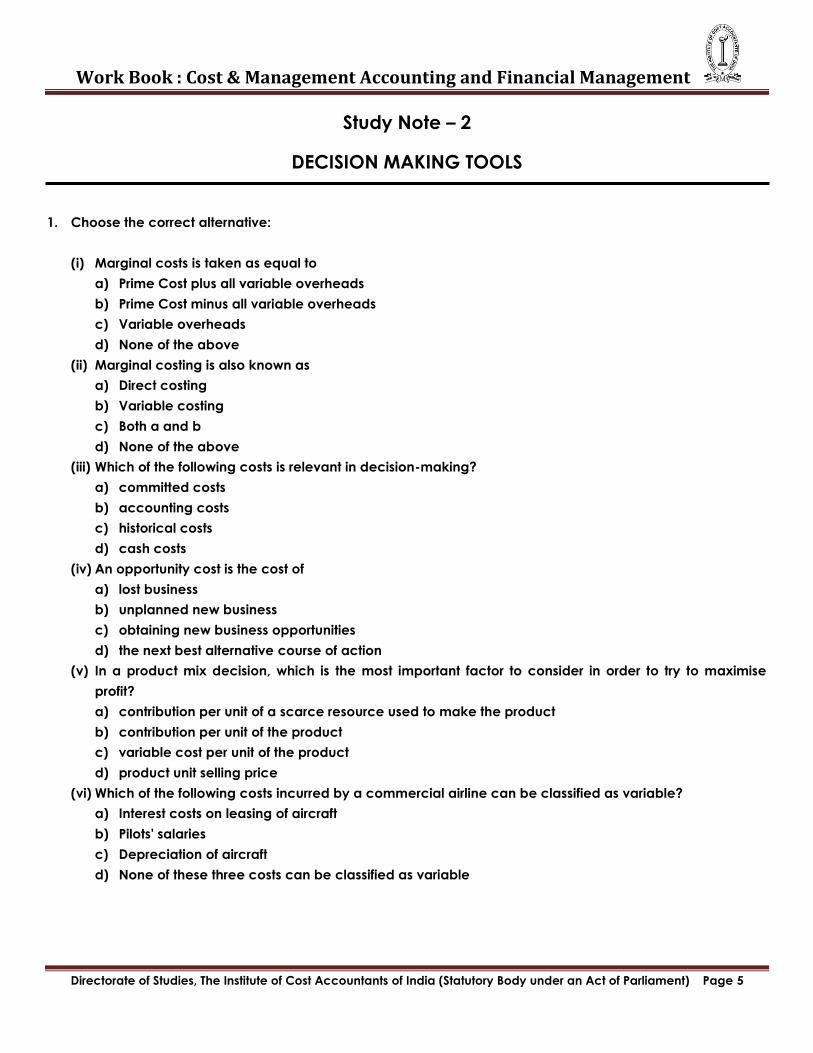
1. Choose the correct alternative:
(i) Marginal costs is taken as equal to
a) Prime Cost plus all variable overheads
b) Prime Cost minus all variable overheads
c) Variable overheads
d) None of the above
(ii) Marginal costing is also known as
a) Direct costing
b) Variable costing
c) Both a and b
d) None of the above
(iii) Which of the following costs is relevant in decision-making?
a) committed costs
b) accounting costs
c) historical costs
d) cash costs
(iv) An opportunity cost is the cost of
a) lost business
b) unplanned new business
c) obtaining new business opportunities
d) the next best alternative course of action
(v) In a product mix decision, which is the most important factor to consider in order to try to maximise
profit?
a) contribution per unit of a scarce resource used to make the product
b) contribution per unit of the product
c) variable cost per unit of the product
d) product unit selling price
(vi) Which of the following costs incurred by a commercial airline can be classified as variable?
a) Interest costs on leasing of aircraft
b) Pilots' salaries
c) Depreciation of aircraft
d) None of these three costs can be classified as variable
Work Book : Cost & Management Accounting and Financial Management
Directorate of Studies, The Institute of Cost Accountants of India (Statutory Body under an Act of Parliament) Page 6
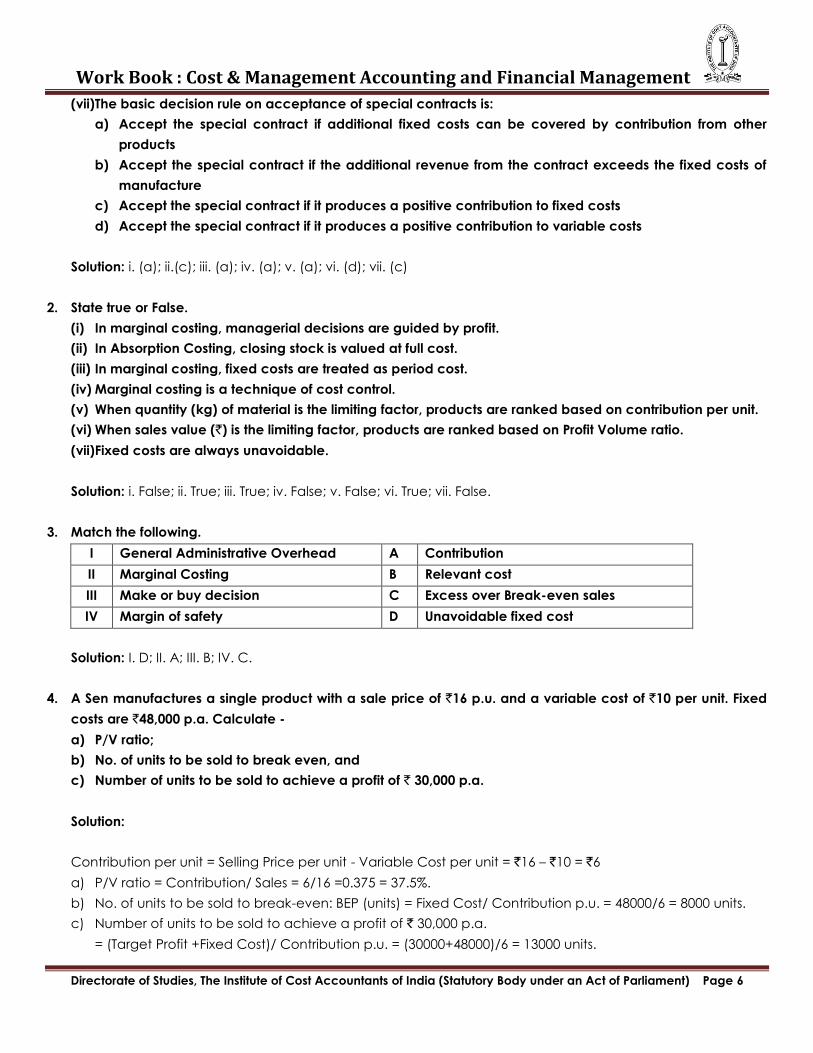
(vii)The basic decision rule on acceptance of special contracts is:
a) Accept the special contract if additional fixed costs can be covered by contribution from other
products
b) Accept the special contract if the additional revenue from the contract exceeds the fixed costs of
manufacture
c) Accept the special contract if it produces a positive contribution to fixed costs
d) Accept the special contract if it produces a positive contribution to variable costs
Solution: i. (a); ii.(c); iii. (a); iv. (a); v. (a); vi. (d); vii. (c)
2. State true or False.
(i) In marginal costing, managerial decisions are guided by profit.
(ii) In Absorption Costing, closing stock is valued at full cost.
(iii) In marginal costing, fixed costs are treated as period cost.
(iv) Marginal costing is a technique of cost control.
(v) When quantity (kg) of material is the limiting factor, products are ranked based on contribution per unit.
(vi) When sales value (`) is the limiting factor, products are ranked based on Profit Volume ratio.
(vii)Fixed costs are always unavoidable.
Solution: i. False; ii. True; iii. True; iv. False; v. False; vi. True; vii. False.
3. Match the following.
I General Administrative Overhead A Contribution
II Marginal Costing B Relevant cost
III Make or buy decision C Excess over Break-even sales
IV Margin of safety D Unavoidable fixed cost
Solution: I. D; II. A; III. B; IV. C.
4. A Sen manufactures a single product with a sale price of `16 p.u. and a variable cost of `10 per unit. Fixed
costs are `48,000 p.a. Calculate -
a) P/V ratio;
b) No. of units to be sold to break even, and
c) Number of units to be sold to achieve a profit of ` 30,000 p.a.
Solution:
Contribution per unit = Selling Price per unit - Variable Cost per unit = `16 – `10 = `6
a) P/V ratio = Contribution/ Sales = 6/16 =0.375 = 37.5%.
b) No. of units to be sold to break-even: BEP (units) = Fixed Cost/ Contribution p.u. = 48000/6 = 8000 units.
c) Number of units to be sold to achieve a profit of ` 30,000 p.a.
= (Target Profit +Fixed Cost)/ Contribution p.u. = (30000+48000)/6 = 13000 units.
Work Book : Cost & Management Accounting and Financial Management
Directorate of Studies, The Institute of Cost Accountants of India (Statutory Body under an Act of Parliament) Page 7
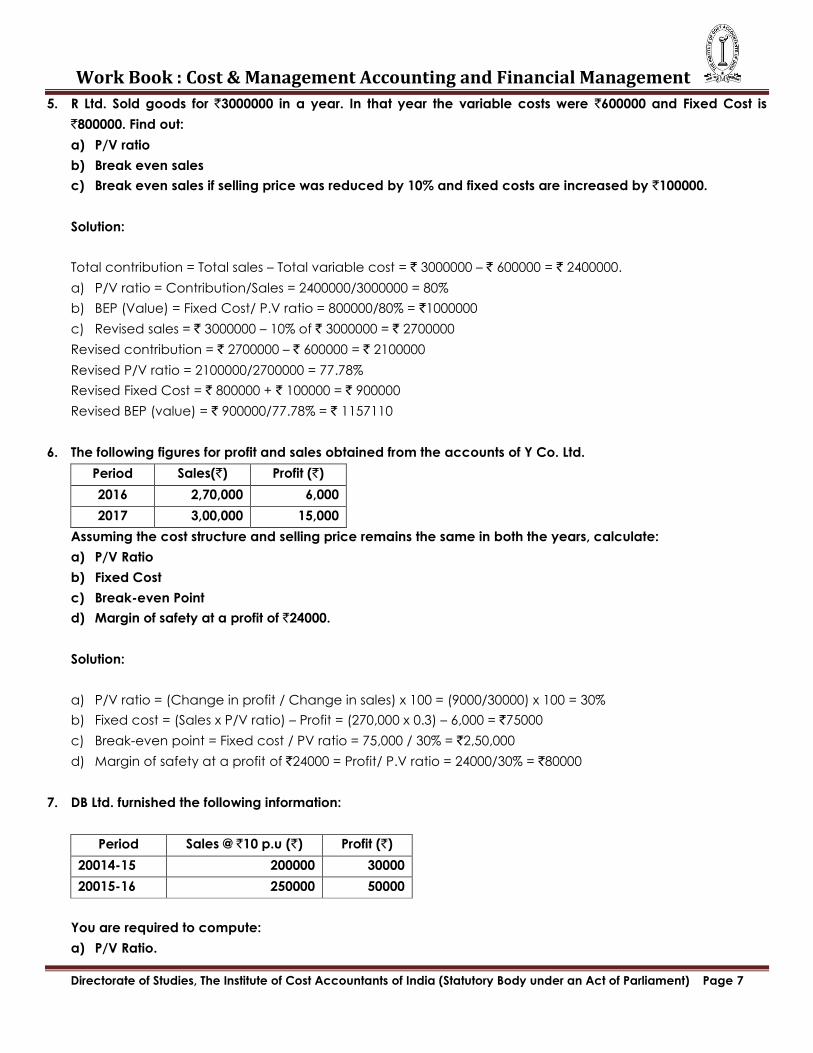
5. R Ltd. Sold goods for `3000000 in a year. In that year the variable costs were `600000 and Fixed Cost is
`800000. Find out:
a) P/V ratio
b) Break even sales
c) Break even sales if selling price was reduced by 10% and fixed costs are increased by `100000.
Solution:
Total contribution = Total sales – Total variable cost = ` 3000000 – ` 600000 = ` 2400000.
a) P/V ratio = Contribution/Sales = 2400000/3000000 = 80%
b) BEP (Value) = Fixed Cost/ P.V ratio = 800000/80% = `1000000
c) Revised sales = ` 3000000 – 10% of ` 3000000 = ` 2700000
Revised contribution = ` 2700000 – ` 600000 = ` 2100000
Revised P/V ratio = 2100000/2700000 = 77.78%
Revised Fixed Cost = ` 800000 + ` 100000 = ` 900000
Revised BEP (value) = ` 900000/77.78% = ` 1157110
6. The following figures for profit and sales obtained from the accounts of Y Co. Ltd.
Period Sales(`) Profit (`)
2016 2,70,000 6,000
2017 3,00,000 15,000
Assuming the cost structure and selling price remains the same in both the years, calculate:
a) P/V Ratio
b) Fixed Cost
c) Break-even Point
d) Margin of safety at a profit of `24000.
Solution:
a) P/V ratio = (Change in profit / Change in sales) x 100 = (9000/30000) x 100 = 30%
b) Fixed cost = (Sales x P/V ratio) – Profit = (270,000 x 0.3) – 6,000 = `75000
c) Break-even point = Fixed cost / PV ratio = 75,000 / 30% = `2,50,000
d) Margin of safety at a profit of `24000 = Profit/ P.V ratio = 24000/30% = `80000
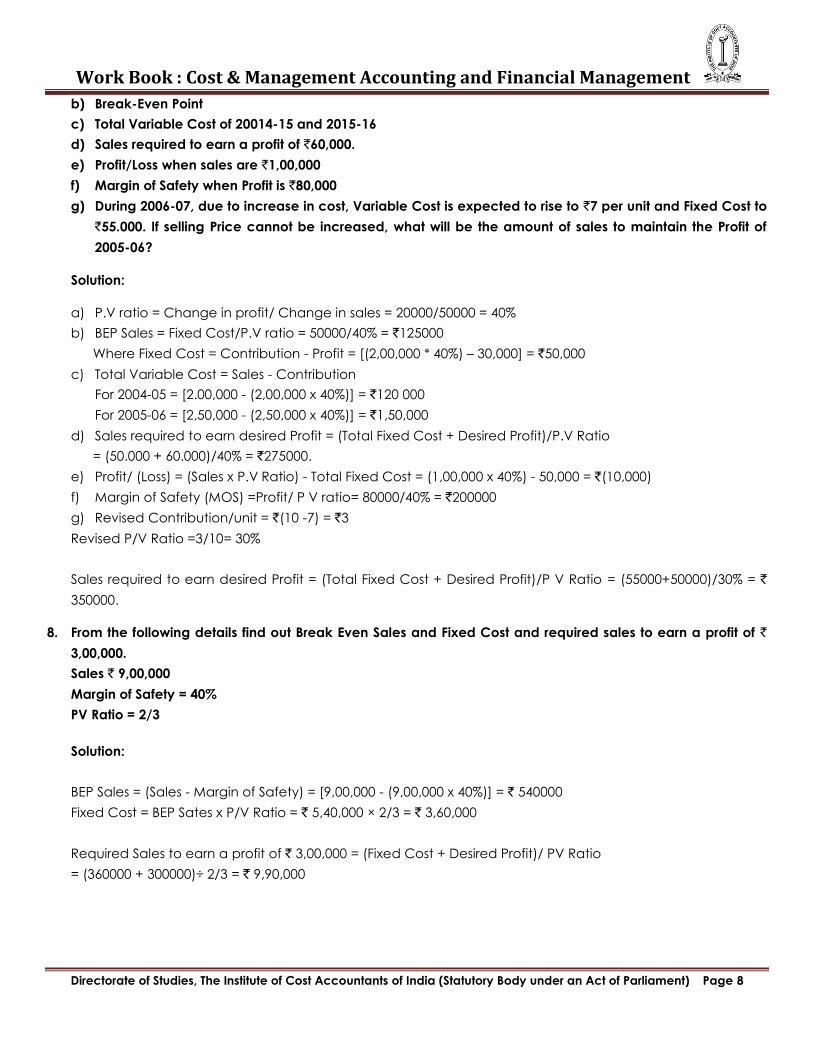
7. DB Ltd. furnished the following information:
Period Sales @ `10 p.u (`) Profit (`)
20014-15 200000 30000
20015-16 250000 50000
You are required to compute:
a) P/V Ratio.
Work Book : Cost & Management Accounting and Financial Management
Directorate of Studies, The Institute of Cost Accountants of India (Statutory Body under an Act of Parliament) Page 8
b) Break-Even Point
c) Total Variable Cost of 20014-15 and 2015-16
d) Sales required to earn a profit of `60,000.
e) Profit/Loss when sales are `1,00,000
f) Margin of Safety when Profit is `80,000
g) During 2006-07, due to increase in cost, Variable Cost is expected to rise to `7 per unit and Fixed Cost to
`55.000. If selling Price cannot be increased, what will be the amount of sales to maintain the Profit of
2005-06?
Solution:
a) P.V ratio = Change in profit/ Change in sales = 20000/50000 = 40%
b) BEP Sales = Fixed Cost/P.V ratio = 50000/40% = `125000
Where Fixed Cost = Contribution - Profit = [(2,00,000 * 40%) – 30,000] = `50,000
c) Total Variable Cost = Sales - Contribution
For 2004-05 = [2.00,000 - (2,00,000 x 40%)] = `120 000
For 2005-06 = [2,50,000 - (2,50,000 x 40%)] = `1,50,000
d) Sales required to earn desired Profit = (Total Fixed Cost + Desired Profit)/P.V Ratio
= (50.000 + 60.000)/40% = `275000.
e) Profit/ (Loss) = (Sales x P.V Ratio) - Total Fixed Cost = (1,00,000 x 40%) - 50,000 = `(10,000)
f) Margin of Safety (MOS) =Profit/ P V ratio= 80000/40% = `200000
g) Revised Contribution/unit = `(10 -7) = `3
Revised P/V Ratio =3/10= 30%
Sales required to earn desired Profit = (Total Fixed Cost + Desired Profit)/P V Ratio = (55000+50000)/30% = `
350000.
8. From the following details find out Break Even Sales and Fixed Cost and required sales to earn a profit of `
3,00,000.
Sales ` 9,00,000
Margin of Safety = 40%
PV Ratio = 2/3
Solution:
BEP Sales = (Sales - Margin of Safety) = [9,00,000 - (9,00,000 x 40%)] = ` 540000
Fixed Cost = BEP Sates x P/V Ratio = ` 5,40,000 × 2/3 = ` 3,60,000
Required Sales to earn a profit of ` 3,00,000 = (Fixed Cost + Desired Profit)/ PV Ratio
= (360000 + 300000)÷ 2/3 = ` 9,90,000
Work Book : Cost & Management Accounting and Financial Management
Directorate of Studies, The Institute of Cost Accountants of India (Statutory Body under an Act of Parliament) Page 9
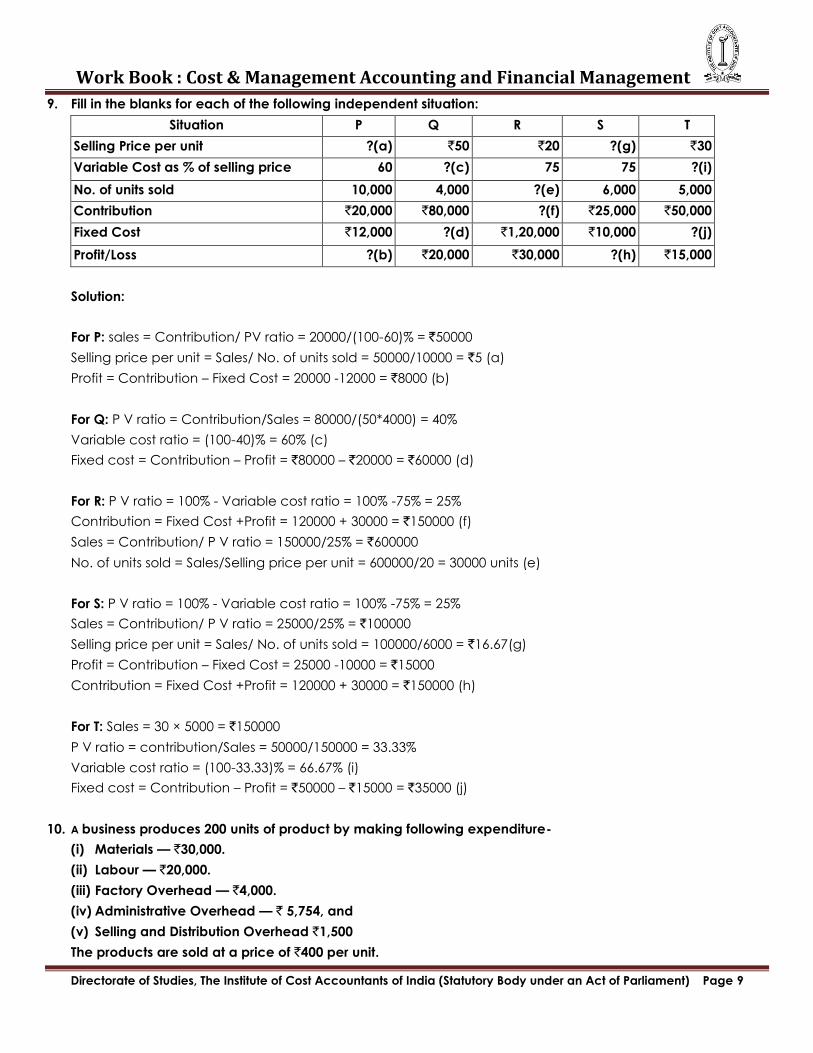
9. Fill in the blanks for each of the following independent situation:
Situation P Q R S T
Selling Price per unit ?(a) `50 `20 ?(g) `30
Variable Cost as % of selling price 60 ?(c) 75 75 ?(i)
No. of units sold 10,000 4,000 ?(e) 6,000 5,000
Contribution `20,000 `80,000 ?(f) `25,000 `50,000
Fixed Cost `12,000 ?(d) `1,20,000 `10,000 ?(j)
Profit/Loss ?(b) `20,000 `30,000 ?(h) `15,000
Solution:
For P: sales = Contribution/ PV ratio = 20000/(100-60)% = `50000
Selling price per unit = Sales/ No. of units sold = 50000/10000 = `5 (a)
Profit = Contribution – Fixed Cost = 20000 -12000 = `8000 (b)
For Q: P V ratio = Contribution/Sales = 80000/(50*4000) = 40%
Variable cost ratio = (100-40)% = 60% (c)
Fixed cost = Contribution – Profit = `80000 – `20000 = `60000 (d)
For R: P V ratio = 100% - Variable cost ratio = 100% -75% = 25%
Contribution = Fixed Cost +Profit = 120000 + 30000 = `150000 (f)
Sales = Contribution/ P V ratio = 150000/25% = `600000
No. of units sold = Sales/Selling price per unit = 600000/20 = 30000 units (e)
For S: P V ratio = 100% - Variable cost ratio = 100% -75% = 25%
Sales = Contribution/ P V ratio = 25000/25% = `100000
Selling price per unit = Sales/ No. of units sold = 100000/6000 = `16.67(g)
Profit = Contribution – Fixed Cost = 25000 -10000 = `15000
Contribution = Fixed Cost +Profit = 120000 + 30000 = `150000 (h)
For T: Sales = 30 × 5000 = `150000
P V ratio = contribution/Sales = 50000/150000 = 33.33%
Variable cost ratio = (100-33.33)% = 66.67% (i)
Fixed cost = Contribution – Profit = `50000 – `15000 = `35000 (j)
10. A business produces 200 units of product by making following expenditure-
(i) Materials — `30,000.
(ii) Labour — `20,000.
(iii) Factory Overhead — `4,000.
(iv) Administrative Overhead — ` 5,754, and
(v) Selling and Distribution Overhead `1,500
The products are sold at a price of `400 per unit.
Work Book : Cost & Management Accounting and Financial Management
Directorate of Studies, The Institute of Cost Accountants of India (Statutory Body under an Act of Parliament) Page 10
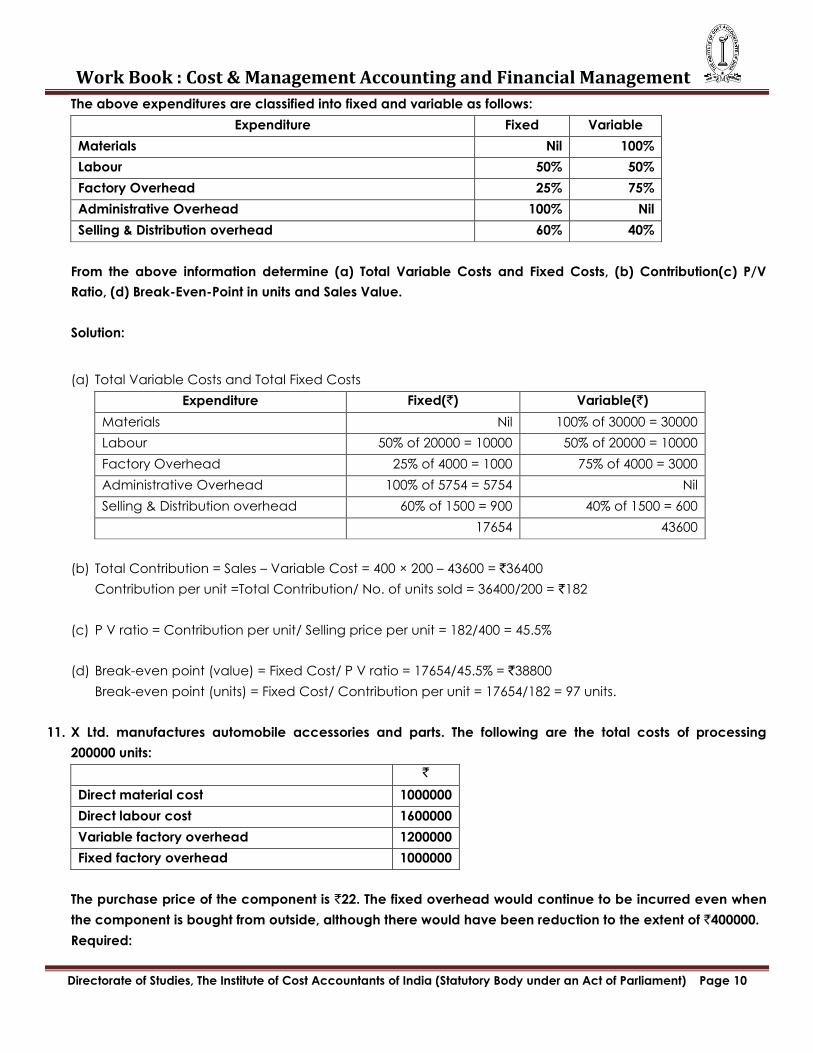
The above expenditures are classified into fixed and variable as follows:
Expenditure Fixed Variable
Materials Nil 100%
Labour 50% 50%
Factory Overhead 25% 75%
Administrative Overhead 100% Nil
Selling & Distribution overhead 60% 40%
From the above information determine (a) Total Variable Costs and Fixed Costs, (b) Contribution(c) P/V
Ratio, (d) Break-Even-Point in units and Sales Value.
Solution:
(a) Total Variable Costs and Total Fixed Costs
Expenditure Fixed(`) Variable(`)
Materials Nil 100% of 30000 = 30000
Labour 50% of 20000 = 10000 50% of 20000 = 10000
Factory Overhead 25% of 4000 = 1000 75% of 4000 = 3000
Administrative Overhead 100% of 5754 = 5754 Nil
Selling & Distribution overhead 60% of 1500 = 900 40% of 1500 = 600
17654 43600
(b) Total Contribution = Sales – Variable Cost = 400 × 200 – 43600 = `36400
Contribution per unit =Total Contribution/ No. of units sold = 36400/200 = `182
(c) P V ratio = Contribution per unit/ Selling price per unit = 182/400 = 45.5%
(d) Break-even point (value) = Fixed Cost/ P V ratio = 17654/45.5% = `38800
Break-even point (units) = Fixed Cost/ Contribution per unit = 17654/182 = 97 units.
11. X Ltd. manufactures automobile accessories and parts. The following are the total costs of processing
200000 units:
`
Direct material cost 1000000
Direct labour cost 1600000
Variable factory overhead 1200000
Fixed factory overhead 1000000
The purchase price of the component is `22. The fixed overhead would continue to be incurred even when
the component is bought from outside, although there would have been reduction to the extent of `400000.
Required:
Work Book : Cost & Management Accounting and Financial Management
Directorate of Studies, The Institute of Cost Accountants of India (Statutory Body under an Act of Parliament) Page 11
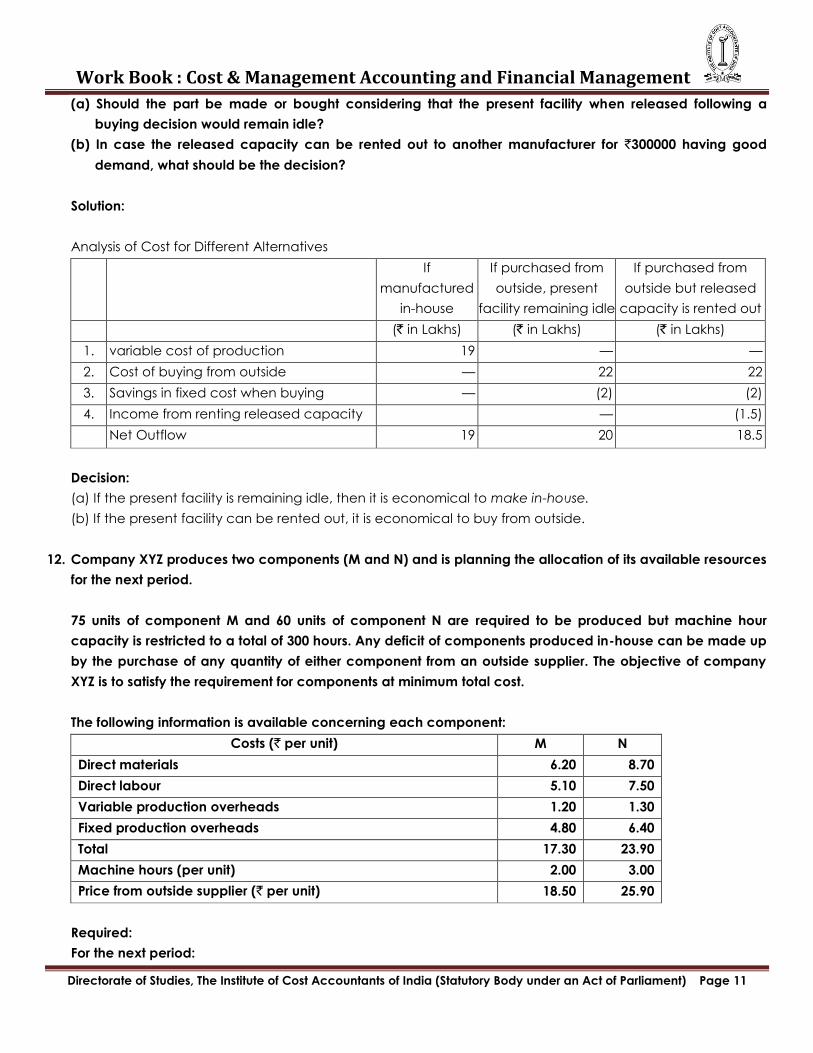
(a) Should the part be made or bought considering that the present facility when released following a
buying decision would remain idle?
(b) In case the released capacity can be rented out to another manufacturer for `300000 having good
demand, what should be the decision?
Solution:
Analysis of Cost for Different Alternatives
If
manufactured
in-house
If purchased from
outside, present
facility remaining idle
If purchased from
outside but released
capacity is rented out
(` in Lakhs) (` in Lakhs) (` in Lakhs)
1. variable cost of production 19 — —
2. Cost of buying from outside — 22 22
3. Savings in fixed cost when buying — (2) (2)
4. Income from renting released capacity — (1.5)
Net Outflow 19 20 18.5
Decision:
(a) If the present facility is remaining idle, then it is economical to make in-house.
(b) If the present facility can be rented out, it is economical to buy from outside.
12. Company XYZ produces two components (M and N) and is planning the allocation of its available resources
for the next period.
75 units of component M and 60 units of component N are required to be produced but machine hour
capacity is restricted to a total of 300 hours. Any deficit of components produced in-house can be made up
by the purchase of any quantity of either component from an outside supplier. The objective of company
XYZ is to satisfy the requirement for components at minimum total cost.
The following information is available concerning each component:
Costs (` per unit) M N
Direct materials 6.20 8.70
Direct labour 5.10 7.50
Variable production overheads 1.20 1.30
Fixed production overheads 4.80 6.40
Total 17.30 23.90
Machine hours (per unit) 2.00 3.00
Price from outside supplier (` per unit) 18.50 25.90
Required:
For the next period:

Work Book : Cost & Management Accounting and Financial Management
Directorate of Studies, The Institute of Cost Accountants of India (Statutory Body under an Act of Parliament) Page 12
(a) Calculate the variable costs of producing each component in-house.
(b) Calculate the extra costs of buying-in each component.
(c) Determine which component should have production priority. Show workings clearly and justify your
conclusion.
(d) Calculate the number of units of each component that should be manufactured by company XYZ.
Solution:
(a) Calculation for variable cost of producing in-house
Products M (`) N (`)
Variable Cost:
Direct material
Direct labour
Variable production overhead
Total
6.20
5.10
1.20
8.70
7.50
1.30
12.50 17.50
(b) Calculation of Extra Cost of Buying-in Each Component
Products M N
Price to be charged by outside Supplier
Variable cost of producing In-house [as per (a)]
18.50
12.50
25.90
1750
Extra cost of buying - in 6.00 8.40
(c) Machine hour per unit
Particulars M N
Machine hour per unit
Extra cost of buying-in per unit
Extra cost of buying (per machine hour) (`)
2 Hours
6.00
3.00
3 Hours
8.40
2.80
Priority should be given to the production of component M in order to minimize the extra cost of buying-
in.
(d) Components to be manufactured by XYZ
M = 75 units (75 units x 2 hours) = 150 machine hours
N = 50 units [(300 - 150 machine hours
13. A company producing products PIE and SIGMA using a single production process has the following cost
data:
Particulars PIE SIGMA
Selling price per unit (`) 20 30
Variable cost per unit (`) 11 16
Machine hours required per unit production (Hours) 1 2
Market limitation (units) 100000 250000
Work Book : Cost & Management Accounting and Financial Management
Directorate of Studies, The Institute of Cost Accountants of India (Statutory Body under an Act of Parliament) Page 13
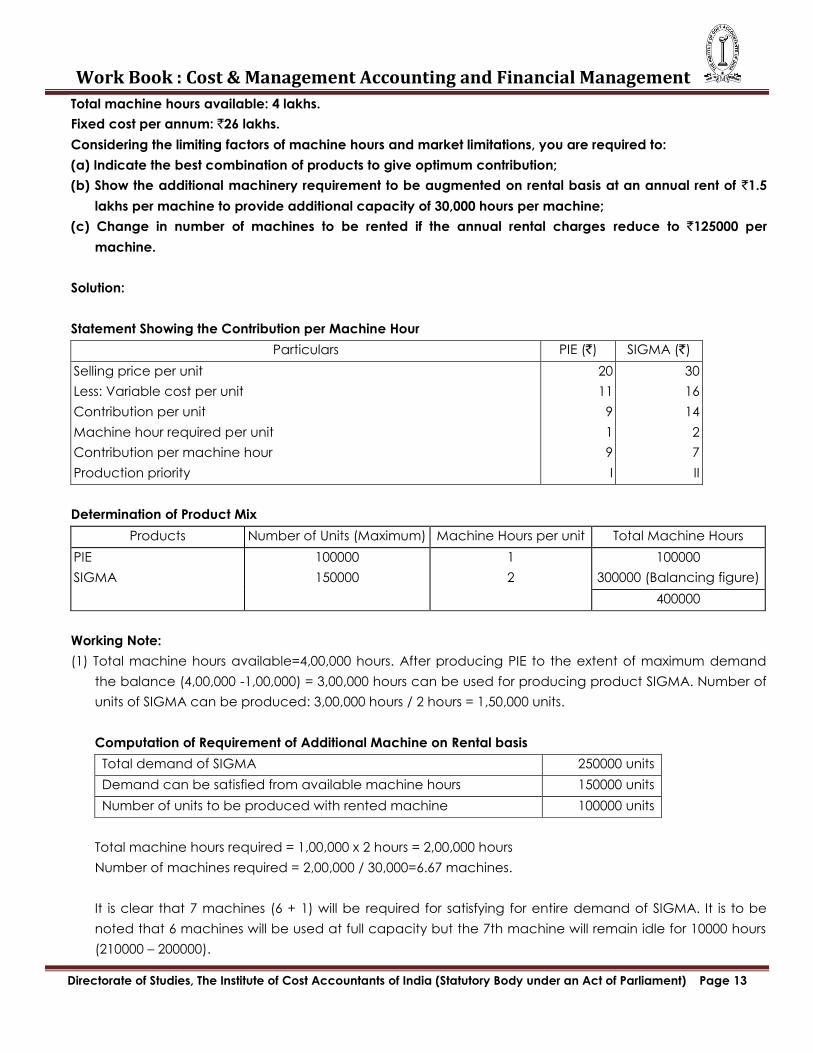
Total machine hours available: 4 lakhs.
Fixed cost per annum: `26 lakhs.
Considering the limiting factors of machine hours and market limitations, you are required to:
(a) Indicate the best combination of products to give optimum contribution;
(b) Show the additional machinery requirement to be augmented on rental basis at an annual rent of `1.5
lakhs per machine to provide additional capacity of 30,000 hours per machine;
(c) Change in number of machines to be rented if the annual rental charges reduce to `125000 per
machine.
Solution:
Statement Showing the Contribution per Machine Hour
Particulars PIE (`) SIGMA (`)
Selling price per unit
Less: Variable cost per unit
Contribution per unit
Machine hour required per unit
Contribution per machine hour
Production priority
20
11
9
1
9
I
30
16
14
2
7
II
Determination of Product Mix
Products Number of Units (Maximum) Machine Hours per unit Total Machine Hours
PIE
SIGMA
100000
150000
1
2
100000
300000 (Balancing figure)
400000
Working Note:
(1) Total machine hours available=4,00,000 hours. After producing PIE to the extent of maximum demand
the balance (4,00,000 -1,00,000) = 3,00,000 hours can be used for producing product SIGMA. Number of
units of SIGMA can be produced: 3,00,000 hours / 2 hours = 1,50,000 units.
Computation of Requirement of Additional Machine on Rental basis
Total demand of SIGMA 250000 units
Demand can be satisfied from available machine hours 150000 units
Number of units to be produced with rented machine 100000 units
Total machine hours required = 1,00,000 x 2 hours = 2,00,000 hours
Number of machines required = 2,00,000 / 30,000=6.67 machines.
It is clear that 7 machines (6 + 1) will be required for satisfying for entire demand of SIGMA. It is to be
noted that 6 machines will be used at full capacity but the 7th machine will remain idle for 10000 hours
(210000 – 200000).
Work Book : Cost & Management Accounting and Financial Management
Directorate of Studies, The Institute of Cost Accountants of India (Statutory Body under an Act of Parliament) Page 14
Contribution per machine hour = `7.00.
Total contribution from 7th machine (20,000 x 7) = `140000
Less: Rental of 7th machine = 150000
Contribution (10000)
As the contribution is negative, the 7th machine should not be taken on rent.
Hiring of 7th machine will be justified if the rental is less than `1,40,000 (i.e., the contribution from 20000
machine hours). If the machine rental is `1,25,000, then it is economical to take it on rent. Additional
contribution will be: `1,40,000 – ` 1,25,000 = `15,000.
Alternatively,
Contribution from 7th machine (20,000 x 7) `140000
Less: Rent of machines 125000
Additional contribution 15000
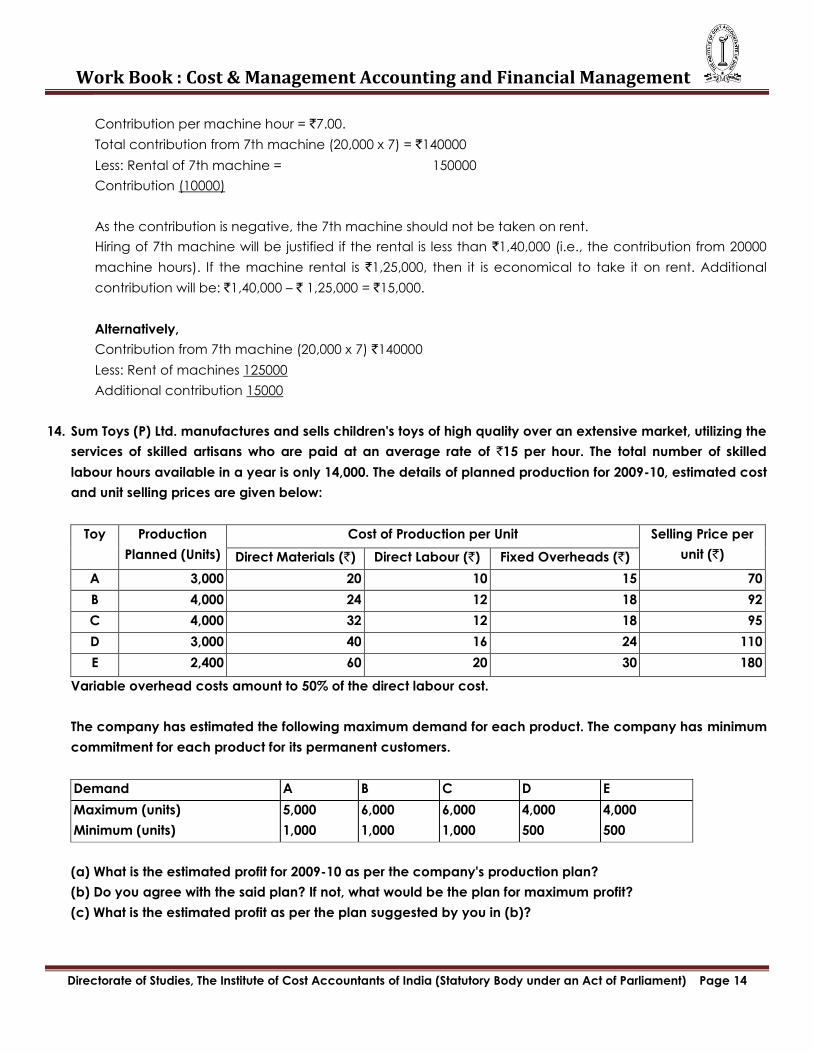
14. Sum Toys (P) Ltd. manufactures and sells children's toys of high quality over an extensive market, utilizing the
services of skilled artisans who are paid at an average rate of `15 per hour. The total number of skilled
labour hours available in a year is only 14,000. The details of planned production for 2009-10, estimated cost
and unit selling prices are given below:
Toy Production
Planned (Units)
Cost of Production per Unit Selling Price per
unit (`) Direct Materials (`) Direct Labour (`) Fixed Overheads (`)
A 3,000 20 10 15 70
B 4,000 24 12 18 92
C 4,000 32 12 18 95
D 3,000 40 16 24 110
E 2,400 60 20 30 180
Variable overhead costs amount to 50% of the direct labour cost.
The company has estimated the following maximum demand for each product. The company has minimum
commitment for each product for its permanent customers.
Demand A B C D E
Maximum (units)
Minimum (units)
5,000
1,000
6,000
1,000
6,000
1,000
4,000
500
4,000
500
(a) What is the estimated profit for 2009-10 as per the company's production plan?
(b) Do you agree with the said plan? If not, what would be the plan for maximum profit?
(c) What is the estimated profit as per the plan suggested by you in (b)?
Work Book : Cost & Management Accounting and Financial Management
Directorate of Studies, The Institute of Cost Accountants of India (Statutory Body under an Act of Parliament) Page 15
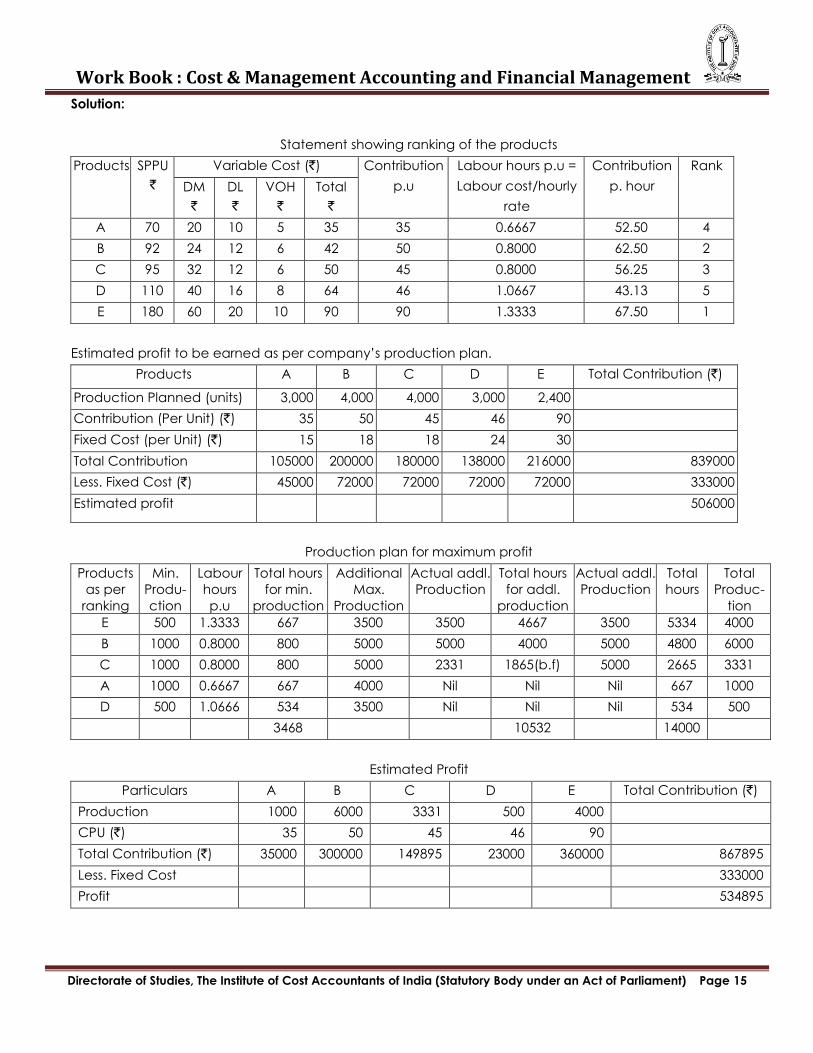
Solution:
Statement showing ranking of the products
Products SPPU
`
Variable Cost (`) Contribution
p.u
Labour hours p.u =
Labour cost/hourly
rate
Contribution
p. hour
Rank
DM
`
DL
`
VOH
`
Total
`
A 70 20 10 5 35 35 0.6667 52.50 4
B 92 24 12 6 42 50 0.8000 62.50 2
C 95 32 12 6 50 45 0.8000 56.25 3
D 110 40 16 8 64 46 1.0667 43.13 5
E 180 60 20 10 90 90 1.3333 67.50 1
Estimated profit to be earned as per company‘s production plan.
Products A B C D E Total Contribution (`)
Production Planned (units) 3,000 4,000 4,000 3,000 2,400
Contribution (Per Unit) (`) 35 50 45 46 90
Fixed Cost (per Unit) (`) 15 18 18 24 30
Total Contribution 105000 200000 180000 138000 216000 839000
Less. Fixed Cost (`) 45000 72000 72000 72000 72000 333000
Estimated profit 506000
Production plan for maximum profit
Products
as per
ranking
Min.
Produ-
ction
Labour
hours
p.u
Total hours
for min.
production
Additional
Max.
Production
Actual addl.
Production
Total hours
for addl.
production
Actual addl.
Production
Total
hours
Total
Produc-
tion
E 500 1.3333 667 3500 3500 4667 3500 5334 4000
B 1000 0.8000 800 5000 5000 4000 5000 4800 6000
C 1000 0.8000 800 5000 2331 1865(b.f) 5000 2665 3331
A 1000 0.6667 667 4000 Nil Nil Nil 667 1000
D 500 1.0666 534 3500 Nil Nil Nil 534 500
3468 10532 14000
Estimated Profit
Particulars A B C D E Total Contribution (`)
Production 1000 6000 3331 500 4000
CPU (`) 35 50 45 46 90
Total Contribution (`) 35000 300000 149895 23000 360000 867895
Less. Fixed Cost 333000
Profit 534895
Work Book : Cost & Management Accounting and Financial Management
Directorate of Studies, The Institute of Cost Accountants of India (Statutory Body under an Act of Parliament) Page 16
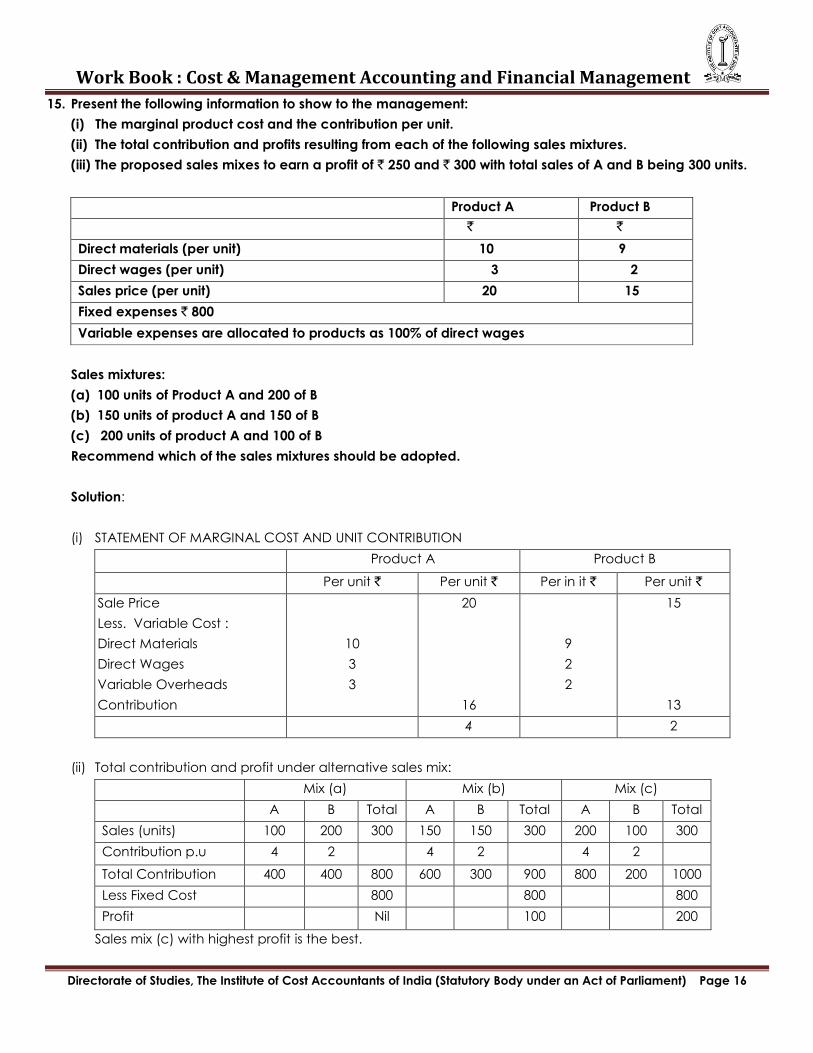
15. Present the following information to show to the management:
(i) The marginal product cost and the contribution per unit.
(ii) The total contribution and profits resulting from each of the following sales mixtures.
(iii) The proposed sales mixes to earn a profit of ` 250 and ` 300 with total sales of A and B being 300 units.
Product A Product B
` `
Direct materials (per unit) 10 9
Direct wages (per unit) 3 2
Sales price (per unit) 20 15
Fixed expenses ` 800
Variable expenses are allocated to products as 100% of direct wages
Sales mixtures:
(a) 100 units of Product A and 200 of B
(b) 150 units of product A and 150 of B
(c) 200 units of product A and 100 of B
Recommend which of the sales mixtures should be adopted.
Solution:
(i) STATEMENT OF MARGINAL COST AND UNIT CONTRIBUTION
Product A Product B
Per unit ` Per unit ` Per in it ` Per unit `
Sale Price
Less. Variable Cost :
Direct Materials
Direct Wages
Variable Overheads
Contribution
10
3
3
20
16
9
2
2
15
13
4 2
(ii) Total contribution and profit under alternative sales mix:
Mix (a) Mix (b) Mix (c)
A B Total A B Total A B Total
Sales (units) 100 200 300 150 150 300 200 100 300
Contribution p.u 4 2 4 2 4 2
Total Contribution 400 400 800 600 300 900 800 200 1000
Less Fixed Cost 800 800 800
Profit Nil 100 200
Sales mix (c) with highest profit is the best.
Work Book : Cost & Management Accounting and Financial Management
Directorate of Studies, The Institute of Cost Accountants of India (Statutory Body under an Act of Parliament) Page 17
(iii) Let x units of product A and (300-x) units of product B are to be sold.
Earning profits of `250
Then, [x*4+ (300-x)*2] -800 = 250
So x = 225
And 300-x = 75
Proposed mix:
Product A= 225
Product B = 75
Earning profits of `300
Then, [x*4+ (300-x)*2] -800 = 300
So x = 250
And 300-x = 50
Proposed mix:
Product A= 250
Product B = 50
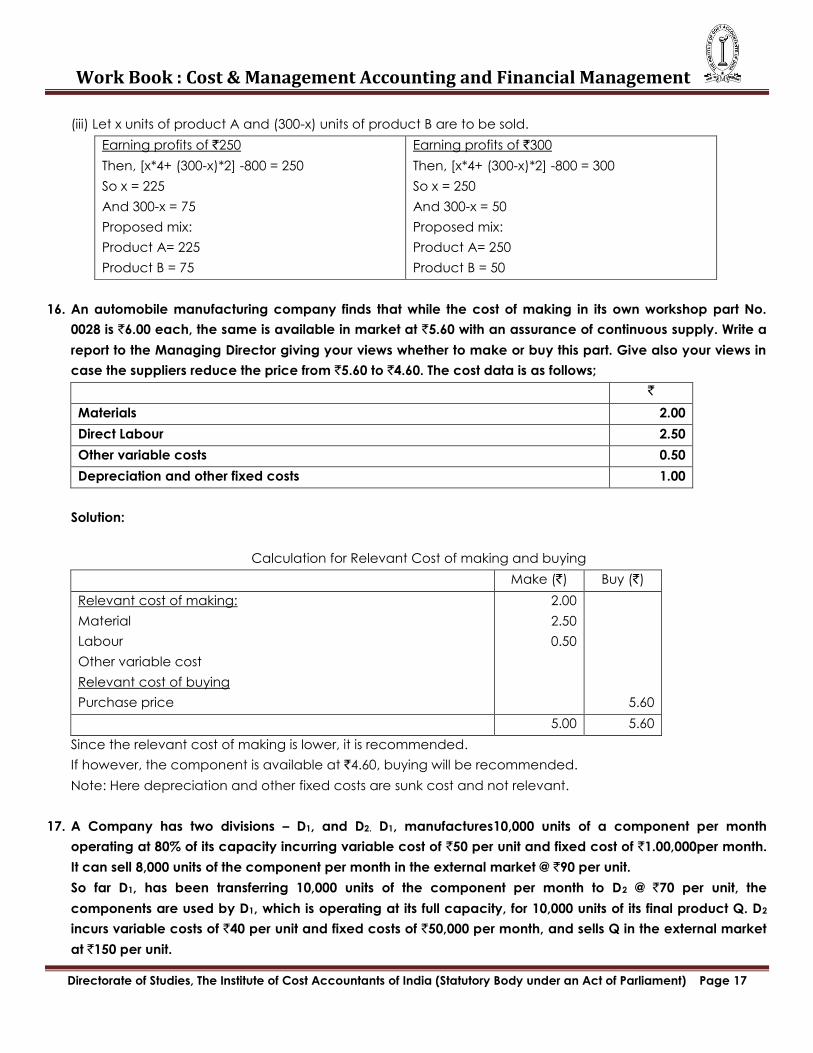
16. An automobile manufacturing company finds that while the cost of making in its own workshop part No.
0028 is `6.00 each, the same is available in market at `5.60 with an assurance of continuous supply. Write a
report to the Managing Director giving your views whether to make or buy this part. Give also your views in
case the suppliers reduce the price from `5.60 to `4.60. The cost data is as follows;
`
Materials 2.00
Direct Labour 2.50
Other variable costs 0.50
Depreciation and other fixed costs 1.00
Solution:
Calculation for Relevant Cost of making and buying
Make (`) Buy (`)
Relevant cost of making:
Material
Labour
Other variable cost
Relevant cost of buying
Purchase price
2.00
2.50
0.50
5.60
5.00 5.60
Since the relevant cost of making is lower, it is recommended.
If however, the component is available at `4.60, buying will be recommended.
Note: Here depreciation and other fixed costs are sunk cost and not relevant.
17. A Company has two divisions – D1, and D2. D1, manufactures10,000 units of a component per month
operating at 80% of its capacity incurring variable cost of `50 per unit and fixed cost of `1.00,000per month.
It can sell 8,000 units of the component per month in the external market @ `90 per unit.
So far D1, has been transferring 10,000 units of the component per month to D2 @ `70 per unit, the
components are used by D1, which is operating at its full capacity, for 10,000 units of its final product Q. D2
incurs variable costs of `40 per unit and fixed costs of `50,000 per month, and sells Q in the external market
at `150 per unit.
Work Book : Cost & Management Accounting and Financial Management
Directorate of Studies, The Institute of Cost Accountants of India (Statutory Body under an Act of Parliament) Page 18
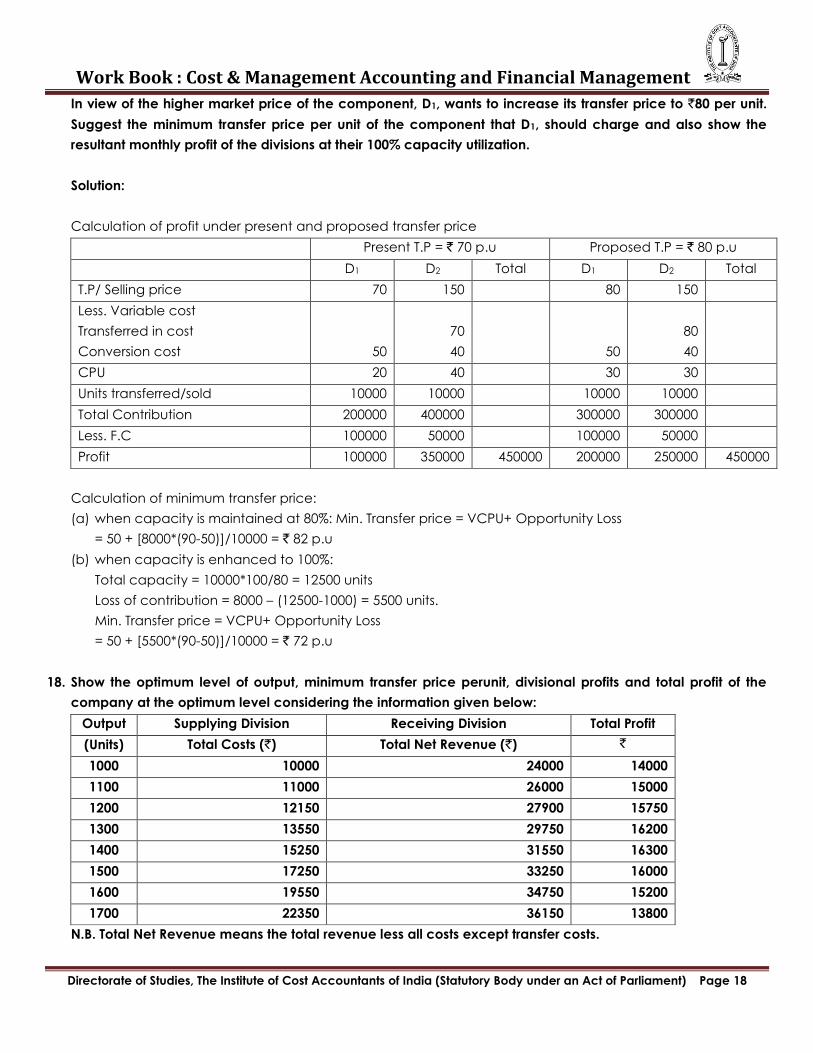
In view of the higher market price of the component, D1, wants to increase its transfer price to `80 per unit.
Suggest the minimum transfer price per unit of the component that D1, should charge and also show the
resultant monthly profit of the divisions at their 100% capacity utilization.
Solution:
Calculation of profit under present and proposed transfer price
Present T.P = ` 70 p.u Proposed T.P = ` 80 p.u
D1 D2 Total D1 D2 Total
T.P/ Selling price 70 150 80 150
Less. Variable cost
Transferred in cost
Conversion cost
50
70
40
50
80
40
CPU 20 40 30 30
Units transferred/sold 10000 10000 10000 10000
Total Contribution 200000 400000 300000 300000
Less. F.C 100000 50000 100000 50000
Profit 100000 350000 450000 200000 250000 450000
Calculation of minimum transfer price:
(a) when capacity is maintained at 80%: Min. Transfer price = VCPU+ Opportunity Loss
= 50 + [8000*(90-50)]/10000 = ` 82 p.u
(b) when capacity is enhanced to 100%:
Total capacity = 10000*100/80 = 12500 units
Loss of contribution = 8000 – (12500-1000) = 5500 units.
Min. Transfer price = VCPU+ Opportunity Loss
= 50 + [5500*(90-50)]/10000 = ` 72 p.u
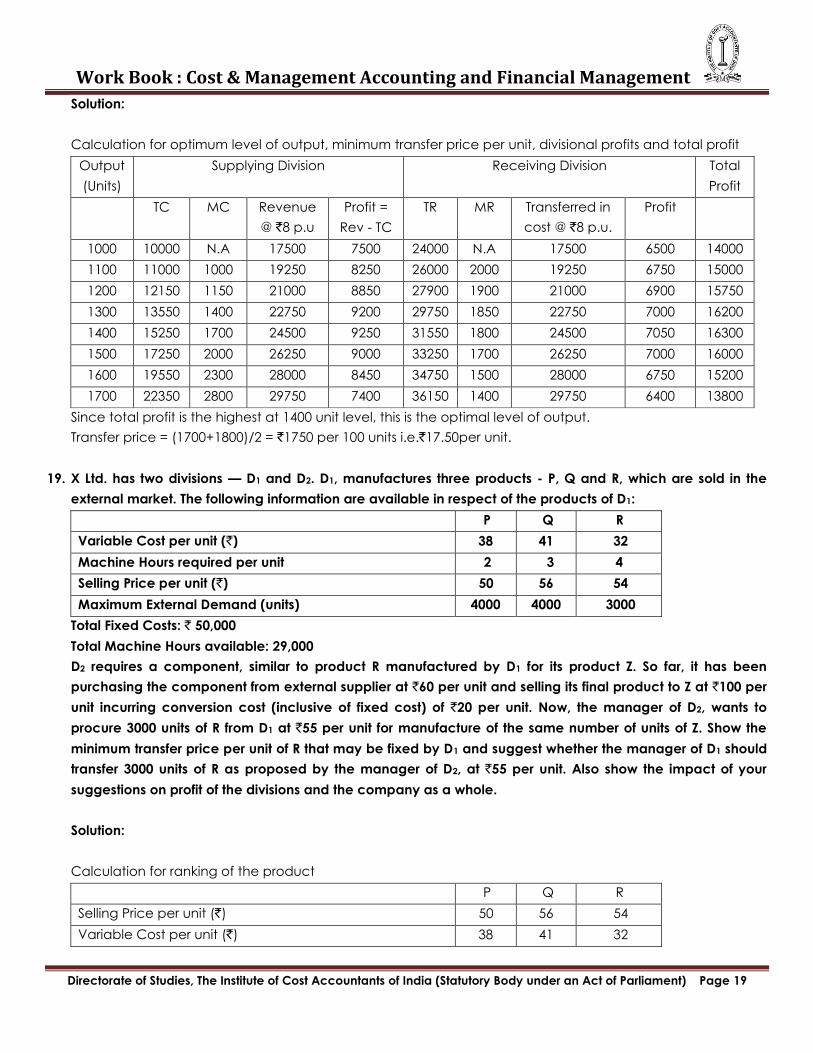
18. Show the optimum level of output, minimum transfer price perunit, divisional profits and total profit of the
company at the optimum level considering the information given below:
Output Supplying Division Receiving Division Total Profit
(Units) Total Costs (`) Total Net Revenue (`) `
1000 10000 24000 14000
1100 11000 26000 15000
1200 12150 27900 15750
1300 13550 29750 16200
1400 15250 31550 16300
1500 17250 33250 16000
1600 19550 34750 15200
1700 22350 36150 13800
N.B. Total Net Revenue means the total revenue less all costs except transfer costs.
Work Book : Cost & Management Accounting and Financial Management
Directorate of Studies, The Institute of Cost Accountants of India (Statutory Body under an Act of Parliament) Page 19
Solution:
Calculation for optimum level of output, minimum transfer price per unit, divisional profits and total profit
Output
(Units)
Supplying Division Receiving Division Total
Profit
TC MC Revenue
@ `8 p.u
Profit =
Rev - TC
TR MR Transferred in
cost @ `8 p.u.
Profit
1000 10000 N.A 17500 7500 24000 N.A 17500 6500 14000
1100 11000 1000 19250 8250 26000 2000 19250 6750 15000
1200 12150 1150 21000 8850 27900 1900 21000 6900 15750
1300 13550 1400 22750 9200 29750 1850 22750 7000 16200
1400 15250 1700 24500 9250 31550 1800 24500 7050 16300
1500 17250 2000 26250 9000 33250 1700 26250 7000 16000
1600 19550 2300 28000 8450 34750 1500 28000 6750 15200
1700 22350 2800 29750 7400 36150 1400 29750 6400 13800
Since total profit is the highest at 1400 unit level, this is the optimal level of output.
Transfer price = (1700+1800)/2 = `1750 per 100 units i.e.`17.50per unit.
19. X Ltd. has two divisions — D1 and D2. D1, manufactures three products - P, Q and R, which are sold in the
external market. The following information are available in respect of the products of D1:
P Q R
Variable Cost per unit (`) 38 41 32
Machine Hours required per unit 2 3 4
Selling Price per unit (`) 50 56 54
Maximum External Demand (units) 4000 4000 3000
Total Fixed Costs: ` 50,000
Total Machine Hours available: 29,000
D2 requires a component, similar to product R manufactured by D1 for its product Z. So far, it has been
purchasing the component from external supplier at `60 per unit and selling its final product to Z at `100 per
unit incurring conversion cost (inclusive of fixed cost) of `20 per unit. Now, the manager of D2, wants to
procure 3000 units of R from D1 at `55 per unit for manufacture of the same number of units of Z. Show the
minimum transfer price per unit of R that may be fixed by D1 and suggest whether the manager of D1 should
transfer 3000 units of R as proposed by the manager of D2, at `55 per unit. Also show the impact of your
suggestions on profit of the divisions and the company as a whole.
Solution:
Calculation for ranking of the product
P Q R
Selling Price per unit (`) 50 56 54
Variable Cost per unit (`) 38 41 32

Work Book : Cost & Management Accounting and Financial Management
Directorate of Studies, The Institute of Cost Accountants of India (Statutory Body under an Act of Parliament) Page 20
Contribution p.u. 12 15 22
Machine Hours required per unit 2 3 4
Contribution per machine hour 6 5 5.50
Ranking I III II
Production plan:
Product as per
ranking
Machine hour
per unit
Maximum
demand
Total Hours Actual
Production
P 2 4000 8000 4000
R 4 3000 12000 3000
Q 3 4000 9000 (b.f) 3000 (9000/3)
29000
D2 requires 3000 units of R. To produce 3000 units of r, D1 will require 12000 hours. This capacity can be
arranged by stopping the current production of Q entirely (9000 hours) and by curtailing the production of R
(3000 hours) for market. R to be sold in the market is (12000-3000)/4 =750 units.
Total loss of contribution in such case = (9000*5 +3000*5.50) = `61500
So, minimum transfer price = VCPU +Opportunity loss = `32 +61500/3000 = `52.50
Since the offer price from D2 is higher, the transfer price of `55 per unit is acceptable.
Calculation of total profit
D1 D2 Total
Market Transfer Total
P R R Z
Market price/Transfer price 50 54 55 100
Less: variable cost 38 32 32 75 (55+20)
CPU 12 22 23 25
Units sold/transferred 4000 750 3000 3000
Total Contribution 48000 16500 69000 133500 75000
Less Fixed cost 50000 Included in conversion cost
83500 75000 158500
20. PQR Ltd. is an engineering company engaged in the manufacture of three products –X, Y and Z all of which
use the same machine which is available for 77000 hours p.a.
The standard costs of the product per unit are:
X (`) Y(`) Z(`)
Direct material 140 80 160
Direct labour (`16 per machine hour) 96 64 112
Variable overhead 72 80 84
Total cost 308 224 356
Selling price per unit 400 316 448
Maximum demand (units) 6000 5000 10000
Work Book : Cost & Management Accounting and Financial Management
Directorate of Studies, The Institute of Cost Accountants of India (Statutory Body under an Act of Parliament) Page 21
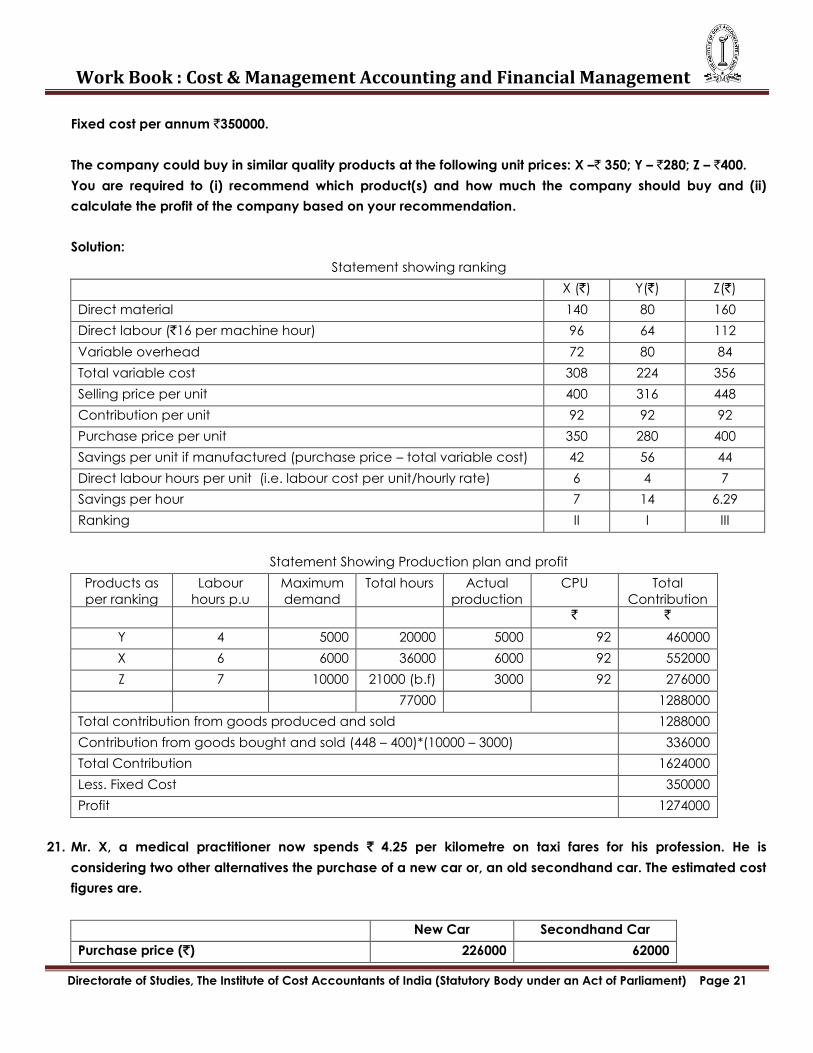
Fixed cost per annum `350000.
The company could buy in similar quality products at the following unit prices: X –` 350; Y – `280; Z – `400.
You are required to (i) recommend which product(s) and how much the company should buy and (ii)
calculate the profit of the company based on your recommendation.
Solution:
Statement showing ranking
X (`) Y(`) Z(`)
Direct material 140 80 160
Direct labour (`16 per machine hour) 96 64 112
Variable overhead 72 80 84
Total variable cost 308 224 356
Selling price per unit 400 316 448
Contribution per unit 92 92 92
Purchase price per unit 350 280 400
Savings per unit if manufactured (purchase price – total variable cost) 42 56 44
Direct labour hours per unit (i.e. labour cost per unit/hourly rate) 6 4 7
Savings per hour 7 14 6.29
Ranking II I III
Statement Showing Production plan and profit
Products as
per ranking
Labour
hours p.u
Maximum
demand
Total hours Actual
production
CPU Total
Contribution
` `
Y 4 5000 20000 5000 92 460000
X 6 6000 36000 6000 92 552000
Z 7 10000 21000 (b.f) 3000 92 276000
77000 1288000
Total contribution from goods produced and sold 1288000
Contribution from goods bought and sold (448 – 400)*(10000 – 3000) 336000
Total Contribution 1624000
Less. Fixed Cost 350000
Profit 1274000
21. Mr. X, a medical practitioner now spends ` 4.25 per kilometre on taxi fares for his profession. He is
considering two other alternatives the purchase of a new car or, an old secondhand car. The estimated cost
figures are.
New Car Secondhand Car
Purchase price (`) 226000 62000
Work Book : Cost & Management Accounting and Financial Management
Directorate of Studies, The Institute of Cost Accountants of India (Statutory Body under an Act of Parliament) Page 22
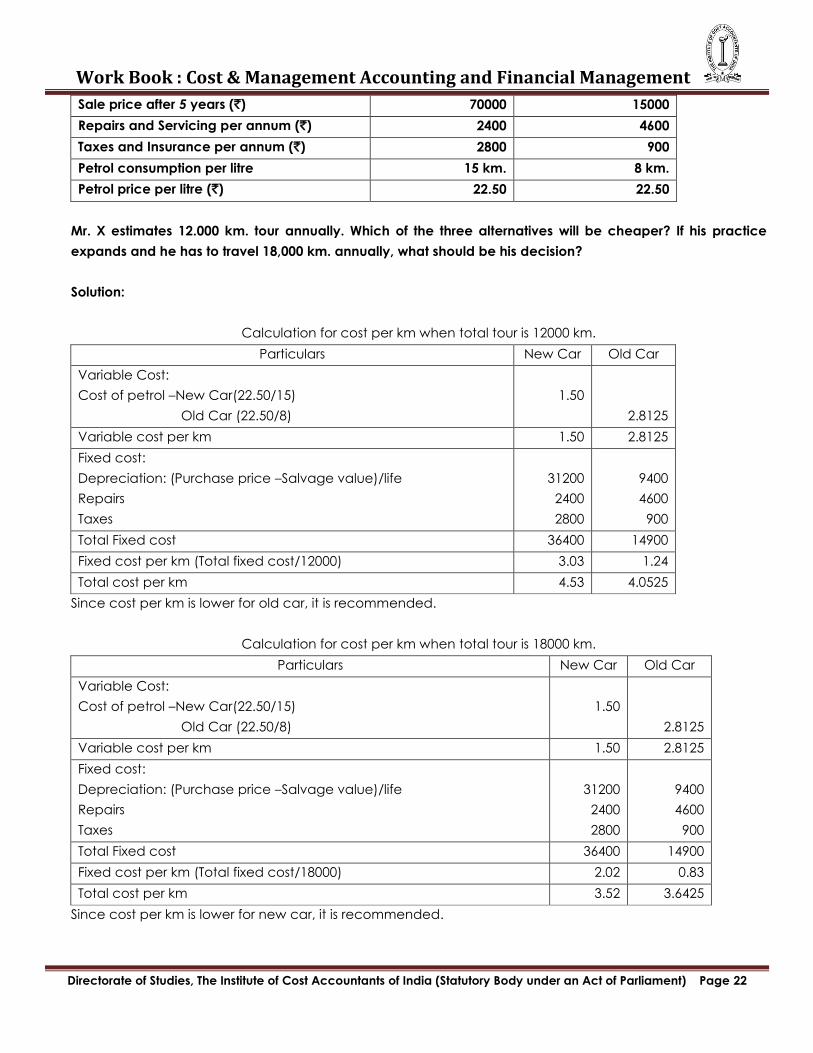
Sale price after 5 years (`) 70000 15000
Repairs and Servicing per annum (`) 2400 4600
Taxes and Insurance per annum (`) 2800 900
Petrol consumption per litre 15 km. 8 km.
Petrol price per litre (`) 22.50 22.50
Mr. X estimates 12.000 km. tour annually. Which of the three alternatives will be cheaper? If his practice
expands and he has to travel 18,000 km. annually, what should be his decision?
Solution:
Calculation for cost per km when total tour is 12000 km.
Particulars New Car Old Car
Variable Cost:
Cost of petrol –New Car(22.50/15)
Old Car (22.50/8)
1.50
2.8125
Variable cost per km 1.50 2.8125
Fixed cost:
Depreciation: (Purchase price –Salvage value)/life
Repairs
Taxes
31200
2400
2800
9400
4600
900
Total Fixed cost 36400 14900
Fixed cost per km (Total fixed cost/12000) 3.03 1.24
Total cost per km 4.53 4.0525
Since cost per km is lower for old car, it is recommended.
Calculation for cost per km when total tour is 18000 km.
Particulars New Car Old Car
Variable Cost:
Cost of petrol –New Car(22.50/15)
Old Car (22.50/8)
1.50
2.8125
Variable cost per km 1.50 2.8125
Fixed cost:
Depreciation: (Purchase price –Salvage value)/life
Repairs
Taxes
31200
2400
2800
9400
4600
900
Total Fixed cost 36400 14900
Fixed cost per km (Total fixed cost/18000) 2.02 0.83
Total cost per km 3.52 3.6425
Since cost per km is lower for new car, it is recommended.
Work Book : Cost & Management Accounting and Financial Management
Directorate of Studies, The Institute of Cost Accountants of India (Statutory Body under an Act of Parliament) Page 23
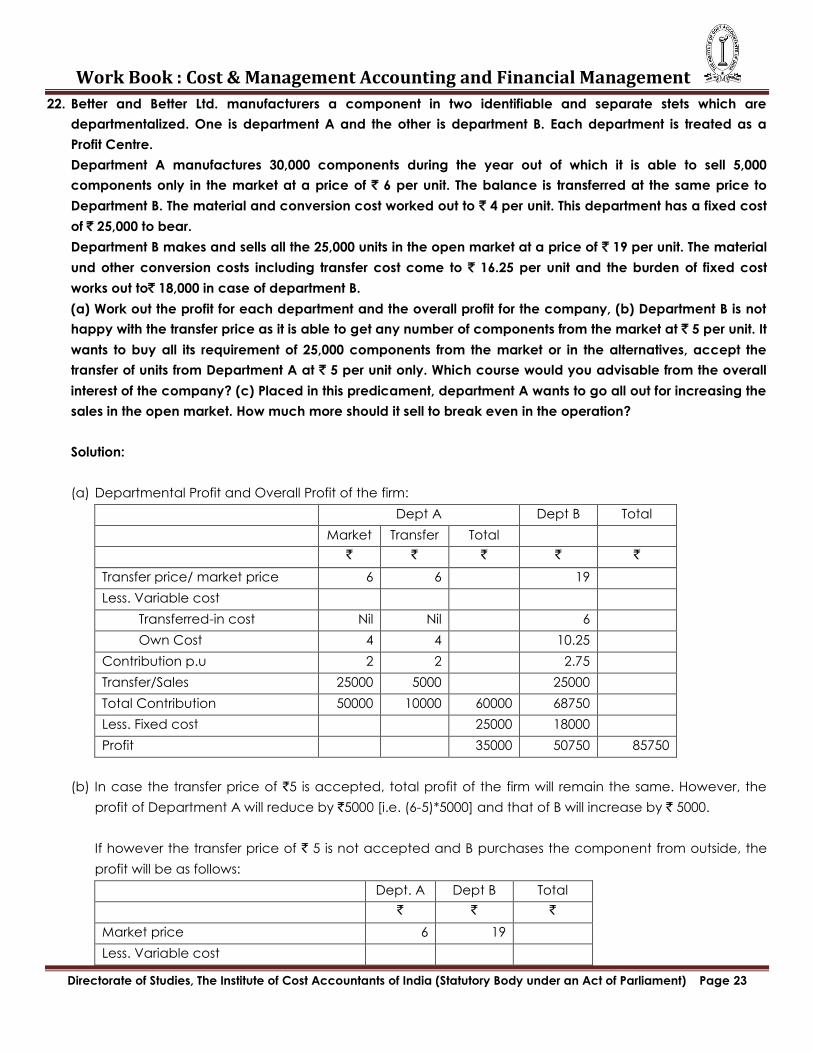
22. Better and Better Ltd. manufacturers a component in two identifiable and separate stets which are
departmentalized. One is department A and the other is department B. Each department is treated as a
Profit Centre.
Department A manufactures 30,000 components during the year out of which it is able to sell 5,000
components only in the market at a price of ` 6 per unit. The balance is transferred at the same price to
Department B. The material and conversion cost worked out to ` 4 per unit. This department has a fixed cost
of ` 25,000 to bear.
Department B makes and sells all the 25,000 units in the open market at a price of ` 19 per unit. The material
und other conversion costs including transfer cost come to ` 16.25 per unit and the burden of fixed cost
works out to` 18,000 in case of department B.
(a) Work out the profit for each department and the overall profit for the company, (b) Department B is not
happy with the transfer price as it is able to get any number of components from the market at ` 5 per unit. It
wants to buy all its requirement of 25,000 components from the market or in the alternatives, accept the
transfer of units from Department A at ` 5 per unit only. Which course would you advisable from the overall
interest of the company? (c) Placed in this predicament, department A wants to go all out for increasing the
sales in the open market. How much more should it sell to break even in the operation?
Solution:
(a) Departmental Profit and Overall Profit of the firm:
Dept A Dept B Total
Market Transfer Total
` ` ` ` `
Transfer price/ market price 6 6 19
Less. Variable cost
Transferred-in cost Nil Nil 6
Own Cost 4 4 10.25
Contribution p.u 2 2 2.75
Transfer/Sales 25000 5000 25000
Total Contribution 50000 10000 60000 68750
Less. Fixed cost 25000 18000
Profit 35000 50750 85750
(b) In case the transfer price of `5 is accepted, total profit of the firm will remain the same. However, the
profit of Department A will reduce by `5000 [i.e. (6-5)*5000] and that of B will increase by ` 5000.
If however the transfer price of ` 5 is not accepted and B purchases the component from outside, the
profit will be as follows:
Dept. A Dept B Total
` ` `
Market price 6 19
Less. Variable cost
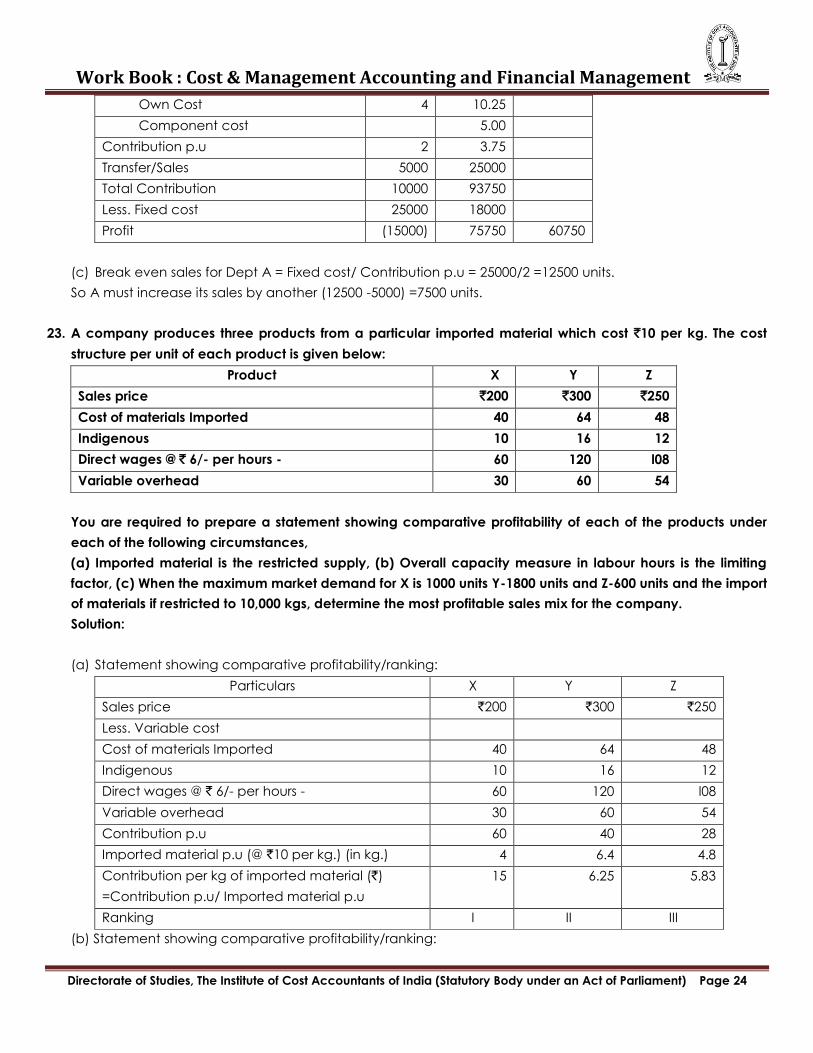
Work Book : Cost & Management Accounting and Financial Management
Directorate of Studies, The Institute of Cost Accountants of India (Statutory Body under an Act of Parliament) Page 24
Own Cost 4 10.25
Component cost 5.00
Contribution p.u 2 3.75
Transfer/Sales 5000 25000
Total Contribution 10000 93750
Less. Fixed cost 25000 18000
Profit (15000) 75750 60750
(c) Break even sales for Dept A = Fixed cost/ Contribution p.u = 25000/2 =12500 units.
So A must increase its sales by another (12500 -5000) =7500 units.
23. A company produces three products from a particular imported material which cost `10 per kg. The cost
structure per unit of each product is given below:
Product X Y Z
Sales price `200 `300 `250
Cost of materials Imported 40 64 48
Indigenous 10 16 12
Direct wages @ ` 6/- per hours - 60 120 l08
Variable overhead 30 60 54
You are required to prepare a statement showing comparative profitability of each of the products under
each of the following circumstances,
(a) Imported material is the restricted supply, (b) Overall capacity measure in labour hours is the limiting
factor, (c) When the maximum market demand for X is 1000 units Y-1800 units and Z-600 units and the import
of materials if restricted to 10,000 kgs, determine the most profitable sales mix for the company.
Solution:
(a) Statement showing comparative profitability/ranking:
Particulars X Y Z
Sales price `200 `300 `250
Less. Variable cost
Cost of materials Imported 40 64 48
Indigenous 10 16 12
Direct wages @ ` 6/- per hours - 60 120 l08
Variable overhead 30 60 54
Contribution p.u 60 40 28
Imported material p.u (@ `10 per kg.) (in kg.) 4 6.4 4.8
Contribution per kg of imported material (`)
=Contribution p.u/ Imported material p.u
15 6.25 5.83
Ranking I II III
(b) Statement showing comparative profitability/ranking:
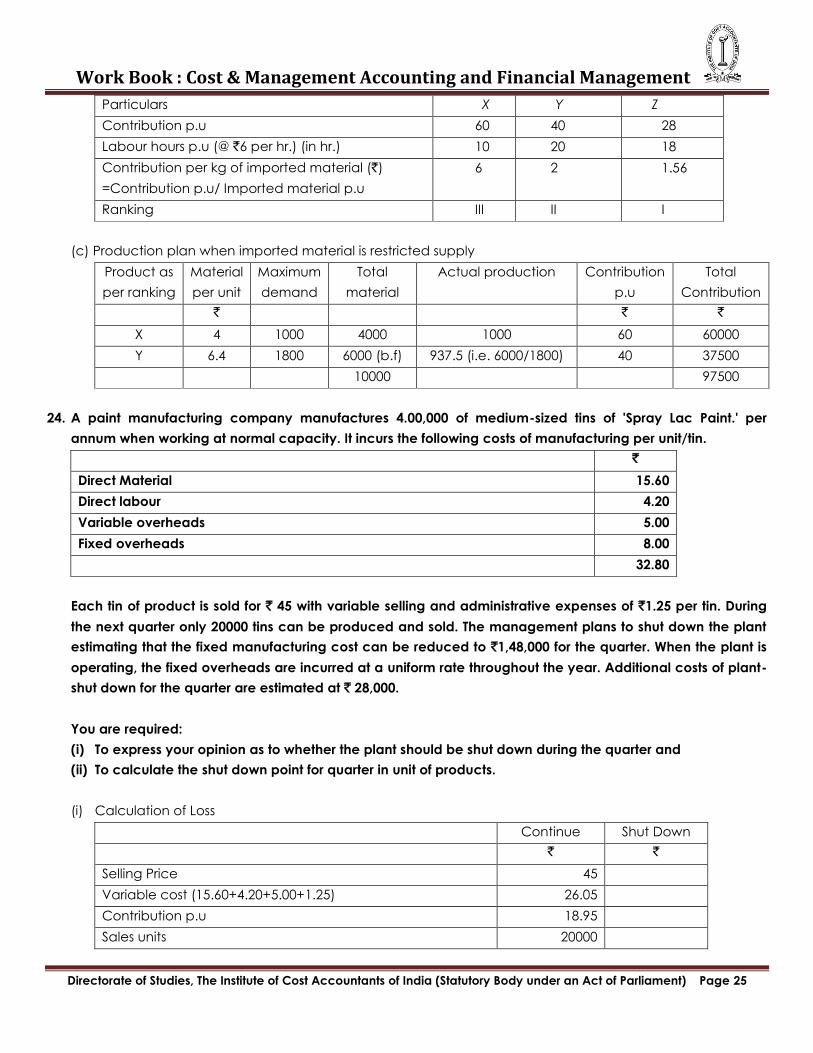
Work Book : Cost & Management Accounting and Financial Management
Directorate of Studies, The Institute of Cost Accountants of India (Statutory Body under an Act of Parliament) Page 25
Particulars X Y Z
Contribution p.u 60 40 28
Labour hours p.u (@ `6 per hr.) (in hr.) 10 20 18
Contribution per kg of imported material (`)
=Contribution p.u/ Imported material p.u
6 2 1.56
Ranking III II I
(c) Production plan when imported material is restricted supply
Product as
per ranking
Material
per unit
Maximum
demand
Total
material
Actual production Contribution
p.u
Total
Contribution
` ` `
X 4 1000 4000 1000 60 60000
Y 6.4 1800 6000 (b.f) 937.5 (i.e. 6000/1800) 40 37500
10000 97500
24. A paint manufacturing company manufactures 4.00,000 of medium-sized tins of 'Spray Lac Paint.' per
annum when working at normal capacity. It incurs the following costs of manufacturing per unit/tin.
`
Direct Material 15.60
Direct labour 4.20
Variable overheads 5.00
Fixed overheads 8.00
32.80
Each tin of product is sold for ` 45 with variable selling and administrative expenses of `1.25 per tin. During
the next quarter only 20000 tins can be produced and sold. The management plans to shut down the plant
estimating that the fixed manufacturing cost can be reduced to `1,48,000 for the quarter. When the plant is
operating, the fixed overheads are incurred at a uniform rate throughout the year. Additional costs of plant-
shut down for the quarter are estimated at ` 28,000.
You are required:
(i) To express your opinion as to whether the plant should be shut down during the quarter and
(ii) To calculate the shut down point for quarter in unit of products.
(i) Calculation of Loss
Continue Shut Down
` `
Selling Price 45
Variable cost (15.60+4.20+5.00+1.25) 26.05
Contribution p.u 18.95
Sales units 20000

Work Book : Cost & Management Accounting and Financial Management
Directorate of Studies, The Institute of Cost Accountants of India (Statutory Body under an Act of Parliament) Page 26
Total contribution 379000
Less. Fixed cost [(400000*8)/4] 800000
Loss 421000
Fixed cost after shut down 148000
Additional shut down cost 28000
Loss under shut down 176000
Since loss is lower when the plant is shut down, shut down is recommended.
(ii) Shut down point = Fixed cost under shut down/Contribution p.u = 176000/18.95 = 9288 units.
25. A manufacturing company makes a single product which sells for `210 per unit and there is great demand
for the product. The variable cost of the product per unit is as follows:—
Direct Material `56
Direct Labour (4 hours) `28
Variable Overhead `28
The labour force is currently working at full capacity. A customer has approached the company with a
request for the manufacture special order at `40000.
The cost of the order would be `12000 for direct material and 800 labour hours will be required. Should the
order be accepted?
Solution:
Calculation for acceptable price of the special order.
`
Direct Material 12000
Direct Labour (28/4)*800 5600
Variable O/H (28/4)*800 5600
Total cost 23200
Loss of contribution [24.50*800] 19600
Acceptable price 42800
Since the offer price is lower than the acceptable price, it should not be accepted.
Working Note: Contribution p.u = 210-(56+28+28) = `98
Contribution per hour = 98/4 = `24.50
Work Book : Cost & Management Accounting and Financial Management
Directorate of Studies, The Institute of Cost Accountants of India (Statutory Body under an Act of Parliament) Page 27
Study Note – 3
BUDGETING AND BUDGETARY CONTROL
Section - I
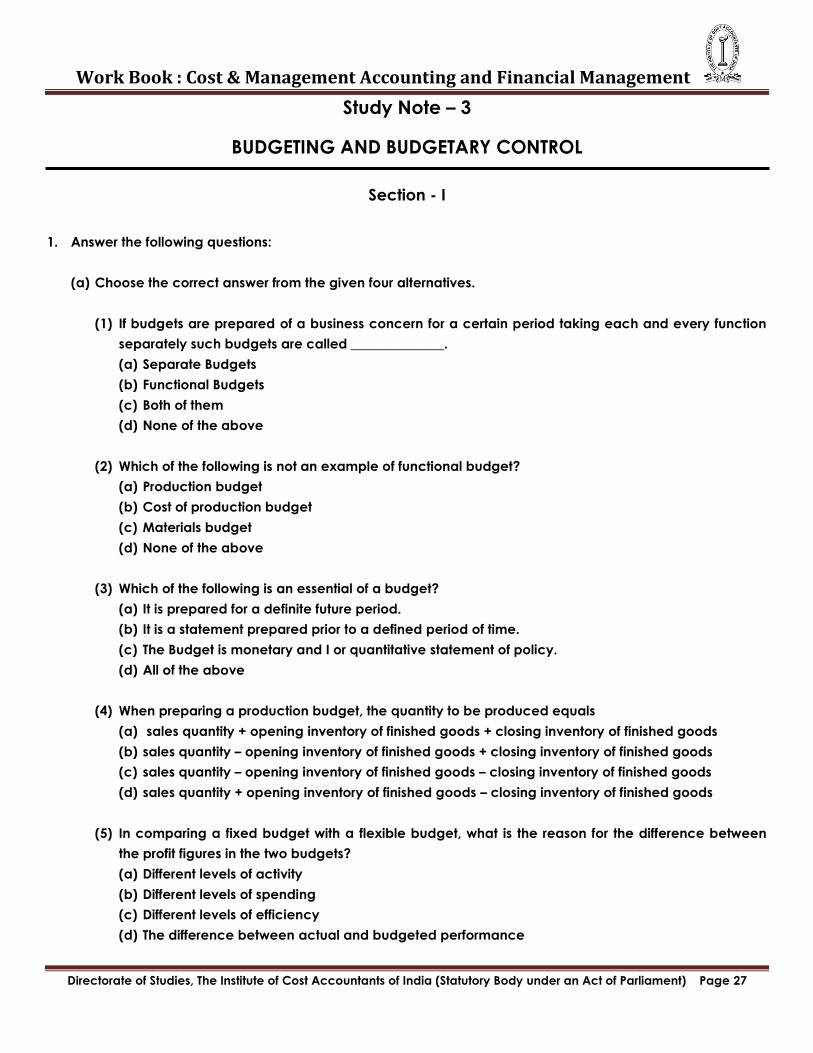
1. Answer the following questions:
(a) Choose the correct answer from the given four alternatives.
(1) If budgets are prepared of a business concern for a certain period taking each and every function
separately such budgets are called ______________.
(a) Separate Budgets
(b) Functional Budgets
(c) Both of them
(d) None of the above
(2) Which of the following is not an example of functional budget?
(a) Production budget
(b) Cost of production budget
(c) Materials budget
(d) None of the above
(3) Which of the following is an essential of a budget?
(a) It is prepared for a definite future period.
(b) It is a statement prepared prior to a defined period of time.
(c) The Budget is monetary and I or quantitative statement of policy.
(d) All of the above
(4) When preparing a production budget, the quantity to be produced equals
(a) sales quantity + opening inventory of finished goods + closing inventory of finished goods
(b) sales quantity – opening inventory of finished goods + closing inventory of finished goods
(c) sales quantity – opening inventory of finished goods – closing inventory of finished goods
(d) sales quantity + opening inventory of finished goods – closing inventory of finished goods
(5) In comparing a fixed budget with a flexible budget, what is the reason for the difference between
the profit figures in the two budgets?
(a) Different levels of activity
(b) Different levels of spending
(c) Different levels of efficiency
(d) The difference between actual and budgeted performance

Work Book : Cost & Management Accounting and Financial Management
Directorate of Studies, The Institute of Cost Accountants of India (Statutory Body under an Act of Parliament) Page 28
(6) When budget allowances are set without the involvement of the budget owner, the budgeting
process can be described as:
(a) top down budgeting
(b) negotiated budgeting
(c) zero based budgeting
(d) participative budgeting
(7) For which of the following would zero based budgeting be most suitable?
(a) Building construction
(b) Mining company operations
(c) Transport company operations
(d) Government department activities
Ans: 1-b; 2-d; 3-d; 4-b; 5-a; 6-a; 7-d.
(b) Match the statement in column I with the most appropriate statement in column II:
Column I Column II
1.Principal budget factor a. 'rationalisation'
2.Incremental budgeting b. summary budget.
3.ZBB c. sales demand
4. The Master Budget d. encourages slack
Ans: 1-c; 2-d; 3-a; 4-b
(c) State whether the following statements are true or false:
1. A budget is not a quantitative statement.
2. The principal budget factor is the factor which limits the activities of an organisation.
3. The flexible budget also called as Sliding Scale Budget.
4. The budget is imposed by lower management.
5. The sales budget is an example of functional budget.
6. Responsibility accounting is also called profitability accounting and activity accounting.
Ans: 1-F; 2-T; 3-T; 4-F; 5-T; 6-T
Work Book : Cost & Management Accounting and Financial Management
Directorate of Studies, The Institute of Cost Accountants of India (Statutory Body under an Act of Parliament) Page 29
Section-II
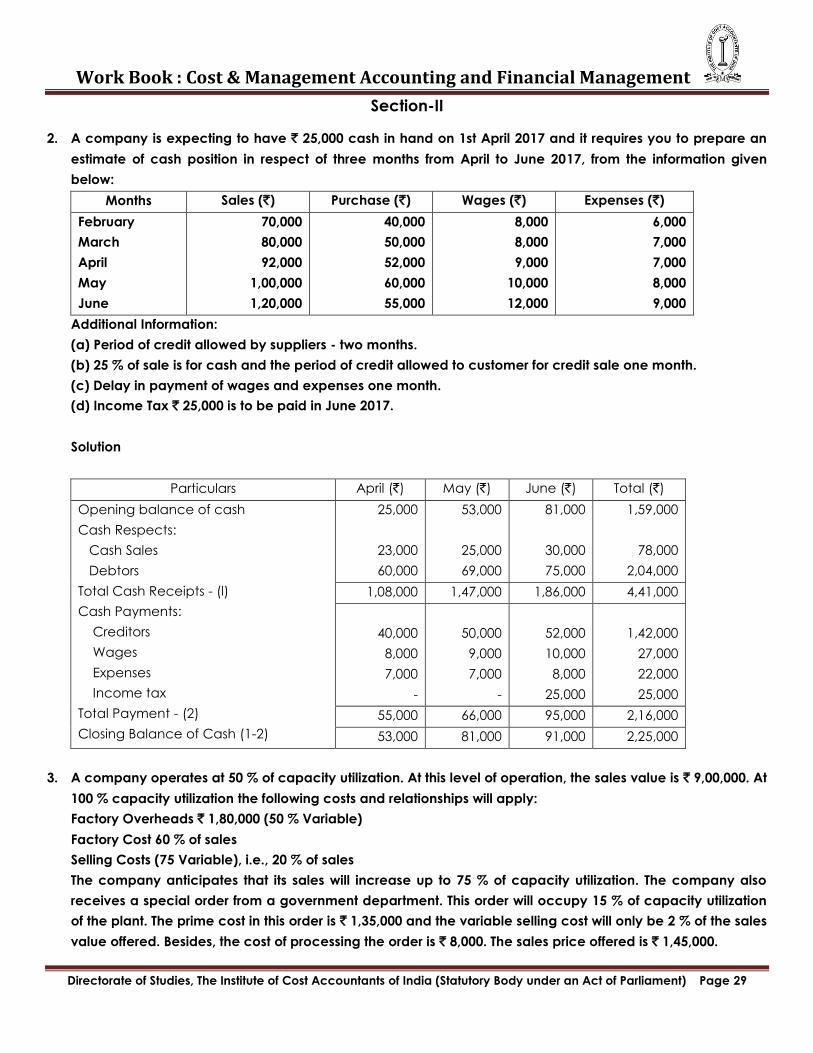
2. A company is expecting to have ` 25,000 cash in hand on 1st April 2017 and it requires you to prepare an
estimate of cash position in respect of three months from April to June 2017, from the information given
below:
Months Sales (`) Purchase (`) Wages (`) Expenses (`)
February
March
April
May
June
70,000
80,000
92,000
1,00,000
1,20,000
40,000
50,000
52,000
60,000
55,000
8,000
8,000
9,000
10,000
12,000
6,000
7,000
7,000
8,000
9,000
Additional Information:
(a) Period of credit allowed by suppliers - two months.
(b) 25 % of sale is for cash and the period of credit allowed to customer for credit sale one month.
(c) Delay in payment of wages and expenses one month.
(d) Income Tax ` 25,000 is to be paid in June 2017.
Solution
Particulars April (`) May (`) June (`) Total (`)
Opening balance of cash
Cash Respects:
Cash Sales
Debtors
Total Cash Receipts - (l)
Cash Payments:
Creditors
Wages
Expenses
Income tax
Total Payment - (2)
Closing Balance of Cash (1-2)
25,000
23,000
60,000
53,000
25,000
69,000
81,000
30,000
75,000
1,59,000
78,000
2,04,000
1,08,000 1,47,000 1,86,000 4,41,000
40,000
8,000
7,000
-
50,000
9,000
7,000
-
52,000
10,000
8,000
25,000
1,42,000
27,000
22,000
25,000
55,000 66,000 95,000 2,16,000
53,000 81,000 91,000 2,25,000
3. A company operates at 50 % of capacity utilization. At this level of operation, the sales value is ` 9,00,000. At
100 % capacity utilization the following costs and relationships will apply:
Factory Overheads ` 1,80,000 (50 % Variable)
Factory Cost 60 % of sales
Selling Costs (75 Variable), i.e., 20 % of sales
The company anticipates that its sales will increase up to 75 % of capacity utilization. The company also
receives a special order from a government department. This order will occupy 15 % of capacity utilization
of the plant. The prime cost in this order is ` 1,35,000 and the variable selling cost will only be 2 % of the sales
value offered. Besides, the cost of processing the order is ` 8,000. The sales price offered is ` 1,45,000.
Work Book : Cost & Management Accounting and Financial Management
Directorate of Studies, The Institute of Cost Accountants of India (Statutory Body under an Act of Parliament) Page 30
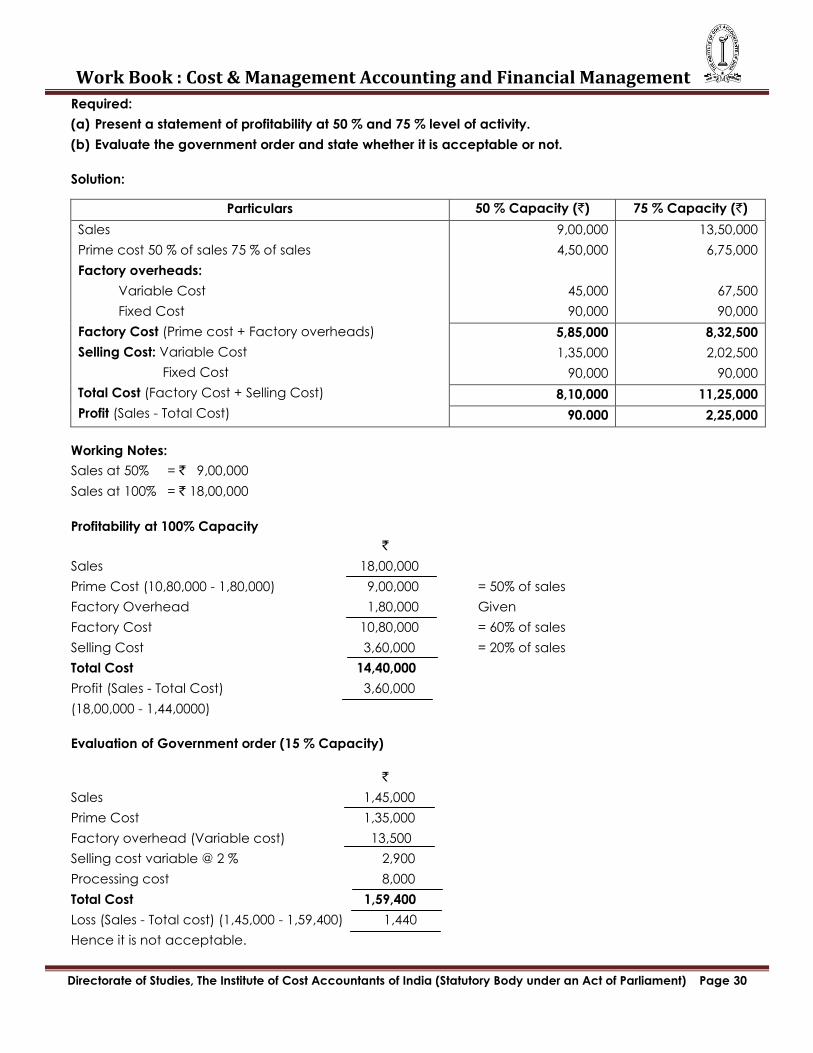
Required:
(a) Present a statement of profitability at 50 % and 75 % level of activity.
(b) Evaluate the government order and state whether it is acceptable or not.
Solution:
Particulars 50 % Capacity (`) 75 % Capacity (`)
Sales
Prime cost 50 % of sales 75 % of sales
Factory overheads:
Variable Cost
Fixed Cost
Factory Cost (Prime cost + Factory overheads)
Selling Cost: Variable Cost
Fixed Cost
Total Cost (Factory Cost + Selling Cost)
Profit (Sales - Total Cost)
9,00,000
4,50,000
45,000
90,000
13,50,000
6,75,000
67,500
90,000
5,85,000
1,35,000
90,000
8,32,500
2,02,500
90,000
8,10,000 11,25,000
90.000 2,25,000
Working Notes:
Sales at 50% = ` 9,00,000
Sales at 100% = ` 18,00,000
Profitability at 100% Capacity
`
Sales 18,00,000
Prime Cost (10,80,000 - 1,80,000) 9,00,000 = 50% of sales
Factory Overhead 1,80,000 Given
Factory Cost 10,80,000 = 60% of sales
Selling Cost 3,60,000 = 20% of sales
Total Cost 14,40,000
Profit (Sales - Total Cost) 3,60,000
(18,00,000 - 1,44,0000)
Evaluation of Government order (15 % Capacity)
`
Sales 1,45,000
Prime Cost 1,35,000
Factory overhead (Variable cost) 13,500
Selling cost variable @ 2 % 2,900
Processing cost 8,000
Total Cost 1,59,400
Loss (Sales - Total cost) (1,45,000 - 1,59,400) 1,440
Hence it is not acceptable.

Work Book : Cost & Management Accounting and Financial Management
Directorate of Studies, The Institute of Cost Accountants of India (Statutory Body under an Act of Parliament) Page 31
4. The budgeted level of activity of a production department of a manufacturing company is 5,000 hours in a
period. But a technical study assumes overhead behaviour mentioned below:
` (‘00) per hr. Total in ` (‗000)
Indirect wages, variable cost
Rent and tax, fixed cost
Consumable supplies, variable
Repairs: up to 2,000 hours
Additional each extra 500 hrs up to 4,000 hrs.
Additional 4,001 to 5,000 hrs.
Additional above 5,000 hrs.
Supervision up to 2,500 hrs
Additional each extra 600 hrs up to 4,900 hrs.
Additional above 4,900 hrs.
Power variable up to 3,600 hrs.
For hrs above 3,600 additional cost
Depreciation up to 5,000 hrs
Above 5,000 hrs
Clearing up to 4,000 hrs.
Above 4,000 hrs.
Lighting 2,100 to 3,500 hrs.
3,501 hrs to 5,000 hrs
Above 5,000 hrs
0.40
-
0.24
-
-
-
-
-
-
-
0.25
0.20
-
-
-
-
-
-
-
-
320
-
100
35
60
70
400
100
150
-
-
650
820
60
80
120
150
175
(a) Prepare fixed budget and a flexible budget at 70%, 85% and 110% of budget level of activity in one
statement.
(b) Calculate a departmental hourly rate of overhead absorption.
Solution:
Particulars Flexible budget Fixed budget
Capacity
Hours
70%
3,500
85%
4,250
110%
5,500
100%
5,000
Indirect wages @ ` 40hr
Rates & taxes consumable
suppliers @ ` 24hr.
Repair
Supervision
Power
Depreciation
` ‗000
140
320
84
(100+35*3) = 205
(400+100*2) =
600
87.5
` ‗000
170
320
102
(100+35*4+60) =
300
(100+100*3) =
700
` ‗000
220
320
132
(100+3584+60+70)
= 370
(400+100*4+150)
= 950
` ‗000
200
320
120
(100+35*4+60) =
300
(400+100*4+150)
= 950
Work Book : Cost & Management Accounting and Financial Management
Directorate of Studies, The Institute of Cost Accountants of India (Statutory Body under an Act of Parliament) Page 32
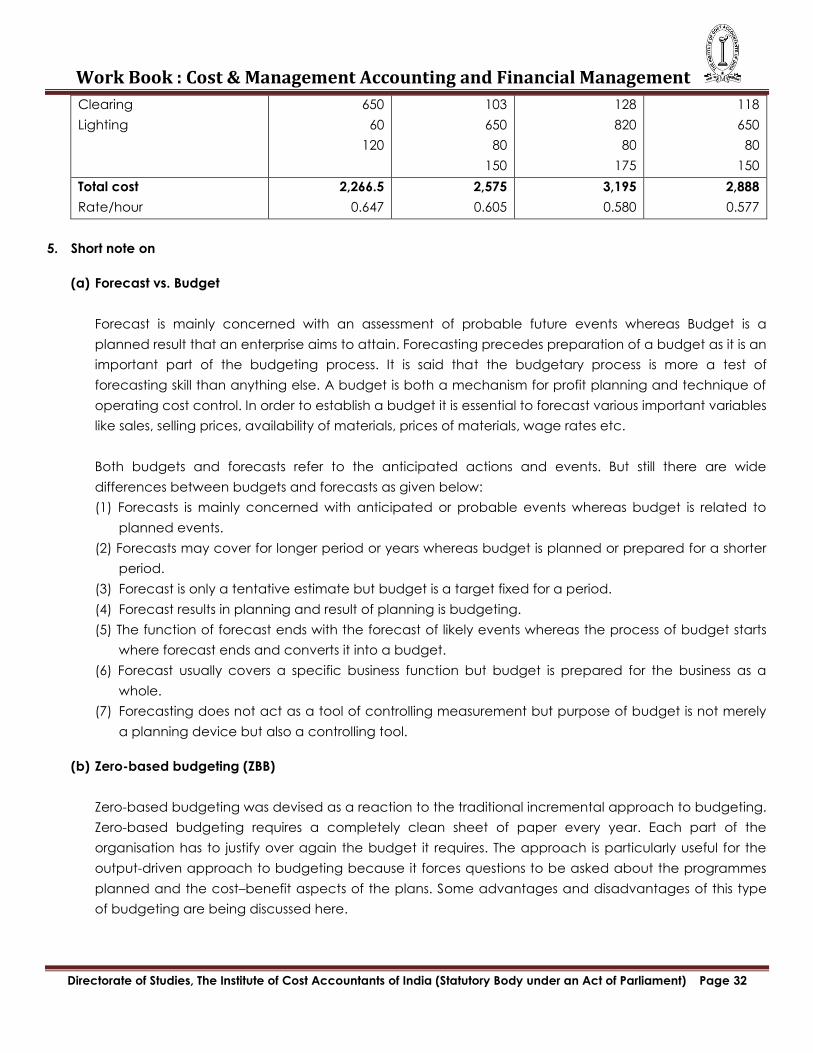
Clearing
Lighting
650
60
120
103
650
80
150
128
820
80
175
118
650
80
150
Total cost
Rate/hour
2,266.5
0.647
2,575
0.605
3,195
0.580
2,888
0.577
5. Short note on
(a) Forecast vs. Budget
Forecast is mainly concerned with an assessment of probable future events whereas Budget is a
planned result that an enterprise aims to attain. Forecasting precedes preparation of a budget as it is an
important part of the budgeting process. It is said that the budgetary process is more a test of
forecasting skill than anything else. A budget is both a mechanism for profit planning and technique of
operating cost control. In order to establish a budget it is essential to forecast various important variables
like sales, selling prices, availability of materials, prices of materials, wage rates etc.
Both budgets and forecasts refer to the anticipated actions and events. But still there are wide
differences between budgets and forecasts as given below:
(1) Forecasts is mainly concerned with anticipated or probable events whereas budget is related to
planned events.
(2) Forecasts may cover for longer period or years whereas budget is planned or prepared for a shorter
period.
(3) Forecast is only a tentative estimate but budget is a target fixed for a period.
(4) Forecast results in planning and result of planning is budgeting.
(5) The function of forecast ends with the forecast of likely events whereas the process of budget starts
where forecast ends and converts it into a budget.
(6) Forecast usually covers a specific business function but budget is prepared for the business as a
whole.
(7) Forecasting does not act as a tool of controlling measurement but purpose of budget is not merely
a planning device but also a controlling tool.
(b) Zero-based budgeting (ZBB)
Zero-based budgeting was devised as a reaction to the traditional incremental approach to budgeting.
Zero-based budgeting requires a completely clean sheet of paper every year. Each part of the
organisation has to justify over again the budget it requires. The approach is particularly useful for the
output-driven approach to budgeting because it forces questions to be asked about the programmes
planned and the cost–benefit aspects of the plans. Some advantages and disadvantages of this type
of budgeting are being discussed here.
Work Book : Cost & Management Accounting and Financial Management
Directorate of Studies, The Institute of Cost Accountants of India (Statutory Body under an Act of Parliament) Page 33
The advantages of zero-based budgeting are:
It encourages management to focus on the goals and objectives of the organisation. It forces
management to consider whether activities continue to be necessary.
It leaves space for new initiatives.
It allows management to set priorities over the activities of the business.
It gives an up-to-date benchmark to be used in evaluating actual outcomes.
The disadvantages of zero-based budgeting are:
It is a time-consuming exercise.
It requires management to apply higher skills in planning.
It diverts managers‘ attention from their primary areas of responsibility.
It could lose the benefit of longer-term comparisons of trends in efficiency and control.
(c) Master Budget
The master budget is the aggregation of all lower-level budgets produced by a company's various
functional areas, and also includes budgeted statements, cash forecast, and a financing plan. The
master budget is typically presented in either a monthly or quarterly format, or usually covers a
company's entire fiscal year. An explanatory text may be included with the master budget, which
explains the company's strategic direction, how the master budget will assist in accomplishing
specific goals, and the management actions needed to achieve the budget. There may also be a
discussion of the headcount changes that are required to achieve the budget.
A master budget is the central planning tool that a management team uses to direct the activities
of a corporation, as well as to judge the performance of its various responsibility centers. It is
customary for the senior management team to review a number of iterations of the master budget
and incorporate modifications until it arrives at a budget that allocates funds to achieve the
desired results. Hopefully, a company uses participative budgeting to arrive at this final budget, but
it may also be imposed on the organization by senior management, with little input from other
employees.

Work Book : Cost & Management Accounting and Financial Management
Directorate of Studies, The Institute of Cost Accountants of India (Statutory Body under an Act of Parliament) Page 34
Study Note – 4
STANDARD COSTING & VARIANCE ANALYSIS
Standard Costing & Variance Analysis
Syllabus: Standard Costing & Variance Analysis
Computation of variances for each of the elements of costs, Sales Variances, Investigation of variances –
Valuation of Stock under Standard Costing - Uniform Costing and Inter-firm comparison.
MCQ Type Questions:
1. Which among the below is the reason behind Material Price Variance:
a) Change in basis purchase price of material.
b) Uneconomical size of purchase order.
c) Payment of excess or less freight.
d) All of the above.
2. In a factory Standard rate per hour ` 4, Standard time per unit of output – 20 hours, Units produced -500,
Actual hours worked-12,000. Compute Labour Efficiency Variance.
a) ` 6000 (Favourable)
b) ` 8000 (Adverse)
c) ` 9,600 (Favourable)
d) ` 8000 (Favourable)
3. MSE Manufacturing gives you the following details.
Standard Price per kg of Material ` 2, Actual Material used 2,000 kg, Actual cost of Material ` 3,000. Actual
output 2,100 kg. Compute Material Price Variance.
a) ` 1050 (Favourable)
b) ` 1142 (Favourable)
c) ` 1000 (Favourable)
d) None of the above
Answer:
1-d;
2-b; (Hints: Labour Efficiency Variance=SR(SH-AH)=4(500×20-12,000)=8,000 (Adverse)
3-c. (Hints: Material Price Variance = (SP-AP)×AQ = (2-3000/2000)2000 = (2 - .5)2000 = 1000 (Favourable)
Work Book : Cost & Management Accounting and Financial Management
Directorate of Studies, The Institute of Cost Accountants of India (Statutory Body under an Act of Parliament) Page 35
Theoretical /Descriptive Questions:
1. Mention the limitations of Uniform Costing. What are the prerequisites of Uniform Costing System?
Limitations of Uniform Costing
a. The various member-units in an industry differ widely with regard to location, age, condition of plant and
degree of mechanism. This difference is sometimes so wide that it does not permit efficient use of
uniform costing system.
b. For smaller units, this system becomes too expensive to operate. The cost incurred in operation of this
system may not commensurate with the benefits derived.
c. Uniform costing system may promote a monopolistic tendency. Thus, it may prove harmful to the
consumers.
d. The standard terminology used in the uniform costing system may not be understood properly by the
member companies. However, this objective can be overcome by introduction of uniform Costing
Manual.
Prerequisites of Uniform Costing System
a. The member of the trade association or Chamber of Commerce should work with a spirit of mutual trust and
cooperation.
b. Member should exchange their ideas freely, without fearing the leakage of secrecy.
c. The well-organized and large scale sector should be prepared to pass on the technological development in
the process or method of production to the other companies who are unable to conduct their own
research and developmental activities.
d. The companies must furnish full and correct information to the Association so that efficiency of the member-
companies can be compared.
e. The member should not work with a sense of rivalry or jealousy.
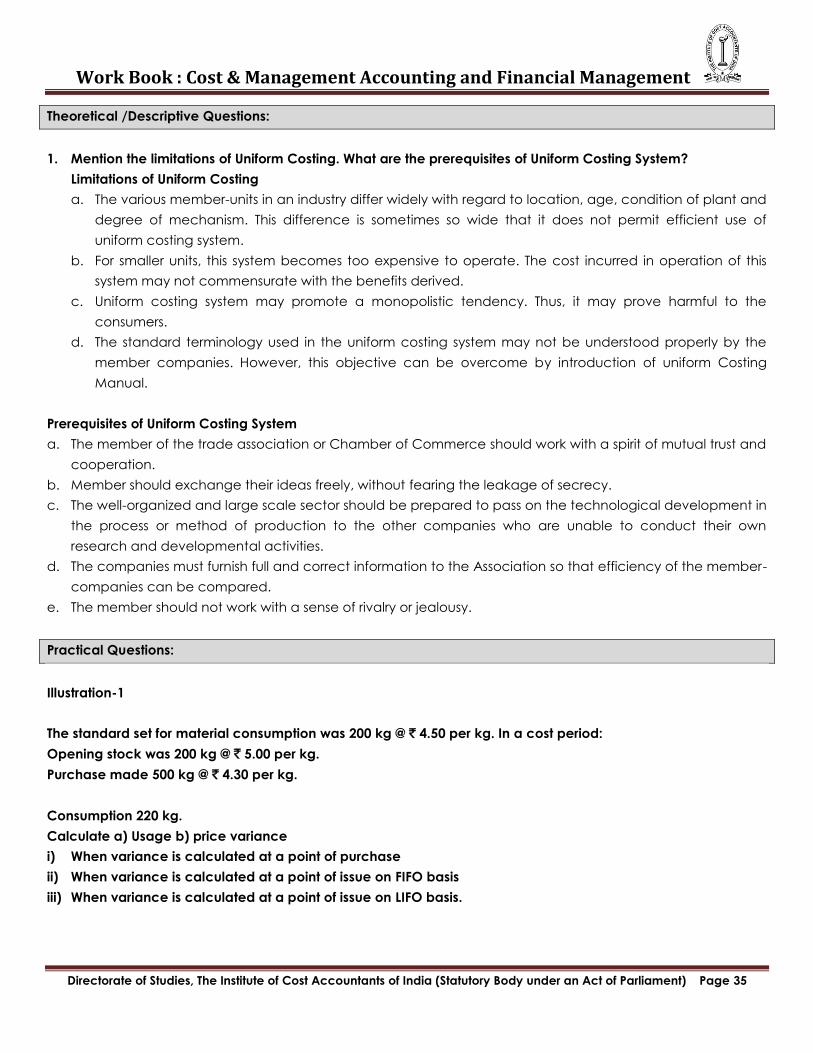
Practical Questions:
Illustration-1
The standard set for material consumption was 200 kg @ ` 4.50 per kg. In a cost period:
Opening stock was 200 kg @ ` 5.00 per kg.
Purchase made 500 kg @ ` 4.30 per kg.
Consumption 220 kg.
Calculate a) Usage b) price variance
i) When variance is calculated at a point of purchase
ii) When variance is calculated at a point of issue on FIFO basis
iii) When variance is calculated at a point of issue on LIFO basis.
Work Book : Cost & Management Accounting and Financial Management
Directorate of Studies, The Institute of Cost Accountants of India (Statutory Body under an Act of Parliament) Page 36
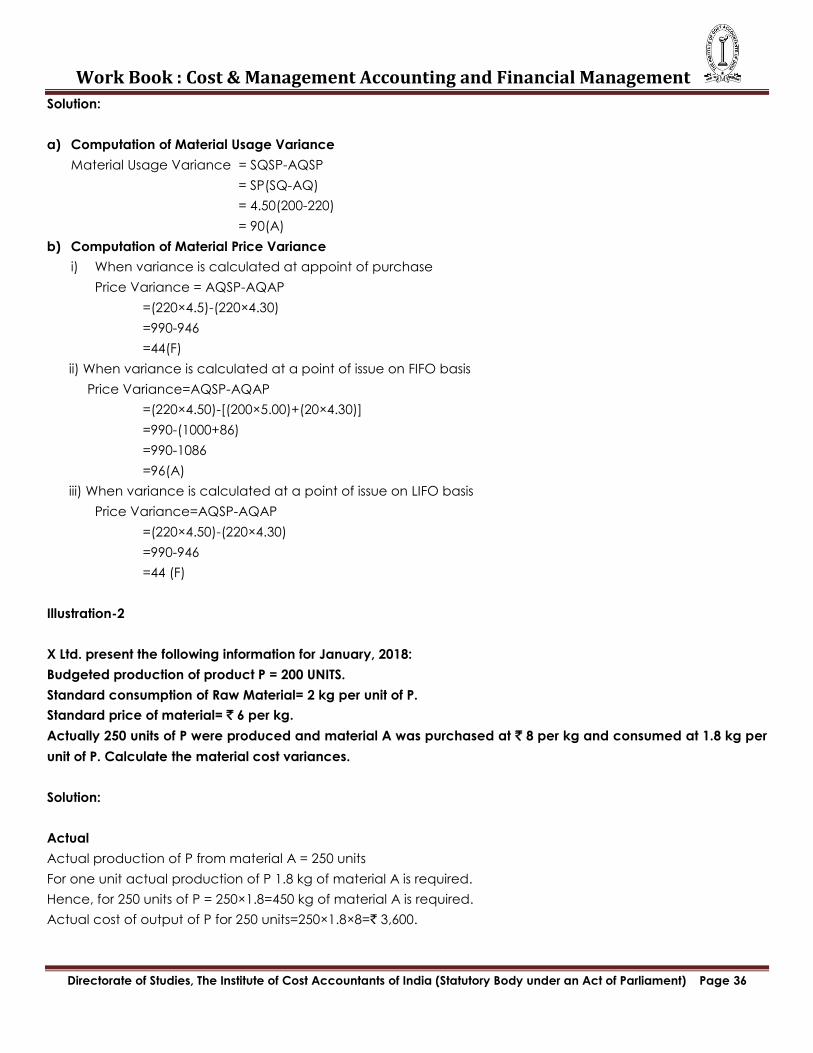
Solution:
a) Computation of Material Usage Variance
Material Usage Variance = SQSP-AQSP
= SP(SQ-AQ)
= 4.50(200-220)
= 90(A)
b) Computation of Material Price Variance
i) When variance is calculated at appoint of purchase
Price Variance = AQSP-AQAP
=(220×4.5)-(220×4.30)
=990-946
=44(F)
ii) When variance is calculated at a point of issue on FIFO basis
Price Variance=AQSP-AQAP
=(220×4.50)-[(200×5.00)+(20×4.30)]
=990-(1000+86)
=990-1086
=96(A)
iii) When variance is calculated at a point of issue on LIFO basis
Price Variance=AQSP-AQAP
=(220×4.50)-(220×4.30)
=990-946
=44 (F)
Illustration-2
X Ltd. present the following information for January, 2018:
Budgeted production of product P = 200 UNITS.
Standard consumption of Raw Material= 2 kg per unit of P.
Standard price of material= ` 6 per kg.
Actually 250 units of P were produced and material A was purchased at ` 8 per kg and consumed at 1.8 kg per
unit of P. Calculate the material cost variances.
Solution:
Actual
Actual production of P from material A = 250 units
For one unit actual production of P 1.8 kg of material A is required.
Hence, for 250 units of P = 250×1.8=450 kg of material A is required.
Actual cost of output of P for 250 units=250×1.8×8=` 3,600.
Work Book : Cost & Management Accounting and Financial Management
Directorate of Studies, The Institute of Cost Accountants of India (Statutory Body under an Act of Parliament) Page 37
Standard
Again, standard consumption of raw material A for one unit of P is 2kg.
So, as per standard rate for production of 250 units of P = 250×2=500 kg of raw material A is required.
Hence, standard cost of production of 250 kg of P = 250×2×6=` 3,000.
Material Cost Variance=Standard Cost-Actual Cost=3000-3600=600(A)
Material Price Variance=(SP-AP)SQ=(6-8)450=900
Material Yield Variance=( SP×SQ)-(SP×SM)=(6×500)-(6×450)=300 (F)
Material Usage Variance=( SP×SQ)-(SP×AQ)=(6×500)-(6×450)=300 (F)
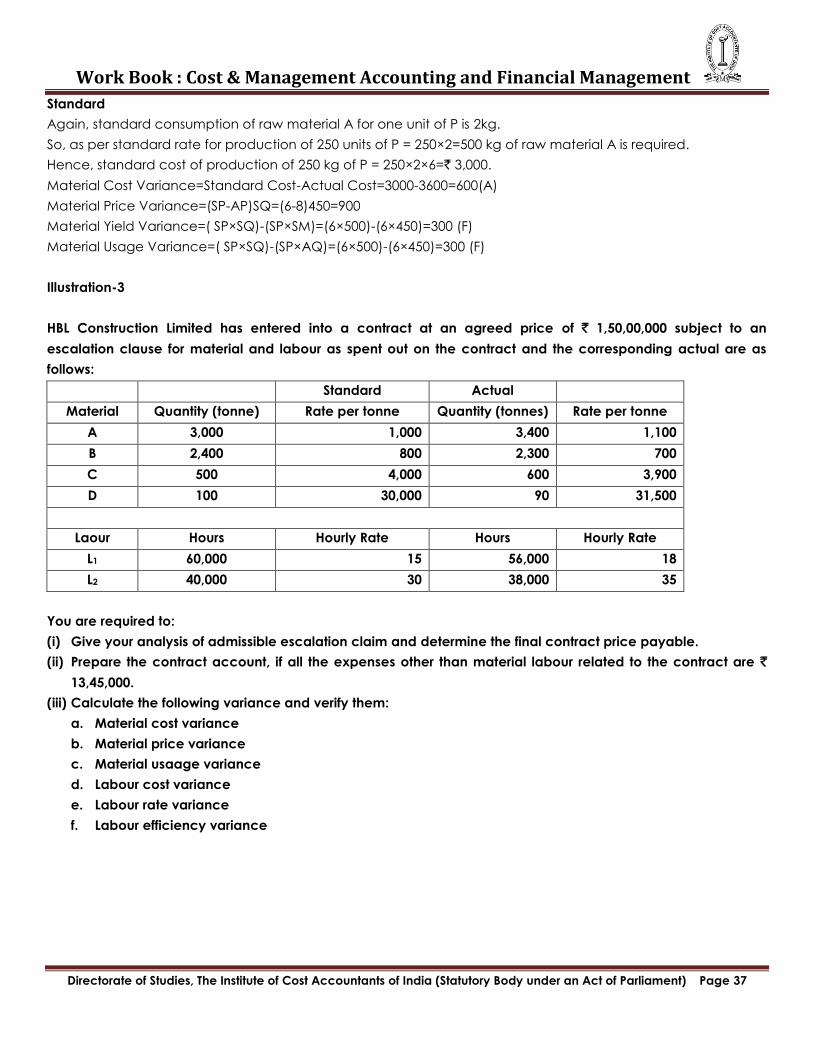
Illustration-3
HBL Construction Limited has entered into a contract at an agreed price of ` 1,50,00,000 subject to an
escalation clause for material and labour as spent out on the contract and the corresponding actual are as
follows:
Standard Actual
Material Quantity (tonne) Rate per tonne Quantity (tonnes) Rate per tonne
A 3,000 1,000 3,400 1,100
B 2,400 800 2,300 700
C 500 4,000 600 3,900
D 100 30,000 90 31,500
Laour Hours Hourly Rate Hours Hourly Rate
L1 60,000 15 56,000 18
L2 40,000 30 38,000 35
You are required to:
(i) Give your analysis of admissible escalation claim and determine the final contract price payable.
(ii) Prepare the contract account, if all the expenses other than material labour related to the contract are `
13,45,000.
(iii) Calculate the following variance and verify them:
a. Material cost variance
b. Material price variance
c. Material usaage variance
d. Labour cost variance
e. Labour rate variance
f. Labour efficiency variance
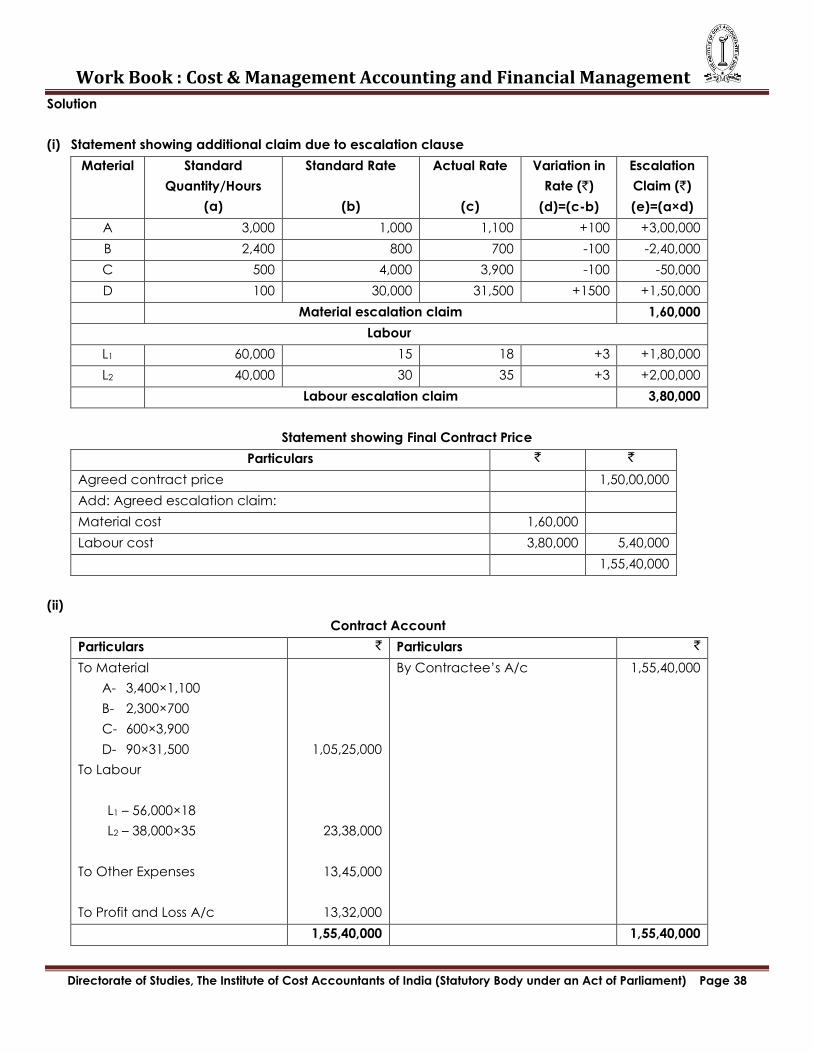
Work Book : Cost & Management Accounting and Financial Management
Directorate of Studies, The Institute of Cost Accountants of India (Statutory Body under an Act of Parliament) Page 38
Solution
(i) Statement showing additional claim due to escalation clause
Material Standard
Quantity/Hours
(a)
Standard Rate
(b)
Actual Rate
(c)
Variation in
Rate (`)
(d)=(c-b)
Escalation
Claim (`)
(e)=(a×d)
A 3,000 1,000 1,100 +100 +3,00,000
B 2,400 800 700 -100 -2,40,000
C 500 4,000 3,900 -100 -50,000
D 100 30,000 31,500 +1500 +1,50,000
Material escalation claim 1,60,000
Labour
L1 60,000 15 18 +3 +1,80,000
L2 40,000 30 35 +3 +2,00,000
Labour escalation claim 3,80,000
Statement showing Final Contract Price
Particulars ` `
Agreed contract price 1,50,00,000
Add: Agreed escalation claim:
Material cost 1,60,000
Labour cost 3,80,000 5,40,000
1,55,40,000
(ii)
Contract Account
Particulars ` Particulars `
To Material
A- 3,400×1,100
B- 2,300×700
C- 600×3,900
D- 90×31,500
To Labour
L1 – 56,000×18
L2 – 38,000×35
To Other Expenses
To Profit and Loss A/c
1,05,25,000
23,38,000
13,45,000
13,32,000
By Contractee‘s A/c 1,55,40,000
1,55,40,000 1,55,40,000
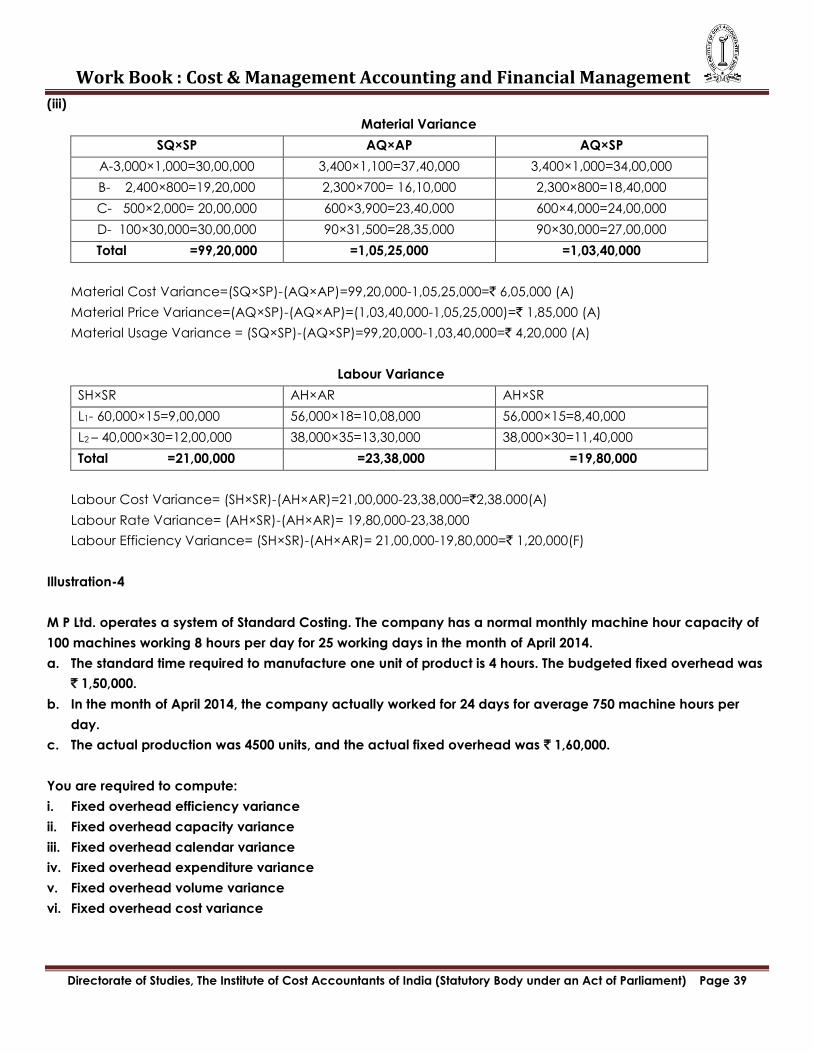
Work Book : Cost & Management Accounting and Financial Management
Directorate of Studies, The Institute of Cost Accountants of India (Statutory Body under an Act of Parliament) Page 39
(iii)
Material Variance
SQ×SP AQ×AP AQ×SP
A-3,000×1,000=30,00,000 3,400×1,100=37,40,000 3,400×1,000=34,00,000
B- 2,400×800=19,20,000 2,300×700= 16,10,000 2,300×800=18,40,000
C- 500×2,000= 20,00,000 600×3,900=23,40,000 600×4,000=24,00,000
D- 100×30,000=30,00,000 90×31,500=28,35,000 90×30,000=27,00,000
Total =99,20,000 =1,05,25,000 =1,03,40,000
Material Cost Variance=(SQ×SP)-(AQ×AP)=99,20,000-1,05,25,000=` 6,05,000 (A)
Material Price Variance=(AQ×SP)-(AQ×AP)=(1,03,40,000-1,05,25,000)=` 1,85,000 (A)
Material Usage Variance = (SQ×SP)-(AQ×SP)=99,20,000-1,03,40,000=` 4,20,000 (A)
Labour Variance
SH×SR AH×AR AH×SR
L1- 60,000×15=9,00,000 56,000×18=10,08,000 56,000×15=8,40,000
L2 – 40,000×30=12,00,000 38,000×35=13,30,000 38,000×30=11,40,000
Total =21,00,000 =23,38,000 =19,80,000
Labour Cost Variance= (SH×SR)-(AH×AR)=21,00,000-23,38,000=`2,38.000(A)
Labour Rate Variance= (AH×SR)-(AH×AR)= 19,80,000-23,38,000
Labour Efficiency Variance= (SH×SR)-(AH×AR)= 21,00,000-19,80,000=` 1,20,000(F)
Illustration-4
M P Ltd. operates a system of Standard Costing. The company has a normal monthly machine hour capacity of
100 machines working 8 hours per day for 25 working days in the month of April 2014.
a. The standard time required to manufacture one unit of product is 4 hours. The budgeted fixed overhead was
` 1,50,000.
b. In the month of April 2014, the company actually worked for 24 days for average 750 machine hours per
day.
c. The actual production was 4500 units, and the actual fixed overhead was ` 1,60,000.
You are required to compute:
i. Fixed overhead efficiency variance
ii. Fixed overhead capacity variance
iii. Fixed overhead calendar variance
iv. Fixed overhead expenditure variance
v. Fixed overhead volume variance
vi. Fixed overhead cost variance
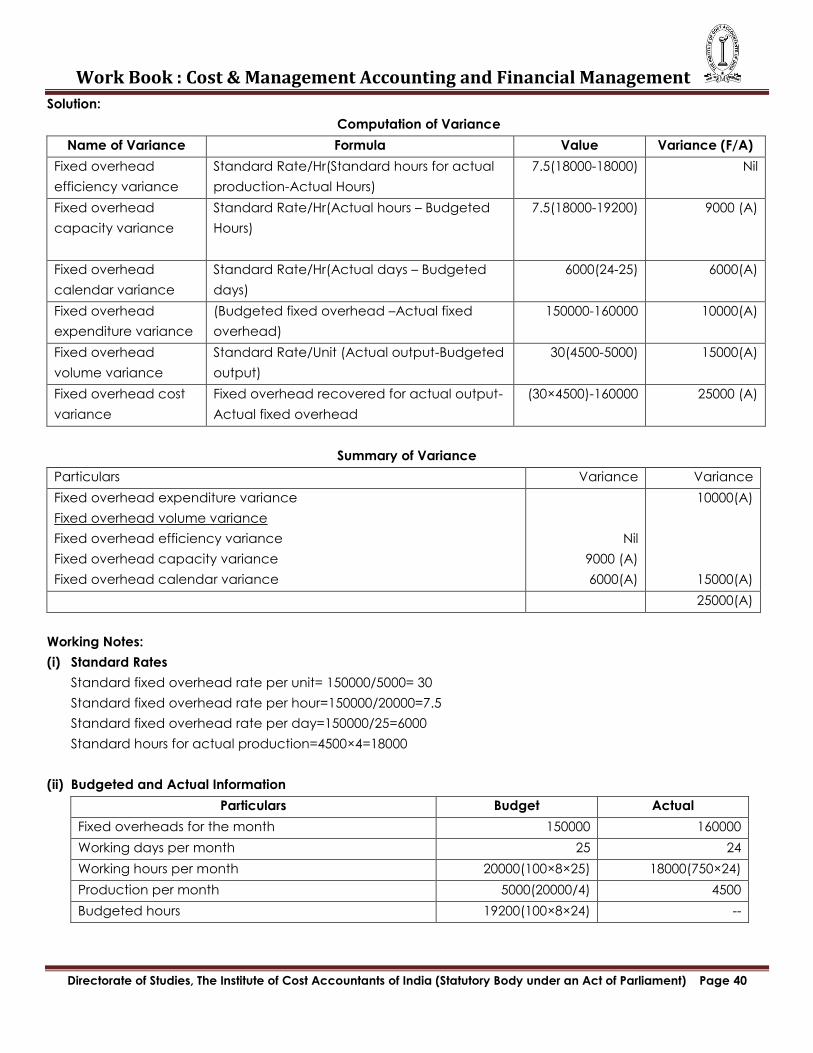
Work Book : Cost & Management Accounting and Financial Management
Directorate of Studies, The Institute of Cost Accountants of India (Statutory Body under an Act of Parliament) Page 40
Solution:
Computation of Variance
Name of Variance Formula Value Variance (F/A)
Fixed overhead
efficiency variance
Standard Rate/Hr(Standard hours for actual
production-Actual Hours)
7.5(18000-18000) Nil
Fixed overhead
capacity variance
Standard Rate/Hr(Actual hours – Budgeted
Hours)
7.5(18000-19200) 9000 (A)
Fixed overhead
calendar variance
Standard Rate/Hr(Actual days – Budgeted
days)
6000(24-25) 6000(A)
Fixed overhead
expenditure variance
(Budgeted fixed overhead –Actual fixed
overhead)
150000-160000 10000(A)
Fixed overhead
volume variance
Standard Rate/Unit (Actual output-Budgeted
output)
30(4500-5000) 15000(A)
Fixed overhead cost
variance
Fixed overhead recovered for actual output-
Actual fixed overhead
(30×4500)-160000 25000 (A)
Summary of Variance
Particulars Variance Variance
Fixed overhead expenditure variance
Fixed overhead volume variance
Fixed overhead efficiency variance
Fixed overhead capacity variance
Fixed overhead calendar variance
Nil
9000 (A)
6000(A)
10000(A)
15000(A)
25000(A)
Working Notes:
(i) Standard Rates
Standard fixed overhead rate per unit= 150000/5000= 30
Standard fixed overhead rate per hour=150000/20000=7.5
Standard fixed overhead rate per day=150000/25=6000
Standard hours for actual production=4500×4=18000
(ii) Budgeted and Actual Information
Particulars Budget Actual
Fixed overheads for the month 150000 160000
Working days per month 25 24
Working hours per month 20000(100×8×25) 18000(750×24)
Production per month 5000(20000/4) 4500
Budgeted hours 19200(100×8×24) --
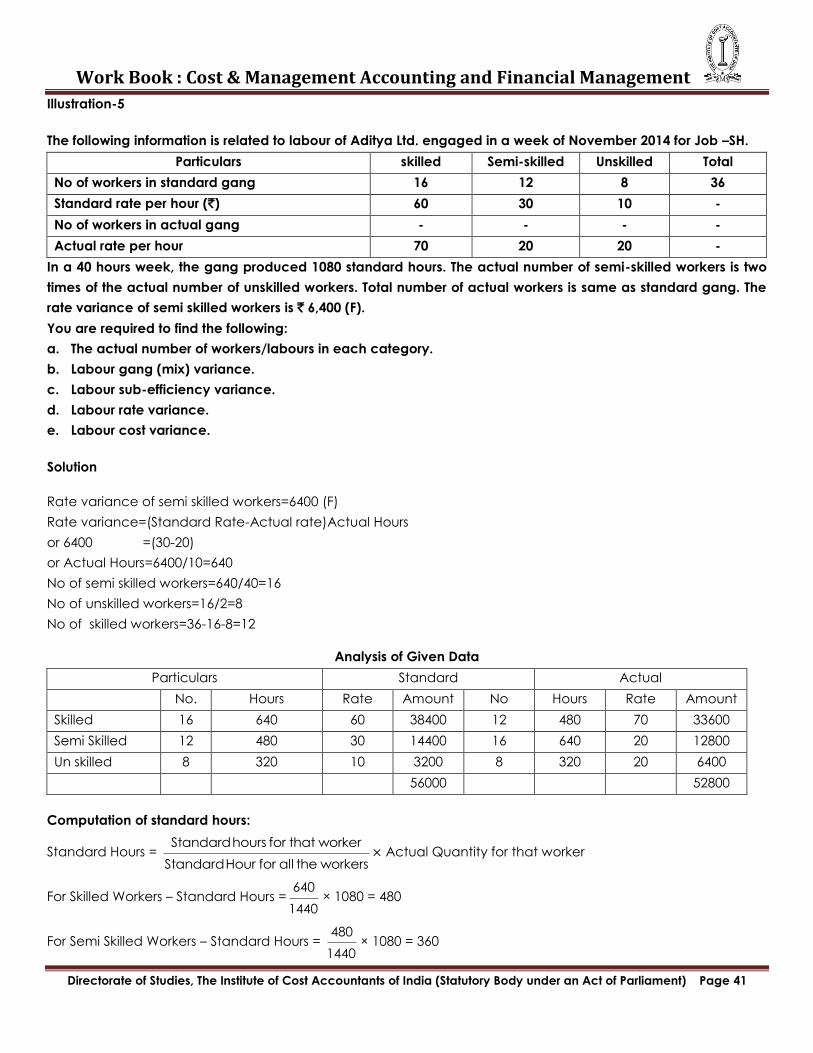
Work Book : Cost & Management Accounting and Financial Management
Directorate of Studies, The Institute of Cost Accountants of India (Statutory Body under an Act of Parliament) Page 41
Illustration-5
The following information is related to labour of Aditya Ltd. engaged in a week of November 2014 for Job –SH.
Particulars skilled Semi-skilled Unskilled Total
No of workers in standard gang 16 12 8 36
Standard rate per hour (`) 60 30 10 -
No of workers in actual gang - - - -
Actual rate per hour 70 20 20 -
In a 40 hours week, the gang produced 1080 standard hours. The actual number of semi-skilled workers is two
times of the actual number of unskilled workers. Total number of actual workers is same as standard gang. The
rate variance of semi skilled workers is ` 6,400 (F).
You are required to find the following:
a. The actual number of workers/labours in each category.
b. Labour gang (mix) variance.
c. Labour sub-efficiency variance.
d. Labour rate variance.
e. Labour cost variance.
Solution
Rate variance of semi skilled workers=6400 (F)
Rate variance=(Standard Rate-Actual rate)Actual Hours
or 6400 =(30-20)
or Actual Hours=6400/10=640
No of semi skilled workers=640/40=16
No of unskilled workers=16/2=8
No of skilled workers=36-16-8=12
Analysis of Given Data
Particulars Standard Actual
No. Hours Rate Amount No Hours Rate Amount
Skilled 16 640 60 38400 12 480 70 33600
Semi Skilled 12 480 30 14400 16 640 20 12800
Un skilled 8 320 10 3200 8 320 20 6400
56000 52800
Computation of standard hours:
Standard Hours = Standard hours for that worker
Standard Hour for all the workers× Actual Quantity for that worker
For Skilled Workers – Standard Hours =640
1440× 1080 = 480
For Semi Skilled Workers – Standard Hours = 480
1440× 1080 = 360
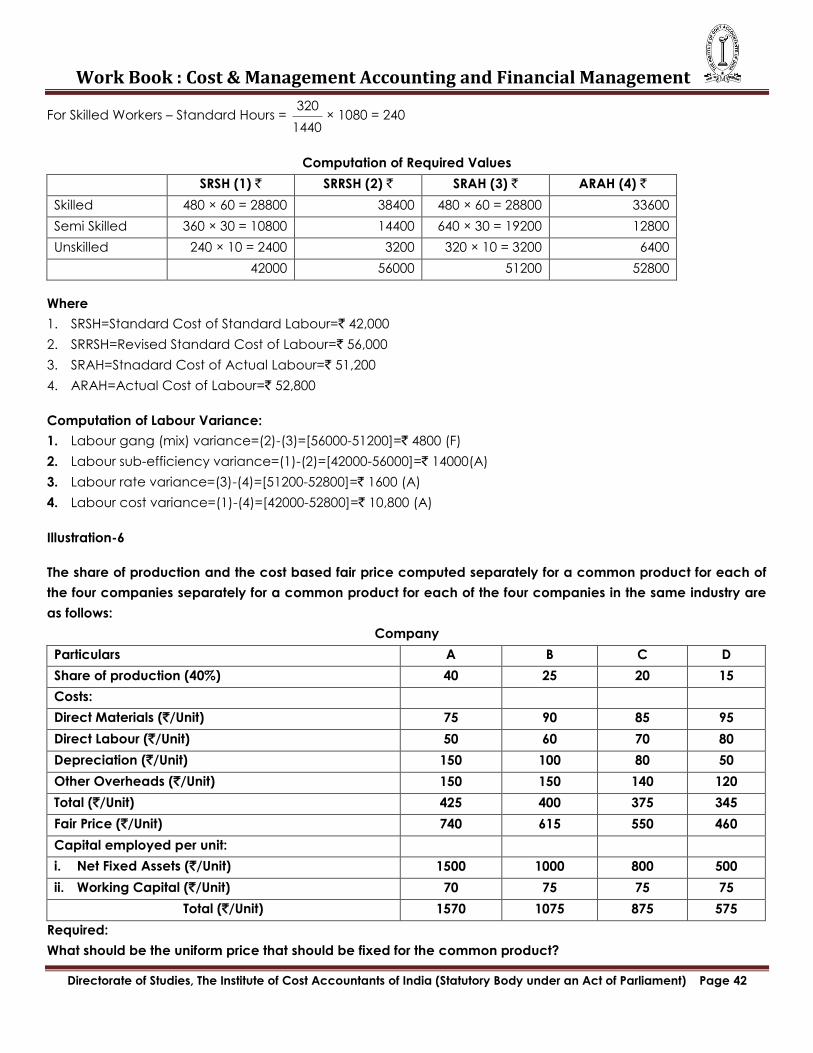
Work Book : Cost & Management Accounting and Financial Management
Directorate of Studies, The Institute of Cost Accountants of India (Statutory Body under an Act of Parliament) Page 42
For Skilled Workers – Standard Hours = 320
1440× 1080 = 240
Computation of Required Values
SRSH (1) ` SRRSH (2) ` SRAH (3) ` ARAH (4) `
Skilled 480 × 60 = 28800 38400 480 × 60 = 28800 33600
Semi Skilled 360 × 30 = 10800 14400 640 × 30 = 19200 12800
Unskilled 240 × 10 = 2400 3200 320 × 10 = 3200 6400
42000 56000 51200 52800
Where
1. SRSH=Standard Cost of Standard Labour=` 42,000
2. SRRSH=Revised Standard Cost of Labour=` 56,000
3. SRAH=Stnadard Cost of Actual Labour=` 51,200
4. ARAH=Actual Cost of Labour=` 52,800
Computation of Labour Variance:
1. Labour gang (mix) variance=(2)-(3)=[56000-51200]=` 4800 (F)
2. Labour sub-efficiency variance=(1)-(2)=[42000-56000]=` 14000(A)
3. Labour rate variance=(3)-(4)=[51200-52800]=` 1600 (A)
4. Labour cost variance=(1)-(4)=[42000-52800]=` 10,800 (A)
Illustration-6
The share of production and the cost based fair price computed separately for a common product for each of
the four companies separately for a common product for each of the four companies in the same industry are
as follows:
Company
Particulars A B C D
Share of production (40%) 40 25 20 15
Costs:
Direct Materials (`/Unit) 75 90 85 95
Direct Labour (`/Unit) 50 60 70 80
Depreciation (`/Unit) 150 100 80 50
Other Overheads (`/Unit) 150 150 140 120
Total (`/Unit) 425 400 375 345
Fair Price (`/Unit) 740 615 550 460
Capital employed per unit:
i. Net Fixed Assets (`/Unit) 1500 1000 800 500
ii. Working Capital (`/Unit) 70 75 75 75
Total (`/Unit) 1570 1075 875 575
Required:
What should be the uniform price that should be fixed for the common product?
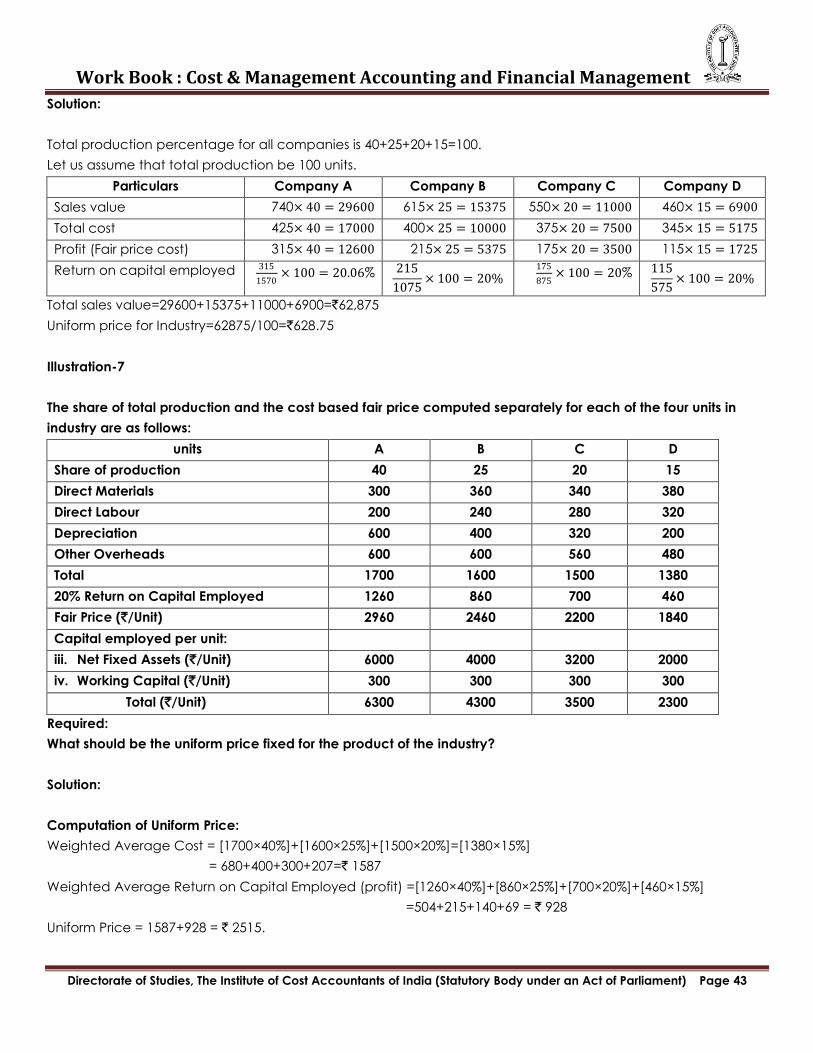
Work Book : Cost & Management Accounting and Financial Management
Directorate of Studies, The Institute of Cost Accountants of India (Statutory Body under an Act of Parliament) Page 43
Solution:
Total production percentage for all companies is 40+25+20+15=100.
Let us assume that total production be 100 units.
Particulars Company A Company B Company C Company D
Sales value 740× 40 = 29600 615× 25 = 15375 550× 20 = 11000 460× 15 = 6900
Total cost 425× 40 = 17000 400× 25 = 10000 375× 20 = 7500 345× 15 = 5175
Profit (Fair price cost) 315× 40 = 12600 215× 25 = 5375 175× 20 = 3500 115× 15 = 1725
Return on capital employed 315
1570× 100 = 20.06% 215
1075× 100 = 20%
175
875× 100 = 20% 115
575× 100 = 20%
Total sales value=29600+15375+11000+6900=`62,875
Uniform price for Industry=62875/100=`628.75
Illustration-7
The share of total production and the cost based fair price computed separately for each of the four units in
industry are as follows:
units A B C D
Share of production 40 25 20 15
Direct Materials 300 360 340 380
Direct Labour 200 240 280 320
Depreciation 600 400 320 200
Other Overheads 600 600 560 480
Total 1700 1600 1500 1380
20% Return on Capital Employed 1260 860 700 460
Fair Price (`/Unit) 2960 2460 2200 1840
Capital employed per unit:
iii. Net Fixed Assets (`/Unit) 6000 4000 3200 2000
iv. Working Capital (`/Unit) 300 300 300 300
Total (`/Unit) 6300 4300 3500 2300
Required:
What should be the uniform price fixed for the product of the industry?
Solution:
Computation of Uniform Price:
Weighted Average Cost = [1700×40%]+[1600×25%]+[1500×20%]=[1380×15%]
= 680+400+300+207=` 1587
Weighted Average Return on Capital Employed (profit) =[1260×40%]+[860×25%]+[700×20%]+[460×15%]
=504+215+140+69 = ` 928
Uniform Price = 1587+928 = ` 2515.
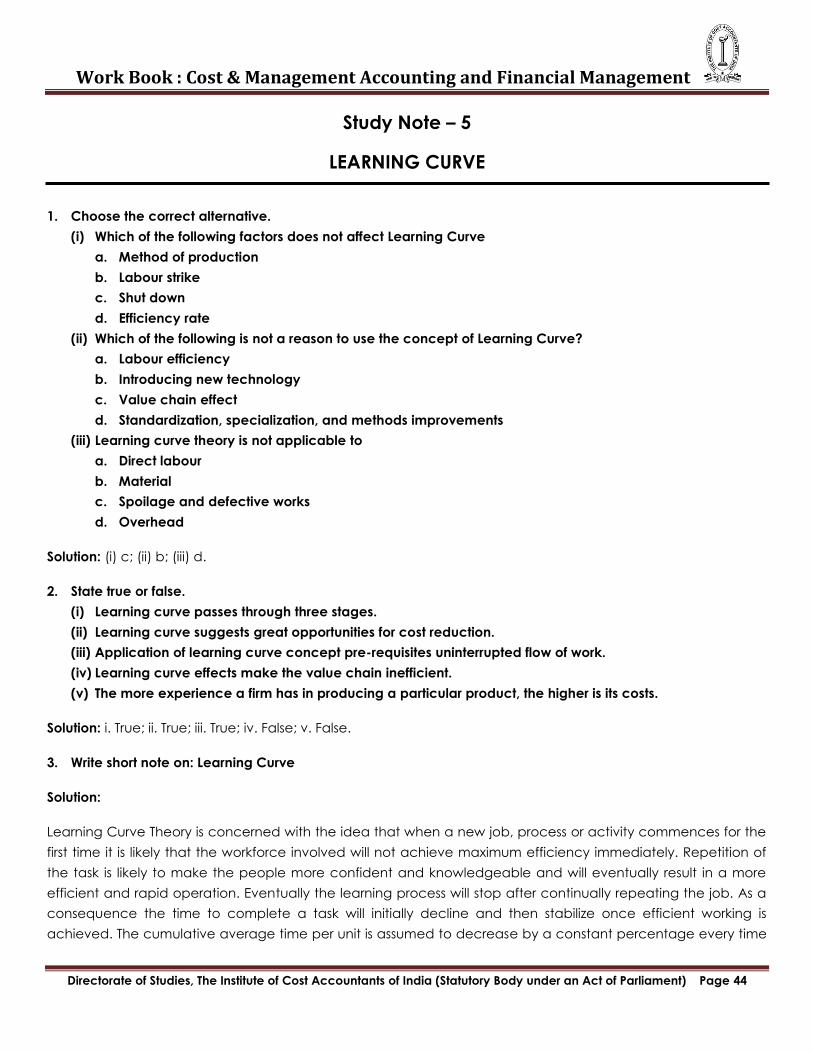
Work Book : Cost & Management Accounting and Financial Management
Directorate of Studies, The Institute of Cost Accountants of India (Statutory Body under an Act of Parliament) Page 44
Study Note – 5
LEARNING CURVE
1. Choose the correct alternative.
(i) Which of the following factors does not affect Learning Curve
a. Method of production
b. Labour strike
c. Shut down
d. Efficiency rate
(ii) Which of the following is not a reason to use the concept of Learning Curve?
a. Labour efficiency
b. Introducing new technology
c. Value chain effect
d. Standardization, specialization, and methods improvements
(iii) Learning curve theory is not applicable to
a. Direct labour
b. Material
c. Spoilage and defective works
d. Overhead
Solution: (i) c; (ii) b; (iii) d.
2. State true or false.
(i) Learning curve passes through three stages.
(ii) Learning curve suggests great opportunities for cost reduction.
(iii) Application of learning curve concept pre-requisites uninterrupted flow of work.
(iv) Learning curve effects make the value chain inefficient.
(v) The more experience a firm has in producing a particular product, the higher is its costs.
Solution: i. True; ii. True; iii. True; iv. False; v. False.
3. Write short note on: Learning Curve
Solution:
Learning Curve Theory is concerned with the idea that when a new job, process or activity commences for the
first time it is likely that the workforce involved will not achieve maximum efficiency immediately. Repetition of
the task is likely to make the people more confident and knowledgeable and will eventually result in a more
efficient and rapid operation. Eventually the learning process will stop after continually repeating the job. As a
consequence the time to complete a task will initially decline and then stabilize once efficient working is
achieved. The cumulative average time per unit is assumed to decrease by a constant percentage every time
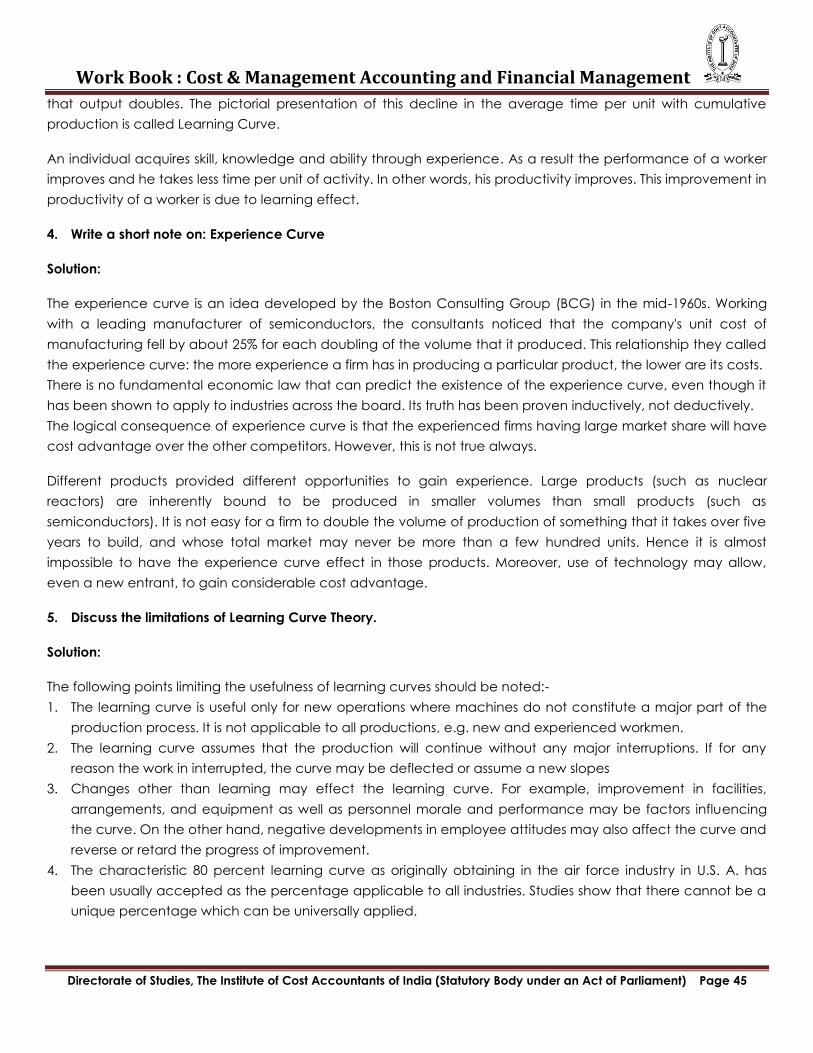
Work Book : Cost & Management Accounting and Financial Management
Directorate of Studies, The Institute of Cost Accountants of India (Statutory Body under an Act of Parliament) Page 45
that output doubles. The pictorial presentation of this decline in the average time per unit with cumulative
production is called Learning Curve.
An individual acquires skill, knowledge and ability through experience. As a result the performance of a worker
improves and he takes less time per unit of activity. In other words, his productivity improves. This improvement in
productivity of a worker is due to learning effect.
4. Write a short note on: Experience Curve
Solution:
The experience curve is an idea developed by the Boston Consulting Group (BCG) in the mid-1960s. Working
with a leading manufacturer of semiconductors, the consultants noticed that the company's unit cost of
manufacturing fell by about 25% for each doubling of the volume that it produced. This relationship they called
the experience curve: the more experience a firm has in producing a particular product, the lower are its costs.
There is no fundamental economic law that can predict the existence of the experience curve, even though it
has been shown to apply to industries across the board. Its truth has been proven inductively, not deductively.
The logical consequence of experience curve is that the experienced firms having large market share will have
cost advantage over the other competitors. However, this is not true always.
Different products provided different opportunities to gain experience. Large products (such as nuclear
reactors) are inherently bound to be produced in smaller volumes than small products (such as
semiconductors). It is not easy for a firm to double the volume of production of something that it takes over five
years to build, and whose total market may never be more than a few hundred units. Hence it is almost
impossible to have the experience curve effect in those products. Moreover, use of technology may allow,
even a new entrant, to gain considerable cost advantage.
5. Discuss the limitations of Learning Curve Theory.
Solution:
The following points limiting the usefulness of learning curves should be noted:-
1. The learning curve is useful only for new operations where machines do not constitute a major part of the
production process. It is not applicable to all productions, e.g. new and experienced workmen.
2. The learning curve assumes that the production will continue without any major interruptions. If for any
reason the work in interrupted, the curve may be deflected or assume a new slopes
3. Changes other than learning may effect the learning curve. For example, improvement in facilities,
arrangements, and equipment as well as personnel morale and performance may be factors influencing
the curve. On the other hand, negative developments in employee attitudes may also affect the curve and
reverse or retard the progress of improvement.
4. The characteristic 80 percent learning curve as originally obtaining in the air force industry in U.S. A. has
been usually accepted as the percentage applicable to all industries. Studies show that there cannot be a
unique percentage which can be universally applied.
Work Book : Cost & Management Accounting and Financial Management
Directorate of Studies, The Institute of Cost Accountants of India (Statutory Body under an Act of Parliament) Page 46
Study Note – 6
INTRODUCTION TO FINANCIAL MANAGEMENT
Part - B
Section - III
1. Answer the following questions:
(a) Choose the correct answer from the given four alternatives. [1x6=6]
(1) Profit Maximization is the main objective of business because:
(a) Profit acts as a measure of efficiency and
(b) It serves as a protection against risk.
(c) Both
(d) none
(2) Stock holder‗s wealth = _________________
(a) No. of shares owned x Current stock price per share
(b) No. of shares owned x Current stock price per share
(c) No. of shares owned x Current stock price per share
(d) none
(3) Working Capital Management refers to a Trade-off between _____________and Profitability.
(a) Liquidity
(b) Risk
(c) Both of the above
(d) None of the above
(4) Which one of the following is a medium term source?
(a) Public Deposits
(b) Lease Financing
(c) Euro Debt Issue
(d) All of the above
(5) The lease period in such a contract is less than the useful life of asset. Here we are talking about
_______.
(a) Operating or Service Lease
(b) Service Lease
(c) Financial Lease
(d) None of the above
Work Book : Cost & Management Accounting and Financial Management
Directorate of Studies, The Institute of Cost Accountants of India (Statutory Body under an Act of Parliament) Page 47
(6) Which one is the Benefit(s) of Factoring?
(a) Better Cash Flows
(b) Better Assets Management
(c) Better Working Capital Management
(d) All of the above
(7) Find the present value of ` 1,000 receivable 6 years hence if the rate of discount is 10 percent.
(a) 564.5
(b) 554.5
(c) 574.5
(d) 600
(8) The term ______________means manipulation of accounts in a way so as to conceal vital facts and
present the financial statements in a way to show a better position than what it actually is.
(a) window dressing
(b) creative accounting
(c) window accounting
(d) modified accounting
(9) Collateralized borrowing and lending obligation (CBLO) is a discounted instrument available in
electronic book entry for the maturity period ranging from ______________.
(a) 1 day to 19 days
(b) 1 day to 15 days
(c) 1 day to 30 days
(d) None of the above
(10) IPO refers to _________________; the first time a company comes to public to raise money.
(a) Immediate Public Offer
(b) Immediate Public Offering
(c) Initial Public Offer
(d) Initial Public Offering
(11) SPO refers to _________________, the second and subsequent time a company raises money from the
public directly.
(a) Second Public Offering
(b) Subsequent Public Offering
(c) Subsequent Public Offer
(d) Seasonal Public Offering
(12) Liquid Liability = Current Liability – Bank Overdraft – _______________
(a) Cash Credit
(b) Trade Credit
(c) Both of the above
(d) None of the above
Ans: 1-c; 2-a; 3-c; 4-d; 5-a; 6-d; 7-a; 8-a; 9-a; 10-d; 11-d; 12-a.
Work Book : Cost & Management Accounting and Financial Management
Directorate of Studies, The Institute of Cost Accountants of India (Statutory Body under an Act of Parliament) Page 48
(b) Match the statement in Column I with the most appropriate statement in column II:
Column I Column II
1. It represents the ownership interest in the company. a. Debenture
2. is also owner‗s capital but has a maturity period. b. Venture Capital
3. issued keeping in view the need and cash flow profile of the
company as well as the investor.
c. Equity Share Capital
4. is a form of equity financing especially designed for funding
high risk and high reward projects.
d. Preference Share Capital
Ans: 1-c; 2-d; 3-a; 4-b
(c) State whether the following statements are True or False [1x4=4]
1. There is a conflict between profitability and liquidity of a firm.
2. The Finance Manager has to bring a trade-off between risk and return by maintaining a proper
balance between debt capital and equity share capital.
3. The earlier objective of profit maximization is now replaced by wealth maximization.
4. The modern approach to the Financial Management is concerned with only the solution of a
problem - financing of a business enterprise.
5. The investment decision is concerned with the selection of assets.
6. One of the most important functions of the Finance Manager is to ensure availability of adequate
financing.
Ans.: 1-T; 2-T; 3-T; 4-F; 5-T; 6-T
Section IV
Short note on
(a) Time Value of Money
Time value of money refers to the value of one unit of money in different time periods. In other words, the
value of the money which is changed with the change in time is called Time Value of Money. If an
individual is offered an alternative either to accept ` 1000 at present or one year later, he would prefer `
1000 at present. The basic reason of his choice of receiving ` 1000 at present is the time value of money
which means the value of the money is changed with the change in time. For this change of value, one
rupee of today is more valuable than one rupee of tomorrow, because of the following reasons;
(a) Investment opportunities
(b) Uncertainty
(c) Inflation
The present value of certain sum of money is more valuable than future value of the same amount. In other
words, the future value of certain sum of money is less than the present value of the same amount.
Time value of money refers to the value of one unit of money in different time periods. In other words, the
value of the money which is changed with the present changing of times, is called time Value of Money.
The significance of time value of money is mentioned below:
Work Book : Cost & Management Accounting and Financial Management
Directorate of Studies, The Institute of Cost Accountants of India (Statutory Body under an Act of Parliament) Page 49
(a) Existence of interest
(b) Decision-making
(c) Invention of compounding and discounting techniques
(d) Making productive to the capital
(e) Time preference for money
(b) Wealth Maximization
Wealth maximization is a modern approach of the financial management where we consider the concept
of time value of money. According to this criterion, the financial activities of a firm are conducted in such a
way so that the net wealth of the firm is maximum. Wealth Maximization is considered as the appropriate
objective of an enterprise. When the firms maximizes the stock holder‗s wealth, the individual stockholder
can use this wealth to maximize his individual utility. Wealth Maximization is the single substitute for a stock
holder‗s utility.
The wealth maximization criterion is more acceptable in case of taking investment decisions in financial
management because (1) In wealth maximization criterion, wealth refers to the net present value. So
wealth maximization refers to the maximization of net present value of a project. (2) It is considered in
wealth maximization criterion as income streams of the entire life of a project are discounted is such a case.
(3) Under this approach, the aspects of risk and uncertainty are considered.
A Stock holder‗s wealth may be calculated by the following way:
Stock holder‗s wealth = No. of shares owned x Current stock price per share Higher the stock
price per share, the greater will be the stock holder‗s wealth.
(c) Hire Purchase System
Hire Purchase System is a special system of purchase and sale. When goods are purchased on hire-
purchase system, purchaser pays the price in instalments. These installments may be Monthly, Quarterly or
Yearly. Goods are delivered to the purchaser at the time of Hire Purchase Agreement but purchaser will
become the owner of goods only on the payment of last installment. All the installments paid are treated
as hire charges till the last installment is paid off.
―Under the Hire-purchase system, goods are delivered to a person who agrees to pay the owner by equal
periodical installments, such installments are to be treated as hire of these goods until a certain fixed
amount has been paid, when these goods become the property of the hire.‖ However, Some of the
characteristics of Hire Purchase System are mentioned below:
1. Goods are delivered by the seller to the buyer.
2. Buyer agrees to pay hire purchase price (i.e., cash price + interest) in
3. Installments paid are treated as hire charges till the payment of the last installment.
4. After the payment of the last installment, ownership is transferred in the name of the buyer.
5. In the case of default, in the payment by the buyer, the seller has got a right to repossess the goods,
as ownership lies with the seller, till the payment of last installment.
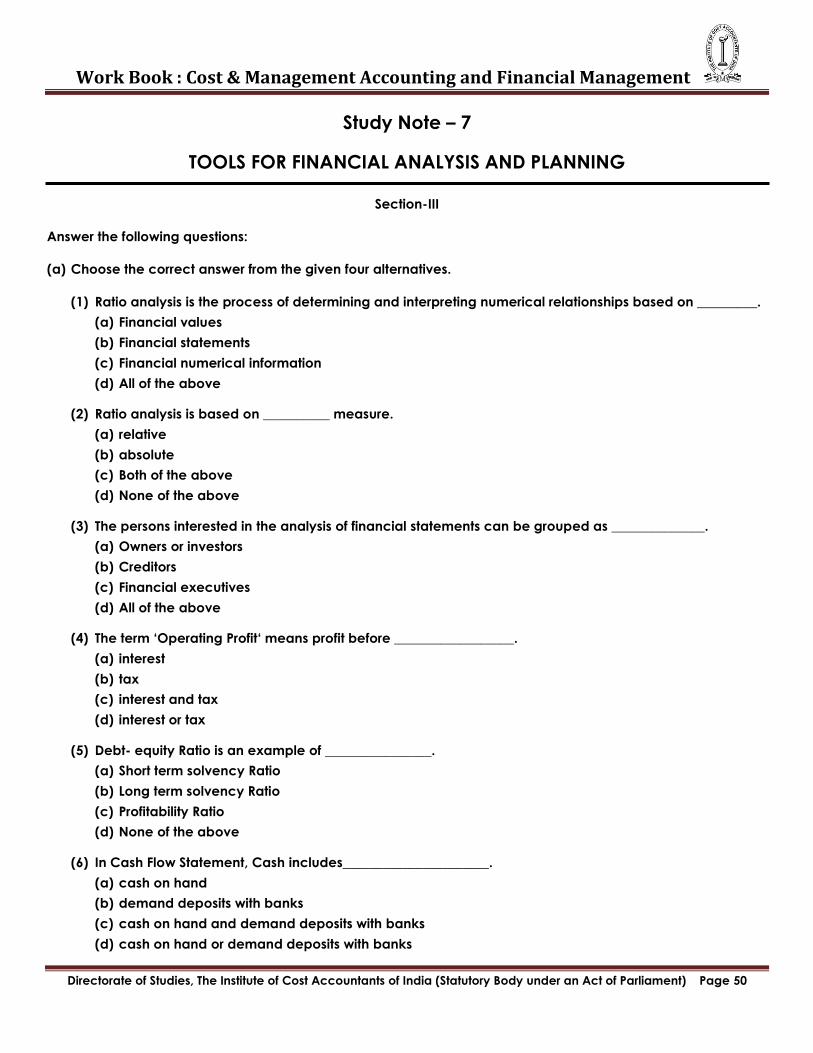
Work Book : Cost & Management Accounting and Financial Management
Directorate of Studies, The Institute of Cost Accountants of India (Statutory Body under an Act of Parliament) Page 50
Study Note – 7
TOOLS FOR FINANCIAL ANALYSIS AND PLANNING
Section-III
Answer the following questions:
(a) Choose the correct answer from the given four alternatives.
(1) Ratio analysis is the process of determining and interpreting numerical relationships based on _________.
(a) Financial values
(b) Financial statements
(c) Financial numerical information
(d) All of the above
(2) Ratio analysis is based on __________ measure.
(a) relative
(b) absolute
(c) Both of the above
(d) None of the above
(3) The persons interested in the analysis of financial statements can be grouped as ______________.
(a) Owners or investors
(b) Creditors
(c) Financial executives
(d) All of the above
(4) The term ‗Operating Profit‗ means profit before __________________.
(a) interest
(b) tax
(c) interest and tax
(d) interest or tax
(5) Debt- equity Ratio is an example of ________________.
(a) Short term solvency Ratio
(b) Long term solvency Ratio
(c) Profitability Ratio
(d) None of the above
(6) In Cash Flow Statement, Cash includes______________________.
(a) cash on hand
(b) demand deposits with banks
(c) cash on hand and demand deposits with banks
(d) cash on hand or demand deposits with banks
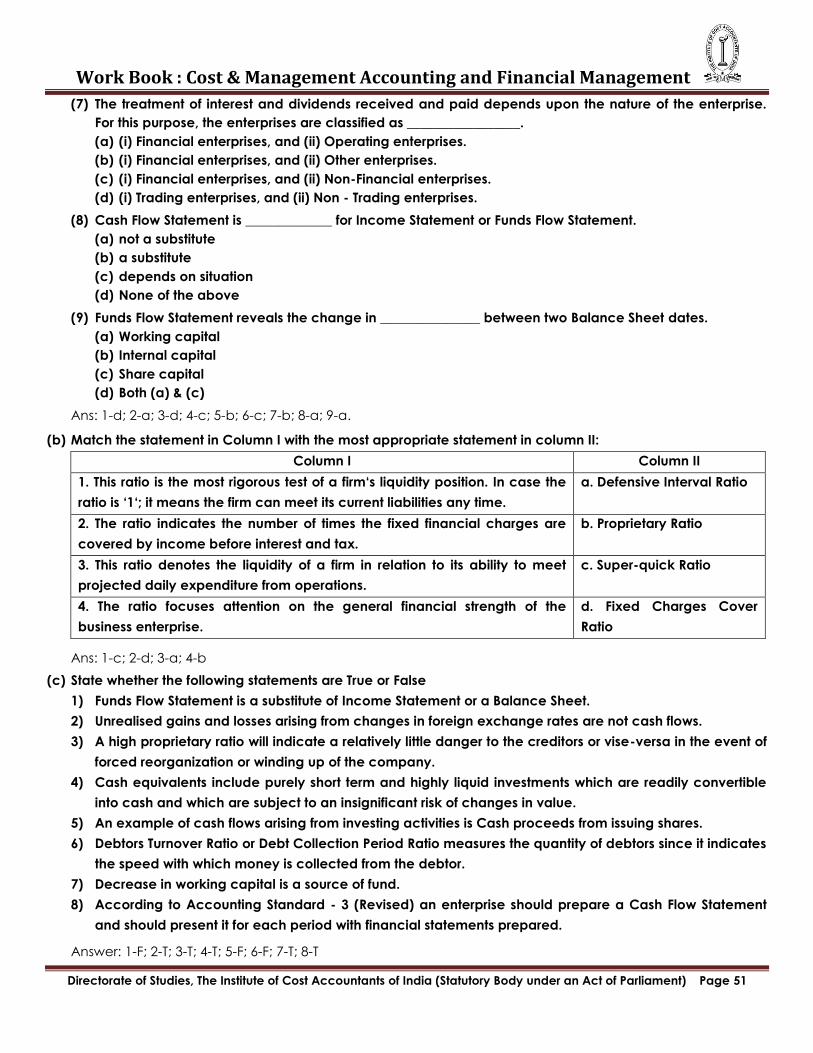
Work Book : Cost & Management Accounting and Financial Management
Directorate of Studies, The Institute of Cost Accountants of India (Statutory Body under an Act of Parliament) Page 51
(7) The treatment of interest and dividends received and paid depends upon the nature of the enterprise.
For this purpose, the enterprises are classified as _________________.
(a) (i) Financial enterprises, and (ii) Operating enterprises.
(b) (i) Financial enterprises, and (ii) Other enterprises.
(c) (i) Financial enterprises, and (ii) Non-Financial enterprises.
(d) (i) Trading enterprises, and (ii) Non - Trading enterprises.
(8) Cash Flow Statement is _____________ for Income Statement or Funds Flow Statement.
(a) not a substitute
(b) a substitute
(c) depends on situation
(d) None of the above
(9) Funds Flow Statement reveals the change in _______________ between two Balance Sheet dates.
(a) Working capital
(b) Internal capital
(c) Share capital
(d) Both (a) & (c)
Ans: 1-d; 2-a; 3-d; 4-c; 5-b; 6-c; 7-b; 8-a; 9-a.
(b) Match the statement in Column I with the most appropriate statement in column II:
Column I Column II
1. This ratio is the most rigorous test of a firm‗s liquidity position. In case the
ratio is ‗1‗; it means the firm can meet its current liabilities any time.
a. Defensive Interval Ratio
2. The ratio indicates the number of times the fixed financial charges are
covered by income before interest and tax.
b. Proprietary Ratio
3. This ratio denotes the liquidity of a firm in relation to its ability to meet
projected daily expenditure from operations.
c. Super-quick Ratio
4. The ratio focuses attention on the general financial strength of the
business enterprise.
d. Fixed Charges Cover
Ratio
Ans: 1-c; 2-d; 3-a; 4-b
(c) State whether the following statements are True or False
1) Funds Flow Statement is a substitute of Income Statement or a Balance Sheet.
2) Unrealised gains and losses arising from changes in foreign exchange rates are not cash flows.
3) A high proprietary ratio will indicate a relatively little danger to the creditors or vise-versa in the event of
forced reorganization or winding up of the company.
4) Cash equivalents include purely short term and highly liquid investments which are readily convertible
into cash and which are subject to an insignificant risk of changes in value.
5) An example of cash flows arising from investing activities is Cash proceeds from issuing shares.
6) Debtors Turnover Ratio or Debt Collection Period Ratio measures the quantity of debtors since it indicates
the speed with which money is collected from the debtor.
7) Decrease in working capital is a source of fund.
8) According to Accounting Standard - 3 (Revised) an enterprise should prepare a Cash Flow Statement
and should present it for each period with financial statements prepared.
Answer: 1-F; 2-T; 3-T; 4-T; 5-F; 6-F; 7-T; 8-T
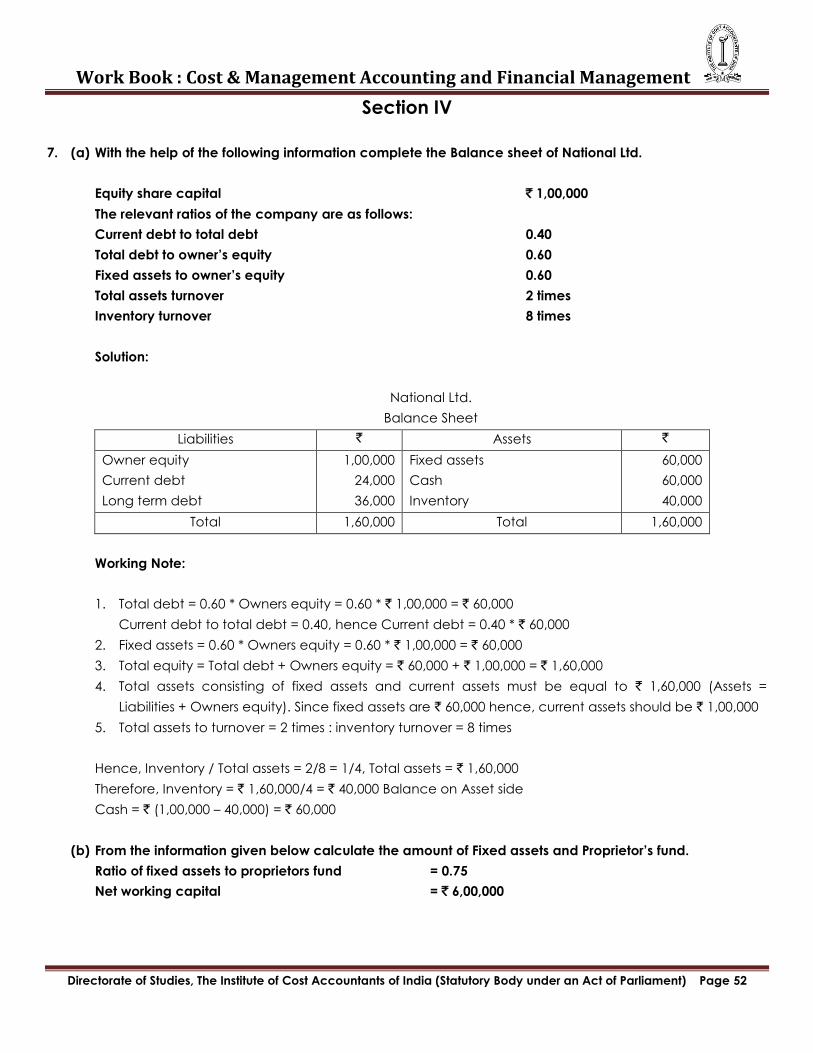
Work Book : Cost & Management Accounting and Financial Management
Directorate of Studies, The Institute of Cost Accountants of India (Statutory Body under an Act of Parliament) Page 52
Section IV
7. (a) With the help of the following information complete the Balance sheet of National Ltd.
Equity share capital ` 1,00,000
The relevant ratios of the company are as follows:
Current debt to total debt 0.40
Total debt to owner‘s equity 0.60
Fixed assets to owner‘s equity 0.60
Total assets turnover 2 times
Inventory turnover 8 times
Solution:
National Ltd.
Balance Sheet
Liabilities ` Assets `
Owner equity
Current debt
Long term debt
1,00,000
24,000
36,000
Fixed assets
Cash
Inventory
60,000
60,000
40,000
Total 1,60,000 Total 1,60,000
Working Note:
1. Total debt = 0.60 * Owners equity = 0.60 * ` 1,00,000 = ` 60,000
Current debt to total debt = 0.40, hence Current debt = 0.40 * ` 60,000
2. Fixed assets = 0.60 * Owners equity = 0.60 * ` 1,00,000 = ` 60,000
3. Total equity = Total debt + Owners equity = ` 60,000 + ` 1,00,000 = ` 1,60,000
4. Total assets consisting of fixed assets and current assets must be equal to ` 1,60,000 (Assets =
Liabilities + Owners equity). Since fixed assets are ` 60,000 hence, current assets should be ` 1,00,000
5. Total assets to turnover = 2 times : inventory turnover = 8 times
Hence, Inventory / Total assets = 2/8 = 1/4, Total assets = ` 1,60,000
Therefore, Inventory = ` 1,60,000/4 = ` 40,000 Balance on Asset side
Cash = ` (1,00,000 – 40,000) = ` 60,000
(b) From the information given below calculate the amount of Fixed assets and Proprietor‘s fund.
Ratio of fixed assets to proprietors fund = 0.75
Net working capital = ` 6,00,000
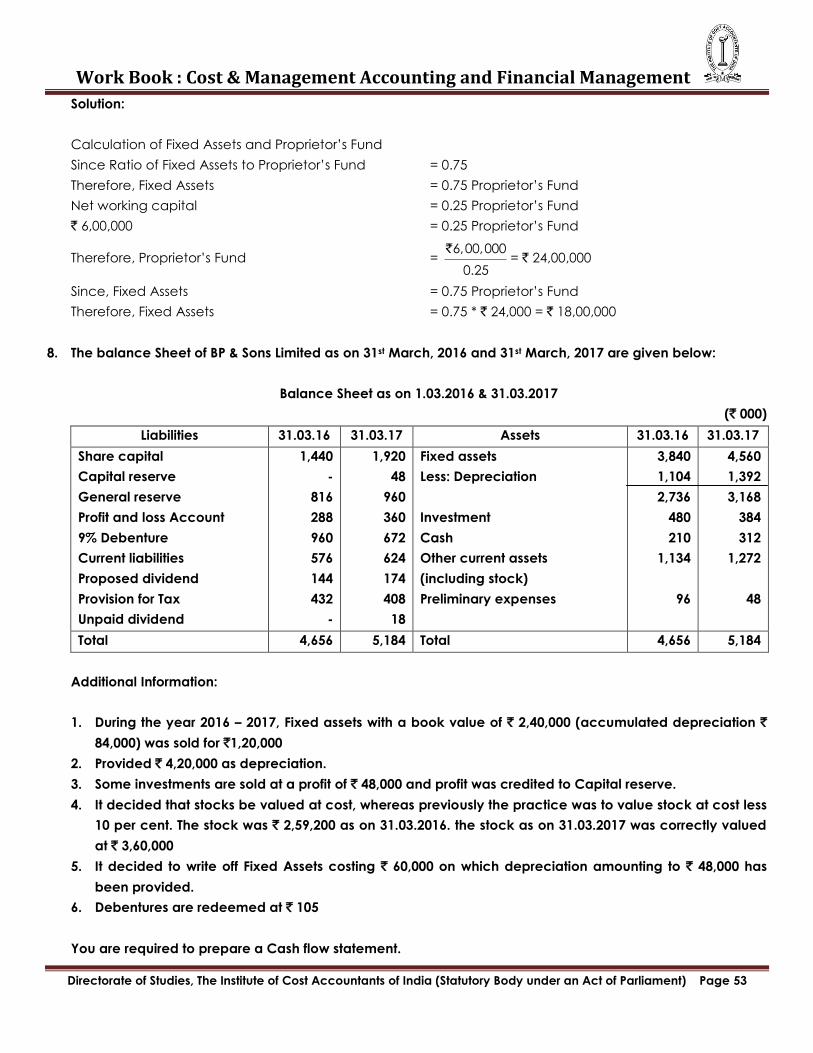
Work Book : Cost & Management Accounting and Financial Management
Directorate of Studies, The Institute of Cost Accountants of India (Statutory Body under an Act of Parliament) Page 53
Solution:
Calculation of Fixed Assets and Proprietor‘s Fund
Since Ratio of Fixed Assets to Proprietor‘s Fund = 0.75
Therefore, Fixed Assets = 0.75 Proprietor‘s Fund
Net working capital = 0.25 Proprietor‘s Fund
` 6,00,000 = 0.25 Proprietor‘s Fund
Therefore, Proprietor‘s Fund = 6,00,000
0.25
`= ` 24,00,000
Since, Fixed Assets = 0.75 Proprietor‘s Fund
Therefore, Fixed Assets = 0.75 * ` 24,000 = ` 18,00,000
8. The balance Sheet of BP & Sons Limited as on 31st March, 2016 and 31st March, 2017 are given below:
Balance Sheet as on 1.03.2016 & 31.03.2017
(` 000)
Liabilities 31.03.16 31.03.17 Assets 31.03.16 31.03.17
Share capital
Capital reserve
General reserve
Profit and loss Account
9% Debenture
Current liabilities
Proposed dividend
Provision for Tax
Unpaid dividend
1,440
-
816
288
960
576
144
432
-
1,920
48
960
360
672
624
174
408
18
Fixed assets
Less: Depreciation
Investment
Cash
Other current assets
(including stock)
Preliminary expenses
3,840
1,104
2,736
480
210
1,134
96
4,560
1,392
3,168
384
312
1,272
48
Total 4,656 5,184 Total 4,656 5,184
Additional Information:
1. During the year 2016 – 2017, Fixed assets with a book value of ` 2,40,000 (accumulated depreciation `
84,000) was sold for `1,20,000
2. Provided ` 4,20,000 as depreciation.
3. Some investments are sold at a profit of ` 48,000 and profit was credited to Capital reserve.
4. It decided that stocks be valued at cost, whereas previously the practice was to value stock at cost less
10 per cent. The stock was ` 2,59,200 as on 31.03.2016. the stock as on 31.03.2017 was correctly valued
at ` 3,60,000
5. It decided to write off Fixed Assets costing ` 60,000 on which depreciation amounting to ` 48,000 has
been provided.
6. Debentures are redeemed at ` 105
You are required to prepare a Cash flow statement.
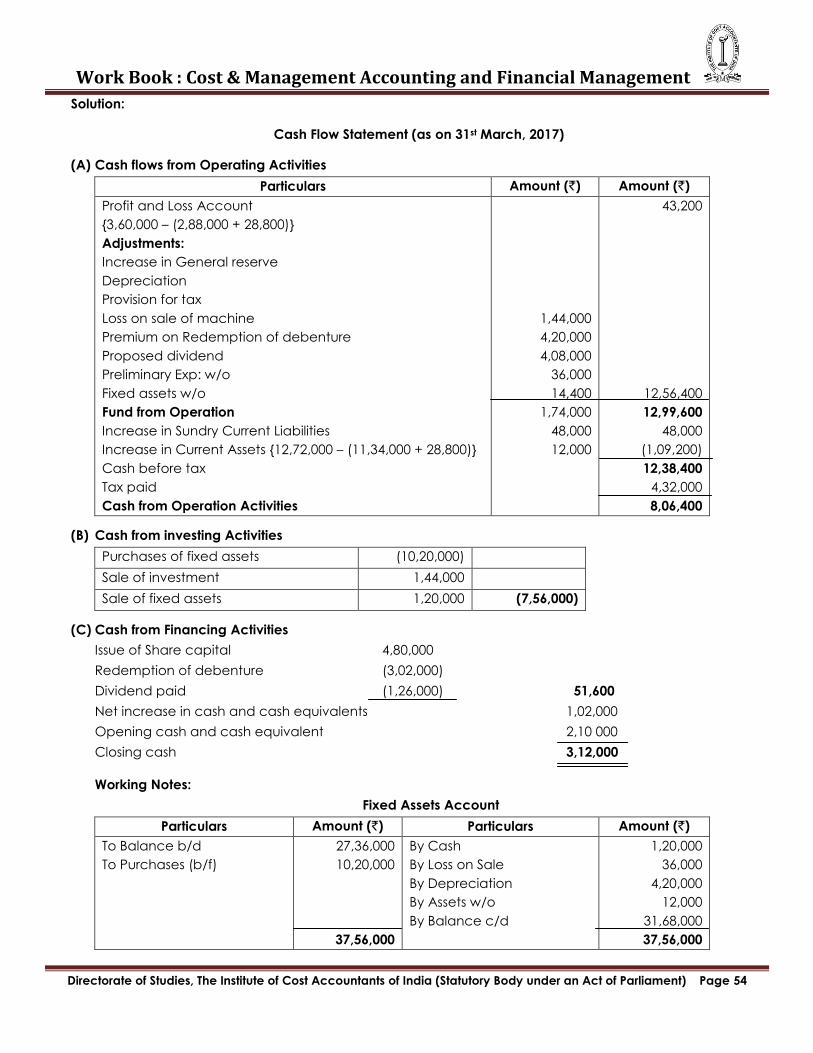
Work Book : Cost & Management Accounting and Financial Management
Directorate of Studies, The Institute of Cost Accountants of India (Statutory Body under an Act of Parliament) Page 54
Solution:
Cash Flow Statement (as on 31st March, 2017)
(A) Cash flows from Operating Activities
Particulars Amount (`) Amount (`)
Profit and Loss Account
{3,60,000 – (2,88,000 + 28,800)}
Adjustments:
Increase in General reserve
Depreciation
Provision for tax
Loss on sale of machine
Premium on Redemption of debenture
Proposed dividend
Preliminary Exp: w/o
Fixed assets w/o
Fund from Operation
Increase in Sundry Current Liabilities
Increase in Current Assets {12,72,000 – (11,34,000 + 28,800)}
Cash before tax
Tax paid
Cash from Operation Activities
1,44,000
4,20,000
4,08,000
36,000
14,400
1,74,000
48,000
12,000
43,200
12,56,400
12,99,600
48,000
(1,09,200)
12,38,400
4,32,000
8,06,400
(B) Cash from investing Activities
Purchases of fixed assets (10,20,000)
Sale of investment 1,44,000
Sale of fixed assets 1,20,000 (7,56,000)
(C) Cash from Financing Activities
Issue of Share capital 4,80,000
Redemption of debenture (3,02,000)
Dividend paid (1,26,000) 51,600
Net increase in cash and cash equivalents 1,02,000
Opening cash and cash equivalent 2,10 000
Closing cash 3,12,000
Working Notes:
Fixed Assets Account
Particulars Amount (`) Particulars Amount (`)
To Balance b/d
To Purchases (b/f)
27,36,000
10,20,000
37,56,000
By Cash
By Loss on Sale
By Depreciation
By Assets w/o
By Balance c/d
1,20,000
36,000
4,20,000
12,000
31,68,000
37,56,000
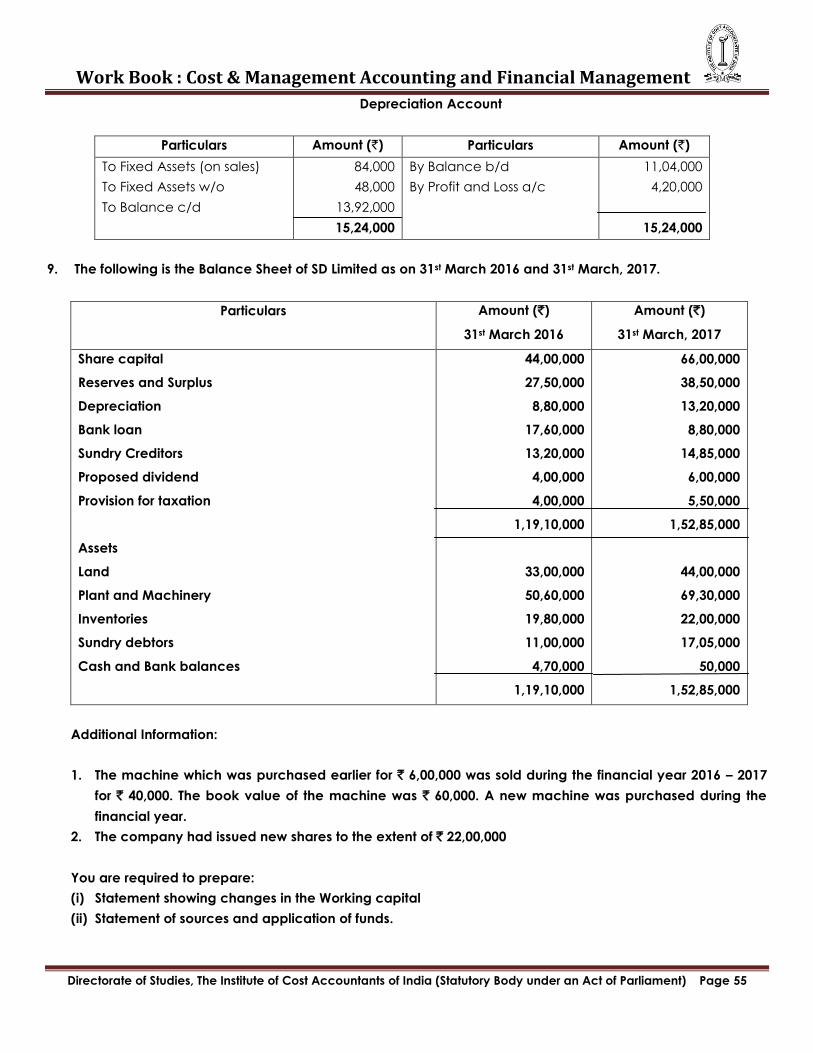
Work Book : Cost & Management Accounting and Financial Management
Directorate of Studies, The Institute of Cost Accountants of India (Statutory Body under an Act of Parliament) Page 55
Depreciation Account
Particulars Amount (`) Particulars Amount (`)
To Fixed Assets (on sales)
To Fixed Assets w/o
To Balance c/d
84,000
48,000
13,92,000
15,24,000
By Balance b/d
By Profit and Loss a/c
11,04,000
4,20,000
15,24,000
9. The following is the Balance Sheet of SD Limited as on 31st March 2016 and 31st March, 2017.
Particulars Amount (`)
31st March 2016
Amount (`)
31st March, 2017
Share capital
Reserves and Surplus
Depreciation
Bank loan
Sundry Creditors
Proposed dividend
Provision for taxation
Assets
Land
Plant and Machinery
Inventories
Sundry debtors
Cash and Bank balances
44,00,000
27,50,000
8,80,000
17,60,000
13,20,000
4,00,000
4,00,000
1,19,10,000
33,00,000
50,60,000
19,80,000
11,00,000
4,70,000
1,19,10,000
66,00,000
38,50,000
13,20,000
8,80,000
14,85,000
6,00,000
5,50,000
1,52,85,000
44,00,000
69,30,000
22,00,000
17,05,000
50,000
1,52,85,000
Additional Information:
1. The machine which was purchased earlier for ` 6,00,000 was sold during the financial year 2016 – 2017
for ` 40,000. The book value of the machine was ` 60,000. A new machine was purchased during the
financial year.
2. The company had issued new shares to the extent of ` 22,00,000
You are required to prepare:
(i) Statement showing changes in the Working capital
(ii) Statement of sources and application of funds.
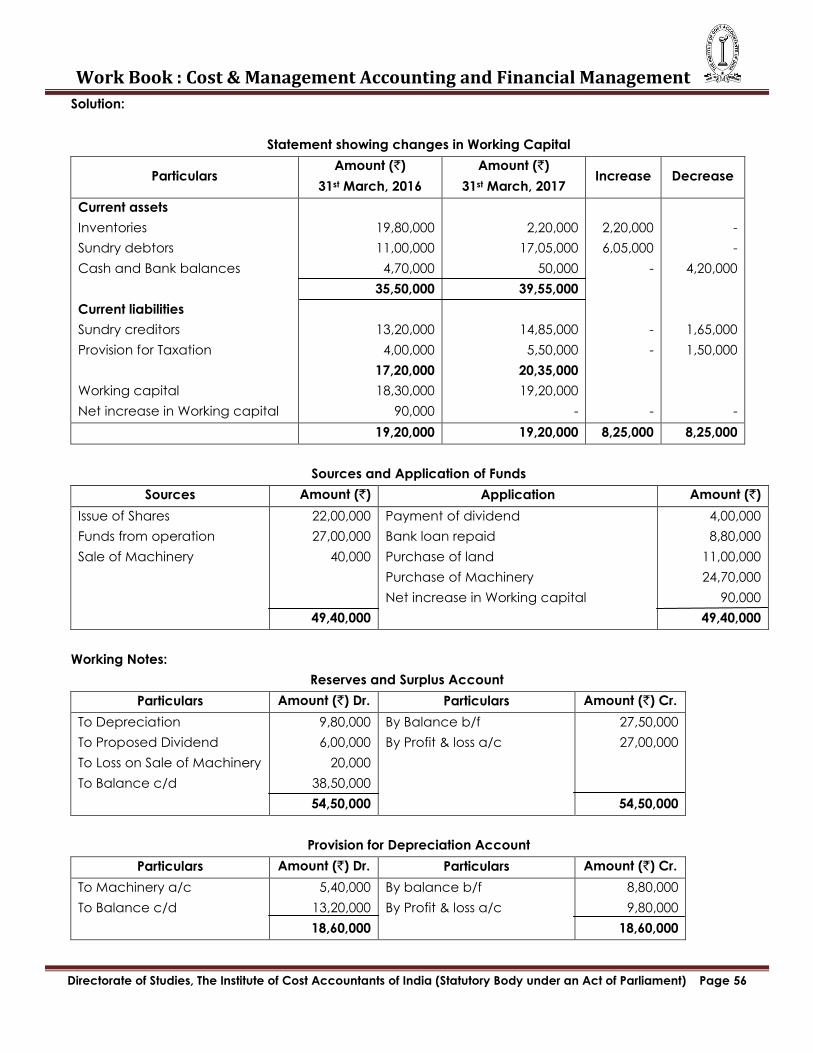
Work Book : Cost & Management Accounting and Financial Management
Directorate of Studies, The Institute of Cost Accountants of India (Statutory Body under an Act of Parliament) Page 56
Solution:
Statement showing changes in Working Capital
Particulars Amount (`)
31st March, 2016
Amount (`)
31st March, 2017 Increase Decrease
Current assets
Inventories
Sundry debtors
Cash and Bank balances
Current liabilities
Sundry creditors
Provision for Taxation
Working capital
Net increase in Working capital
19,80,000
11,00,000
4,70,000
35,50,000
13,20,000
4,00,000
17,20,000
18,30,000
90,000
2,20,000
17,05,000
50,000
39,55,000
14,85,000
5,50,000
20,35,000
19,20,000
-
2,20,000
6,05,000
-
-
-
-
-
-
4,20,000
1,65,000
1,50,000
-
19,20,000 19,20,000 8,25,000 8,25,000
Sources and Application of Funds
Sources Amount (`) Application Amount (`)
Issue of Shares
Funds from operation
Sale of Machinery
22,00,000
27,00,000
40,000
49,40,000
Payment of dividend
Bank loan repaid
Purchase of land
Purchase of Machinery
Net increase in Working capital
4,00,000
8,80,000
11,00,000
24,70,000
90,000
49,40,000
Working Notes:
Reserves and Surplus Account
Particulars Amount (`) Dr. Particulars Amount (`) Cr.
To Depreciation
To Proposed Dividend
To Loss on Sale of Machinery
To Balance c/d
9,80,000
6,00,000
20,000
38,50,000
54,50,000
By Balance b/f
By Profit & loss a/c
27,50,000
27,00,000
54,50,000
Provision for Depreciation Account
Particulars Amount (`) Dr. Particulars Amount (`) Cr.
To Machinery a/c
To Balance c/d
5,40,000
13,20,000
18,60,000
By balance b/f
By Profit & loss a/c
8,80,000
9,80,000
18,60,000
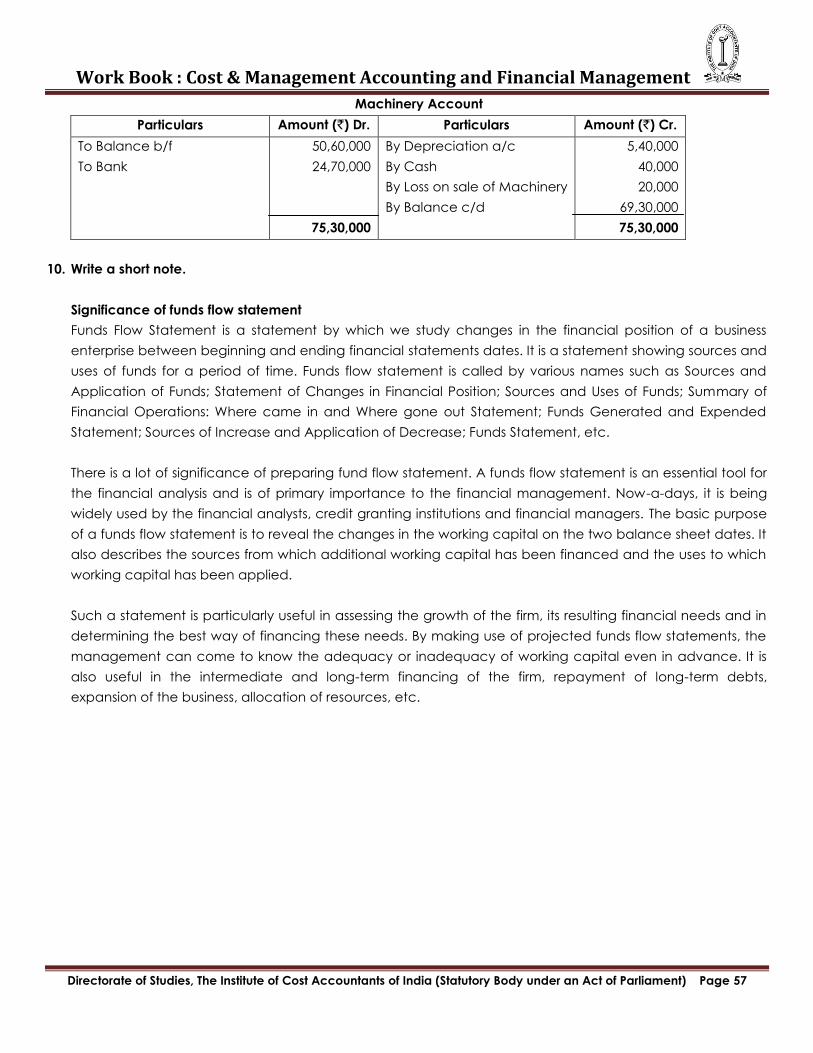
Work Book : Cost & Management Accounting and Financial Management
Directorate of Studies, The Institute of Cost Accountants of India (Statutory Body under an Act of Parliament) Page 57
Machinery Account
Particulars Amount (`) Dr. Particulars Amount (`) Cr.
To Balance b/f
To Bank
50,60,000
24,70,000
75,30,000
By Depreciation a/c
By Cash
By Loss on sale of Machinery
By Balance c/d
5,40,000
40,000
20,000
69,30,000
75,30,000
10. Write a short note.
Significance of funds flow statement
Funds Flow Statement is a statement by which we study changes in the financial position of a business
enterprise between beginning and ending financial statements dates. It is a statement showing sources and
uses of funds for a period of time. Funds flow statement is called by various names such as Sources and
Application of Funds; Statement of Changes in Financial Position; Sources and Uses of Funds; Summary of
Financial Operations: Where came in and Where gone out Statement; Funds Generated and Expended
Statement; Sources of Increase and Application of Decrease; Funds Statement, etc.
There is a lot of significance of preparing fund flow statement. A funds flow statement is an essential tool for
the financial analysis and is of primary importance to the financial management. Now-a-days, it is being
widely used by the financial analysts, credit granting institutions and financial managers. The basic purpose
of a funds flow statement is to reveal the changes in the working capital on the two balance sheet dates. It
also describes the sources from which additional working capital has been financed and the uses to which
working capital has been applied.
Such a statement is particularly useful in assessing the growth of the firm, its resulting financial needs and in
determining the best way of financing these needs. By making use of projected funds flow statements, the
management can come to know the adequacy or inadequacy of working capital even in advance. It is
also useful in the intermediate and long-term financing of the firm, repayment of long-term debts,
expansion of the business, allocation of resources, etc.
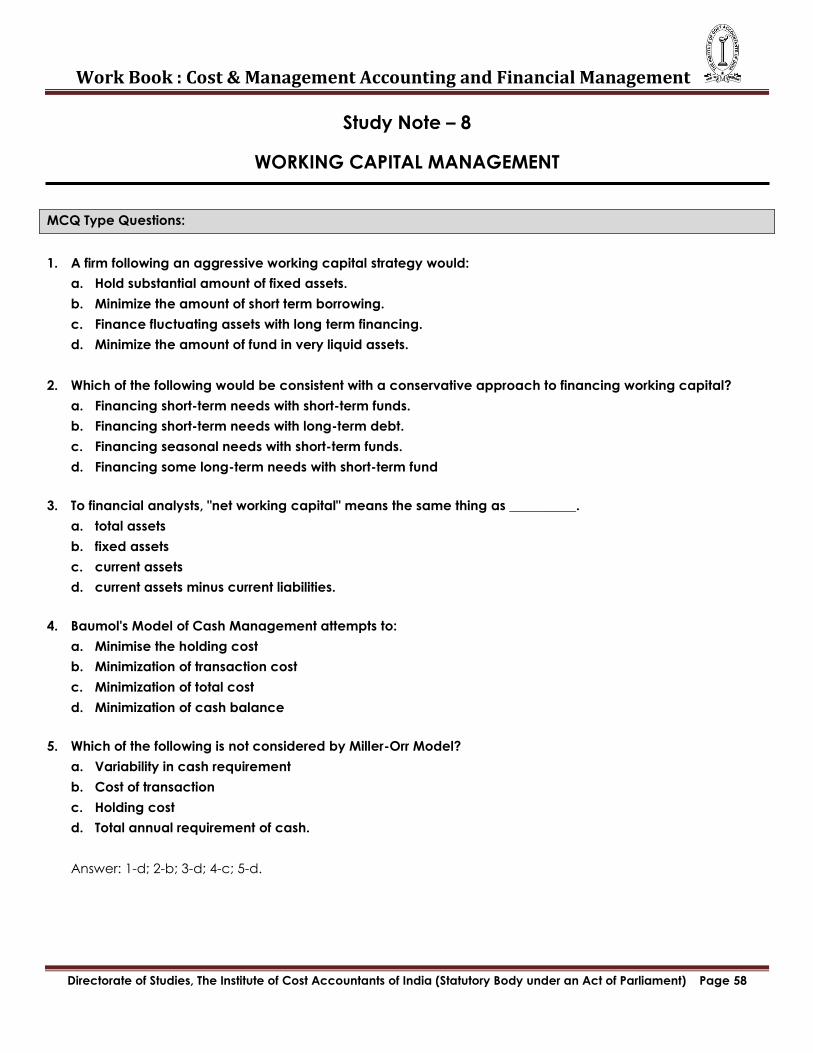
Work Book : Cost & Management Accounting and Financial Management
Directorate of Studies, The Institute of Cost Accountants of India (Statutory Body under an Act of Parliament) Page 58
Study Note – 8
WORKING CAPITAL MANAGEMENT
MCQ Type Questions:
1. A firm following an aggressive working capital strategy would:
a. Hold substantial amount of fixed assets.
b. Minimize the amount of short term borrowing.
c. Finance fluctuating assets with long term financing.
d. Minimize the amount of fund in very liquid assets.
2. Which of the following would be consistent with a conservative approach to financing working capital?
a. Financing short-term needs with short-term funds.
b. Financing short-term needs with long-term debt.
c. Financing seasonal needs with short-term funds.
d. Financing some long-term needs with short-term fund
3. To financial analysts, "net working capital" means the same thing as __________.
a. total assets
b. fixed assets
c. current assets
d. current assets minus current liabilities.
4. Baumol's Model of Cash Management attempts to:
a. Minimise the holding cost
b. Minimization of transaction cost
c. Minimization of total cost
d. Minimization of cash balance
5. Which of the following is not considered by Miller-Orr Model?
a. Variability in cash requirement
b. Cost of transaction
c. Holding cost
d. Total annual requirement of cash.
Answer: 1-d; 2-b; 3-d; 4-c; 5-d.
Work Book : Cost & Management Accounting and Financial Management
Directorate of Studies, The Institute of Cost Accountants of India (Statutory Body under an Act of Parliament) Page 59
Theoretical /Descriptive Questions:
1. Briefly explain the ‗Hedging Approach‘ to financing working capital requirements of a firm.
The hedging approach is also known as the matching approach. With this approach, short term or seasonal
variation in current assets would be financed with short term debt; the permanent component of current
assets and all fixes assets would be met with long term debt. The basic objective of this method of financing
is that the permanent component of current assets, and fixed assets would be met with long term funds and
the short term or seasonal variations in current be financed with short term debt. For example, machine with
a useful life of 5 years should be financed through a 5-year loan. Building can be financed by 25-year
mortgage bond. Assets having useful life of 30 days may be financed with a 30-day borrowing.
The justification of the matching policy is that since the purpose of financing is to invest in an asset, the
liability should be liquidated when the life of the asset expires. Use of long term sources for financing short
term assets will be costly as the funds will remain idle after the expiry of assets lives. Similarly, financing long
term assets with short term sources inconvenient and costly as they are to be renewed on a continuous
basis upto the lives of the assets concerned.
2. Explain the concept of ‗Zero Working Capital Strategy‘.
Zero working capital is a situation in which there is no excess of current assets over current liabilities to be
funded. The concept is used to drive down the level of investment required to operate a business, which
can also increase the return on investment for shareholders. Management prefers low levels of working
capital since working capital earns an extremely low rate of return. Some companies are now driving
working capital to record low levels, so called zero working capital. There are two requirements to
implement zero working capital i.e. (a) demand based production where demand based organizations do
everything only as they are demanded: fill customer orders, receive supplies, manufacture products and
other functions are done only as needed. (b) Receivable and payable terms under which credit is granted
to customers must be curtailed, while payment terms to suppliers must be extended. Ideally, cash should be
received from customers before it is due for payment to suppliers. This essentially means that customer
payments are directly funding the payments to suppliers. Zero working capital would call for a fine
balancing act in Financial Management, and the success in this endeavour would get reflected in healthier
bottom lines.
3. The lockbox system
It is a simple method used in reducing collection float and accelerating firm‘s collections or remittances.
When a firm adopts the lockbox system, it takes a post office box in its name, called lockbox, and requests
its customers to mail their payments to these lockboxes. These lockboxes are attended by local collection
banks or local branch or depot personnel one or more times every day (if possible even on holidays). These
cheques are deposited directly into the local bank account of the firm. If it is through the local bank, then
the company authorizes its bank to collect its sale receipts from the lockboxes.
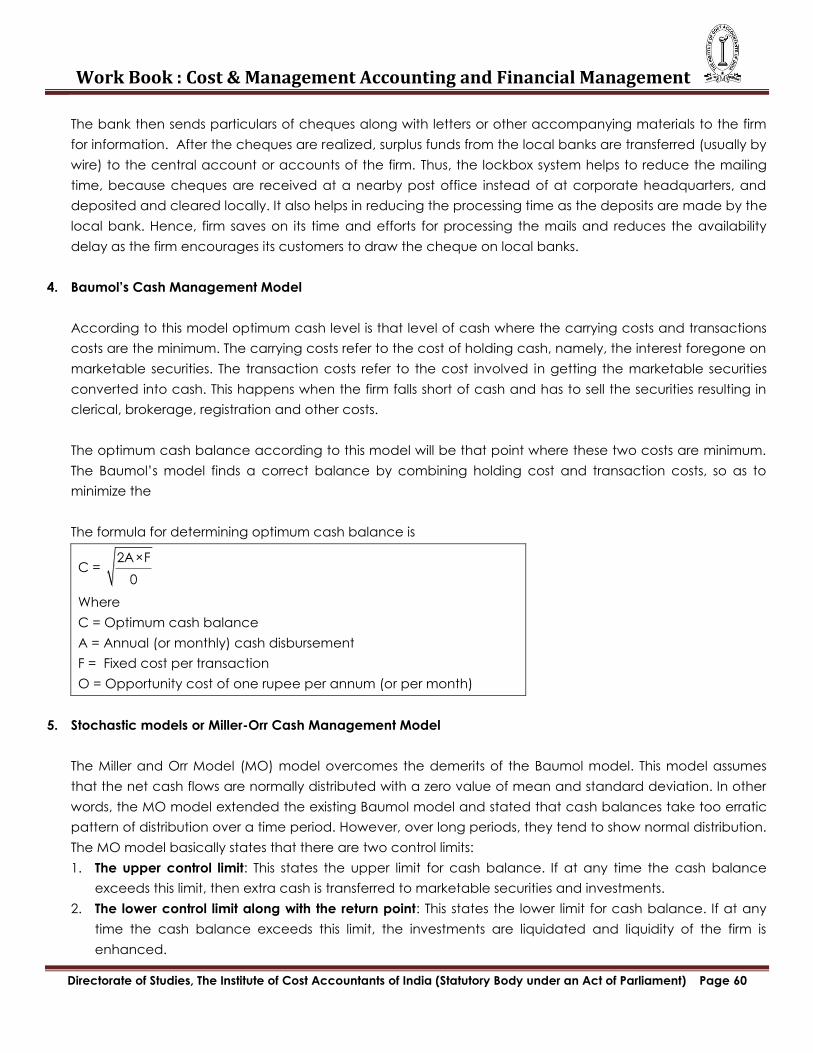
Work Book : Cost & Management Accounting and Financial Management
Directorate of Studies, The Institute of Cost Accountants of India (Statutory Body under an Act of Parliament) Page 60
The bank then sends particulars of cheques along with letters or other accompanying materials to the firm
for information. After the cheques are realized, surplus funds from the local banks are transferred (usually by
wire) to the central account or accounts of the firm. Thus, the lockbox system helps to reduce the mailing
time, because cheques are received at a nearby post office instead of at corporate headquarters, and
deposited and cleared locally. It also helps in reducing the processing time as the deposits are made by the
local bank. Hence, firm saves on its time and efforts for processing the mails and reduces the availability
delay as the firm encourages its customers to draw the cheque on local banks.
4. Baumol‘s Cash Management Model
According to this model optimum cash level is that level of cash where the carrying costs and transactions
costs are the minimum. The carrying costs refer to the cost of holding cash, namely, the interest foregone on
marketable securities. The transaction costs refer to the cost involved in getting the marketable securities
converted into cash. This happens when the firm falls short of cash and has to sell the securities resulting in
clerical, brokerage, registration and other costs.
The optimum cash balance according to this model will be that point where these two costs are minimum.
The Baumol‘s model finds a correct balance by combining holding cost and transaction costs, so as to
minimize the
The formula for determining optimum cash balance is
C = 2A×F
0
Where
C = Optimum cash balance
A = Annual (or monthly) cash disbursement
F = Fixed cost per transaction
O = Opportunity cost of one rupee per annum (or per month)
5. Stochastic models or Miller-Orr Cash Management Model
The Miller and Orr Model (MO) model overcomes the demerits of the Baumol model. This model assumes
that the net cash flows are normally distributed with a zero value of mean and standard deviation. In other
words, the MO model extended the existing Baumol model and stated that cash balances take too erratic
pattern of distribution over a time period. However, over long periods, they tend to show normal distribution.
The MO model basically states that there are two control limits:
1. The upper control limit: This states the upper limit for cash balance. If at any time the cash balance
exceeds this limit, then extra cash is transferred to marketable securities and investments.
2. The lower control limit along with the return point: This states the lower limit for cash balance. If at any
time the cash balance exceeds this limit, the investments are liquidated and liquidity of the firm is
enhanced.
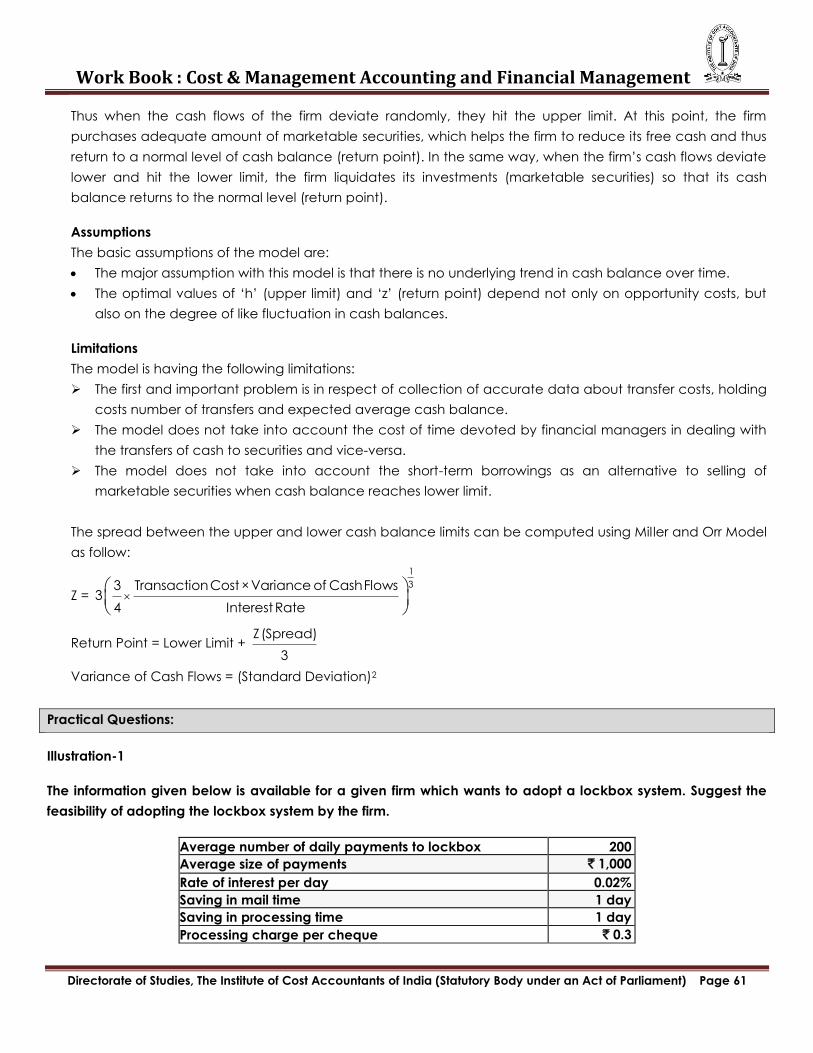
Work Book : Cost & Management Accounting and Financial Management
Directorate of Studies, The Institute of Cost Accountants of India (Statutory Body under an Act of Parliament) Page 61
Thus when the cash flows of the firm deviate randomly, they hit the upper limit. At this point, the firm
purchases adequate amount of marketable securities, which helps the firm to reduce its free cash and thus
return to a normal level of cash balance (return point). In the same way, when the firm‘s cash flows deviate
lower and hit the lower limit, the firm liquidates its investments (marketable securities) so that its cash
balance returns to the normal level (return point).
Assumptions
The basic assumptions of the model are:
The major assumption with this model is that there is no underlying trend in cash balance over time.
The optimal values of ‗h‘ (upper limit) and ‗z‘ (return point) depend not only on opportunity costs, but
also on the degree of like fluctuation in cash balances.
Limitations
The model is having the following limitations:
The first and important problem is in respect of collection of accurate data about transfer costs, holding
costs number of transfers and expected average cash balance.
The model does not take into account the cost of time devoted by financial managers in dealing with
the transfers of cash to securities and vice-versa.
The model does not take into account the short-term borrowings as an alternative to selling of
marketable securities when cash balance reaches lower limit.
The spread between the upper and lower cash balance limits can be computed using Miller and Orr Model
as follow:
Z =
1
33 Transaction Cost × Variance of Cash Flows3
4 Interest Rate
Return Point = Lower Limit + Z (Spread)
3
Variance of Cash Flows = (Standard Deviation)2
Practical Questions:
Illustration-1
The information given below is available for a given firm which wants to adopt a lockbox system. Suggest the
feasibility of adopting the lockbox system by the firm.
Average number of daily payments to lockbox 200
Average size of payments ` 1,000
Rate of interest per day 0.02%
Saving in mail time 1 day
Saving in processing time 1 day
Processing charge per cheque ` 0.3
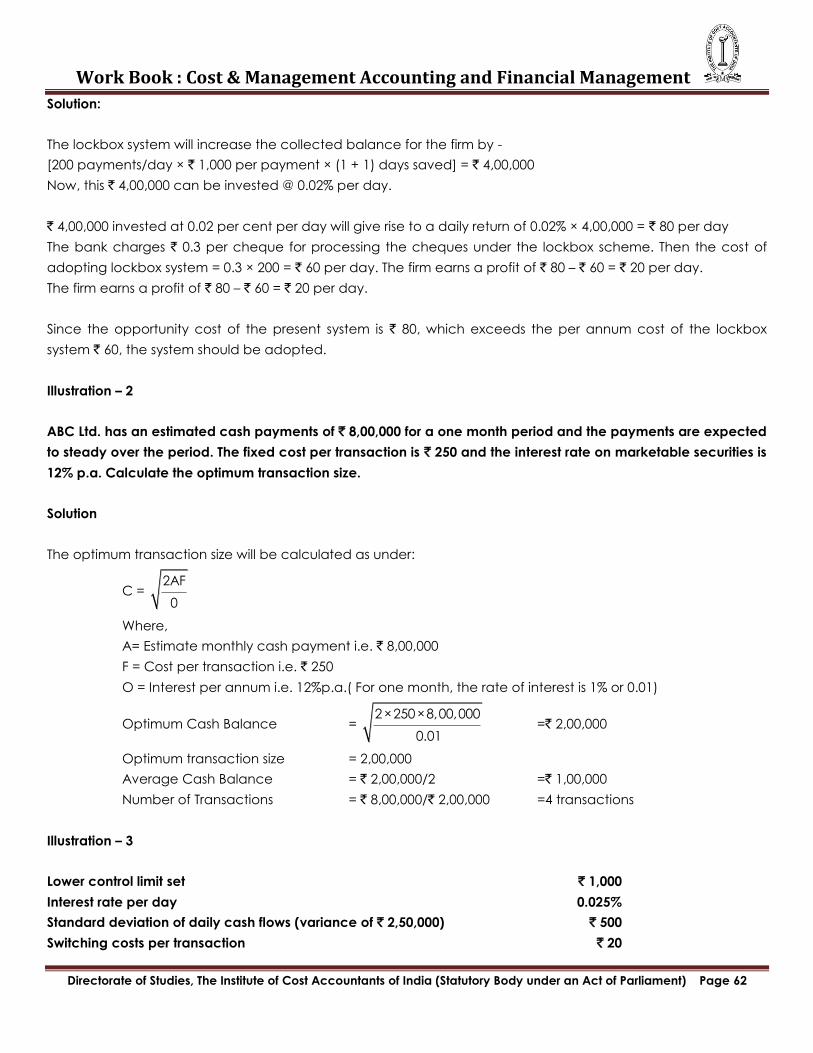
Work Book : Cost & Management Accounting and Financial Management
Directorate of Studies, The Institute of Cost Accountants of India (Statutory Body under an Act of Parliament) Page 62
Solution:
The lockbox system will increase the collected balance for the firm by -
[200 payments/day × ` 1,000 per payment × (1 + 1) days saved] = ` 4,00,000
Now, this ` 4,00,000 can be invested @ 0.02% per day.
` 4,00,000 invested at 0.02 per cent per day will give rise to a daily return of 0.02% × 4,00,000 = ` 80 per day
The bank charges ` 0.3 per cheque for processing the cheques under the lockbox scheme. Then the cost of
adopting lockbox system = 0.3 × 200 = ` 60 per day. The firm earns a profit of ` 80 – ` 60 = ` 20 per day.
The firm earns a profit of ` 80 – ` 60 = ` 20 per day.
Since the opportunity cost of the present system is ` 80, which exceeds the per annum cost of the lockbox
system ` 60, the system should be adopted.
Illustration – 2
ABC Ltd. has an estimated cash payments of ` 8,00,000 for a one month period and the payments are expected
to steady over the period. The fixed cost per transaction is ` 250 and the interest rate on marketable securities is
12% p.a. Calculate the optimum transaction size.
Solution
The optimum transaction size will be calculated as under:
C = 2AF
0
Where,
A= Estimate monthly cash payment i.e. ` 8,00,000
F = Cost per transaction i.e. ` 250
O = Interest per annum i.e. 12%p.a.( For one month, the rate of interest is 1% or 0.01)
Optimum Cash Balance = 2×250×8,00,000
0.01 =` 2,00,000
Optimum transaction size = 2,00,000
Average Cash Balance = ` 2,00,000/2 =` 1,00,000
Number of Transactions = ` 8,00,000/` 2,00,000 =4 transactions
Illustration – 3
Lower control limit set ` 1,000
Interest rate per day 0.025%
Standard deviation of daily cash flows (variance of ` 2,50,000) ` 500
Switching costs per transaction ` 20
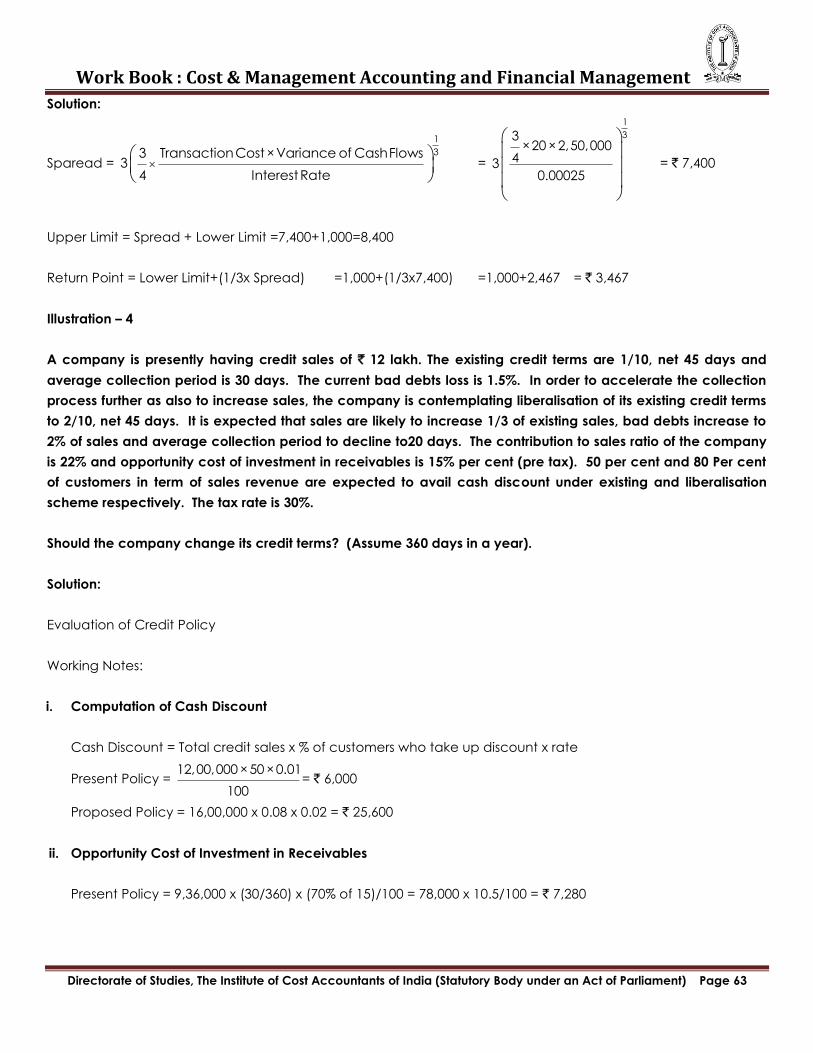
Work Book : Cost & Management Accounting and Financial Management
Directorate of Studies, The Institute of Cost Accountants of India (Statutory Body under an Act of Parliament) Page 63
Solution:
Sparead =
1
33 Transaction Cost × Variance of Cash Flows3
4 Interest Rate =
1
33×20 × 2,50,000
430.00025
= ` 7,400
Upper Limit = Spread + Lower Limit =7,400+1,000=8,400
Return Point = Lower Limit+(1/3x Spread) =1,000+(1/3x7,400) =1,000+2,467 = ` 3,467
Illustration – 4
A company is presently having credit sales of ` 12 lakh. The existing credit terms are 1/10, net 45 days and
average collection period is 30 days. The current bad debts loss is 1.5%. In order to accelerate the collection
process further as also to increase sales, the company is contemplating liberalisation of its existing credit terms
to 2/10, net 45 days. It is expected that sales are likely to increase 1/3 of existing sales, bad debts increase to
2% of sales and average collection period to decline to20 days. The contribution to sales ratio of the company
is 22% and opportunity cost of investment in receivables is 15% per cent (pre tax). 50 per cent and 80 Per cent
of customers in term of sales revenue are expected to avail cash discount under existing and liberalisation
scheme respectively. The tax rate is 30%.
Should the company change its credit terms? (Assume 360 days in a year).
Solution:
Evaluation of Credit Policy
Working Notes:
i. Computation of Cash Discount
Cash Discount = Total credit sales x % of customers who take up discount x rate
Present Policy = 12,00,000 × 50 × 0.01
100= ` 6,000
Proposed Policy = 16,00,000 x 0.08 x 0.02 = ` 25,600
ii. Opportunity Cost of Investment in Receivables
Present Policy = 9,36,000 x (30/360) x (70% of 15)/100 = 78,000 x 10.5/100 = ` 7,280

Work Book : Cost & Management Accounting and Financial Management
Directorate of Studies, The Institute of Cost Accountants of India (Statutory Body under an Act of Parliament) Page 64
Statement showing Evaluation of Credit Policies
Particulars Present Policy Proposed Policy
Credit Sales 12,00,000 16,00,000
Variable Cost @78% of sales 9,36,000 12,48,000
Bad Debts @1.5% and 2% 18,000 32,000
Cash Discount 6,000 25,600
Profit before tax 2,40,000 2,94,400
Tax @ 30% 72,000 88,320
Profit after tax 1,68,000 2,06,080
Opportunity Cost of Investment in Receivables 8,190 7,280
Net Profit 1,59,810 1,98,800
Advise: Proposed policy should be adopted since the net benefit is increased by (` 1,98,800 – 1,59,810) = `
38,990.
[Note: Opportunity cost of investment in receivables can be computed alternatively taking contribution @
22 per cent into consideration. The net benefit then would change accordingly to ` 1,95,137.]
Illustration – 5
Narang Ltd. currently has sales of ` 30,00,000 with an average period of two months. At present no discounts are
offered to the customers. The management of the company is thinking to allow a discount of 2% on cash sales
which result in:
a. The Average collection period would reduce to one month
b. 50% of customers would take advantage of 2% discount
c. The company normally requires a 25% return on its investment
Advise the management whether to extend discount on cash sales or not.
Solution
Current Debtors (` 3000000*2/12) 500000
Revised Debtors (` 3000000*1/12) 250000
Reduction of investment in Debtors balance 250000
Discount to be offered =3000000*50/100*2/100 = 30000
Increase in profit due to decrease in debtors = 250000*25/100 = 62500
Net increase in profit =62500-30000= 32500
Analysis- It is suggested to offer the 2% discount on cash sales, which will result increase in profit by ` 32500.
Cost of Cash Discount =
2 365
100 - 2 60 - 0× 100 =
2 365
98 60× 100 = 12.4%
Since cost of discount 12.4% is less than the rate of return on investment 25%, it is suggested to extend the
discount terms of cash sales.
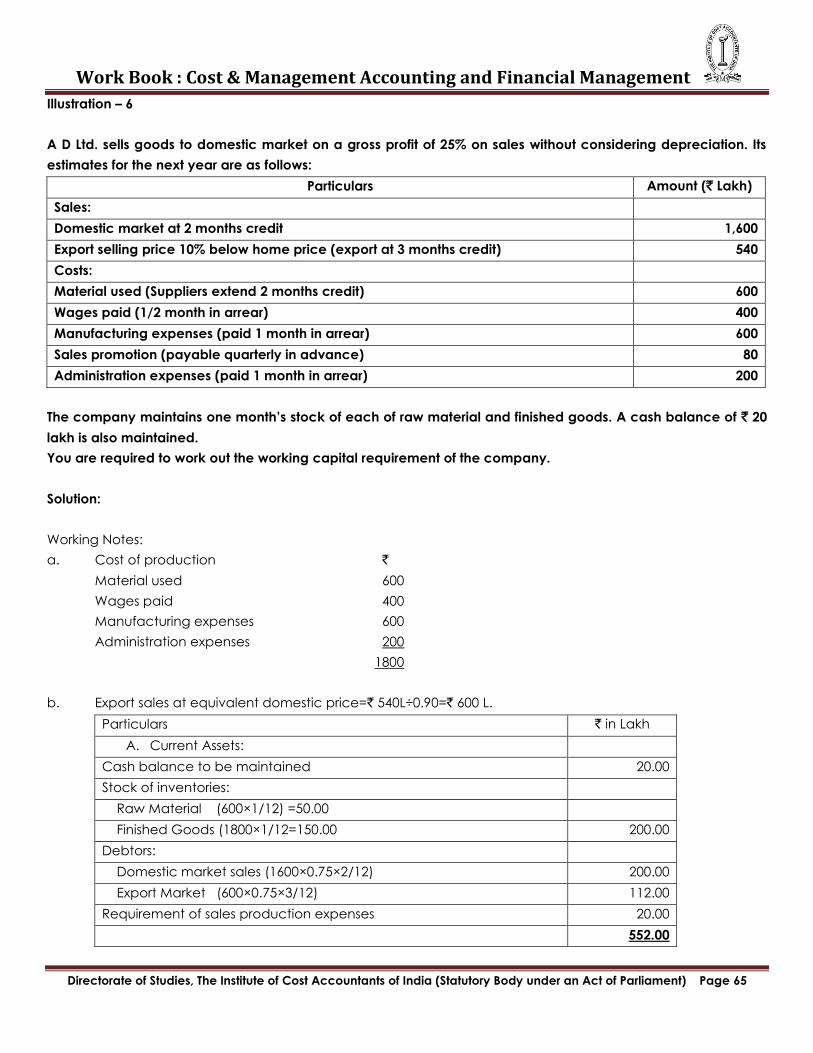
Work Book : Cost & Management Accounting and Financial Management
Directorate of Studies, The Institute of Cost Accountants of India (Statutory Body under an Act of Parliament) Page 65
Illustration – 6
A D Ltd. sells goods to domestic market on a gross profit of 25% on sales without considering depreciation. Its
estimates for the next year are as follows:
Particulars Amount (` Lakh)
Sales:
Domestic market at 2 months credit 1,600
Export selling price 10% below home price (export at 3 months credit) 540
Costs:
Material used (Suppliers extend 2 months credit) 600
Wages paid (1/2 month in arrear) 400
Manufacturing expenses (paid 1 month in arrear) 600
Sales promotion (payable quarterly in advance) 80
Administration expenses (paid 1 month in arrear) 200
The company maintains one month‘s stock of each of raw material and finished goods. A cash balance of ` 20
lakh is also maintained.
You are required to work out the working capital requirement of the company.
Solution:
Working Notes:
a. Cost of production `
Material used 600
Wages paid 400
Manufacturing expenses 600
Administration expenses 200
1800
b. Export sales at equivalent domestic price=` 540L÷0.90=` 600 L.
Particulars ` in Lakh
A. Current Assets:
Cash balance to be maintained 20.00
Stock of inventories:
Raw Material (600×1/12) =50.00
Finished Goods (1800×1/12=150.00 200.00
Debtors:
Domestic market sales (1600×0.75×2/12) 200.00
Export Market (600×0.75×3/12) 112.00
Requirement of sales production expenses 20.00
552.00
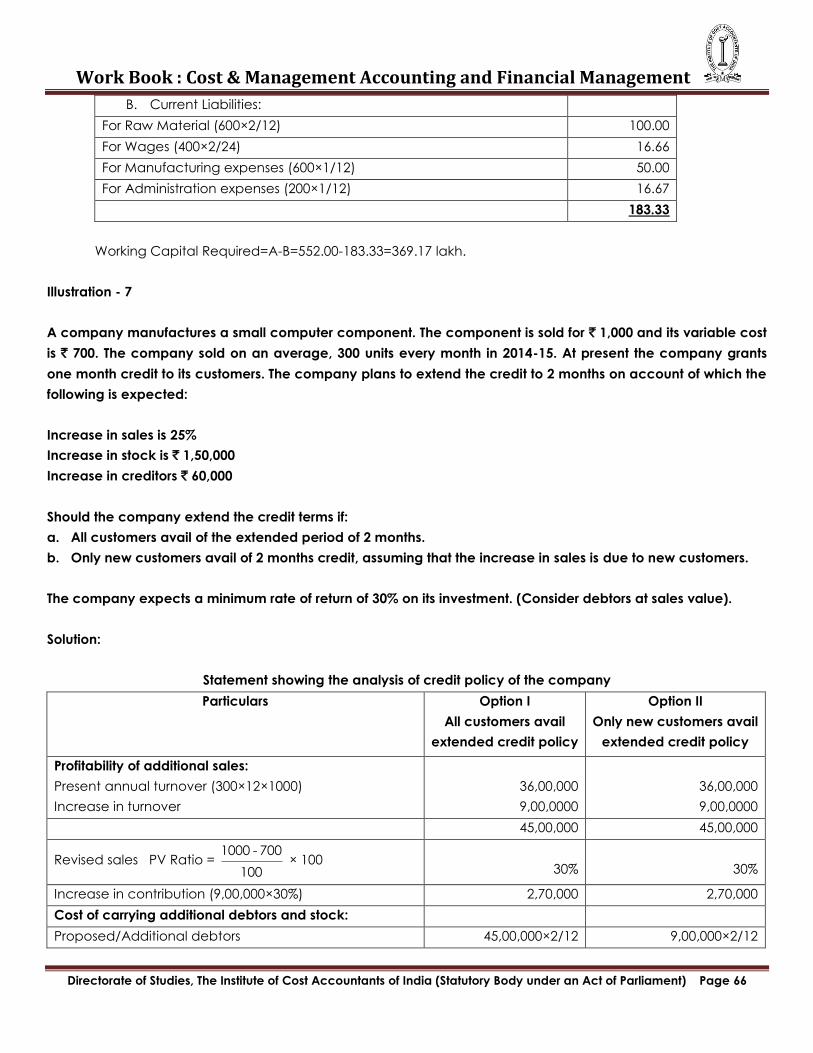
Work Book : Cost & Management Accounting and Financial Management
Directorate of Studies, The Institute of Cost Accountants of India (Statutory Body under an Act of Parliament) Page 66
B. Current Liabilities:
For Raw Material (600×2/12) 100.00
For Wages (400×2/24) 16.66
For Manufacturing expenses (600×1/12) 50.00
For Administration expenses (200×1/12) 16.67
183.33
Working Capital Required=A-B=552.00-183.33=369.17 lakh.
Illustration - 7
A company manufactures a small computer component. The component is sold for ` 1,000 and its variable cost
is ` 700. The company sold on an average, 300 units every month in 2014-15. At present the company grants
one month credit to its customers. The company plans to extend the credit to 2 months on account of which the
following is expected:
Increase in sales is 25%
Increase in stock is ` 1,50,000
Increase in creditors ` 60,000
Should the company extend the credit terms if:
a. All customers avail of the extended period of 2 months.
b. Only new customers avail of 2 months credit, assuming that the increase in sales is due to new customers.
The company expects a minimum rate of return of 30% on its investment. (Consider debtors at sales value).
Solution:
Statement showing the analysis of credit policy of the company
Particulars Option I
All customers avail
extended credit policy
Option II
Only new customers avail
extended credit policy
Profitability of additional sales:
Present annual turnover (300×12×1000)
Increase in turnover
36,00,000
9,00,0000
36,00,000
9,00,0000
45,00,000 45,00,000
Revised sales PV Ratio = 1000 - 700
100 × 100
30%
30%
Increase in contribution (9,00,000×30%) 2,70,000 2,70,000
Cost of carrying additional debtors and stock:
Proposed/Additional debtors 45,00,000×2/12 9,00,000×2/12
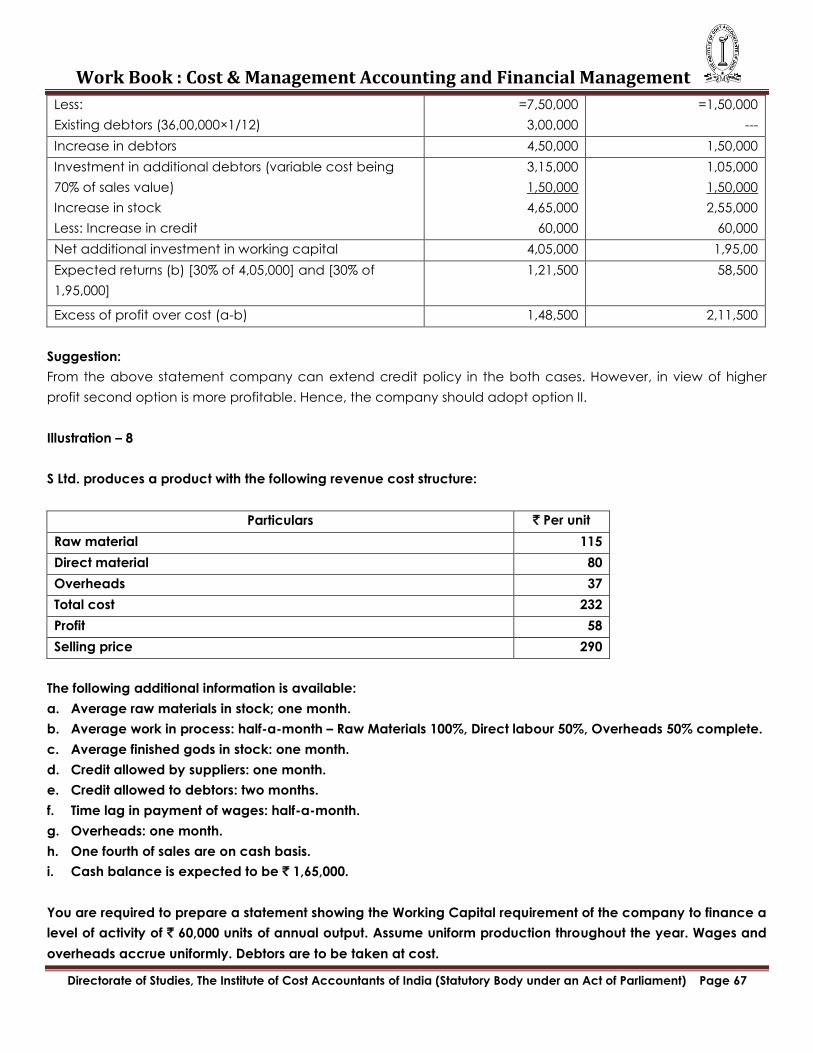
Work Book : Cost & Management Accounting and Financial Management
Directorate of Studies, The Institute of Cost Accountants of India (Statutory Body under an Act of Parliament) Page 67
Less:
Existing debtors (36,00,000×1/12)
=7,50,000
3,00,000
=1,50,000
---
Increase in debtors 4,50,000 1,50,000
Investment in additional debtors (variable cost being
70% of sales value)
Increase in stock
Less: Increase in credit
3,15,000
1,50,000
4,65,000
60,000
1,05,000
1,50,000
2,55,000
60,000
Net additional investment in working capital 4,05,000 1,95,00
Expected returns (b) [30% of 4,05,000] and [30% of
1,95,000]
1,21,500 58,500
Excess of profit over cost (a-b) 1,48,500 2,11,500
Suggestion:
From the above statement company can extend credit policy in the both cases. However, in view of higher
profit second option is more profitable. Hence, the company should adopt option II.
Illustration – 8
S Ltd. produces a product with the following revenue cost structure:
Particulars ` Per unit
Raw material 115
Direct material 80
Overheads 37
Total cost 232
Profit 58
Selling price 290
The following additional information is available:
a. Average raw materials in stock; one month.
b. Average work in process: half-a-month – Raw Materials 100%, Direct labour 50%, Overheads 50% complete.
c. Average finished gods in stock: one month.
d. Credit allowed by suppliers: one month.
e. Credit allowed to debtors: two months.
f. Time lag in payment of wages: half-a-month.
g. Overheads: one month.
h. One fourth of sales are on cash basis.
i. Cash balance is expected to be ` 1,65,000.
You are required to prepare a statement showing the Working Capital requirement of the company to finance a
level of activity of ` 60,000 units of annual output. Assume uniform production throughout the year. Wages and
overheads accrue uniformly. Debtors are to be taken at cost.
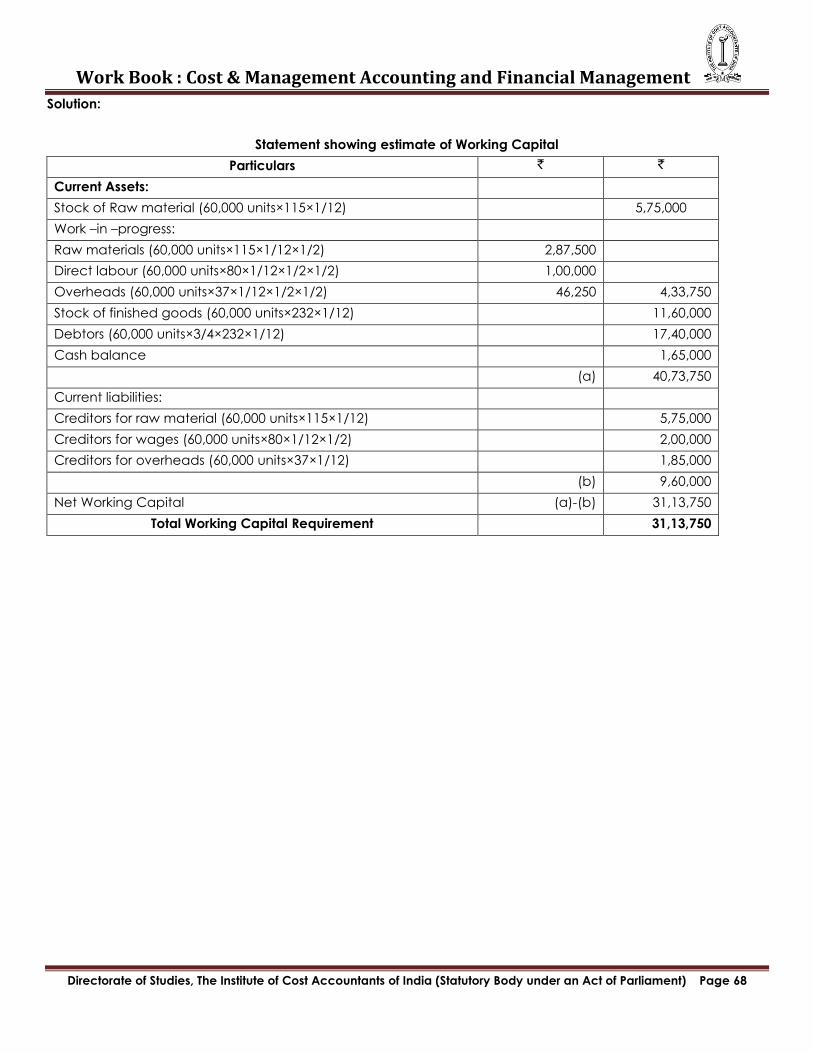
Work Book : Cost & Management Accounting and Financial Management
Directorate of Studies, The Institute of Cost Accountants of India (Statutory Body under an Act of Parliament) Page 68
Solution:
Statement showing estimate of Working Capital
Particulars ` `
Current Assets:
Stock of Raw material (60,000 units×115×1/12) 5,75,000
Work –in –progress:
Raw materials (60,000 units×115×1/12×1/2) 2,87,500
Direct labour (60,000 units×80×1/12×1/2×1/2) 1,00,000
Overheads (60,000 units×37×1/12×1/2×1/2) 46,250 4,33,750
Stock of finished goods (60,000 units×232×1/12) 11,60,000
Debtors (60,000 units×3/4×232×1/12) 17,40,000
Cash balance 1,65,000
(a) 40,73,750
Current liabilities:
Creditors for raw material (60,000 units×115×1/12) 5,75,000
Creditors for wages (60,000 units×80×1/12×1/2) 2,00,000
Creditors for overheads (60,000 units×37×1/12) 1,85,000
(b) 9,60,000
Net Working Capital (a)-(b) 31,13,750
Total Working Capital Requirement 31,13,750
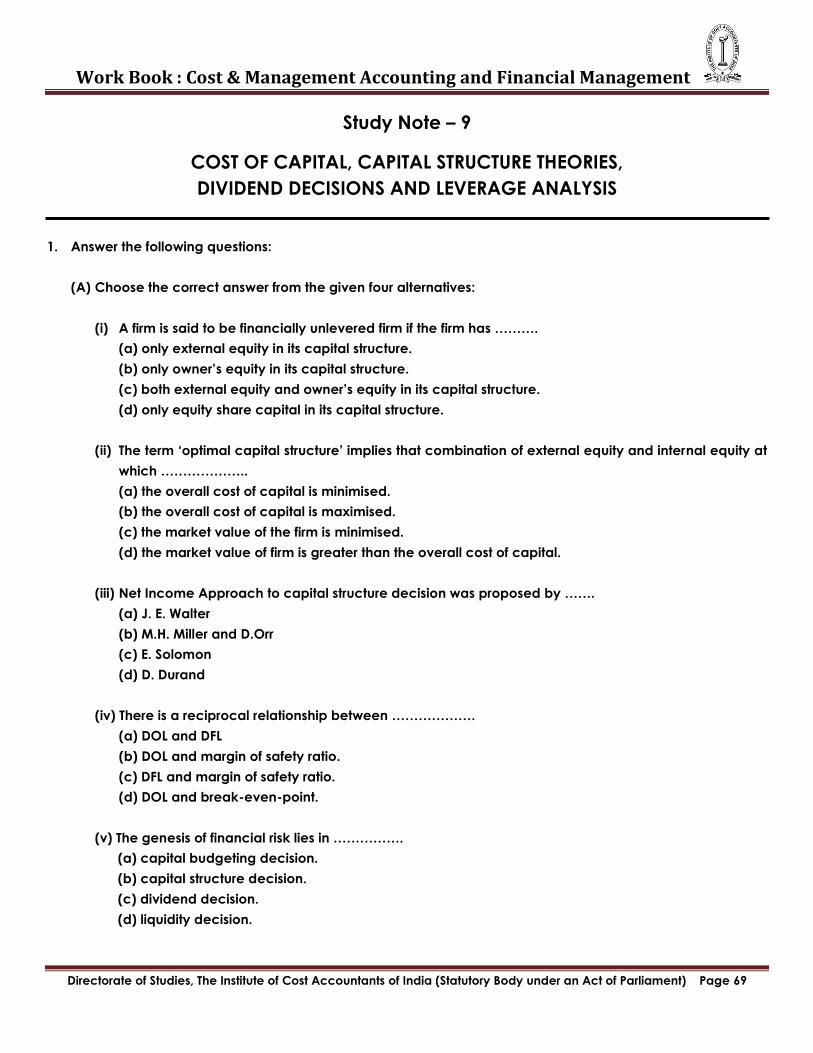
Work Book : Cost & Management Accounting and Financial Management
Directorate of Studies, The Institute of Cost Accountants of India (Statutory Body under an Act of Parliament) Page 69
Study Note – 9
COST OF CAPITAL, CAPITAL STRUCTURE THEORIES,
DIVIDEND DECISIONS AND LEVERAGE ANALYSIS
1. Answer the following questions:
(A) Choose the correct answer from the given four alternatives:
(i) A firm is said to be financially unlevered firm if the firm has ……….
(a) only external equity in its capital structure.
(b) only owner‘s equity in its capital structure.
(c) both external equity and owner‘s equity in its capital structure.
(d) only equity share capital in its capital structure.
(ii) The term ‗optimal capital structure‘ implies that combination of external equity and internal equity at
which ………………..
(a) the overall cost of capital is minimised.
(b) the overall cost of capital is maximised.
(c) the market value of the firm is minimised.
(d) the market value of firm is greater than the overall cost of capital.
(iii) Net Income Approach to capital structure decision was proposed by …….
(a) J. E. Walter
(b) M.H. Miller and D.Orr
(c) E. Solomon
(d) D. Durand
(iv) There is a reciprocal relationship between ……………….
(a) DOL and DFL
(b) DOL and margin of safety ratio.
(c) DFL and margin of safety ratio.
(d) DOL and break-even-point.
(v) The genesis of financial risk lies in …………….
(a) capital budgeting decision.
(b) capital structure decision.
(c) dividend decision.
(d) liquidity decision.
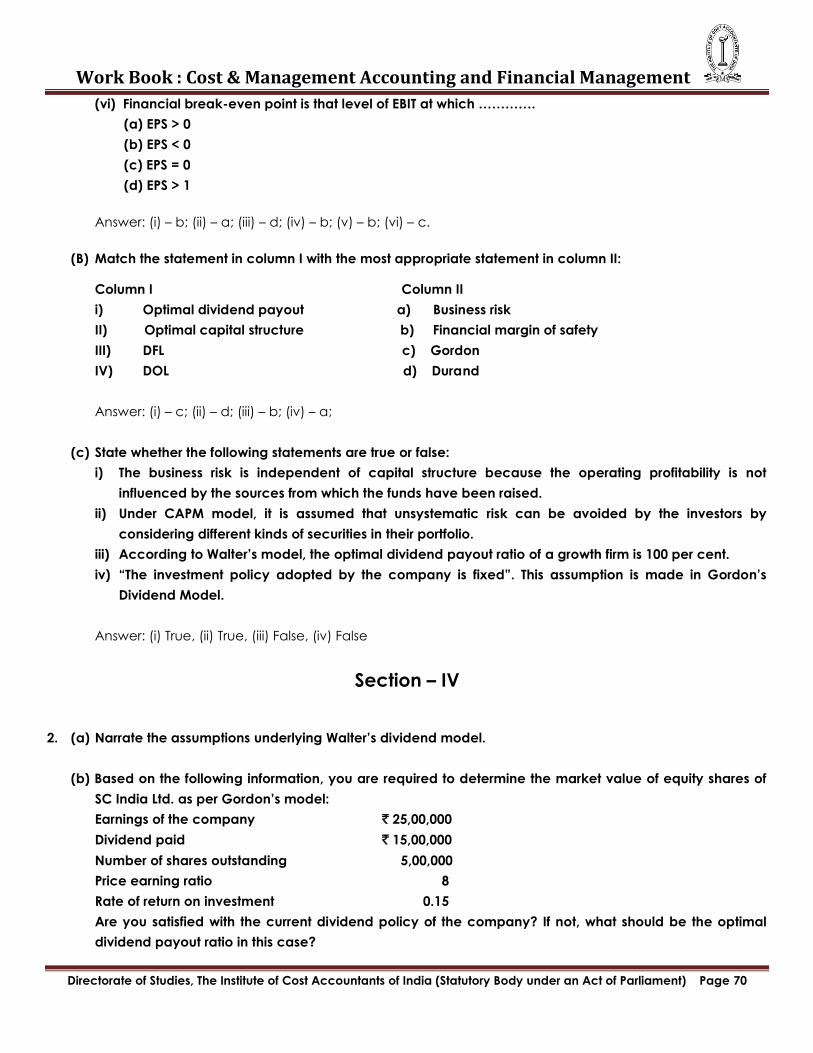
Work Book : Cost & Management Accounting and Financial Management
Directorate of Studies, The Institute of Cost Accountants of India (Statutory Body under an Act of Parliament) Page 70
(vi) Financial break-even point is that level of EBIT at which ………….
(a) EPS > 0
(b) EPS < 0
(c) EPS = 0
(d) EPS > 1
Answer: (i) – b; (ii) – a; (iii) – d; (iv) – b; (v) – b; (vi) – c.
(B) Match the statement in column I with the most appropriate statement in column II:
Column I Column II
i) Optimal dividend payout a) Business risk
II) Optimal capital structure b) Financial margin of safety
III) DFL c) Gordon
IV) DOL d) Durand
Answer: (i) – c; (ii) – d; (iii) – b; (iv) – a;
(c) State whether the following statements are true or false:
i) The business risk is independent of capital structure because the operating profitability is not
influenced by the sources from which the funds have been raised.
ii) Under CAPM model, it is assumed that unsystematic risk can be avoided by the investors by
considering different kinds of securities in their portfolio.
iii) According to Walter‘s model, the optimal dividend payout ratio of a growth firm is 100 per cent.
iv) ―The investment policy adopted by the company is fixed‖. This assumption is made in Gordon‘s
Dividend Model.
Answer: (i) True, (ii) True, (iii) False, (iv) False
Section – IV
2. (a) Narrate the assumptions underlying Walter‘s dividend model.
(b) Based on the following information, you are required to determine the market value of equity shares of
SC India Ltd. as per Gordon‘s model:
Earnings of the company ` 25,00,000
Dividend paid ` 15,00,000
Number of shares outstanding 5,00,000
Price earning ratio 8
Rate of return on investment 0.15
Are you satisfied with the current dividend policy of the company? If not, what should be the optimal
dividend payout ratio in this case?
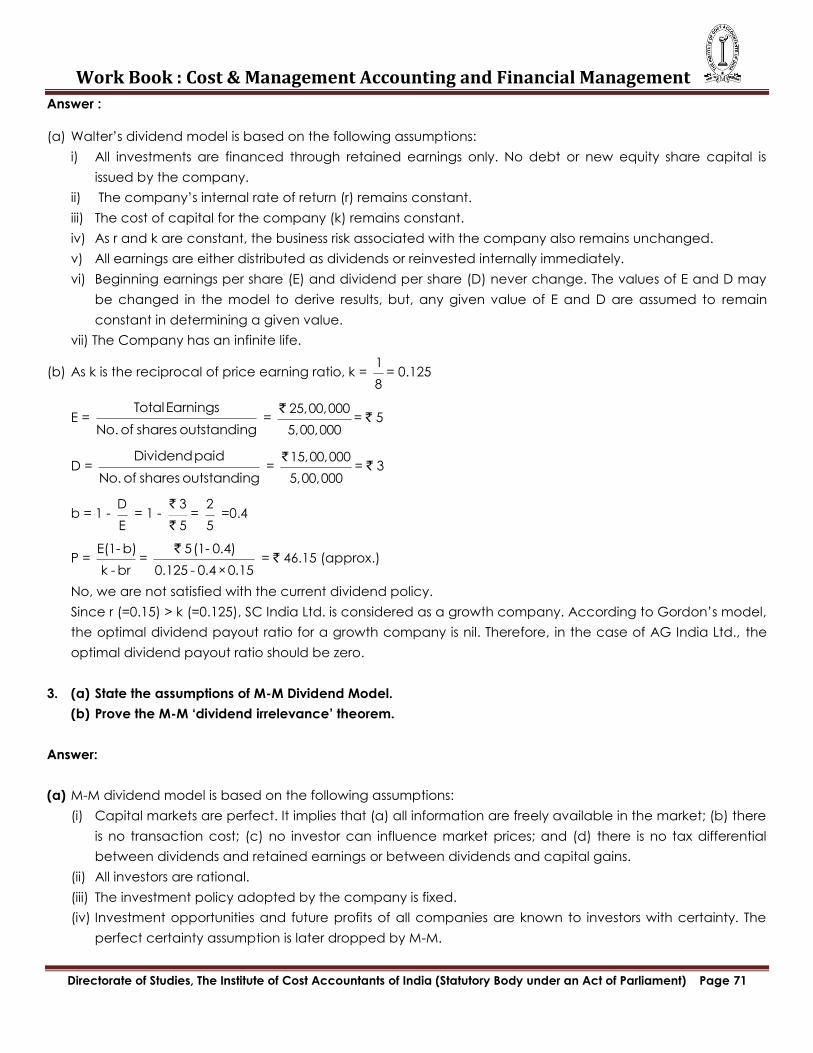
Work Book : Cost & Management Accounting and Financial Management
Directorate of Studies, The Institute of Cost Accountants of India (Statutory Body under an Act of Parliament) Page 71
Answer :
(a) Walter‘s dividend model is based on the following assumptions:
i) All investments are financed through retained earnings only. No debt or new equity share capital is
issued by the company.
ii) The company‘s internal rate of return (r) remains constant.
iii) The cost of capital for the company (k) remains constant.
iv) As r and k are constant, the business risk associated with the company also remains unchanged.
v) All earnings are either distributed as dividends or reinvested internally immediately.
vi) Beginning earnings per share (E) and dividend per share (D) never change. The values of E and D may
be changed in the model to derive results, but, any given value of E and D are assumed to remain
constant in determining a given value.
vii) The Company has an infinite life.
(b) As k is the reciprocal of price earning ratio, k = 1
8= 0.125
E = Total Earnings
No. of shares outstanding
= 25,00,000
5,00,000
`= ` 5
D = Dividend paid
No. of shares outstanding
= 15,00,000
5,00,000
`= ` 3
b = 1 - D
E
= 1 - 3
5
`
`=
2
5
=0.4
P = E(1 - b)
k - br=
5 (1 - 0.4)
0.125 - 0.4 × 0.15
`
= ` 46.15 (approx.)
No, we are not satisfied with the current dividend policy.
Since r (=0.15) > k (=0.125), SC India Ltd. is considered as a growth company. According to Gordon‘s model,
the optimal dividend payout ratio for a growth company is nil. Therefore, in the case of AG India Ltd., the
optimal dividend payout ratio should be zero.
3. (a) State the assumptions of M-M Dividend Model.
(b) Prove the M-M ‗dividend irrelevance‘ theorem.
Answer:
(a) M-M dividend model is based on the following assumptions:
(i) Capital markets are perfect. It implies that (a) all information are freely available in the market; (b) there
is no transaction cost; (c) no investor can influence market prices; and (d) there is no tax differential
between dividends and retained earnings or between dividends and capital gains.
(ii) All investors are rational.
(iii) The investment policy adopted by the company is fixed.
(iv) Investment opportunities and future profits of all companies are known to investors with certainty. The
perfect certainty assumption is later dropped by M-M.
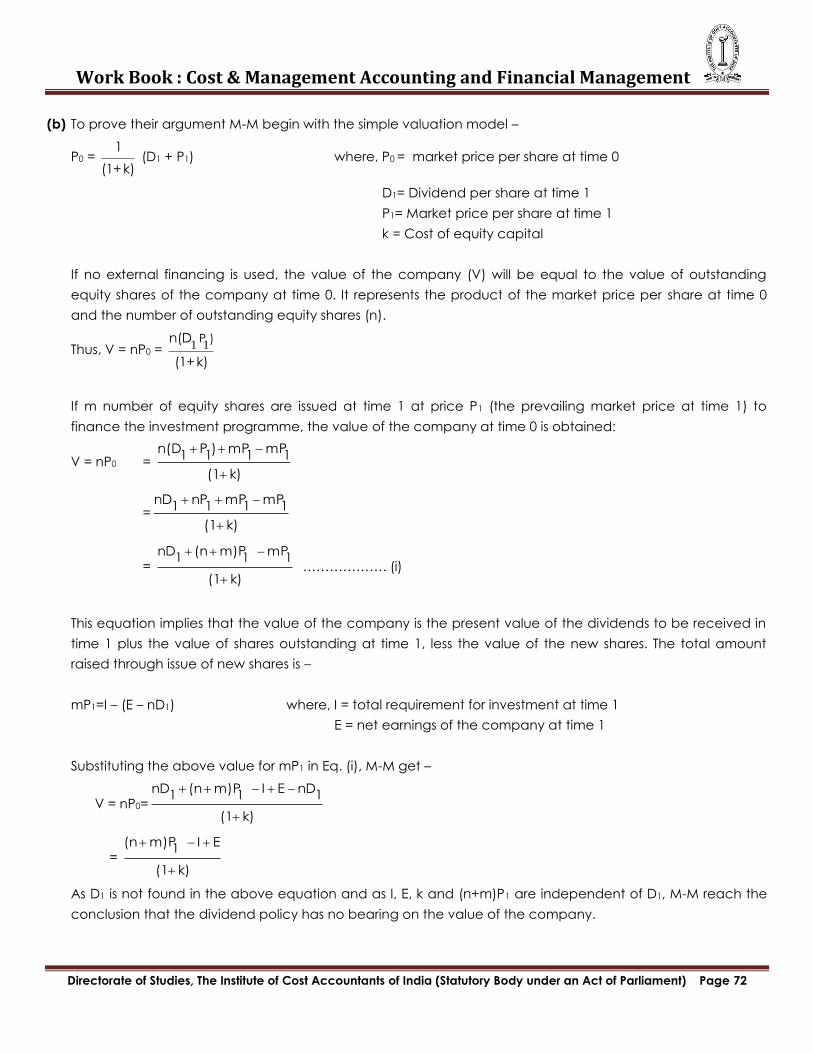
Work Book : Cost & Management Accounting and Financial Management
Directorate of Studies, The Institute of Cost Accountants of India (Statutory Body under an Act of Parliament) Page 72
(b) To prove their argument M-M begin with the simple valuation model –
P0 = 1
(1 + k) (D1 + P1) where, P0 = market price per share at time 0
D1= Dividend per share at time 1
P1= Market price per share at time 1
k = Cost of equity capital
If no external financing is used, the value of the company (V) will be equal to the value of outstanding
equity shares of the company at time 0. It represents the product of the market price per share at time 0
and the number of outstanding equity shares (n).
Thus, V = nP0 = 1 1 P )n(D
(1 + k)
If m number of equity shares are issued at time 1 at price P1 (the prevailing market price at time 1) to
finance the investment programme, the value of the company at time 0 is obtained:
V = nP0 = k)(1
1mP
1mP)
1P
1(Dn
=k)(1
1mP
1mP
1nP
1nD
= k)(1
1mP
1m)P(n
1nD
………………. (i)
This equation implies that the value of the company is the present value of the dividends to be received in
time 1 plus the value of shares outstanding at time 1, less the value of the new shares. The total amount
raised through issue of new shares is –
mP1=I – (E – nD1) where, I = total requirement for investment at time 1
E = net earnings of the company at time 1
Substituting the above value for mP1 in Eq. (i), M-M get –
V = nP0=k)(1
1nDEI
1m)P(n
1nD
= k)(1
EI1
m)P(n
As D1 is not found in the above equation and as I, E, k and (n+m)P1 are independent of D1, M-M reach the
conclusion that the dividend policy has no bearing on the value of the company.
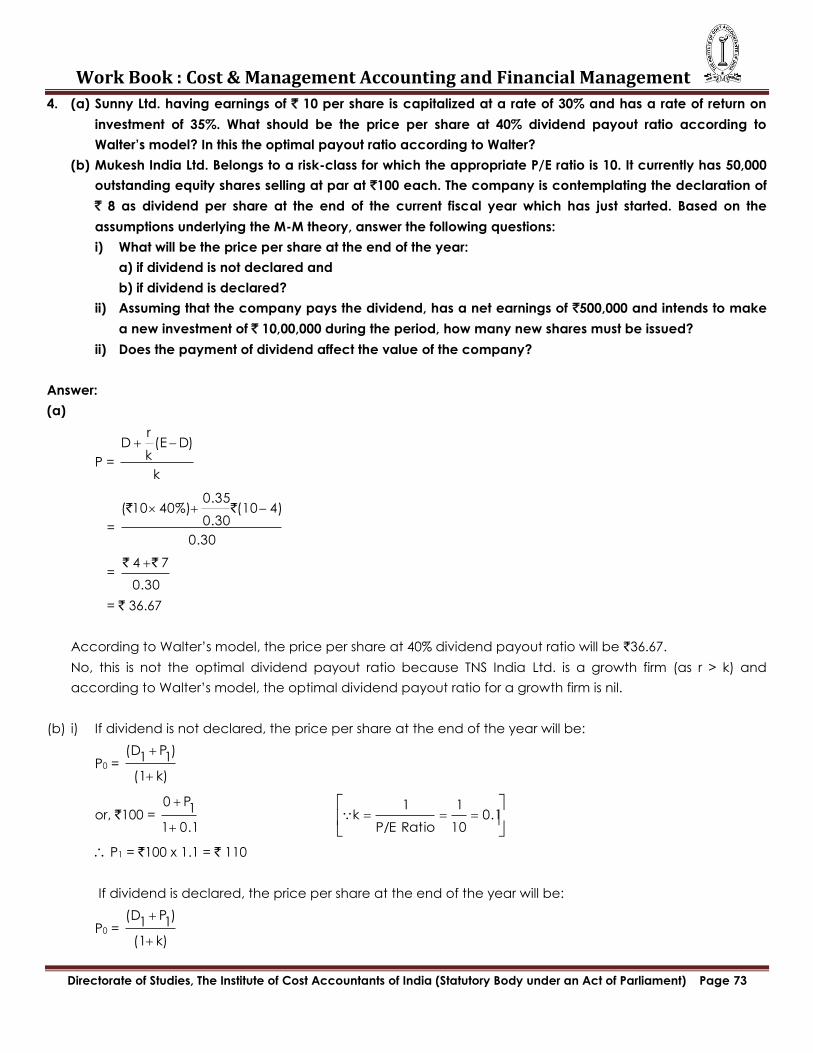
Work Book : Cost & Management Accounting and Financial Management
Directorate of Studies, The Institute of Cost Accountants of India (Statutory Body under an Act of Parliament) Page 73
4. (a) Sunny Ltd. having earnings of ` 10 per share is capitalized at a rate of 30% and has a rate of return on
investment of 35%. What should be the price per share at 40% dividend payout ratio according to
Walter‘s model? In this the optimal payout ratio according to Walter?
(b) Mukesh India Ltd. Belongs to a risk-class for which the appropriate P/E ratio is 10. It currently has 50,000
outstanding equity shares selling at par at `100 each. The company is contemplating the declaration of
` 8 as dividend per share at the end of the current fiscal year which has just started. Based on the
assumptions underlying the M-M theory, answer the following questions:
i) What will be the price per share at the end of the year:
a) if dividend is not declared and
b) if dividend is declared?
ii) Assuming that the company pays the dividend, has a net earnings of `500,000 and intends to make
a new investment of ` 10,00,000 during the period, how many new shares must be issued?
ii) Does the payment of dividend affect the value of the company?
Answer:
(a)
P = k
D)(Ek
rD
= 0.30
4)(100.30
0.3540%)10( ``
= 0.30
7 4 ``
= ` 36.67
According to Walter‘s model, the price per share at 40% dividend payout ratio will be `36.67.
No, this is not the optimal dividend payout ratio because TNS India Ltd. is a growth firm (as r > k) and
according to Walter‘s model, the optimal dividend payout ratio for a growth firm is nil.
(b) i) If dividend is not declared, the price per share at the end of the year will be:
P0 = k)(1
)1
P1
(D
or, `100 = 0.11
1P0
0.1
10
1
Ratio P/E
1k
P1 = `100 x 1.1 = ` 110
If dividend is declared, the price per share at the end of the year will be:
P0 = k)(1
)1
P1
(D
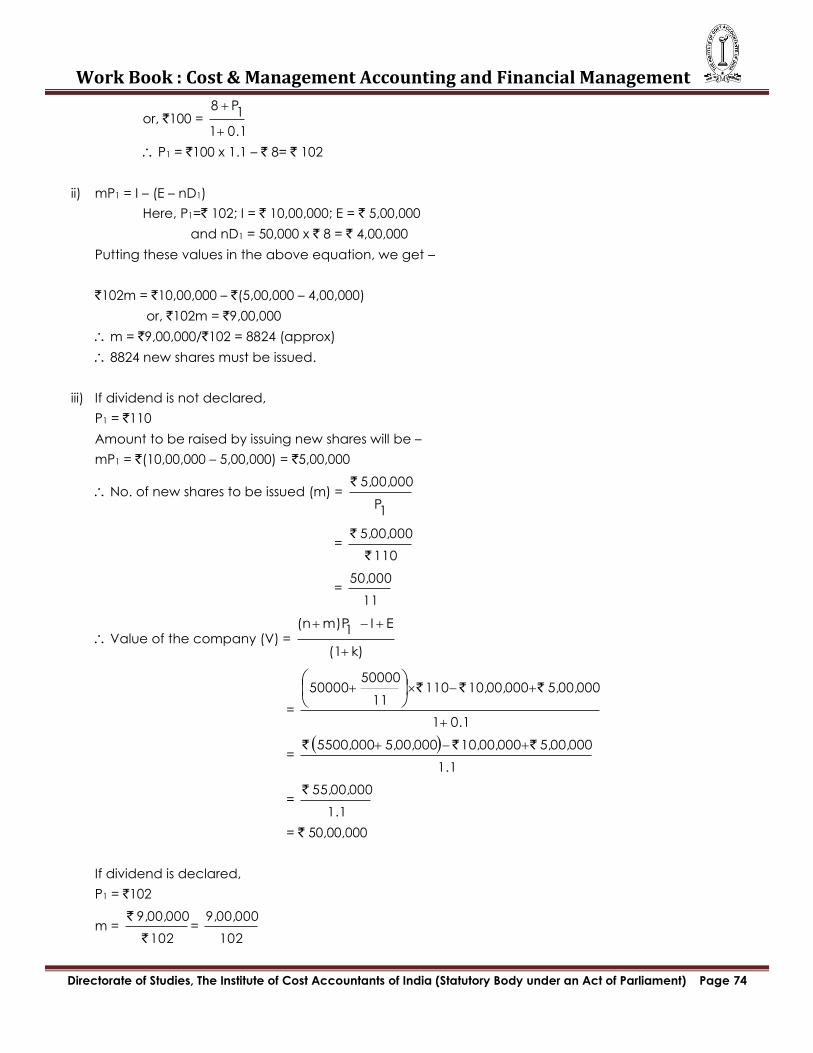
Work Book : Cost & Management Accounting and Financial Management
Directorate of Studies, The Institute of Cost Accountants of India (Statutory Body under an Act of Parliament) Page 74
or, `100 = 0.11
1P8
P1 = `100 x 1.1 – ` 8= ` 102
ii) mP1 = I – (E – nD1)
Here, P1=` 102; I = ` 10,00,000; E = ` 5,00,000
and nD1 = 50,000 x ` 8 = ` 4,00,000
Putting these values in the above equation, we get –
`102m = `10,00,000 – `(5,00,000 – 4,00,000)
or, `102m = `9,00,000
m = `9,00,000/`102 = 8824 (approx)
8824 new shares must be issued.
iii) If dividend is not declared,
P1 = `110
Amount to be raised by issuing new shares will be –
mP1 = `(10,00,000 – 5,00,000) = `5,00,000
No. of new shares to be issued (m) =
1P
5,00,000 `
= 110
5,00,000
`
`
= 11
50,000
Value of the company (V) = k)(1
EI1
m)P(n
= 0.11
5,00,00010,00,00011011
5000050000
` ` `
=
1.1
5,00,000 10,00,000 5,00,0005500,000 ```
= 1.1
55,00,000 `
= ` 50,00,000
If dividend is declared,
P1 = `102
m = 102
9,00,000
`
`=
102
9,00,000

Work Book : Cost & Management Accounting and Financial Management
Directorate of Studies, The Institute of Cost Accountants of India (Statutory Body under an Act of Parliament) Page 75
Value of the company (V) = k)(1
EI1
m)P(n
= 0.11
5,00,00010,00,000102102
9,00,00050000
```
=
1.1
5,00,00010,00,0009,00,0005100,000 ```
= 1.1
55,00,000`
= `50,00,000
Thus, the value of the company remains the same whether it declares dividend or not.
5. (a) Define cost of capital. Distinguish between explicit and implicit costs of capital.
(b) State the significance of cost of capital.
Answer:
(a) The term ‗cost of capital‘ can be defined in two ways. In operational terms, cost of capital is defined as
the discount rate that would be used in determining the present value of the estimated future cash
proceeds and eventually deciding whether the project is worth undertaking or not. In economic terms, cost
of capital is defined as the opportunity cost of the funds to be invested in a project where the opportunity
cost is quantified by the maximum expected rate of return from the next best alternative foregone.
When a firm raises its capital from any specific source, initially cash inflow arises and in future, a series of
cash outflows in respect of payment of periodic interest / dividend and repayment of principal amount
arise. The discount rate that equates the present value of the cash inflows with the present value of cash
outflows associated with any specific source of capital is called the explicit cost of that source of capital.
The implicit cost of capital represents the opportunity cost of capital. It implies the rate of return that can be
earned on the best alternative investment foregone. This kind of cost is associated with the use of capital.
So, whatever be the source of capital, each and every source of capital has its implicit cost.
(b) Cost of capital has a great significance in financial decisions. Specially, in capital budgeting and capital
structure decisions cost of capital plays a vital role. In the present value approach to capital budgeting
decisions, cost of capital is used as the discount rate for the purpose of measuring the net present value
(NPV) of the projects. In the profitability index approach to capital budgeting decisions, cost of capital is
applied in ascertaining the present value of future cash flows. In the internal rate of return (IRR) approach to
capital budgeting decisions, the computed IRR is compared with the cost of capital. It provides a yardstick
to measure the worth of investment proposals and also acts as an ‗accept-reject‘ criterion in capital
budgeting decisions. The concept of cost of capital also plays an important role in making capital structure
decisions. The cost of capital is influenced by changes in capital structure. In trying to achieve its target
capital structure overtime, a firm should aim at minimizing the cost of capital and maximizing the market
value of the firm.
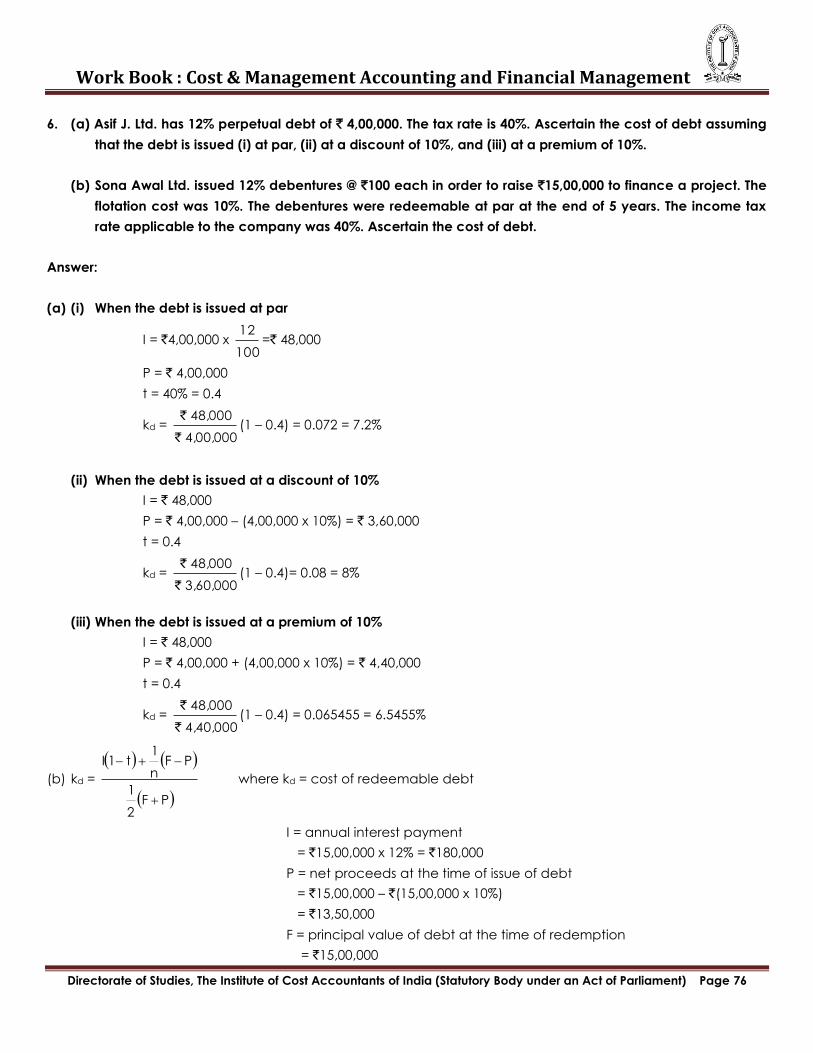
Work Book : Cost & Management Accounting and Financial Management
Directorate of Studies, The Institute of Cost Accountants of India (Statutory Body under an Act of Parliament) Page 76
6. (a) Asif J. Ltd. has 12% perpetual debt of ` 4,00,000. The tax rate is 40%. Ascertain the cost of debt assuming
that the debt is issued (i) at par, (ii) at a discount of 10%, and (iii) at a premium of 10%.
(b) Sona Awal Ltd. issued 12% debentures @ `100 each in order to raise `15,00,000 to finance a project. The
flotation cost was 10%. The debentures were redeemable at par at the end of 5 years. The income tax
rate applicable to the company was 40%. Ascertain the cost of debt.
Answer:
(a) (i) When the debt is issued at par
I = `4,00,000 x 100
12=` 48,000
P = ` 4,00,000
t = 40% = 0.4
kd = 4,00,000
48,000
`
` (1 – 0.4) = 0.072 = 7.2%
(ii) When the debt is issued at a discount of 10%
I = ` 48,000
P = ` 4,00,000 – (4,00,000 x 10%) = ` 3,60,000
t = 0.4
kd = 3,60,000
48,000
`
` (1 – 0.4)= 0.08 = 8%
(iii) When the debt is issued at a premium of 10%
I = ` 48,000
P = ` 4,00,000 + (4,00,000 x 10%) = ` 4,40,000
t = 0.4
kd = 4,40,000
48,000
`
` (1 – 0.4) = 0.065455 = 6.5455%
(b) kd =
PF2
1
PFn
1t1I
where kd = cost of redeemable debt
I = annual interest payment
= `15,00,000 x 12% = `180,000
P = net proceeds at the time of issue of debt
= `15,00,000 – `(15,00,000 x 10%)
= `13,50,000
F = principal value of debt at the time of redemption
= `15,00,000
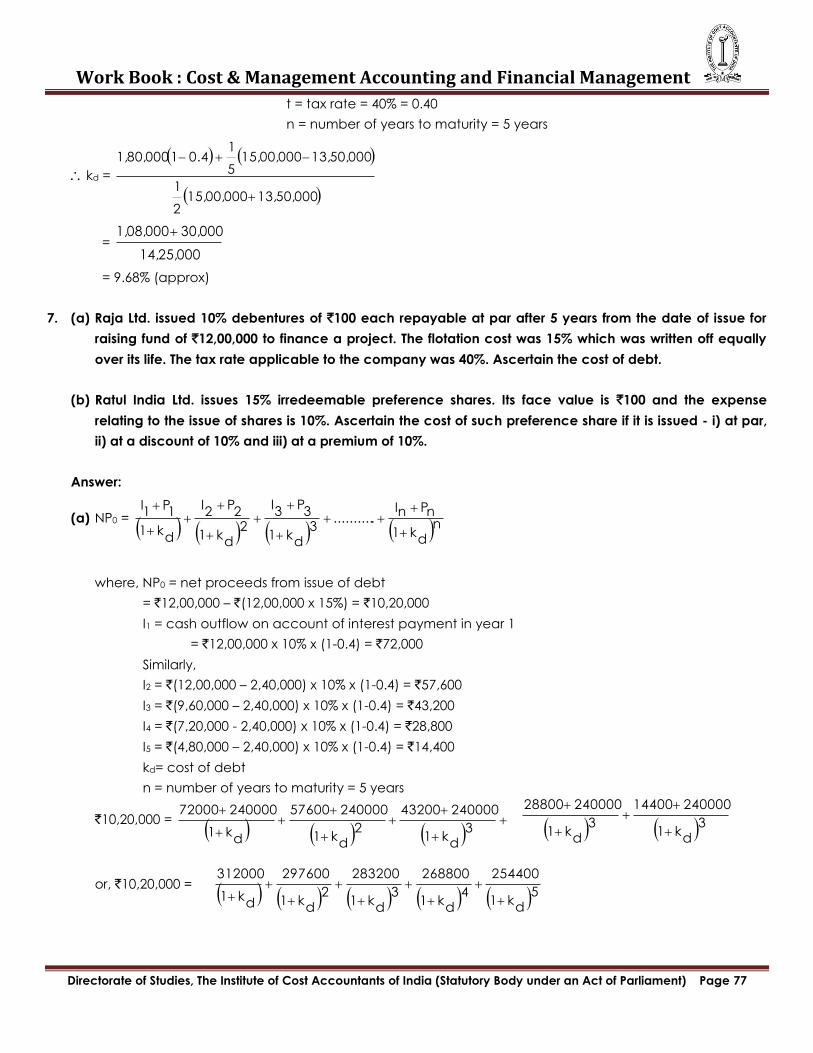
Work Book : Cost & Management Accounting and Financial Management
Directorate of Studies, The Institute of Cost Accountants of India (Statutory Body under an Act of Parliament) Page 77
t = tax rate = 40% = 0.40
n = number of years to maturity = 5 years
kd =
13,50,00015,00,0002
1
13,50,00015,00,0005
10.411,80,000
= 14,25,000
30,0001,08,000
= 9.68% (approx)
7. (a) Raja Ltd. issued 10% debentures of `100 each repayable at par after 5 years from the date of issue for
raising fund of `12,00,000 to finance a project. The flotation cost was 15% which was written off equally
over its life. The tax rate applicable to the company was 40%. Ascertain the cost of debt.
(b) Ratul India Ltd. issues 15% irredeemable preference shares. Its face value is `100 and the expense
relating to the issue of shares is 10%. Ascertain the cost of such preference share if it is issued - i) at par,
ii) at a discount of 10% and iii) at a premium of 10%.
Answer:
(a) NP0 = n
dk1
nPnI...........
3d
k1
3P
3I
2d
k1
2P
2I
dk1
1P
1I
where, NP0 = net proceeds from issue of debt
= `12,00,000 – `(12,00,000 x 15%) = `10,20,000
I1 = cash outflow on account of interest payment in year 1
= `12,00,000 x 10% x (1-0.4) = `72,000
Similarly,
I2 = `(12,00,000 – 2,40,000) x 10% x (1-0.4) = `57,600
I3 = `(9,60,000 – 2,40,000) x 10% x (1-0.4) = `43,200
I4 = `(7,20,000 - 2,40,000) x 10% x (1-0.4) = `28,800
I5 = `(4,80,000 – 2,40,000) x 10% x (1-0.4) = `14,400
kd= cost of debt
n = number of years to maturity = 5 years
`10,20,000 =
3d
k1
24000043200
2d
k1
24000057600
dk1
24000072000
or, `10,20,000 =
3d
k1
24000014400
3d
k1
24000028800
5d
k1
254400
4d
k1
268800
3d
k1
283200
2d
k1
297600
dk1
312000

Work Book : Cost & Management Accounting and Financial Management
Directorate of Studies, The Institute of Cost Accountants of India (Statutory Body under an Act of Parliament) Page 78
The value of kd can be ascertained by using the trial and error method with the help of present value
table in the following way –
Year Cash Outflow
`
At 12% rate At 13% rate
PV Factor Total PV ` PV Factor Total PV `
1
2
3
4
5
312000
297600
283200
268800
254400
0.893
0.797
0.712
0.636
0.567
278616.00
237187.20
201638.40
170956.80
144244.80
0.885
0.783
0.693
0.613
0.543
276120.00
233020.80
196257.60
164774.40
138139.20
1032643.20 1008312.00
By using simple interpolation we get –
kd = 12% +
%121310083121020000 10200001032643.20
1032643.20
``
`
= 12% +
%11168812643.20
12643.20
`
`
= 12 % + 0.519629 %
= 12.52% (approx.)
(b) Here, D = `100 x 15% = `15
i) When the shares are issued at par:
P = ` 100(1-10%) = `90
kp = P
D=
90
15
`
`= 16.67%
ii) When the shares are issued at a discount of 10%:
P = ` 90(1-10%) = `81
kp =P
D=
81
15
`
` = 18.52%
iii) When the shares are issued at premium of 10%:
P = ` 110(1-10%) = `99
kp = P
D=
99
15
`
`= 15.15%
8. (a) Derive the Dividend Growth Model for measurement of cost of equity.
(b) The current market price of an equity share of `100 is `150 and underwriting commission inclusive of all
costs of issue is 5% on issue price. The dividend per share paid for the last five years were as follows –
Year : 2012 2013 2014 2015 2016
` : 10.00 10.80 11.67 12.60 13.61
The company has a fixed dividend payout ratio and current growth in earnings and dividend is likely to
be maintained in future. Estimate the cost of equity.
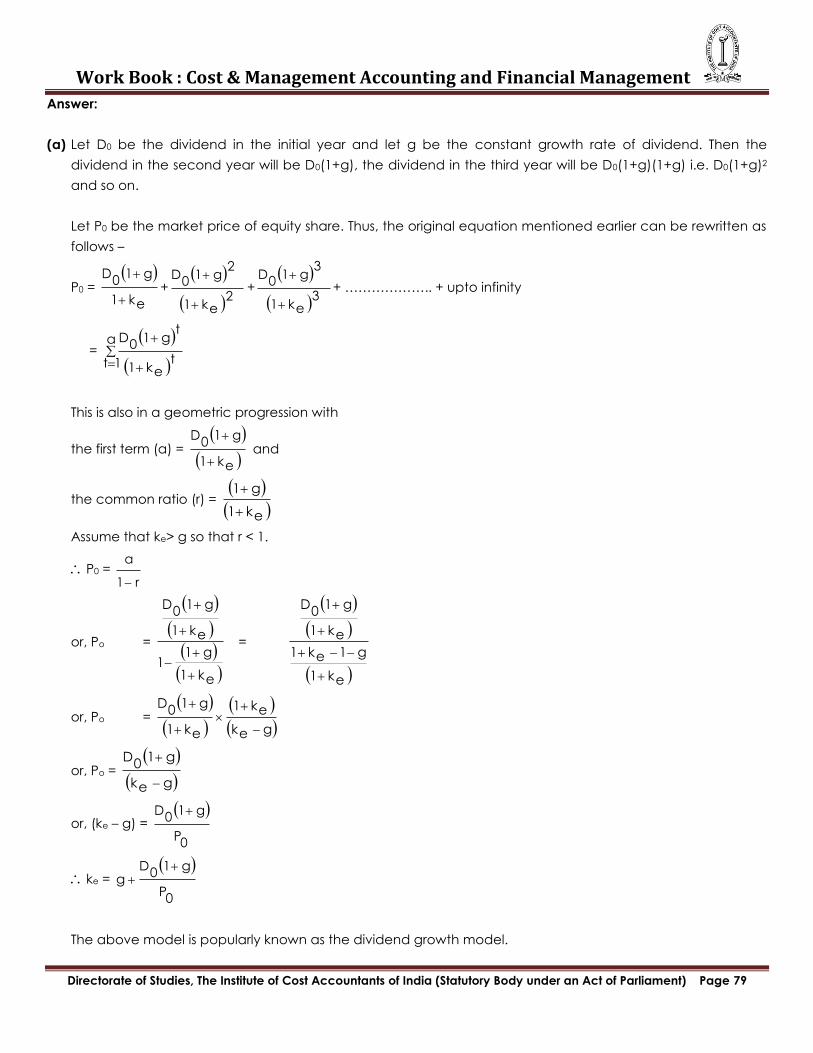
Work Book : Cost & Management Accounting and Financial Management
Directorate of Studies, The Institute of Cost Accountants of India (Statutory Body under an Act of Parliament) Page 79
Answer:
(a) Let D0 be the dividend in the initial year and let g be the constant growth rate of dividend. Then the
dividend in the second year will be D0(1+g), the dividend in the third year will be D0(1+g)(1+g) i.e. D0(1+g)2
and so on.
Let P0 be the market price of equity share. Thus, the original equation mentioned earlier can be rewritten as
follows –
P0 =
ek1
g10
D
+
2ek1
2g1
0D
+
3ek1
3g1
0D
+ ……………….. + upto infinity
=
α
1t tek1
tg1
0D
This is also in a geometric progression with
the first term (a) =
ek1
g10
D
and
the common ratio (r) = ek1
g1
Assume that ke> g so that r < 1.
P0 = r1
a
or, Po =
ek1
g11
ek1
g10
D
=
ek1
g1ek1
ek1
g10
D
or, Po =
gek
ek1
ek1
g10
D
or, Po =
gek
g10
D
or, (ke – g) =
0P
g10
D
ke =
0P
g10
Dg
The above model is popularly known as the dividend growth model.
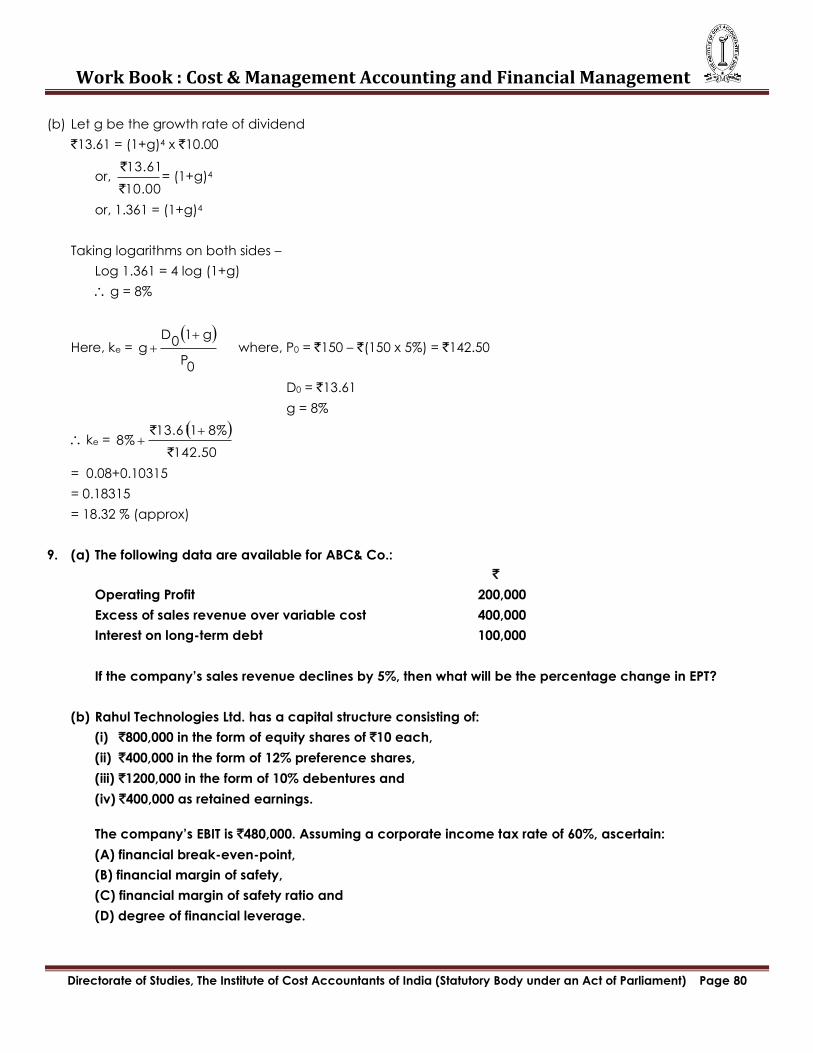
Work Book : Cost & Management Accounting and Financial Management
Directorate of Studies, The Institute of Cost Accountants of India (Statutory Body under an Act of Parliament) Page 80
(b) Let g be the growth rate of dividend
`13.61 = (1+g)4 x `10.00
or, 10.00
13.61
`
`= (1+g)4
or, 1.361 = (1+g)4
Taking logarithms on both sides –
Log 1.361 = 4 log (1+g)
g = 8%
Here, ke =
0P
g10
Dg
where, P0 = `150 – `(150 x 5%) = `142.50
D0 = `13.61
g = 8%
ke =
142.50
8%113.618%
`
`
= 0.08+0.10315
= 0.18315
= 18.32 % (approx)
9. (a) The following data are available for ABC& Co.:
`
Operating Profit 200,000
Excess of sales revenue over variable cost 400,000
Interest on long-term debt 100,000
If the company‘s sales revenue declines by 5%, then what will be the percentage change in EPT?
(b) Rahul Technologies Ltd. has a capital structure consisting of:
(i) `800,000 in the form of equity shares of `10 each,
(ii) `400,000 in the form of 12% preference shares,
(iii) ̀ 1200,000 in the form of 10% debentures and
(iv) `400,000 as retained earnings.
The company‘s EBIT is `480,000. Assuming a corporate income tax rate of 60%, ascertain:
(A) financial break-even-point,
(B) financial margin of safety,
(C) financial margin of safety ratio and
(D) degree of financial leverage.
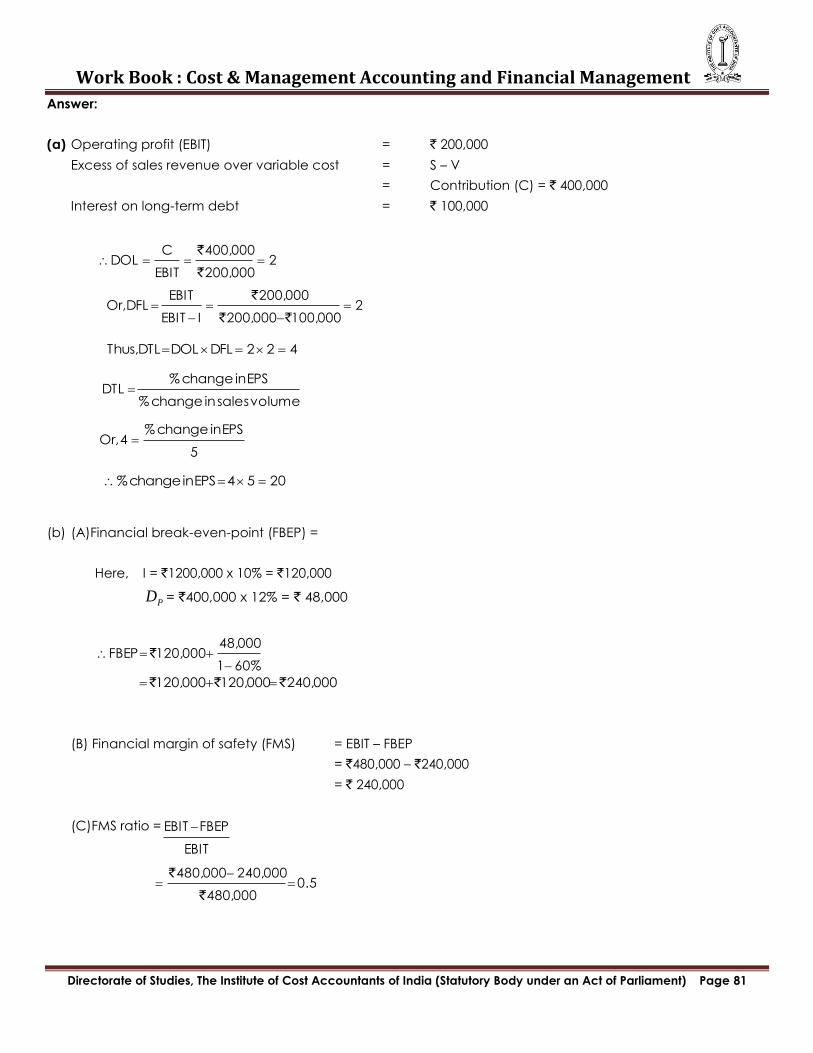
Work Book : Cost & Management Accounting and Financial Management
Directorate of Studies, The Institute of Cost Accountants of India (Statutory Body under an Act of Parliament) Page 81
Answer:
(a) Operating profit (EBIT) = ` 200,000
Excess of sales revenue over variable cost = S – V
= Contribution (C) = ` 400,000
Interest on long-term debt = ` 100,000
(b) (A)Financial break-even-point (FBEP) =
Here, I = `1200,000 x 10% = `120,000
PD = `400,000 x 12% = ` 48,000
(B) Financial margin of safety (FMS) = EBIT – FBEP
= `480,000 – `240,000
= ` 240,000
(C)FMS ratio =
2200,000
400,000
EBIT
CDOL
`
`
2100,000200,000
200,000
IEBIT
EBITDFLOr,
``
`
422DFLDOLDTLThus,
volumesalesinchange%
EPSinchange%DTL
5
EPSinchange%4Or,
2054EPSinchange%
60%1
48,000120,000FBEP
`
240,000120,000120,000 ```
EBIT
FBEPEBIT
0.5480,000
240,000480,000
`
`
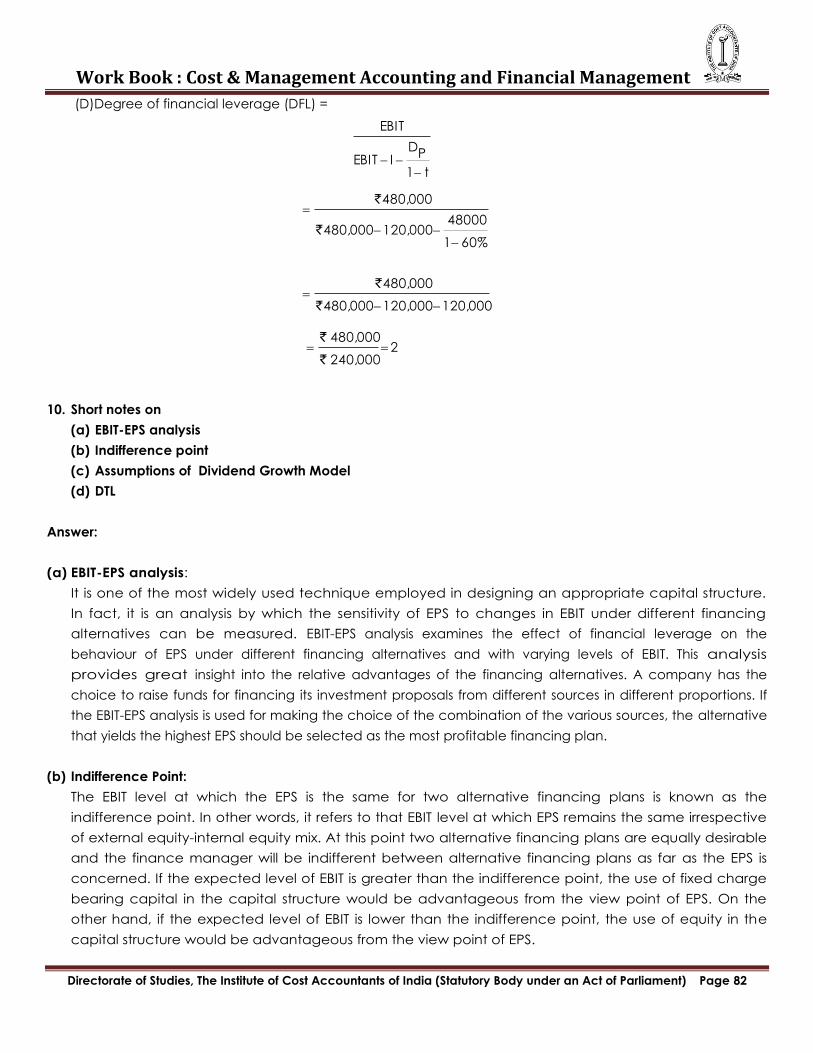
Work Book : Cost & Management Accounting and Financial Management
Directorate of Studies, The Institute of Cost Accountants of India (Statutory Body under an Act of Parliament) Page 82
(D)Degree of financial leverage (DFL) =
10. Short notes on
(a) EBIT-EPS analysis
(b) Indifference point
(c) Assumptions of Dividend Growth Model
(d) DTL
Answer:
(a) EBIT-EPS analysis:
It is one of the most widely used technique employed in designing an appropriate capital structure.
In fact, it is an analysis by which the sensitivity of EPS to changes in EBIT under different financing
alternatives can be measured. EBIT-EPS analysis examines the effect of financial leverage on the
behaviour of EPS under different financing alternatives and with varying levels of EBIT. This analysis
provides great insight into the relative advantages of the financing alternatives. A company has the
choice to raise funds for financing its investment proposals from different sources in different proportions. If
the EBIT-EPS analysis is used for making the choice of the combination of the various sources, the alternative
that yields the highest EPS should be selected as the most profitable financing plan.
(b) Indifference Point:
The EBIT level at which the EPS is the same for two alternative financing plans is known as the
indifference point. In other words, it refers to that EBIT level at which EPS remains the same irrespective
of external equity-internal equity mix. At this point two alternative financing plans are equally desirable
and the finance manager will be indifferent between alternative financing plans as far as the EPS is
concerned. If the expected level of EBIT is greater than the indifference point, the use of fixed charge
bearing capital in the capital structure would be advantageous from the view point of EPS. On the
other hand, if the expected level of EBIT is lower than the indifference point, the use of equity in the
capital structure would be advantageous from the view point of EPS.
t1
PD
IEBIT
EBIT
60%1
48000120,000480,000
480,000
`
`
120,000120,000480,000
480,000
`
`
2240,000
480,000
`
`
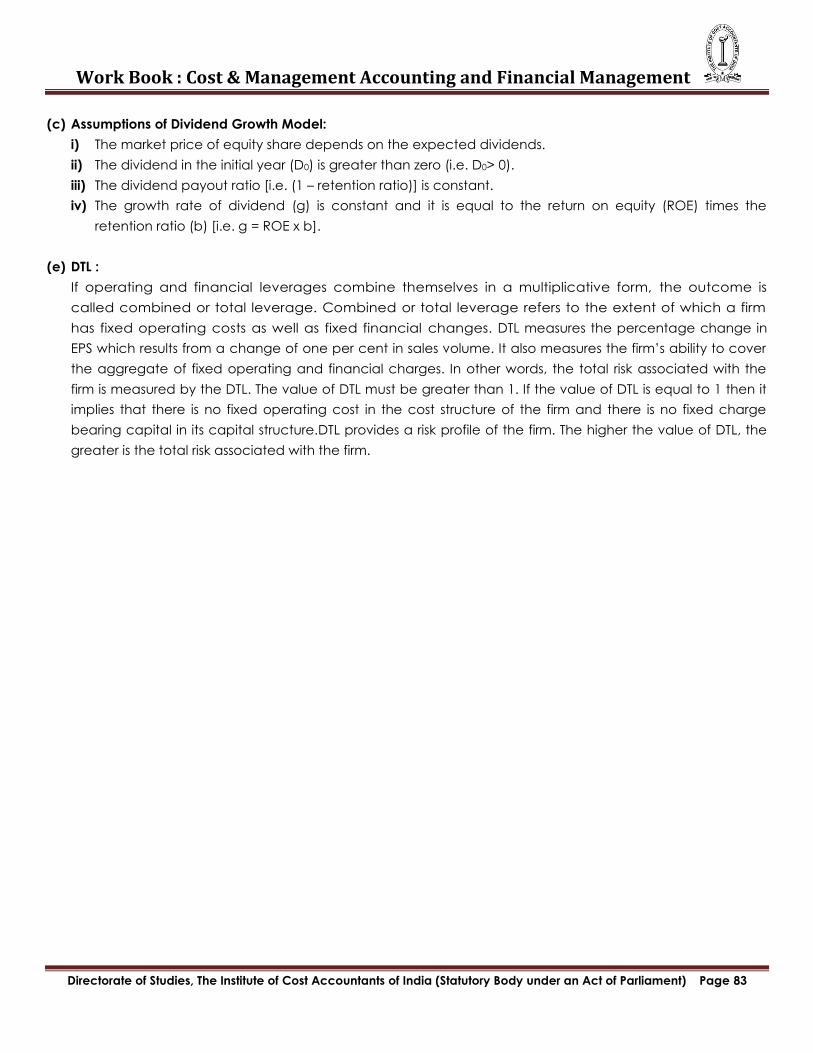
Work Book : Cost & Management Accounting and Financial Management
Directorate of Studies, The Institute of Cost Accountants of India (Statutory Body under an Act of Parliament) Page 83
(c) Assumptions of Dividend Growth Model:
i) The market price of equity share depends on the expected dividends.
ii) The dividend in the initial year (D0) is greater than zero (i.e. D0> 0).
iii) The dividend payout ratio [i.e. (1 – retention ratio)] is constant.
iv) The growth rate of dividend (g) is constant and it is equal to the return on equity (ROE) times the
retention ratio (b) [i.e. g = ROE x b].
(e) DTL :
If operating and financial leverages combine themselves in a multiplicative form, the outcome is
called combined or total leverage. Combined or total leverage refers to the extent of which a firm
has fixed operating costs as well as fixed financial changes. DTL measures the percentage change in
EPS which results from a change of one per cent in sales volume. It also measures the firm‘s ability to cover
the aggregate of fixed operating and financial charges. In other words, the total risk associated with the
firm is measured by the DTL. The value of DTL must be greater than 1. If the value of DTL is equal to 1 then it
implies that there is no fixed operating cost in the cost structure of the firm and there is no fixed charge
bearing capital in its capital structure.DTL provides a risk profile of the firm. The higher the value of DTL, the
greater is the total risk associated with the firm.
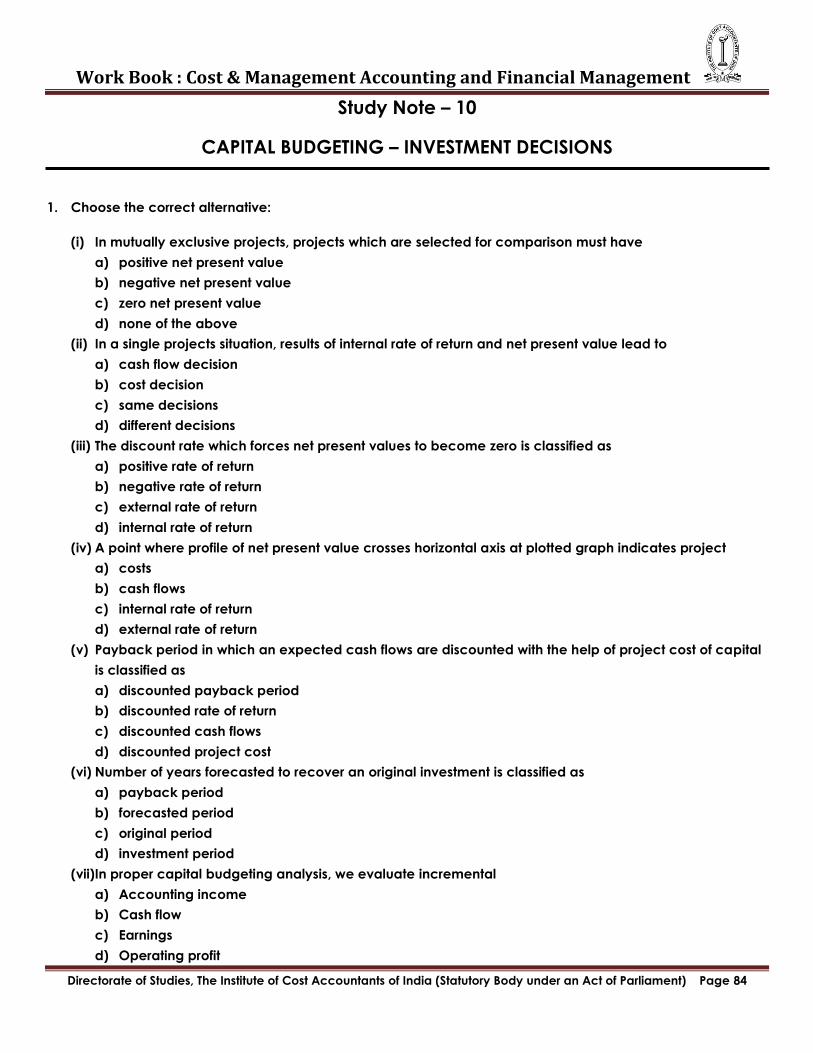
Work Book : Cost & Management Accounting and Financial Management
Directorate of Studies, The Institute of Cost Accountants of India (Statutory Body under an Act of Parliament) Page 84
Study Note – 10
CAPITAL BUDGETING – INVESTMENT DECISIONS
1. Choose the correct alternative:
(i) In mutually exclusive projects, projects which are selected for comparison must have
a) positive net present value
b) negative net present value
c) zero net present value
d) none of the above
(ii) In a single projects situation, results of internal rate of return and net present value lead to
a) cash flow decision
b) cost decision
c) same decisions
d) different decisions
(iii) The discount rate which forces net present values to become zero is classified as
a) positive rate of return
b) negative rate of return
c) external rate of return
d) internal rate of return
(iv) A point where profile of net present value crosses horizontal axis at plotted graph indicates project
a) costs
b) cash flows
c) internal rate of return
d) external rate of return
(v) Payback period in which an expected cash flows are discounted with the help of project cost of capital
is classified as
a) discounted payback period
b) discounted rate of return
c) discounted cash flows
d) discounted project cost
(vi) Number of years forecasted to recover an original investment is classified as
a) payback period
b) forecasted period
c) original period
d) investment period
(vii)In proper capital budgeting analysis, we evaluate incremental
a) Accounting income
b) Cash flow
c) Earnings
d) Operating profit

Work Book : Cost & Management Accounting and Financial Management
Directorate of Studies, The Institute of Cost Accountants of India (Statutory Body under an Act of Parliament) Page 85
(viii)The term mutually exclusive investments mean:
(a) Choose only the best investments.
(b) Selection of one investment precludes the selection of an alternative.
(c) The elite investment opportunities will get chosen.
(d) There are no investment options available.
Solution: (i) (a); (ii) (c); (iii) (d); (iv) (c); (v) (a); (vi) (a); (vii) (b);
(viii) (b).
11. State true or false:
(i) When NPV is zero PI will be one.
(ii) In case the IRR of a project is higher than the cost of capital, NPV will be positive.
(iii) In calculating Discounted Payback Period, IRR is used as the discounting rate.
(iv) IRR is also known as the highest opportunity cost that the project can bear.
(v) Accounting Rate of Return (ARR) method does not consider time value of money.
Solution: (i) True; (ii) True; (iii) False; (iv) True; (v) True.
12. Match the following:
A ARR method I Assumes that reinvestment rate is IRR
B Cost of capital II Is used when projects differ in terms of investment
C PI method III is known as minimum required rate of return
D IRR method IV Consistent with the objective of wealth maximization
E NPV V Does not consider time value of money
Solution: A. V; B. III; C. II; D. I; E. IV
4. X and Co. intends to invest ` 10 lakh in a project having a life of 4 years. The cash inflows from the project at
the end of year one to the fourth year are expected as ` 3,00,000, ` 4,20,000, ` 4,00,000 and ` 3,30,000
before charging depreciation and tax. You are required to calculate the Accounting Rate of Return of the
project and comment on the use of the rate of return. Tax rate is 50%.
Solution:
Accounting or Average Rate of Return (ARR) = Average Annual Profit after Tax
Average Investment×100
Where, Average annual profit after tax = Total Profit after depreciation and tax throughout the life
Project Life
and, Average Investment = Initial Investment + Salavge Value
2
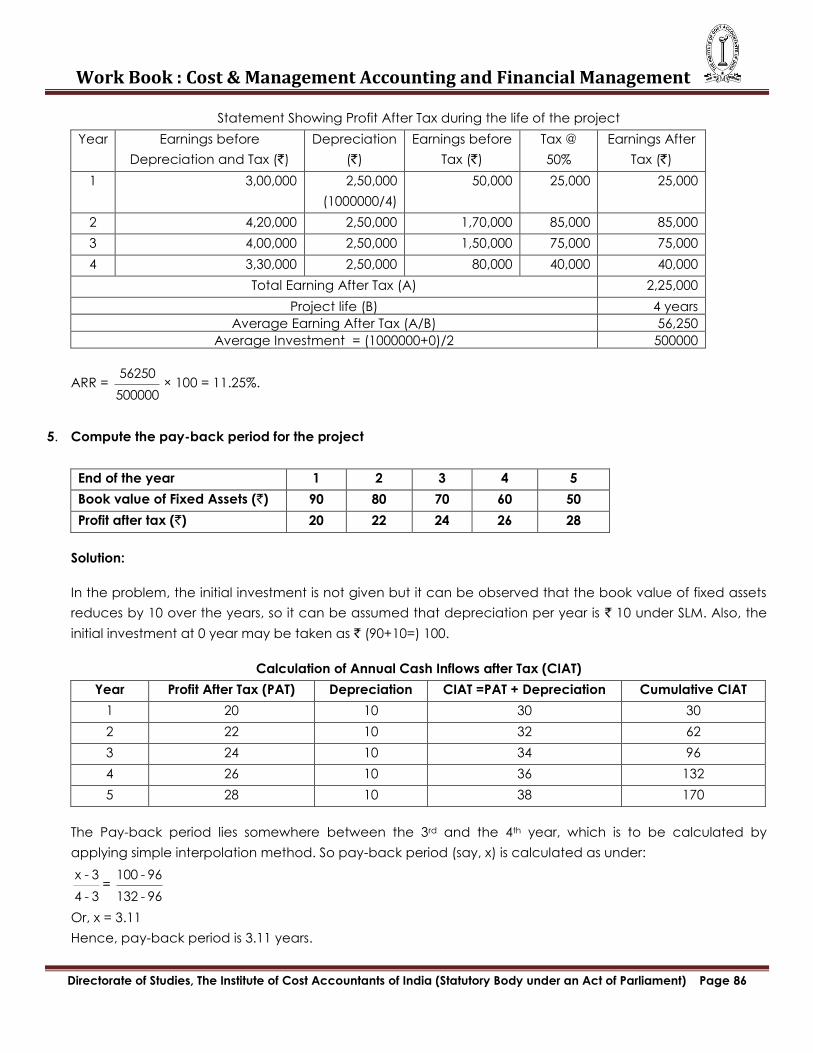
Work Book : Cost & Management Accounting and Financial Management
Directorate of Studies, The Institute of Cost Accountants of India (Statutory Body under an Act of Parliament) Page 86
Statement Showing Profit After Tax during the life of the project
Year Earnings before
Depreciation and Tax (`)
Depreciation
(`)
Earnings before
Tax (`)
Tax @
50%
Earnings After
Tax (`)
1 3,00,000 2,50,000
(1000000/4)
50,000 25,000 25,000
2 4,20,000 2,50,000 1,70,000 85,000 85,000
3 4,00,000 2,50,000 1,50,000 75,000 75,000
4 3,30,000 2,50,000 80,000 40,000 40,000
Total Earning After Tax (A) 2,25,000
Project life (B) 4 years
Average Earning After Tax (A/B) 56,250
Average Investment = (1000000+0)/2 500000
ARR = 56250
500000× 100 = 11.25%.
5. Compute the pay-back period for the project
End of the year 1 2 3 4 5
Book value of Fixed Assets (`) 90 80 70 60 50
Profit after tax (`) 20 22 24 26 28
Solution:
In the problem, the initial investment is not given but it can be observed that the book value of fixed assets
reduces by 10 over the years, so it can be assumed that depreciation per year is ` 10 under SLM. Also, the
initial investment at 0 year may be taken as ` (90+10=) 100.
Calculation of Annual Cash Inflows after Tax (CIAT)
Year Profit After Tax (PAT) Depreciation CIAT =PAT + Depreciation Cumulative CIAT
1 20 10 30 30
2 22 10 32 62
3 24 10 34 96
4 26 10 36 132
5 28 10 38 170
The Pay-back period lies somewhere between the 3rd and the 4th year, which is to be calculated by
applying simple interpolation method. So pay-back period (say, x) is calculated as under:
x - 3
4 - 3=
100 - 96
132 - 96
Or, x = 3.11
Hence, pay-back period is 3.11 years.
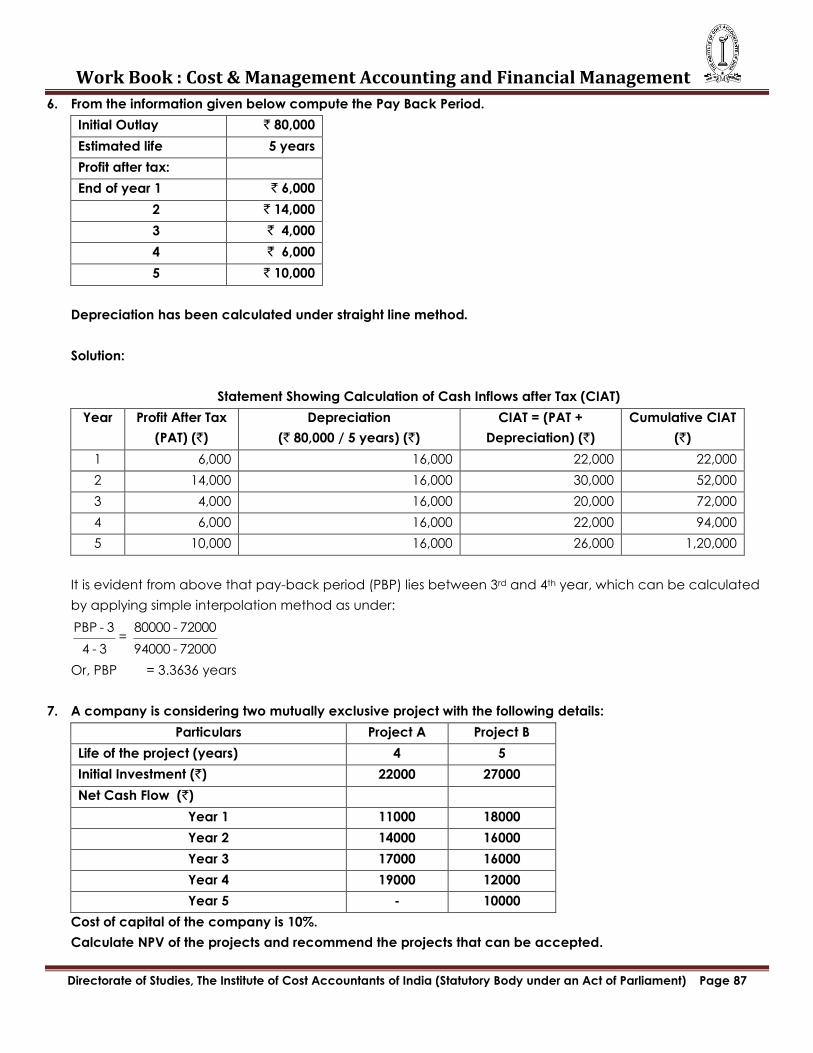
Work Book : Cost & Management Accounting and Financial Management
Directorate of Studies, The Institute of Cost Accountants of India (Statutory Body under an Act of Parliament) Page 87
6. From the information given below compute the Pay Back Period.
Initial Outlay ` 80,000
Estimated life 5 years
Profit after tax:
End of year 1 ` 6,000
2 ` 14,000
3 ` 4,000
4 ` 6,000
5 ` 10,000
Depreciation has been calculated under straight line method.
Solution:
Statement Showing Calculation of Cash Inflows after Tax (CIAT)
Year Profit After Tax
(PAT) (`)
Depreciation
(` 80,000 / 5 years) (`)
CIAT = (PAT +
Depreciation) (`)
Cumulative CIAT
(`)
1 6,000 16,000 22,000 22,000
2 14,000 16,000 30,000 52,000
3 4,000 16,000 20,000 72,000
4 6,000 16,000 22,000 94,000
5 10,000 16,000 26,000 1,20,000
It is evident from above that pay-back period (PBP) lies between 3rd and 4th year, which can be calculated
by applying simple interpolation method as under:
PBP - 3
4 - 3=
80000 - 72000
94000 - 72000
Or, PBP = 3.3636 years
7. A company is considering two mutually exclusive project with the following details:
Particulars Project A Project B
Life of the project (years) 4 5
Initial Investment (`) 22000 27000
Net Cash Flow (`)
Year 1 11000 18000
Year 2 14000 16000
Year 3 17000 16000
Year 4 19000 12000
Year 5 - 10000
Cost of capital of the company is 10%.
Calculate NPV of the projects and recommend the projects that can be accepted.
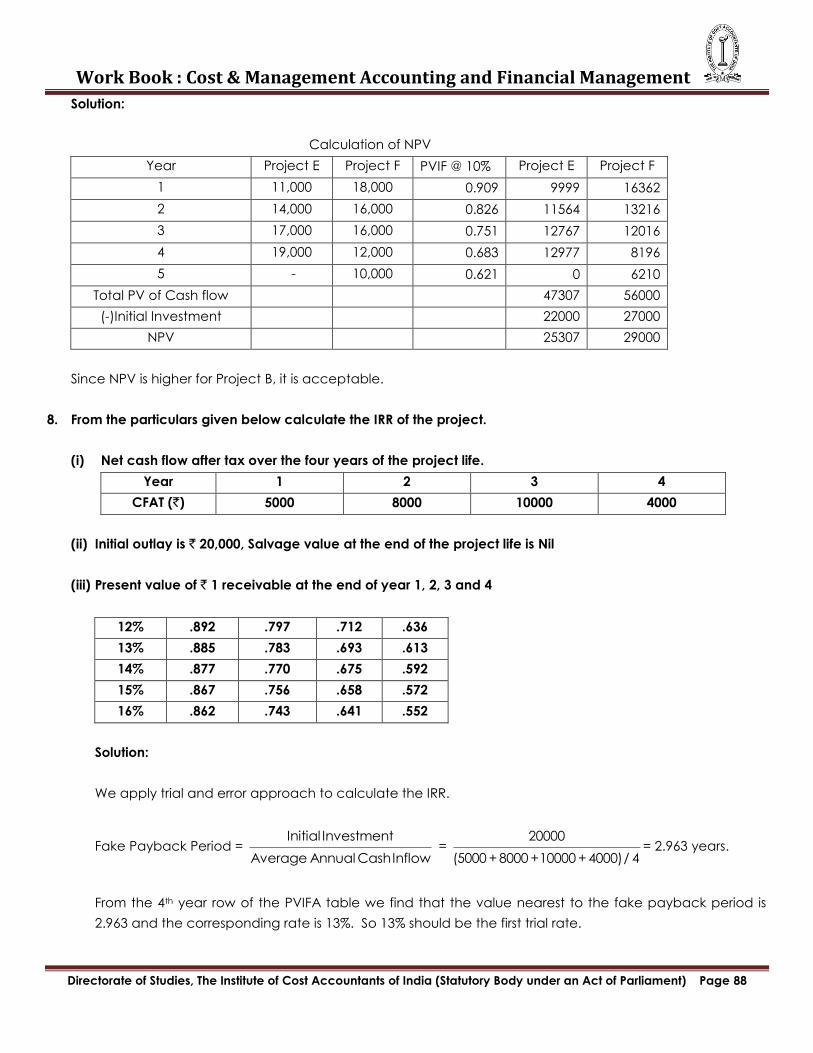
Work Book : Cost & Management Accounting and Financial Management
Directorate of Studies, The Institute of Cost Accountants of India (Statutory Body under an Act of Parliament) Page 88
Solution:
Calculation of NPV
Year Project E Project F PVIF @ 10% Project E Project F
1 11,000 18,000 0.909 9999 16362
2 14,000 16,000 0.826 11564 13216
3 17,000 16,000 0.751 12767 12016
4 19,000 12,000 0.683 12977 8196
5 - 10,000 0.621 0 6210
Total PV of Cash flow 47307 56000
(-)Initial Investment 22000 27000
NPV 25307 29000
Since NPV is higher for Project B, it is acceptable.
8. From the particulars given below calculate the IRR of the project.
(i) Net cash flow after tax over the four years of the project life.
Year 1 2 3 4
CFAT (`) 5000 8000 10000 4000
(ii) Initial outlay is ` 20,000, Salvage value at the end of the project life is Nil
(iii) Present value of ` 1 receivable at the end of year 1, 2, 3 and 4
12% .892 .797 .712 .636
13% .885 .783 .693 .613
14% .877 .770 .675 .592
15% .867 .756 .658 .572
16% .862 .743 .641 .552
Solution:
We apply trial and error approach to calculate the IRR.
Fake Payback Period = Initial Investment
Average Annual Cash Inflow =
20000
(5000 + 8000 +10000 + 4000)/ 4= 2.963 years.
From the 4th year row of the PVIFA table we find that the value nearest to the fake payback period is
2.963 and the corresponding rate is 13%. So 13% should be the first trial rate.
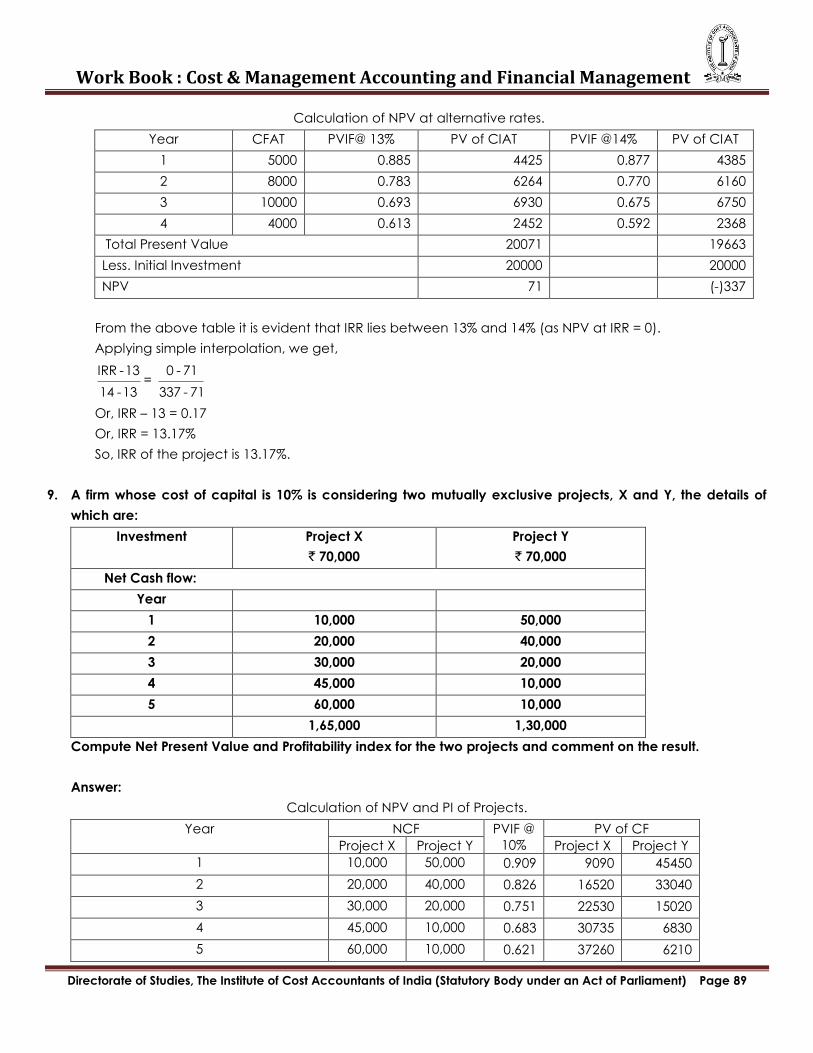
Work Book : Cost & Management Accounting and Financial Management
Directorate of Studies, The Institute of Cost Accountants of India (Statutory Body under an Act of Parliament) Page 89
Calculation of NPV at alternative rates.
Year CFAT PVIF@ 13% PV of CIAT PVIF @14% PV of CIAT
1 5000 0.885 4425 0.877 4385
2 8000 0.783 6264 0.770 6160
3 10000 0.693 6930 0.675 6750
4 4000 0.613 2452 0.592 2368
Total Present Value 20071 19663
Less. Initial Investment 20000
20000
NPV 71
(-)337
From the above table it is evident that IRR lies between 13% and 14% (as NPV at IRR = 0).
Applying simple interpolation, we get,
IRR - 13
14 - 13=
0 - 71
337 - 71
Or, IRR – 13 = 0.17
Or, IRR = 13.17%
So, IRR of the project is 13.17%.
9. A firm whose cost of capital is 10% is considering two mutually exclusive projects, X and Y, the details of
which are:
Investment Project X
` 70,000
Project Y
` 70,000
Net Cash flow:
Year
1 10,000 50,000
2 20,000 40,000
3 30,000 20,000
4 45,000 10,000
5 60,000 10,000
1,65,000 1,30,000
Compute Net Present Value and Profitability index for the two projects and comment on the result.
Answer:
Calculation of NPV and PI of Projects.
Year NCF PVIF @
10%
PV of CF
Project X Project Y Project X Project Y
1 10,000 50,000 0.909 9090 45450
2 20,000 40,000 0.826 16520 33040
3 30,000 20,000 0.751 22530 15020
4 45,000 10,000 0.683 30735 6830
5 60,000 10,000 0.621 37260 6210
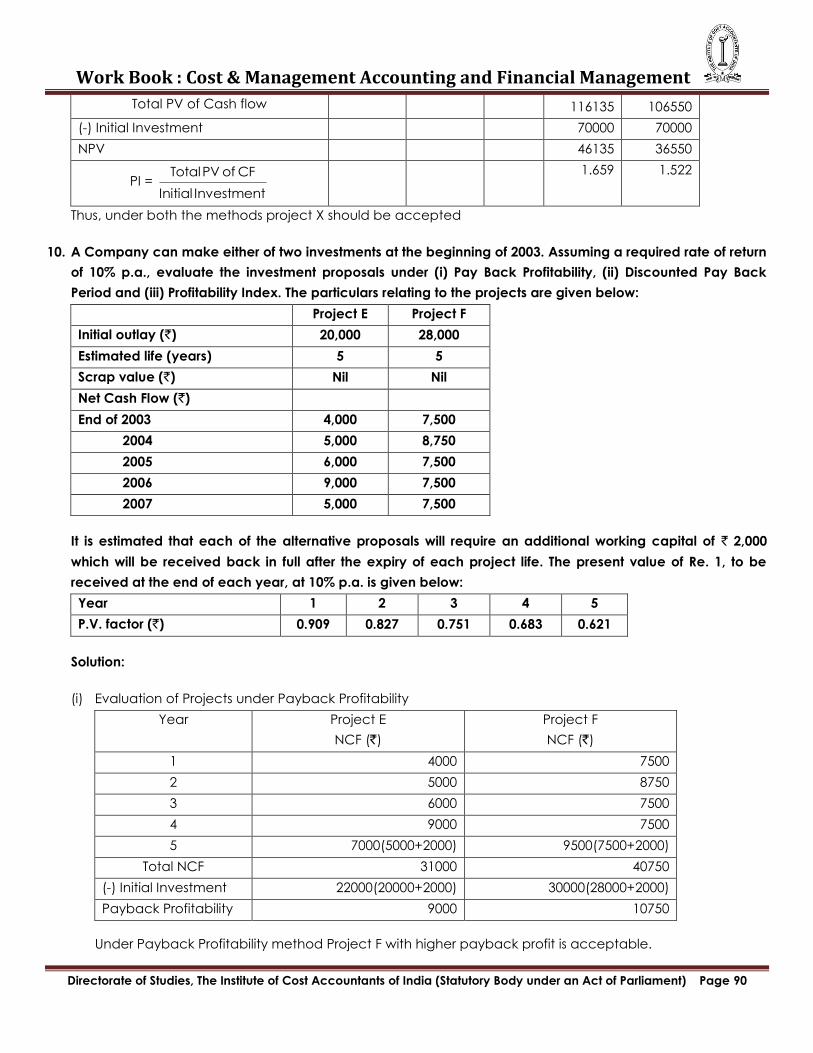
Work Book : Cost & Management Accounting and Financial Management
Directorate of Studies, The Institute of Cost Accountants of India (Statutory Body under an Act of Parliament) Page 90
Total PV of Cash flow 116135 106550
(-) Initial Investment 70000 70000
NPV 46135 36550
PI = Total PV of CF
Initial Investment
1.659 1.522
Thus, under both the methods project X should be accepted
10. A Company can make either of two investments at the beginning of 2003. Assuming a required rate of return
of 10% p.a., evaluate the investment proposals under (i) Pay Back Profitability, (ii) Discounted Pay Back
Period and (iii) Profitability Index. The particulars relating to the projects are given below:
Project E Project F
Initial outlay (`) 20,000 28,000
Estimated life (years) 5 5
Scrap value (`) Nil Nil
Net Cash Flow (`)
End of 2003 4,000 7,500
2004 5,000 8,750
2005 6,000 7,500
2006 9,000 7,500
2007 5,000 7,500
It is estimated that each of the alternative proposals will require an additional working capital of ` 2,000
which will be received back in full after the expiry of each project life. The present value of Re. 1, to be
received at the end of each year, at 10% p.a. is given below:
Year 1 2 3 4 5
P.V. factor (`) 0.909 0.827 0.751 0.683 0.621
Solution:
(i) Evaluation of Projects under Payback Profitability
Year Project E
NCF (`)
Project F
NCF (`)
1 4000 7500
2 5000 8750
3 6000 7500
4 9000 7500
5 7000(5000+2000) 9500(7500+2000)
Total NCF 31000 40750
(-) Initial Investment 22000(20000+2000) 30000(28000+2000)
Payback Profitability 9000 10750
Under Payback Profitability method Project F with higher payback profit is acceptable.
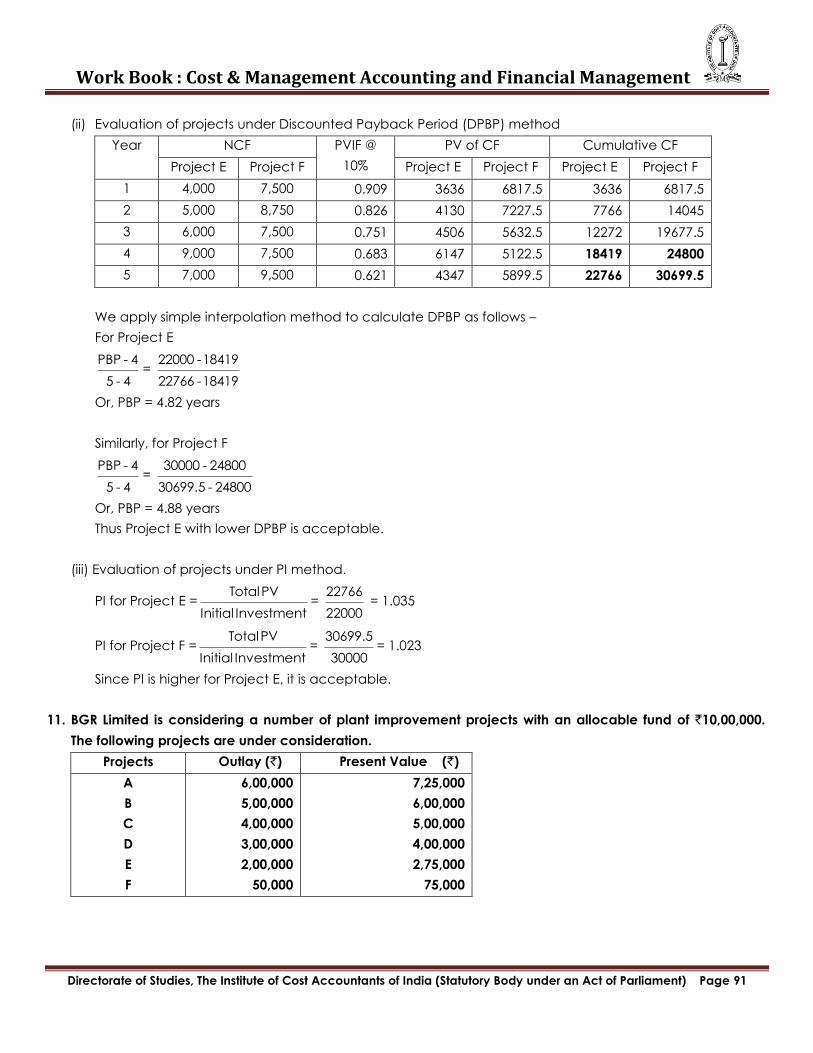
Work Book : Cost & Management Accounting and Financial Management
Directorate of Studies, The Institute of Cost Accountants of India (Statutory Body under an Act of Parliament) Page 91
(ii) Evaluation of projects under Discounted Payback Period (DPBP) method
Year NCF PVIF @
10%
PV of CF Cumulative CF
Project E Project F Project E Project F Project E Project F
1 4,000 7,500 0.909 3636 6817.5 3636 6817.5
2 5,000 8,750 0.826 4130 7227.5 7766 14045
3 6,000 7,500 0.751 4506 5632.5 12272 19677.5
4 9,000 7,500 0.683 6147 5122.5 18419 24800
5 7,000 9,500 0.621 4347 5899.5 22766 30699.5
We apply simple interpolation method to calculate DPBP as follows –
For Project E
PBP - 4
5 - 4=
22000 - 18419
22766 - 18419
Or, PBP = 4.82 years
Similarly, for Project F
PBP - 4
5 - 4=
30000 - 24800
30699.5 - 24800
Or, PBP = 4.88 years
Thus Project E with lower DPBP is acceptable.
(iii) Evaluation of projects under PI method.
PI for Project E =Total PV
Initial Investment=
22766
22000 = 1.035
PI for Project F =Total PV
Initial Investment=
30699.5
30000= 1.023
Since PI is higher for Project E, it is acceptable.
11. BGR Limited is considering a number of plant improvement projects with an allocable fund of `10,00,000.
The following projects are under consideration.
Projects Outlay (`) Present Value (`)
A
B
C
D
E
F
6,00,000
5,00,000
4,00,000
3,00,000
2,00,000
50,000
7,25,000
6,00,000
5,00,000
4,00,000
2,75,000
75,000
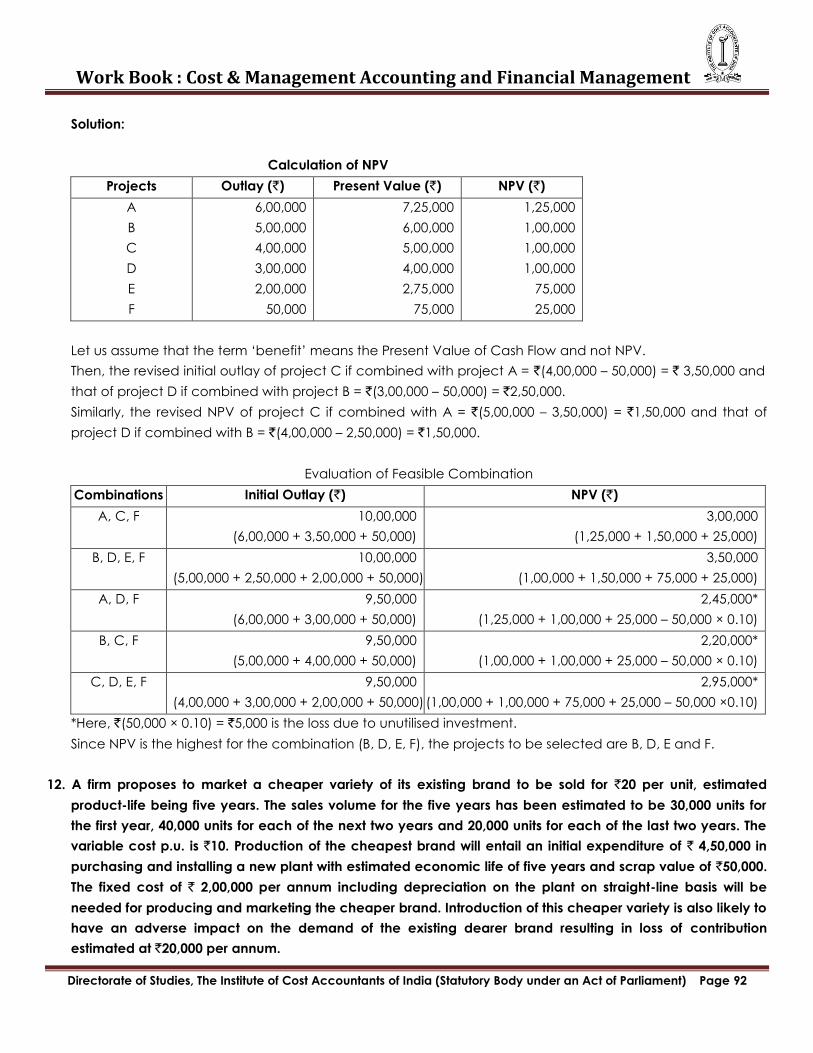
Work Book : Cost & Management Accounting and Financial Management
Directorate of Studies, The Institute of Cost Accountants of India (Statutory Body under an Act of Parliament) Page 92
Solution:
Calculation of NPV
Projects Outlay (`) Present Value (`) NPV (`)
A
B
C
D
E
F
6,00,000
5,00,000
4,00,000
3,00,000
2,00,000
50,000
7,25,000
6,00,000
5,00,000
4,00,000
2,75,000
75,000
1,25,000
1,00,000
1,00,000
1,00,000
75,000
25,000
Let us assume that the term ‗benefit‘ means the Present Value of Cash Flow and not NPV.
Then, the revised initial outlay of project C if combined with project A = `(4,00,000 – 50,000) = ` 3,50,000 and
that of project D if combined with project B = `(3,00,000 – 50,000) = `2,50,000.
Similarly, the revised NPV of project C if combined with A = `(5,00,000 – 3,50,000) = `1,50,000 and that of
project D if combined with B = `(4,00,000 – 2,50,000) = `1,50,000.
Evaluation of Feasible Combination
Combinations Initial Outlay (`) NPV (`)
A, C, F 10,00,000
(6,00,000 + 3,50,000 + 50,000)
3,00,000
(1,25,000 + 1,50,000 + 25,000)
B, D, E, F 10,00,000
(5,00,000 + 2,50,000 + 2,00,000 + 50,000)
3,50,000
(1,00,000 + 1,50,000 + 75,000 + 25,000)
A, D, F 9,50,000
(6,00,000 + 3,00,000 + 50,000)
2,45,000*
(1,25,000 + 1,00,000 + 25,000 – 50,000 × 0.10)
B, C, F 9,50,000
(5,00,000 + 4,00,000 + 50,000)
2,20,000*
(1,00,000 + 1,00,000 + 25,000 – 50,000 × 0.10)
C, D, E, F 9,50,000
(4,00,000 + 3,00,000 + 2,00,000 + 50,000)
2,95,000*
(1,00,000 + 1,00,000 + 75,000 + 25,000 – 50,000 ×0.10)
*Here, `(50,000 × 0.10) = `5,000 is the loss due to unutilised investment.
Since NPV is the highest for the combination (B, D, E, F), the projects to be selected are B, D, E and F.
12. A firm proposes to market a cheaper variety of its existing brand to be sold for `20 per unit, estimated
product-life being five years. The sales volume for the five years has been estimated to be 30,000 units for
the first year, 40,000 units for each of the next two years and 20,000 units for each of the last two years. The
variable cost p.u. is `10. Production of the cheapest brand will entail an initial expenditure of ` 4,50,000 in
purchasing and installing a new plant with estimated economic life of five years and scrap value of `50,000.
The fixed cost of ` 2,00,000 per annum including depreciation on the plant on straight-line basis will be
needed for producing and marketing the cheaper brand. Introduction of this cheaper variety is also likely to
have an adverse impact on the demand of the existing dearer brand resulting in loss of contribution
estimated at `20,000 per annum.
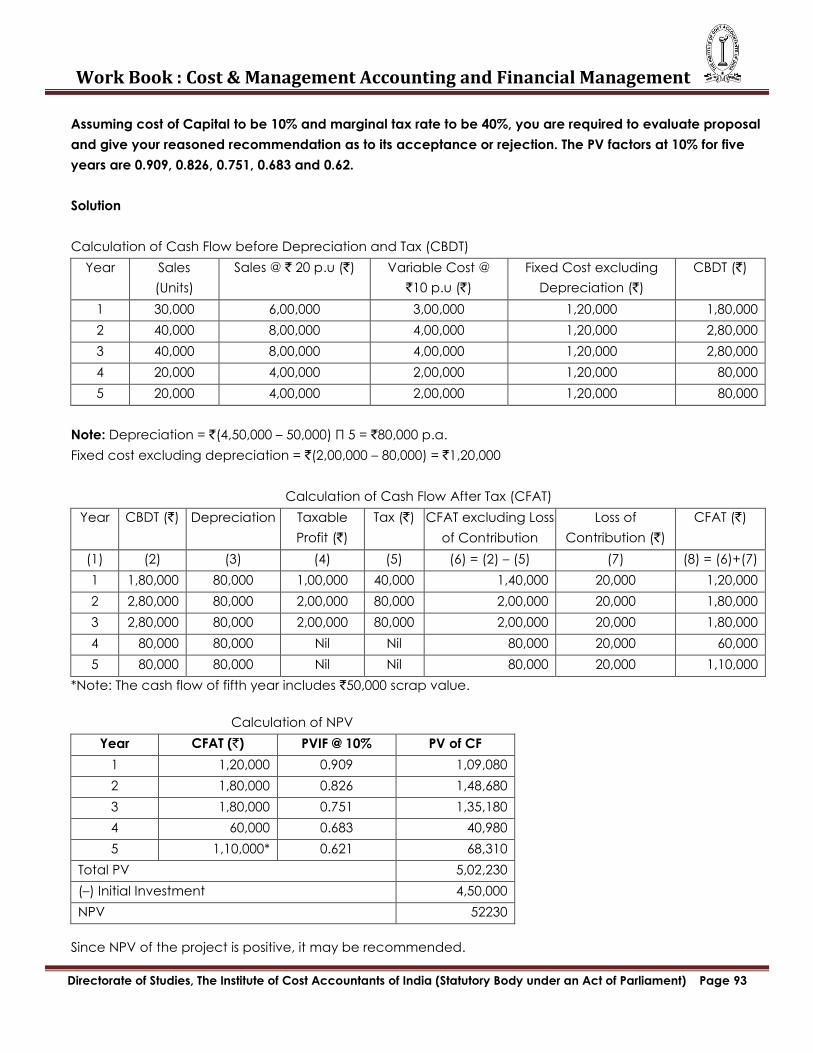
Work Book : Cost & Management Accounting and Financial Management
Directorate of Studies, The Institute of Cost Accountants of India (Statutory Body under an Act of Parliament) Page 93
Assuming cost of Capital to be 10% and marginal tax rate to be 40%, you are required to evaluate proposal
and give your reasoned recommendation as to its acceptance or rejection. The PV factors at 10% for five
years are 0.909, 0.826, 0.751, 0.683 and 0.62.
Solution
Calculation of Cash Flow before Depreciation and Tax (CBDT)
Year Sales
(Units)
Sales @ ` 20 p.u (`) Variable Cost @
`10 p.u (`)
Fixed Cost excluding
Depreciation (`)
CBDT (`)
1 30,000 6,00,000 3,00,000 1,20,000 1,80,000
2 40,000 8,00,000 4,00,000 1,20,000 2,80,000
3 40,000 8,00,000 4,00,000 1,20,000 2,80,000
4 20,000 4,00,000 2,00,000 1,20,000 80,000
5 20,000 4,00,000 2,00,000 1,20,000 80,000
Note: Depreciation = `(4,50,000 – 50,000) Π 5 = `80,000 p.a.
Fixed cost excluding depreciation = `(2,00,000 – 80,000) = `1,20,000
Calculation of Cash Flow After Tax (CFAT)
Year CBDT (`) Depreciation Taxable
Profit (`)
Tax (`) CFAT excluding Loss
of Contribution
Loss of
Contribution (`)
CFAT (`)
(1) (2) (3) (4) (5) (6) = (2) – (5) (7) (8) = (6)+(7)
1 1,80,000 80,000 1,00,000 40,000 1,40,000 20,000 1,20,000
2 2,80,000 80,000 2,00,000 80,000 2,00,000 20,000 1,80,000
3 2,80,000 80,000 2,00,000 80,000 2,00,000 20,000 1,80,000
4 80,000 80,000 Nil Nil 80,000 20,000 60,000
5 80,000 80,000 Nil Nil 80,000 20,000 1,10,000
*Note: The cash flow of fifth year includes `50,000 scrap value.
Calculation of NPV
Year CFAT (`) PVIF @ 10% PV of CF
1 1,20,000 0.909 1,09,080
2 1,80,000 0.826 1,48,680
3 1,80,000 0.751 1,35,180
4 60,000 0.683 40,980
5 1,10,000* 0.621 68,310
Total PV 5,02,230
(–) Initial Investment 4,50,000
NPV 52230
Since NPV of the project is positive, it may be recommended.
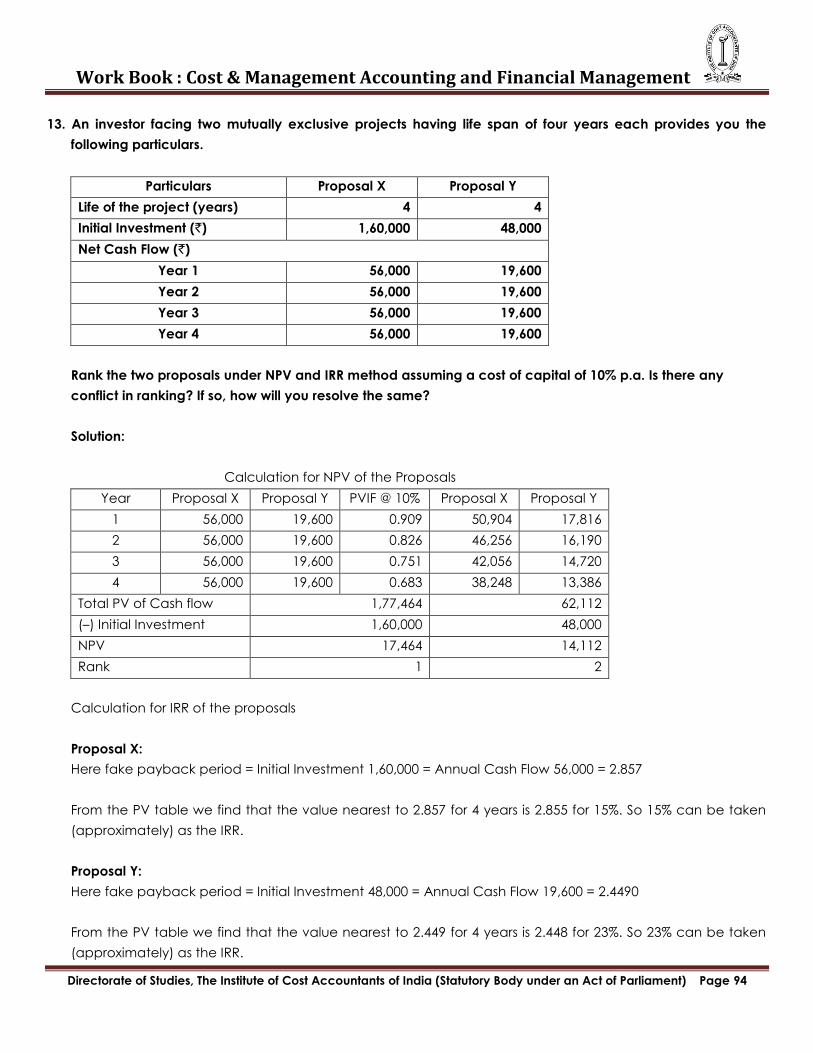
Work Book : Cost & Management Accounting and Financial Management
Directorate of Studies, The Institute of Cost Accountants of India (Statutory Body under an Act of Parliament) Page 94
13. An investor facing two mutually exclusive projects having life span of four years each provides you the
following particulars.
Particulars Proposal X Proposal Y
Life of the project (years) 4 4
Initial Investment (`) 1,60,000 48,000
Net Cash Flow (`)
Year 1 56,000 19,600
Year 2 56,000 19,600
Year 3 56,000 19,600
Year 4 56,000 19,600
Rank the two proposals under NPV and IRR method assuming a cost of capital of 10% p.a. Is there any
conflict in ranking? If so, how will you resolve the same?
Solution:
Calculation for NPV of the Proposals
Year Proposal X Proposal Y PVIF @ 10% Proposal X Proposal Y
1 56,000 19,600 0.909 50,904 17,816
2 56,000 19,600 0.826 46,256 16,190
3 56,000 19,600 0.751 42,056 14,720
4 56,000 19,600 0.683 38,248 13,386
Total PV of Cash flow 1,77,464 62,112
(–) Initial Investment 1,60,000 48,000
NPV 17,464 14,112
Rank 1 2
Calculation for IRR of the proposals
Proposal X:
Here fake payback period = Initial Investment 1,60,000 = Annual Cash Flow 56,000 = 2.857
From the PV table we find that the value nearest to 2.857 for 4 years is 2.855 for 15%. So 15% can be taken
(approximately) as the IRR.
Proposal Y:
Here fake payback period = Initial Investment 48,000 = Annual Cash Flow 19,600 = 2.4490
From the PV table we find that the value nearest to 2.449 for 4 years is 2.448 for 23%. So 23% can be taken
(approximately) as the IRR.
Work Book : Cost & Management Accounting and Financial Management
Directorate of Studies, The Institute of Cost Accountants of India (Statutory Body under an Act of Parliament) Page 95
So, ranking based on IRR is:
Proposal X = Rank 2
Proposal Y = Rank 1
Thus, there appears a conflict between the proposals as regards to their ranking under the two methods.
Final Selection:
Between NPV and IRR, NPV method is always a better approach because –
(a) NPV method attempts maximization of the benefits from any project in terms of present value. Therefore,
this is in line with the corporate objective of valuemaximization of the firm.
(b) NPV is based on more rational assumption regarding the re-investment rate than that of IRR.
Thus, finally we adopt NPV method and select proposal X having higher NPV.