Embed Size (px)
Citation preview
MARCH2018

2
This presentation is strictly confidential and is being furnished to you solely for your information. It may not be reproduced or redistributed to any other person, and it may not be published, in whole or in part, for any purpose. By receiving this presentation, you become bound by the above referred confidentiality obligation. Failure to comply with such confidentiality obligation may result in civil, administrative or criminal liabilities. The distribution of this presentation in other jurisdictions may also be restricted by law and persons into whose possession this presentation comes should inform themselves about and observe any such restrictions.
The material that follows presents general background information about Terrafina (“Terrafina” or the “Company”) as of the date of the presentation. This information consists of publicly available information concerning the Company and the industries in which it participates. It is information in summary form and does not purport to be complete. It is not intended to be relied upon as advice to potential investors and does not form the basis for an informed investment decision. If the Company should at any time commence an offering of securities, any decision to invest in such offer to subscribe for or acquire securities of the Company must be based wholly on the information contained in the offering circular to be issued by the Company in connection with any such offer and not on the contents hereof. None of the Company or any authorized underwriter or any of their respective affiliates expects to update or otherwise review the information contained herein except by means of a prospectus, offering memorandum or other customary disclosure document with respect to the offer of any securities of the Company.
This presentation does not constitute or form part of any offer for sale or solicitation of any offer to buy any securities in the United States or elsewhere nor shall it or any part of it form the basis of or be relied on in connection with any contract or commitment to purchase certificates. Securities may not be offered or sold in the United States absent registration or an exemption from registration under the U.S. Securities Act of 1933, as amended (the “Act”). This presentation is being made only to investors that, by means of their attendance at this presentation, represent that they are “Qualified Institutional Buyers” as that term is defined in the Act. Terrafina has not and does not intend to register any securities under the Act or offer any securities to the public in the United States. Any decision to purchase certificates in any offering should be made solely on the basis of the information to be contained in the Mexican prospectus to be registered with the Comisión Nacional Bancaria y de Valores (“CNBV”) or any offering memorandum delivered to you in due course in relation to any such offering, and not on the basis of this presentation. No reliance may be placed for any purposes whatsoever on the information contained in this document or on its completeness. All information in this presentation is subject to verification, correction, completion and change without notice. No representation or warranty, express or implied, is given or will be given as to the accuracy, completeness or fairness of the information or opinions contained in this document and any reliance you place on them will be at your sole risk. In addition, no responsibility, obligation or liability (whether direct or indirect, in contract, tort or otherwise) is or will be accepted by the Company, any global coordinator, bookrunner, manager or any other person in relation to such information or opinions or any other matter in connection with this document or its contents or otherwise arising in connection therewith.
This presentation includes forward-looking statements. All statements other than statements of historical fact included in this presentation, including, without limitation, those regarding our prospective resources, contingent resources, financial position, business strategy, management plans and objectives, future operations and synergies are forward-looking statements. These forward-looking statements involve known and unknown risks, uncertainties and other factors, which may cause our actual resources, reserves, results, performance or achievements to be materially different from those expressed or implied by these forward-looking statements. These forward-looking statements are based on numerous assumptions regarding our present and future business operations and strategies and the environment in which we expect to operate in the future. Forward-looking statements speak only as of the date of this presentation and we expressly disclaim any obligation or undertaking to release any update of or revisions to any forward-looking statements in this presentation, any change in our expectations or any change in events, conditions or circumstances on which these forward-looking statements are based.
Neither the CNBV nor any other authority have approved or disapproved the information contained in this presentation, or the accuracy or the veracity of the information contained herein.
By attending this presentation or by accepting to view any of the materials presented, you agree to be bound by the foregoing limitations.
Disclaimer

3
Proven track record delivering consistent and stable operating and financial results
Investment grade with access to main sources of capital
Stable and resilient portfolio with diversified high-quality tenant base
World-class corporate governance, experienced internal management team and strong sponsorship from PGIM Real Estate
Best-in-class industrial portfolio in strong growing markets and sectors
1
2
3
4
5
Keyinvestmenthighlights

4
Key milestones that propelled and supported our growth story
2003
2008 • PGIM completes
Funds’ I & II deployment to generate 19.9MM ft2 industrial portfolio
2013 • ~US$713MM IPO
2013 • AI/Kimco acquisition, 84
properties with a GLA of ~11MM ft2
2015
2015 • ~US$101MM asset recycling
strategy • Acquired 10 industrial properties
with a GLA of ~1.1MM ft2
• Achieved “Investment Grade” credit ratings from Moody’s and Fitch
• Debut in international debt capital markets with a 7-year unsecured bond issue of US$425MM with a fixed interest rate of 5.25%
FO GLA: 31.0MM ft2
2014 • ~US$460MM FO offering
2014
2016
2017
2013
IPO GLA: 19.9MM ft2
2016 • Refinancing of US
$150MM at LIBOR + 200bps with a 5 year-loan
2017 • January 2017, completed
portfolio acquisitions of 51 industrial properties / 6.3MM ft2
• Succesfully concluded refinancing of US$150MM with a 10-year secured credit loan with a fixed interest rate of 4.75%
• New 5-year unsecured term loan for US$350 million used for liability management; total payment of unsecured credit loan of US$150 million and US$196.5 million of revolving credit.
Current GLA: 37.8MM ft2
2003 – 2007 • 2003à PGIM closes Industrial
Fund I for ~US$73MM • 2005à PGIM raises Industrial
Fund II for ~US$280MM
2008
Initial GLA: 1.2MM ft2
1 Deliveringresultsenhancingourgrowthstrategy
Source 1. PGIM Real Estate (“PGIM”) is the global real estate investment business unit of Prudential Financial, Inc.
(1)
2017 • ~US$317MM FO offering to
support growth strategy • Acquired in September 2017, 8
industrial properties with a GLA of 1.1MM ft2
• Acquired in December 2017, 17 industrial properties with a GLA of 2.7MM ft2
• .
5
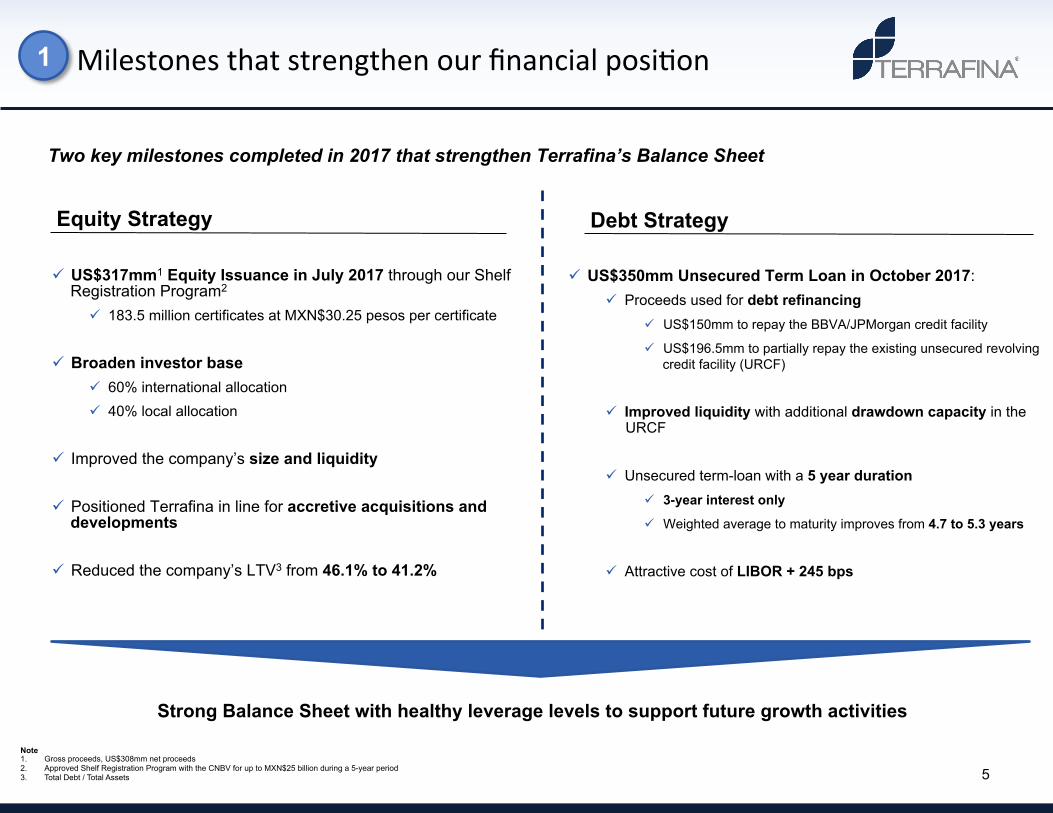
Two key milestones completed in 2017 that strengthen Terrafina’s Balance Sheet
Note 1. Gross proceeds, US$308mm net proceeds 2. Approved Shelf Registration Program with the CNBV for up to MXN$25 billion during a 5-year period 3. Total Debt / Total Assets
Equity Strategy Debt Strategy
ü US$317mm1 Equity Issuance in July 2017 through our Shelf Registration Program2
ü 183.5 million certificates at MXN$30.25 pesos per certificate ü Broaden investor base
ü 60% international allocation ü 40% local allocation
ü Improved the company’s size and liquidity ü Positioned Terrafina in line for accretive acquisitions and
developments ü Reduced the company’s LTV3 from 46.1% to 41.2%
ü US$350mm Unsecured Term Loan in October 2017: ü Proceeds used for debt refinancing
ü US$150mm to repay the BBVA/JPMorgan credit facility
ü US$196.5mm to partially repay the existing unsecured revolving credit facility (URCF)
ü Improved liquidity with additional drawdown capacity in the URCF
ü Unsecured term-loan with a 5 year duration
ü 3-year interest only
ü Weighted average to maturity improves from 4.7 to 5.3 years
ü Attractive cost of LIBOR + 245 bps
Strong Balance Sheet with healthy leverage levels to support future growth activities
Milestonesthatstrengthenourfinancialposi8on1
6
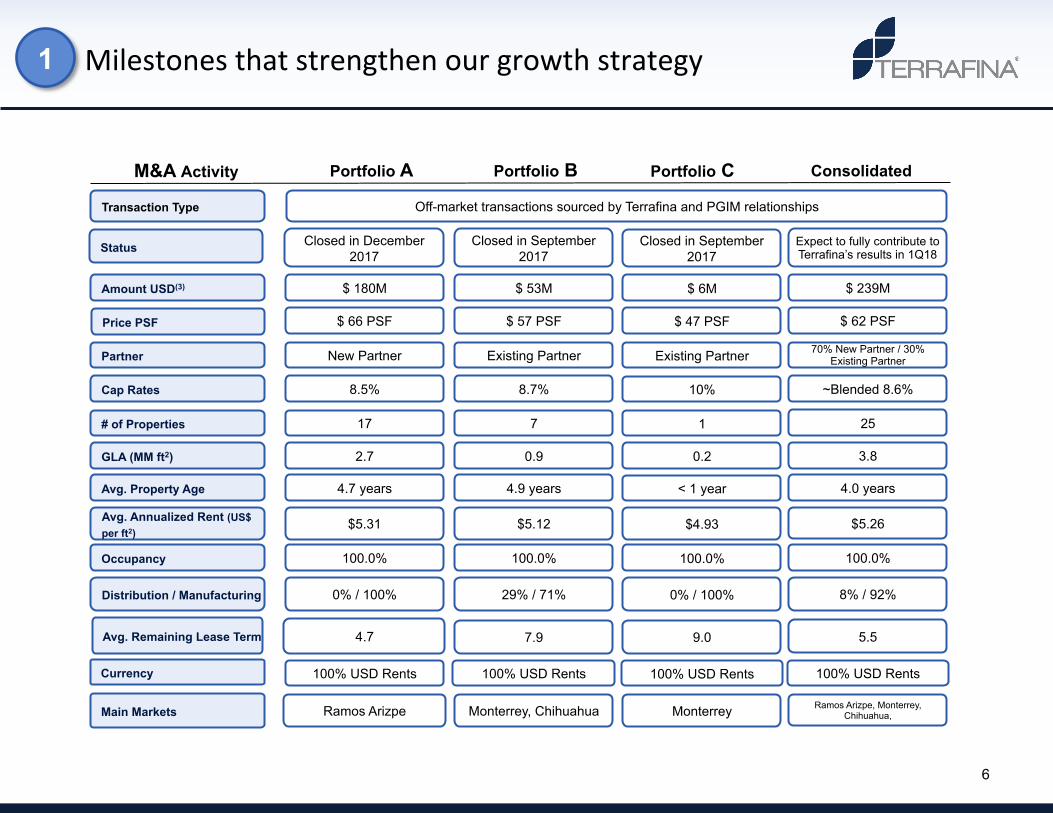
1 Milestonesthatstrengthenourgrowthstrategy
Consolidated
70% New Partner / 30% Existing Partner
3.8
4.0 years
$5.26
100.0%
8% / 92%
Ramos Arizpe, Monterrey, Chihuahua,
5.5
100% USD Rents
~Blended 8.6%
$ 239M
$ 62 PSF
25
Partner Existing Partner New Partner
Transaction Type Off-market transactions sourced by Terrafina and PGIM relationships
GLA (MM ft2) 2.7 0.9
Avg. Property Age 4.7 years 4.9 years
Avg. Annualized Rent (US$ per ft2)
$5.31 $5.12
Occupancy 100.0% 100.0%
Distribution / Manufacturing 0% / 100% 29% / 71%
Portfolio A Portfolio B
Main Markets Ramos Arizpe Monterrey, Chihuahua
Avg. Remaining Lease Term 4.7 7.9
Currency 100% USD Rents 100% USD Rents
Existing Partner
0.2
< 1 year
$4.93
100.0%
0% / 100%
Monterrey
9.0
100% USD Rents
Portfolio C
Cap Rates 8.7% 8.5% 10%
Amount USD(3) $ 53M $ 180M $ 6M
Price PSF $ 57 PSF $ 66 PSF $ 47 PSF
# of Properties 7 17 1
M&A Activity
Expect to fully contribute to Terrafina’s results in 1Q18 Status Closed in September
2017 Closed in December
2017 Closed in September
2017
7
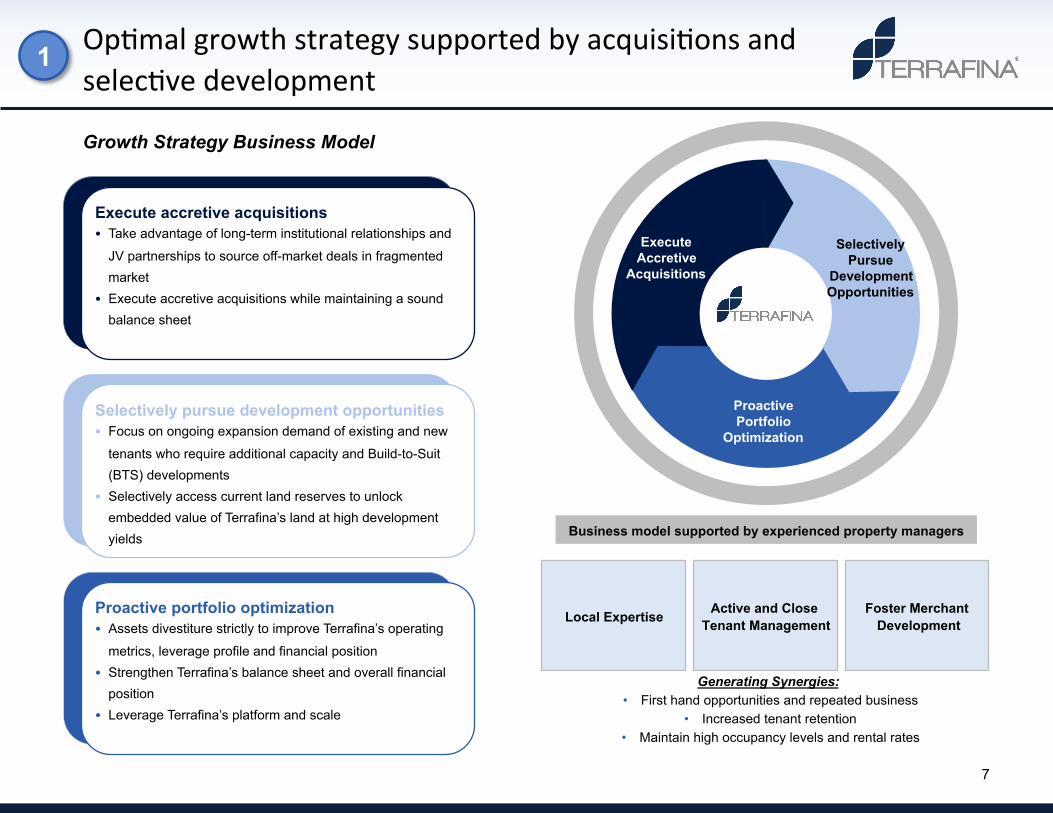
Proactive portfolio optimization • Assets divestiture strictly to improve Terrafina’s operating
metrics, leverage profile and financial position • Strengthen Terrafina’s balance sheet and overall financial
position • Leverage Terrafina’s platform and scale
Selectively pursue development opportunities • Focus on ongoing expansion demand of existing and new
tenants who require additional capacity and Build-to-Suit (BTS) developments
• Selectively access current land reserves to unlock embedded value of Terrafina’s land at high development yields
Execute accretive acquisitions • Take advantage of long-term institutional relationships and
JV partnerships to source off-market deals in fragmented market
• Execute accretive acquisitions while maintaining a sound balance sheet
Execute Accretive
Acquisitions
Selectively Pursue
Development Opportunities
Proactive Portfolio
Optimization
Active and Close Tenant Management
Foster Merchant Development
Generating Synergies: • First hand opportunities and repeated business
• Increased tenant retention • Maintain high occupancy levels and rental rates
Local Expertise
Business model supported by experienced property managers
Growth Strategy Business Model
Op8malgrowthstrategysupportedbyacquisi8onsandselec8vedevelopment
1
8
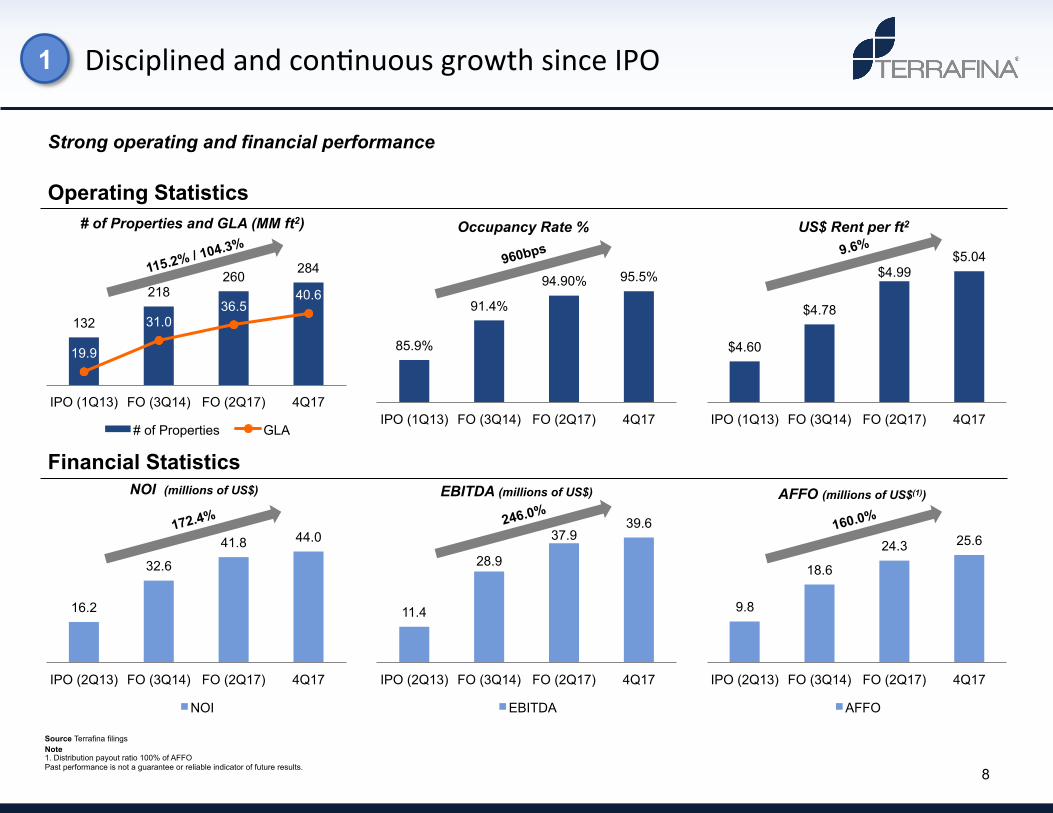
Operating Statistics
Financial Statistics
# of Properties and GLA (MM ft2)
85.9%
91.4%
94.90% 95.5%
IPO (1Q13) FO (3Q14) FO (2Q17) 4Q17
$4.60
$4.78
$4.99 $5.04
IPO (1Q13) FO (3Q14) FO (2Q17) 4Q17
Occupancy Rate % US$ Rent per ft2
NOI (millions of US$)
Strong operating and financial performance
132
218 260 284
19.9
31.0 36.5
40.6
IPO (1Q13) FO (3Q14) FO (2Q17) 4Q17
# of Properties GLA
115.2% / 104.3%
16.2
32.6
41.8 44.0
IPO (2Q13) FO (3Q14) FO (2Q17) 4Q17
NOI
Source Terrafina filings Note 1. Distribution payout ratio 100% of AFFO Past performance is not a guarantee or reliable indicator of future results.
11.4
28.9
37.9 39.6
IPO (2Q13) FO (3Q14) FO (2Q17) 4Q17
EBITDA
9.8
18.6
24.3 25.6
IPO (2Q13) FO (3Q14) FO (2Q17) 4Q17
AFFO
EBITDA (millions of US$) AFFO (millions of US$(1))
960bps 9.6%
172.4% 246.0%
160.0%
Disciplinedandcon8nuousgrowthsinceIPO1
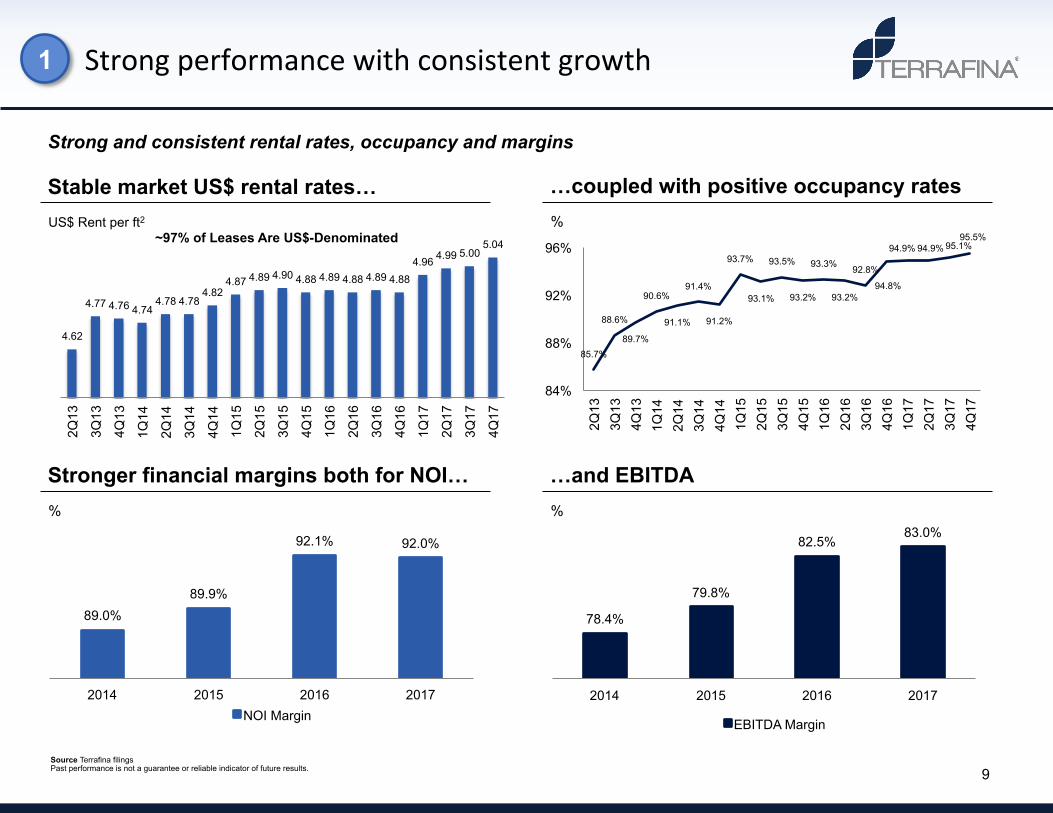
9 Source Terrafina filings Past performance is not a guarantee or reliable indicator of future results.
%
…coupled with positive occupancy rates
85.7%
88.6%
89.7%
90.6%
91.1%
91.4%
91.2%
93.7%
93.1%
93.5%
93.2%
93.3%
93.2%
92.8%
94.8%
94.9% 94.9% 95.1% 95.5%
84%
88%
92%
96%
2Q13
3Q
13
4Q13
1Q
14
2Q14
3Q
14
4Q14
1Q
15
2Q15
3Q
15
4Q15
1Q
16
2Q16
3Q
16
4Q16
1Q
17
2Q17
3Q
17
4Q17
Stable market US$ rental rates… US$ Rent per ft2
%
Stronger financial margins both for NOI… …and EBITDA
89.0% 89.9%
92.1% 92.0%
2014 2015 2016 2017 NOI Margin
Strongperformancewithconsistentgrowth
78.4%
79.8%
82.5% 83.0%
2014 2015 2016 2017
EBITDA Margin
%
~97% of Leases Are US$-Denominated
Strong and consistent rental rates, occupancy and margins
1
4.62
4.77 4.76 4.74 4.78 4.78
4.82 4.87 4.89 4.90 4.88 4.89 4.88 4.89 4.88
4.96 4.99 5.00 5.04
2Q13
3Q13
4Q13
1Q14
2Q14
3Q14
4Q14
1Q15
2Q15
3Q15
4Q15
1Q16
2Q16
3Q16
4Q16
1Q17
2Q17
3Q17
4Q17

10
35 104 177
252 347
75 206
334 466
674
1Q13
2Q13
3Q13
4Q13
1Q14
2Q14
3Q14
4Q14
1Q15
2Q15
3Q15
4Q15
1Q16
2Q16
3Q16
4Q16
1Q17
2Q17
3Q17
4Q17
Distributions Rental Revenues
Source Terrafina filings, Past performance is not a guarantee or reliable indicator of future results.
US$ MM
Accumulated distributions and revenues
Attractive margins at the bottom line…
Solidmarginsandconsistenthistoricaldistribu8ons
Consistent Performance
53.0%
57.3% 56.6% 56.9%
2014 2015 2016 2017 Distributions as a % Rental Revenues
…and high % distributions / rental revenues
48.5%
53.1% 52.2% 52.4%
2014 2015 2016 2017 AFFO Margin
1

11 Source Public filings, 4Q17 figures
4Q17 NOI Margin
%
4Q17 EBITDA Margin
%
83.6%
78.8%
75.1% 74.0%
93.0% 90.1%
85.2%
79.8%
ThemostefficientlymanagedREITinMexico
%
4Q17 AFFO Margin
54.1% 51.5% 46.2%
39.0%
% of Total Revenue
4Q17 Total Distributions
51.5% 49.6%
38.9% 31.3%
Industry Leading Margins
1

12
88% 90% 92% 94% 96% 98%
100%
2006
2007
2008
2009
2010
2011
2012
2013
2014
2015
2016
2017
Total North Bajio Central
17 23 13 18 13 12 14 14 10 19 20
8 10
4 6 7 13 6 6
69
26 14 8
7
2 7 7
5 3 6
11
14
10 33 40
19 31 27 30
23 26
91
59
45
0
20
40
60
80
100
2007 2008 2009 2010 2011 2012 2013 2014 2015 2016 2017 North Bajio Central
+10 Years of growth history…a positive outlook
Source Jones Lang LaSalle Industrial real estate report Note 1. Absorption level includes total industrial real estate stock including automotive OEMs
Industrial Stock (MM ft2)
Consistent and stable growth trend
Industrial Net Absorption (1) (MM ft2)
Sound absorption across markets
Growth %
Posi8veindustrytrends
263
410 475 485 506 524 541 544 566
674 736 766
17.8%
37.9%
21.3% 4.0% 5.8% 3.1% 5.5% 3.2% 3.8%
16.1%
8.3% 4.0%
0%
10%
20%
30%
40%
0
200
400
600
800
2006
2007
2008
2009
2010
2011
2012
2013
2014
2015
2016
2017
Industrial Stock Market Growth %
CAGR (2006 – 9M17): 10.2%
Industrial Rent (Annualized Avg. US$ Rent per ft2)
$4.00
$4.50
$5.00
$5.50
2006
2007
2008
2009
2010
2011
2012
2013
2014
2015
2016
2017
Total North Bajio Central
$4.70
$4.47
$4.57
$5.08
Industrial Occupancy Rate %
Stable and healthy occupancy rates
95.1%
94.4%
96.7%
94.8%
Increasing average rents
2
13
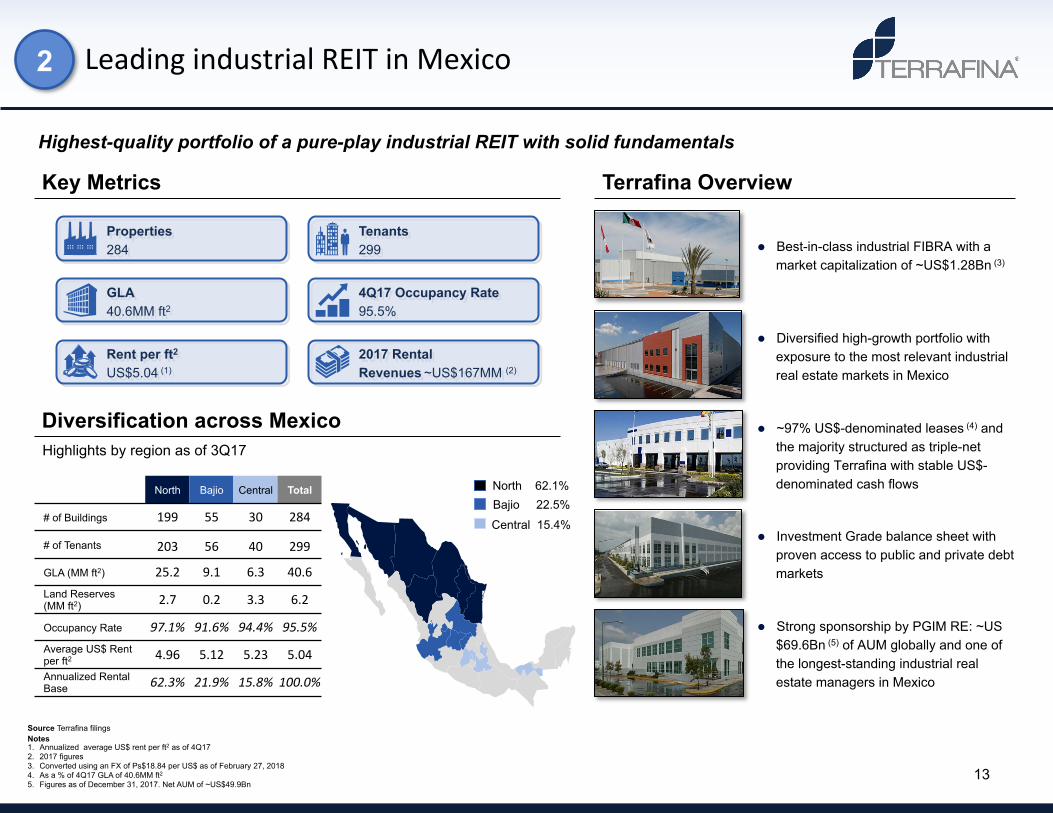
Diversification across Mexico Highlights by region as of 3Q17
Key Metrics
North Bajio Central Total
# of Buildings 199 55 30 284
# of Tenants 203 56 40 299
GLA (MM ft2) 25.2 9.1 6.3 40.6Land Reserves (MM ft2) 2.7 0.2 3.3 6.2
Occupancy Rate 97.1% 91.6% 94.4% 95.5%Average US$ Rent per ft2 4.96 5.12 5.23 5.04Annualized Rental Base 62.3% 21.9% 15.8% 100.0%
Terrafina Overview
l Diversified high-growth portfolio with exposure to the most relevant industrial real estate markets in Mexico
l Strong sponsorship by PGIM RE: ~US$69.6Bn (5) of AUM globally and one of the longest-standing industrial real estate managers in Mexico
l ~97% US$-denominated leases (4) and the majority structured as triple-net providing Terrafina with stable US$-denominated cash flows
l Investment Grade balance sheet with proven access to public and private debt markets
Source Terrafina filings Notes 1. Annualized average US$ rent per ft2 as of 4Q17 2. 2017 figures 3. Converted using an FX of Ps$18.84 per US$ as of February 27, 2018 4. As a % of 4Q17 GLA of 40.6MM ft2
5. Figures as of December 31, 2017. Net AUM of ~US$49.9Bn
l Best-in-class industrial FIBRA with a market capitalization of ~US$1.28Bn (3)
Highest-quality portfolio of a pure-play industrial REIT with solid fundamentals
LeadingindustrialREITinMexico
Rent per ft2
US$5.04 (1)
GLA
40.6MM ft2
Tenants
299
2017 Rental Revenues ~US$167MM (2)
4Q17 Occupancy Rate
95.5%
Properties
284
2
North 62.1%
Central 15.4%
Bajio 22.5%
14
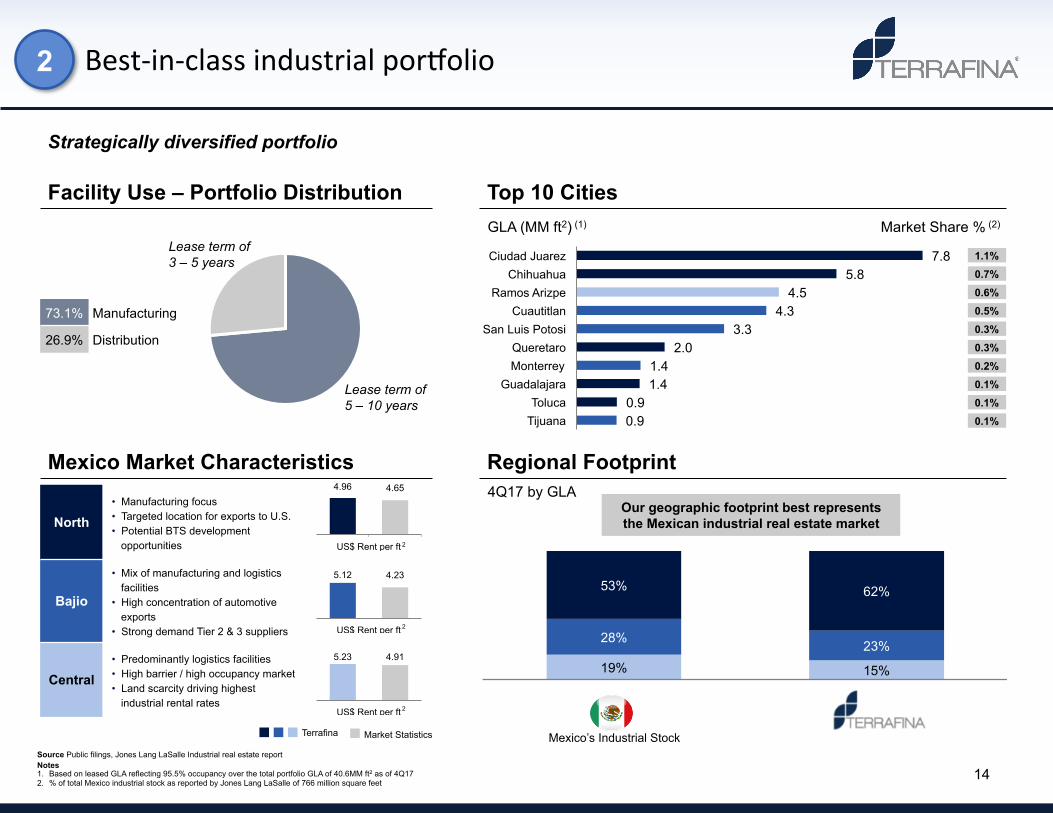
Mexico Market Characteristics
Top 10 Cities
Regional Footprint
73.1% Manufacturing
26.9% Distribution
GLA (MM ft2) (1)
4Q17 by GLA
Our geographic footprint best represents the Mexican industrial real estate market North
• Manufacturing focus • Targeted location for exports to U.S. • Potential BTS development
opportunities
Bajio
• Mix of manufacturing and logistics facilities
• High concentration of automotive exports
• Strong demand Tier 2 & 3 suppliers
Central • Predominantly logistics facilities • High barrier / high occupancy market • Land scarcity driving highest
industrial rental rates
Facility Use – Portfolio Distribution
Source Public filings, Jones Lang LaSalle Industrial real estate report Notes 1. Based on leased GLA reflecting 95.5% occupancy over the total portfolio GLA of 40.6MM ft2 as of 4Q17 2. % of total Mexico industrial stock as reported by Jones Lang LaSalle of 766 million square feet
Best-in-classindustrialporTolio
7.8 5.8
4.5 4.3
3.3 2.0
1.4 1.4
0.9 0.9
Ciudad Juarez Chihuahua
Ramos Arizpe Cuautitlan
San Luis Potosi Queretaro Monterrey
Guadalajara Toluca
Tijuana
4.96 4.65
US$ Rent per ft
5.12 4.23
US$ Rent per ft
5.23 4.91
US$ Rent per ft
2
2
2
Lease term of 3 – 5 years
Lease term of 5 – 10 years
1.1%
0.6% 0.5% 0.3% 0.3% 0.2% 0.1% 0.1% 0.1%
0.7%
Market Share % (2)
Market Statistics Terrafina
Strategically diversified portfolio
2
19% 15%
28% 23%
53% 62%
Mexico’s Industrial Stock
15
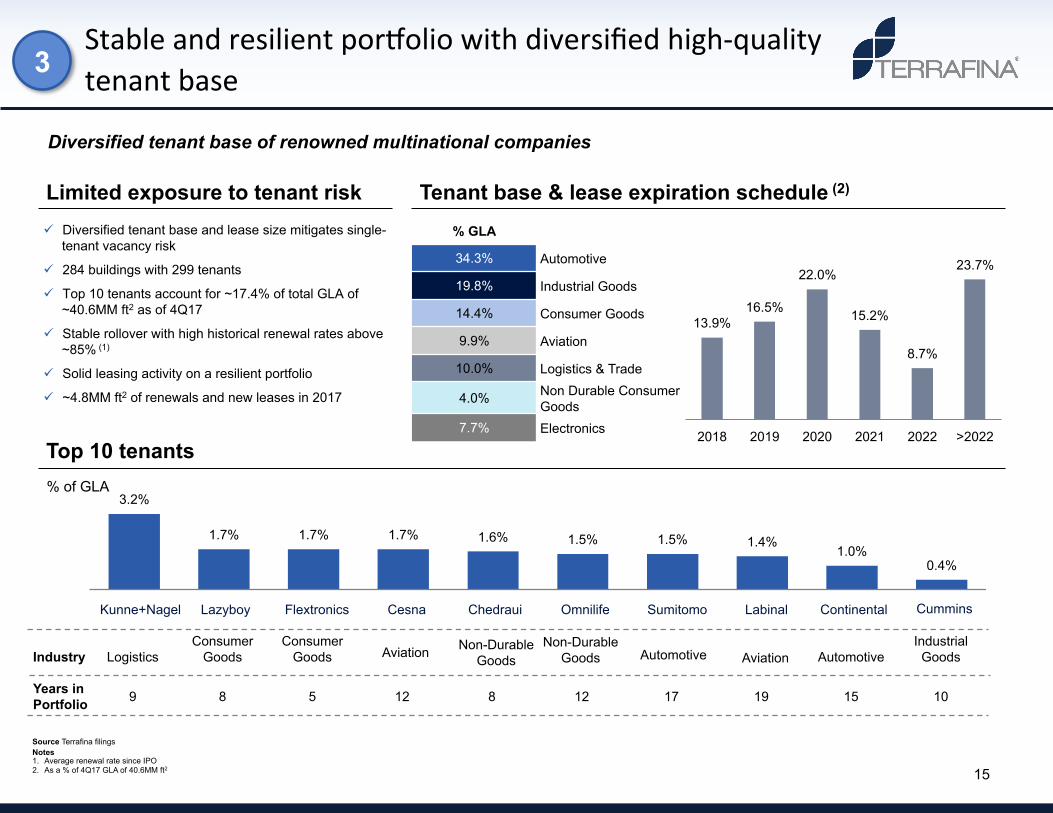
Diversified tenant base of renowned multinational companies
% of GLA
Top 10 tenants
Limited exposure to tenant risk Tenant base & lease expiration schedule (2)
ü Diversified tenant base and lease size mitigates single-tenant vacancy risk
ü 284 buildings with 299 tenants
ü Top 10 tenants account for ~17.4% of total GLA of ~40.6MM ft2 as of 4Q17
ü Stable rollover with high historical renewal rates above ~85% (1)
ü Solid leasing activity on a resilient portfolio
ü ~4.8MM ft2 of renewals and new leases in 2017
% GLA
34.3% Automotive
19.8% Industrial Goods
14.4% Consumer Goods
9.9% Aviation
10.0% Logistics & Trade
4.0% Non Durable Consumer Goods
7.7% Electronics
Source Terrafina filings Notes 1. Average renewal rate since IPO 2. As a % of 4Q17 GLA of 40.6MM ft2
Years in Portfolio 9 8
Logistics Industry
12
Aviation
12
Non-Durable Goods
Consumer Goods
8
Non-Durable Goods
17
Aviation
5
Consumer Goods
19 15
Automotive
StableandresilientporToliowithdiversifiedhigh-qualitytenantbase
13.9% 16.5%
22.0%
15.2%
8.7%
23.7%
2018 2019 2020 2021 2022 >2022
10
Industrial Goods
3
Automotive
3.2%
1.7% 1.7% 1.7% 1.6% 1.5% 1.5% 1.4% 1.0%
0.4%
Kunne+Nagel Lazyboy Flextronics Cesna Chedraui Omnilife Sumitomo Labinal Continental Cummins
16
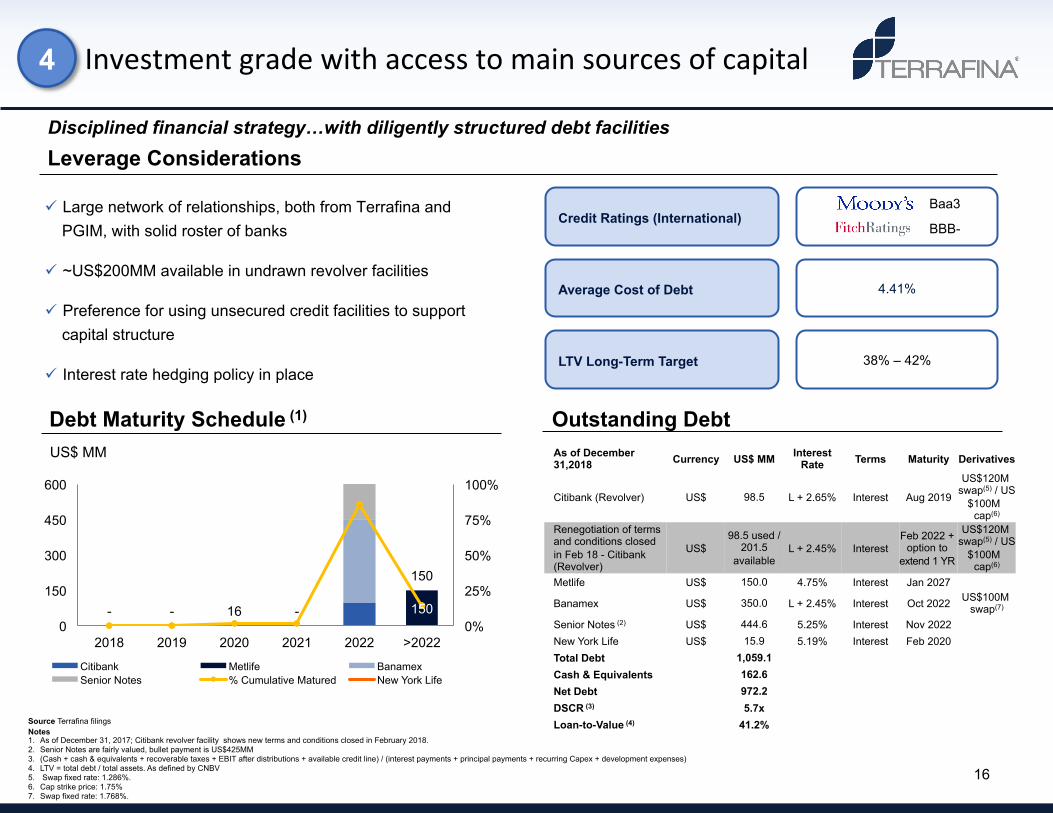
ü Large network of relationships, both from Terrafina and PGIM, with solid roster of banks
ü ~US$200MM available in undrawn revolver facilities
ü Preference for using unsecured credit facilities to support capital structure
ü Interest rate hedging policy in place
Leverage Considerations
As of December 31,2018 Currency US$ MM Interest
Rate Terms Maturity Derivatives
Citibank (Revolver) US$ 98.5 L + 2.65% Interest Aug 2019
US$120M swap(5) / US
$100M cap(6)
Renegotiation of terms and conditions closed in Feb 18 - Citibank (Revolver)
US$ 98.5 used /
201.5 available
L + 2.45% Interest Feb 2022 +
option to extend 1 YR
US$120M swap(5) / US
$100M cap(6)
Metlife US$ 150.0 4.75% Interest Jan 2027
Banamex US$ 350.0 L + 2.45% Interest Oct 2022 US$100M swap(7)
Senior Notes (2) US$ 444.6 5.25% Interest Nov 2022 New York Life US$ 15.9 5.19% Interest Feb 2020 Total Debt 1,059.1 Cash & Equivalents 162.6 Net Debt 972.2 DSCR (3) 5.7x Loan-to-Value (4) 41.2%
Outstanding Debt Debt Maturity Schedule (1)
US$ MM
Average Cost of Debt 4.41%
LTV Long-Term Target 38% – 42%
Credit Ratings (International) Baa3
BBB-
Investmentgradewithaccesstomainsourcesofcapital
Disciplined financial strategy…with diligently structured debt facilities
Source Terrafina filings Notes 1. As of December 31, 2017; Citibank revolver facility shows new terms and conditions closed in February 2018. 2. Senior Notes are fairly valued, bullet payment is US$425MM 3. (Cash + cash & equivalents + recoverable taxes + EBIT after distributions + available credit line) / (interest payments + principal payments + recurring Capex + development expenses) 4. LTV = total debt / total assets. As defined by CNBV 5. Swap fixed rate: 1.286%. 6. Cap strike price: 1.75% 7. Swap fixed rate: 1.768%.
4
150 - - 16 -
150
0%
25%
50%
75%
100%
0
150
300
450
600
2018 2019 2020 2021 2022 >2022
Citibank Metlife Banamex Senior Notes % Cumulative Matured New York Life
17
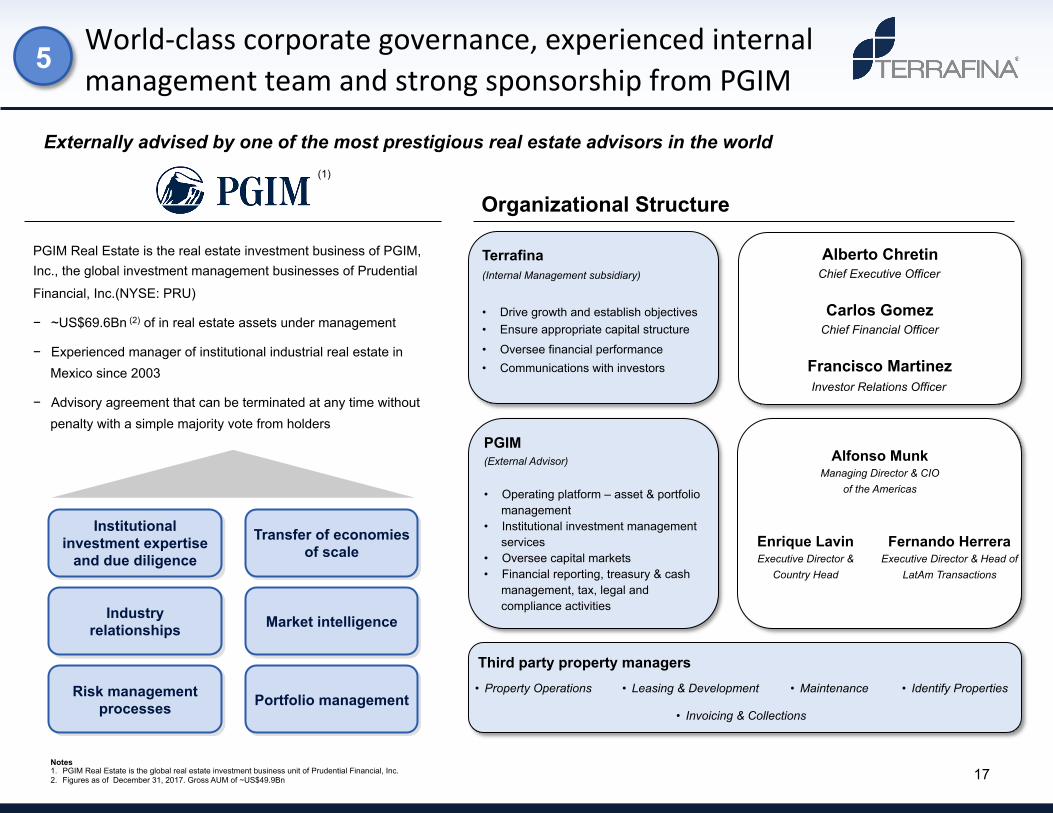
PGIM Real Estate is the real estate investment business of PGIM, Inc., the global investment management businesses of Prudential
Financial, Inc.(NYSE: PRU)
− ~US$69.6Bn (2) of in real estate assets under management
− Experienced manager of institutional industrial real estate in Mexico since 2003
− Advisory agreement that can be terminated at any time without penalty with a simple majority vote from holders
Institutional investment expertise
and due diligence
Industry relationships
Risk management processes
Transfer of economies of scale
Market intelligence
Portfolio management
Organizational Structure
Terrafina (Internal Management subsidiary)
• Drive growth and establish objectives • Ensure appropriate capital structure
• Oversee financial performance • Communications with investors
Alberto Chretin Chief Executive Officer
Carlos Gomez
Chief Financial Officer
Francisco Martinez Investor Relations Officer
Third party property managers • Property Operations • Leasing & Development • Maintenance • Identify Properties
• Invoicing & Collections
PGIM (External Advisor)
• Operating platform – asset & portfolio management
• Institutional investment management services
• Oversee capital markets • Financial reporting, treasury & cash
management, tax, legal and compliance activities
Alfonso Munk Managing Director & CIO
of the Americas
Enrique Lavin Executive Director &
Country Head
Fernando Herrera Executive Director & Head of
LatAm Transactions
World-classcorporategovernance,experiencedinternalmanagementteamandstrongsponsorshipfromPGIM
Notes 1. PGIM Real Estate is the global real estate investment business unit of Prudential Financial, Inc. 2. Figures as of December 31, 2017. Gross AUM of ~US$49.9Bn
Externally advised by one of the most prestigious real estate advisors in the world (1)
5
18
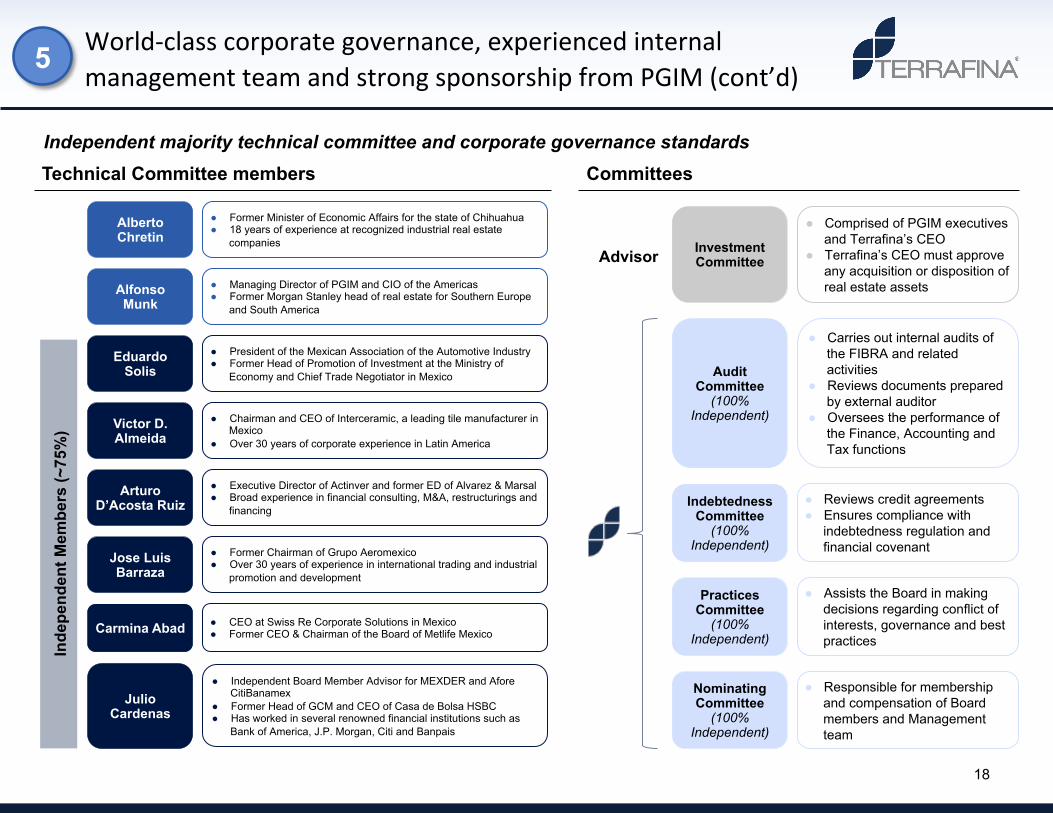
Eduardo Solis
Alfonso Munk
● Former Minister of Economic Affairs for the state of Chihuahua ● 18 years of experience at recognized industrial real estate
companies
● Managing Director of PGIM and CIO of the Americas ● Former Morgan Stanley head of real estate for Southern Europe
and South America
● President of the Mexican Association of the Automotive Industry ● Former Head of Promotion of Investment at the Ministry of
Economy and Chief Trade Negotiator in Mexico
Victor D. Almeida
● Chairman and CEO of Interceramic, a leading tile manufacturer in Mexico
● Over 30 years of corporate experience in Latin America
Arturo D’Acosta Ruiz
● Executive Director of Actinver and former ED of Alvarez & Marsal ● Broad experience in financial consulting, M&A, restructurings and
financing
Jose Luis Barraza
● Former Chairman of Grupo Aeromexico ● Over 30 years of experience in international trading and industrial
promotion and development
Carmina Abad ● CEO at Swiss Re Corporate Solutions in Mexico ● Former CEO & Chairman of the Board of Metlife Mexico
Alberto Chretin
Technical Committee members
Advisor Investment Committee
● Comprised of PGIM executives and Terrafina’s CEO
● Terrafina’s CEO must approve any acquisition or disposition of real estate assets
Audit Committee
(100% Independent)
● Carries out internal audits of the FIBRA and related activities
● Reviews documents prepared by external auditor
● Oversees the performance of the Finance, Accounting and Tax functions
Indebtedness Committee
(100% Independent)
● Reviews credit agreements ● Ensures compliance with
indebtedness regulation and financial covenant
Practices Committee
(100% Independent)
● Assists the Board in making decisions regarding conflict of interests, governance and best practices
Nominating Committee
(100% Independent)
● Responsible for membership and compensation of Board members and Management team
Julio Cardenas
● Independent Board Member Advisor for MEXDER and Afore CitiBanamex
● Former Head of GCM and CEO of Casa de Bolsa HSBC ● Has worked in several renowned financial institutions such as
Bank of America, J.P. Morgan, Citi and Banpais
Committees Independent majority technical committee and corporate governance standards
Inde
pend
ent M
embe
rs (~
75%
) World-classcorporategovernance,experiencedinternalmanagementteamandstrongsponsorshipfromPGIM(cont’d)
5
APPENDIX
SECTION2:

20 Source Company filings. Past performance is not a guarantee or reliable indicator of future results. 1. 2013 results exclude the period from January 1 to March 20, 2013. 2. 2015 results exclude portfolio sold in 1Q15 3. FFO decreases as a result of higher interest expenses from bond issuance concluded in November 2015.
AFFO and AFFO Margin — (US$ MM)
EBITDA and EBITDA Margin – (US$ MM)
FFO and FFO Margin – (US$ MM)
NOI and NOI Margin – (US$ MM)
$42.8
$79.8 $84.0 $83.0
$105.0
$11.1 $12.3 $17.7 $17.7 $19.7 $20.8 $21.6 $21.4 $21.7 $21.4 $19.5 $19.6 $20.7 $21.6 $21.1 $24.9 $26.9 $25.6 $27.5
53.0% 56.2%
61.1% 58.0%
58.4%
55.8% 57.6%
50.4% 50.1%
55.8% 58.3%
60.7% 57.9%
65.2% 64.0%
57.7% 53.8%
59.0% 60.0% 59.2% 55.3%
60.6% 57.8% 58.6%
2013 2014 2015 2016 2017 2Q13 3Q13 4Q13 1Q14 2Q14 3Q14 4Q14 1Q15 2Q15 3Q15 4Q15 1Q16 2Q16 3Q16 4Q16 1Q17 2Q17 3Q17 4Q17 1
$32.6
$69.3 $73.5 $74.5
$95.0
$7.7 $9.2 $14.3 $15.1 $16.9 $18.6 $18.6 $19.9 $19.6 $17.5 $16.5 $16.6 $19.0 $18.5 $20.4 $22.1 $24.3 $23.0 $25.6
43.6%
48.5% 53.1% 52.7% 52.4%
37.9% 41.1% 40.3%
42.5%
47.6% 51.8% 51.9% 53.3%
58.6%
52.0% 48.4%
45.1%
53.9% 52.9% 56.8%
48.7%
55.4%
51.4% 54.1%
2013 2014 2015 2016 2017 2Q13 3Q13 4Q13 1Q14 2Q14 3Q14 4Q14 1Q15 2Q15 3Q15 4Q15 1Q16 2Q16 3Q16 4Q16 1Q17 2Q17 3Q17 4Q17
$69.9
$126.3 $123.6 $131.8
$166.8
$17.7 $18.9
$30.9 $30.5 $31.2 $32.6 $32.1 $31.9 $30.3 $30.6 $30.8 $31.8 $31.9 $33.9 $33.1 $39.6 $41.8 $41.4 $44.0
87.6% 89.0% 89.9% 92.1% 92.0%
88.7% 88.2% 87.9% 86.4% 88.4% 91.1% 90.1% 86.1%
91.2% 91.5% 91.1% 87.0%
94.3% 94.3% 92.9% 87.9%
94.1% 93.3%
93.0%
2013 2014 2015 2016 2017 2Q13 3Q13 4Q13 1Q14 2Q14 3Q14 4Q14 1Q15 2Q15 3Q15 4Q15 1Q16 2Q16 3Q16 4Q16 1Q17 2Q17 3Q17 4Q17 1 2
$59.2
$111.2 $109.7 $118.2
$150.3
$13.6 $15.5
$28.0 $26.9 $27.6 $28.9 $27.7 $28.5 $27.2 $28.5 $27.0 $28.50 $29.60
$30.50 $29.60
$35.70 $37.90 $37.20 $39.60
77.1% 78.4% 79.8% 82.5% 83.0%
68.1% 72.2%
79.6% 76.2% 78.2%
80.9% 77.8% 76.8%
81.8% 78.2% 79.9% 78.2% 84.3% 84.8% 82.9% 79.2%
85.3% 83.7% 83.6%
2013 2014 2015 2016 2017 2Q13 3Q13 4Q13 1Q14 2Q14 3Q14 4Q14 1Q15 2Q15 3Q15 4Q15 1Q16 2Q16 3Q16 4Q16 1Q17 2Q17 3Q17 4Q17 1 2
2 1 2 3 3
FinancialperformancesinceIPO

21
4.0x
13.4x
7.7x 8.1x 7.8x
3.4x 3.7x 2.7x 3.2x 3.3x
4.1x 3.9x 4.0x 3.9x 4.0x 2.9x 3.3x 3.4x
5.2x
2Q13 3Q13 4Q13 1Q14 2Q14 3Q14 4Q14 1Q15 2Q15 3Q15 4Q15 1Q16 2Q16 3Q16 4Q16 1Q17 2Q17 3Q17 4Q17
4.3x
15.0x
8.2x 8.5x 8.1x 7.5x
6.7x 6.0x 6.0x 6.1x 6.5x 6.2x 6.1x 6.0x 6.0x
4.6x 5.0x 5.2x 6.2x
2Q13 3Q13 4Q13 1Q14 2Q14 3Q14 4Q14 1Q15 2Q15 3Q15 4Q15 1Q16 2Q16 3Q16 4Q16 1Q17 2Q17 3Q17 4Q17
22.2%
51.7% 51.7% 52.1%
50.6%
40.0% 37.0% 34.9% 34.8% 34.6%
36.1% 35.9%
36.9% 37.3% 36.5%
45.6% 46.1%
41.2% 41.2%
2Q13 3Q13 4Q13 1Q14 2Q14 3Q14 4Q14 1Q15 2Q15 3Q15 4Q15 1Q16 2Q16 3Q16 4Q16 1Q17 2Q17 3Q17 4Q17
8.9x
6.5x
2.9x 2.9x 3.5x 3.4x 3.5x
4.1x 4.9x 4.7x
4.0x 3.2x 3.1x 3.4x 3.3x 3.3x 3.4x 3.2x 3.4x
2Q13 3Q13 4Q13 1Q14 2Q14 3Q14 4Q14 1Q15 2Q15 3Q15 4Q15 1Q16 2Q16 3Q16 4Q16 1Q17 2Q17 3Q17 4Q17
Source Company filings. Notes 1. Reflects annualized EBITDA figures. Proforma EBITDA (includes full impact of December 2017 acquisition) is reflected in 4Q17 calculations. 2. The AI / Kimco acquisition closed on September 27, 2013. This indicator reflects the full impact of leverage on Balance Sheet but only three days of EBITDA contribution. 3. Defined as Total Debt / Total Assets. Total Debt at Fair Value. (4) Leverage increases as a result of acquisitions completed in January 2017. Past performance is not a guarantee or reliable indicator of future results.
EBITDA / Interest Expense
Debt / EBITDA(1)
LTV(3)
Net Debt / EBITDA(1)
(2) (2)
2
Creditmetrics
22 Notes Past performance is not a guarantee or reliable indicator of future results. Source: Terrafina Earnings Reports
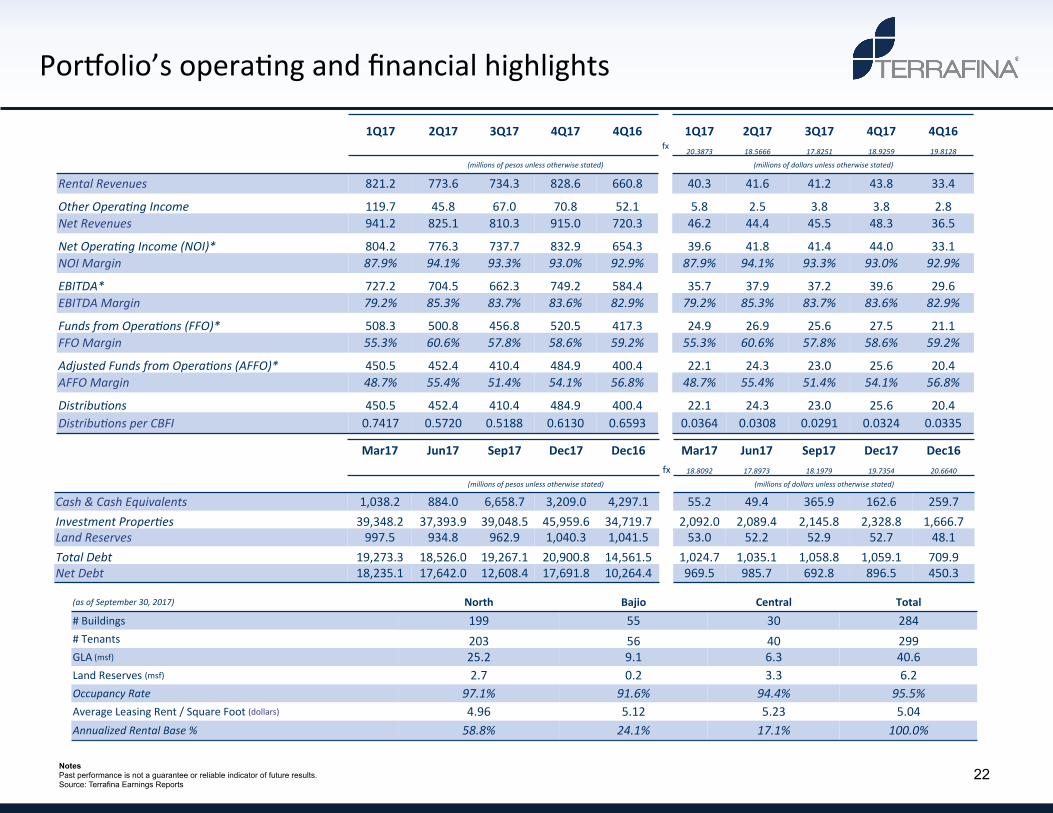
PorTolio’sopera8ngandfinancialhighlights
1Q17 2Q17 3Q17 4Q17 4Q16 1Q17 2Q17 3Q17 4Q17 4Q16
fx20.3873 18.5666 17.8251 18.9259 19.8128
(millionsofpesosunlessotherwisestated) (millionsofdollarsunlessotherwisestated)
RentalRevenues 821.2 773.6 734.3 828.6 660.8 40.3 41.6 41.2 43.8 33.4
OtherOperaCngIncome 119.7 45.8 67.0 70.8 52.1 5.8 2.5 3.8 3.8 2.8NetRevenues 941.2 825.1 810.3 915.0 720.3 46.2 44.4 45.5 48.3 36.5
NetOperaCngIncome(NOI)* 804.2 776.3 737.7 832.9 654.3 39.6 41.8 41.4 44.0 33.1NOIMargin 87.9% 94.1% 93.3% 93.0% 92.9% 87.9% 94.1% 93.3% 93.0% 92.9%
EBITDA* 727.2 704.5 662.3 749.2 584.4 35.7 37.9 37.2 39.6 29.6EBITDAMargin 79.2% 85.3% 83.7% 83.6% 82.9% 79.2% 85.3% 83.7% 83.6% 82.9%
FundsfromOperaCons(FFO)* 508.3 500.8 456.8 520.5 417.3 24.9 26.9 25.6 27.5 21.1FFOMargin 55.3% 60.6% 57.8% 58.6% 59.2% 55.3% 60.6% 57.8% 58.6% 59.2%
AdjustedFundsfromOperaCons(AFFO)* 450.5 452.4 410.4 484.9 400.4 22.1 24.3 23.0 25.6 20.4AFFOMargin 48.7% 55.4% 51.4% 54.1% 56.8% 48.7% 55.4% 51.4% 54.1% 56.8%
DistribuCons 450.5 452.4 410.4 484.9 400.4 22.1 24.3 23.0 25.6 20.4DistribuConsperCBFI 0.7417 0.5720 0.5188 0.6130 0.6593 0.0364 0.0308 0.0291 0.0324 0.0335
Mar17 Jun17 Sep17 Dec17 Dec16 Mar17 Jun17 Sep17 Dec17 Dec16 fx 18.8092 17.8973 18.1979 19.7354 20.6640
(millionsofpesosunlessotherwisestated) (millionsofdollarsunlessotherwisestated)
Cash&CashEquivalents 1,038.2 884.0 6,658.7 3,209.0 4,297.1 55.2 49.4 365.9 162.6 259.7InvestmentProperCes 39,348.2 37,393.9 39,048.5 45,959.6 34,719.7 2,092.0 2,089.4 2,145.8 2,328.8 1,666.7LandReserves 997.5 934.8 962.9 1,040.3 1,041.5 53.0 52.2 52.9 52.7 48.1TotalDebt 19,273.3 18,526.0 19,267.1 20,900.8 14,561.5 1,024.7 1,035.1 1,058.8 1,059.1 709.9NetDebt 18,235.1 17,642.0 12,608.4 17,691.8 10,264.4 969.5 985.7 692.8 896.5 450.3
(asofSeptember30,2017) North Bajio Central Total#Buildings 199 55 30 284#Tenants 203 56 40 299GLA(msf) 25.2 9.1 6.3 40.6LandReserves(msf) 2.7 0.2 3.3 6.2OccupancyRate 97.1% 91.6% 94.4% 95.5%AverageLeasingRent/SquareFoot(dollars) 4.96 5.12 5.23 5.04AnnualizedRentalBase% 58.8% 24.1% 17.1% 100.0%
23 Source: As reported by JLL Real Estate Industry Reports. Past performance is not a guarantee or reliable indicator of future results.
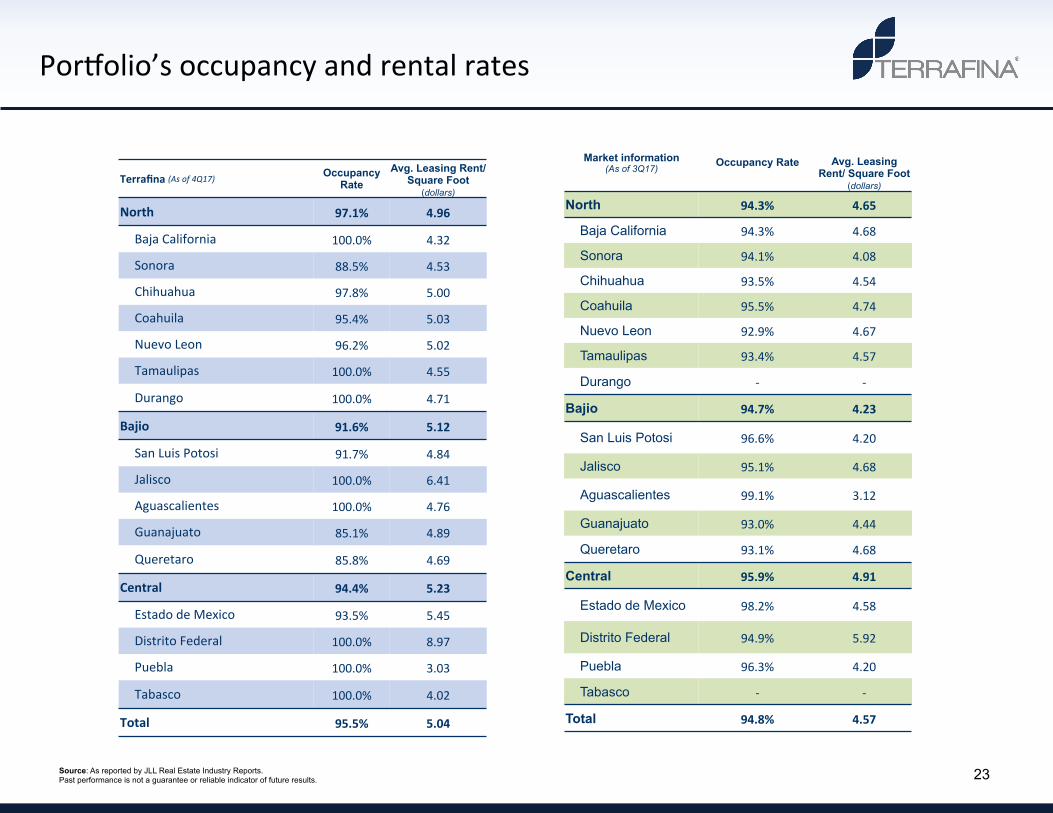
PorTolio’soccupancyandrentalrates
Market information (As of 3Q17) Occupancy Rate Avg. Leasing
Rent/ Square Foot (dollars)
North 94.3% 4.65
Baja California 94.3% 4.68
Sonora 94.1% 4.08
Chihuahua 93.5% 4.54
Coahuila 95.5% 4.74
Nuevo Leon 92.9% 4.67
Tamaulipas 93.4% 4.57
Durango - -
Bajio 94.7% 4.23
San Luis Potosi 96.6% 4.20
Jalisco 95.1% 4.68
Aguascalientes 99.1% 3.12
Guanajuato 93.0% 4.44
Queretaro 93.1% 4.68
Central 95.9% 4.91
Estado de Mexico 98.2% 4.58
Distrito Federal 94.9% 5.92
Puebla 96.3% 4.20
Tabasco - -
Total 94.8% 4.57
Terrafina(Asof4Q17) Occupancy Rate
Avg. Leasing Rent/ Square Foot
(dollars)
North 97.1% 4.96
BajaCalifornia 100.0% 4.32
Sonora 88.5% 4.53
Chihuahua 97.8% 5.00
Coahuila 95.4% 5.03
NuevoLeon 96.2% 5.02
Tamaulipas 100.0% 4.55
Durango 100.0% 4.71
Bajio 91.6% 5.12
SanLuisPotosi 91.7% 4.84
Jalisco 100.0% 6.41
Aguascalientes 100.0% 4.76
Guanajuato 85.1% 4.89
Queretaro 85.8% 4.69
Central 94.4% 5.23
EstadodeMexico 93.5% 5.45
DistritoFederal 100.0% 8.97
Puebla 100.0% 3.03
Tabasco 100.0% 4.02
Total 95.5% 5.04
24
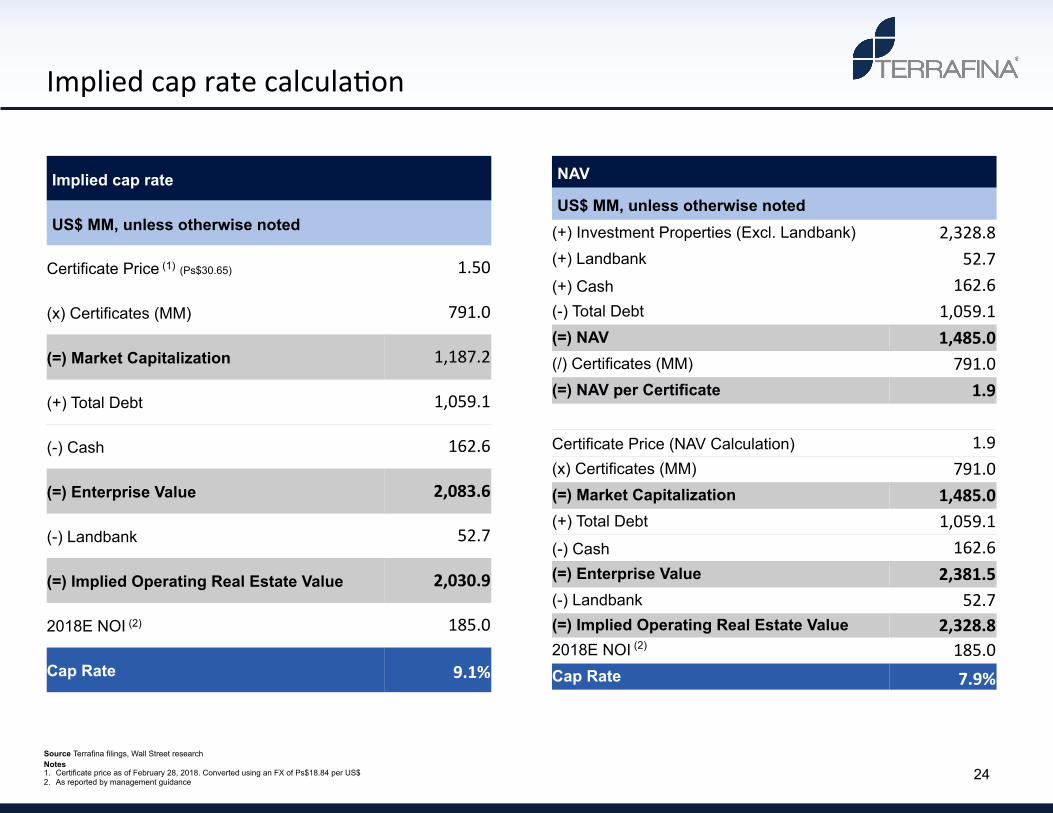
Implied cap rate
US$ MM, unless otherwise noted
Certificate Price (1) (Ps$30.65) 1.50
(x) Certificates (MM) 791.0
(=) Market Capitalization 1,187.2
(+) Total Debt 1,059.1
(-) Cash 162.6
(=) Enterprise Value 2,083.6
(-) Landbank 52.7
(=) Implied Operating Real Estate Value 2,030.9
2018E NOI (2) 185.0
Cap Rate 9.1%
NAV
US$ MM, unless otherwise noted (+) Investment Properties (Excl. Landbank) 2,328.8(+) Landbank 52.7(+) Cash 162.6(-) Total Debt 1,059.1(=) NAV 1,485.0(/) Certificates (MM) 791.0(=) NAV per Certificate 1.9 Certificate Price (NAV Calculation) 1.9(x) Certificates (MM) 791.0(=) Market Capitalization 1,485.0(+) Total Debt 1,059.1(-) Cash 162.6(=) Enterprise Value 2,381.5(-) Landbank 52.7(=) Implied Operating Real Estate Value 2,328.82018E NOI (2) 185.0Cap Rate 7.9%
Source Terrafina filings, Wall Street research Notes 1. Certificate price as of February 28, 2018. Converted using an FX of Ps$18.84 per US$ 2. As reported by management guidance
Impliedcapratecalcula8on

25