Embed Size (px)
Citation preview
THE COMPLETE FINANCIAL LIVES OF WORKERSA HOLISTIC EXPLORATION OF WORK AND PUBLIC AND WORKPLACE BENEFIT ARRANGEMENTS
MARCH 2021
AUTHOR
Sheida Elmi, Research Program Manager of the Aspen Institute Financial Security Program, authored this report.
ACKNOWLEDGMENTS
The Aspen Institute Financial Security Program (Aspen FSP) would like to thank Sheida Elmi for authoring this report as well as Sarika Abbi, Karen Andres, Rachel Black, Genevieve Melford, Meghan Poljak, and Elizabeth Vivirito for their assistance, comments, and insights. Aspen FSP also thanks members of the Consumer Insights Collaborative—an effort across nine leading nonprofits to collectively understand and amplify data for the public good, specifically about the financial lives of low- and moderate-income households—for their contributions of data and insights: Haidee Cabusora, Emma Cordova, Amina Kirk, and Ian Watson at Change Machine; Charvi Gandotra and Brian Gilmore at Commonwealth; Deni Chen and Lauren Renaud at Family Independence Initiative; Danny Friel and Helah Robinson at LIFT; Margaret Libby and Fahad Qurashi at MyPath; Eric Espinoza, Stephanie Ramirez, Leo Rayfiel and Sarah Sable at Neighborhood Trust Financial Partners; and Xiao Bi and Tim Lucas at SaverLife. We are grateful to our graduate student consultant Andy Yewdell, Shelly Steward at the Aspen Institute Future of Work Initiative, Jessica Fulton at the Joint Center for Political and Economic Studies, Elisabeth Jacobs at WorkRise at the Urban Institute, Haeyoung Yoon at National Domestic Workers Alliance, Cindy Williams at WorkLife Partnership, and Sam Bufe, Mathieu Despard, Katie Kristensen, and Stephen Roll at the Social Policy Institute at Washington University in St. Louis, who shared their invaluable expertise with us in the development of this report.
This paper was developed as part of the Global Inclusive Growth Partnership, a collaboration between the Aspen Institute and the Mastercard Center for Inclusive Growth. It was also developed with generous support from JPMorgan Chase & Co., The Prudential Foundation, and the W.K. Kellogg Foundation. The findings, interpretations, and conclusions expressed in this report—as well as any errors—are Aspen FSP’s alone and do not necessarily represent the views of its funders, Collaborative members, or other participants in our research process.
ABOUT THE ASPEN INSTITUTE FINANCIAL SECURITY PROGRAM
The Aspen Institute Financial Security Program’s (Aspen FSP) mission is to illuminate and solve the most critical financial challenges facing American households and to make financial security for all a top national priority. We aim for nothing less than a more inclusive economy with reduced wealth inequality and shared prosperity. We believe that transformational change requires innovation, trust, leadership, and entrepreneurial thinking. Aspen FSP galvanizes a diverse set of leaders across the public, private, and nonprofit sectors to solve the most critical financial challenges. We do this through deep, deliberate private and public dialogues and by elevating evidence-based research and solutions that will strengthen the financial health and security of financially vulnerable Americans.
To learn more, visit AspenFSP.org, follow @AspenFSP on Twitter, or sign up for our newsletter at http://bit.ly/fspnewsletter.
Strengthens the financial security and opportunity of financially vulnerable people by discovering ideas, piloting solutions, and scaling innovations.www.buildcommonwealth.orgBoston, MA
Builds financial security for low-income communities through people-powered technology. Championing the aspirations of Black and Brown women who navigate financial insecurity. Their success means success for all.www.change-machine.org Brooklyn, NY
Creates a fair financial marketplace for hardworking people by building on what they have through financial products, coaching, and technology.www.missionassetfund.orgSan Francisco, CA
CONSUMER INSIGHTS COLLABORATIVE
Leverages financial technology and economic inclusion to empower low-income Americans to save and take charge of their financial lives. https://about.saverlife.orgSan Francisco, CA
Promotes financial inclusion by providing capital, building capacity, and developing innovative products and services for community development credit unions (CDCUs). www.inclusiv.orgNew York, NY
Equips young people of color growing up in financial deserts with the knowledge and financial tools they need to build wealth and get on the path to economic mobility.www.mypathus.orgSan Francisco, CA
Provides a technology platform for low-income families to strengthen social networks, record progress towards goals, and unlock dollars to accelerate their mobility.www.fii.orgOakland, CA
Builds relationships with parents to set and accomplish family career and financial goals, connecting them to the resources and networks that make those dreams a reality.www.liftcommunities.org/about Washington, DC
Helps workers take control of their finances with human-touch financial coaching linked to safe and goal-oriented products and delivered via the workplace, fintechs, and nonprofit partners.https://neighborhoodtrust.orgNew York, NY
WHO IS THE CONSUMER INSIGHTS COLLABORATIVE?The Aspen Institute Financial Security Program convenes the Consumer Insights Collaborative, an effort across nine leading nonprofits to collectively understand and amplify data for the public good, specifically about the financial lives of low- and moderate-income households. The Collaborative’s vision is that data-driven insights will prompt a wide variety of actors to develop programs, products, and policies that help more people achieve financial security—and that the insights inspire more organizations to put their data to use for good.
2
The Complete Financial Lives of Workers
The Aspen Institute Financial Security Program
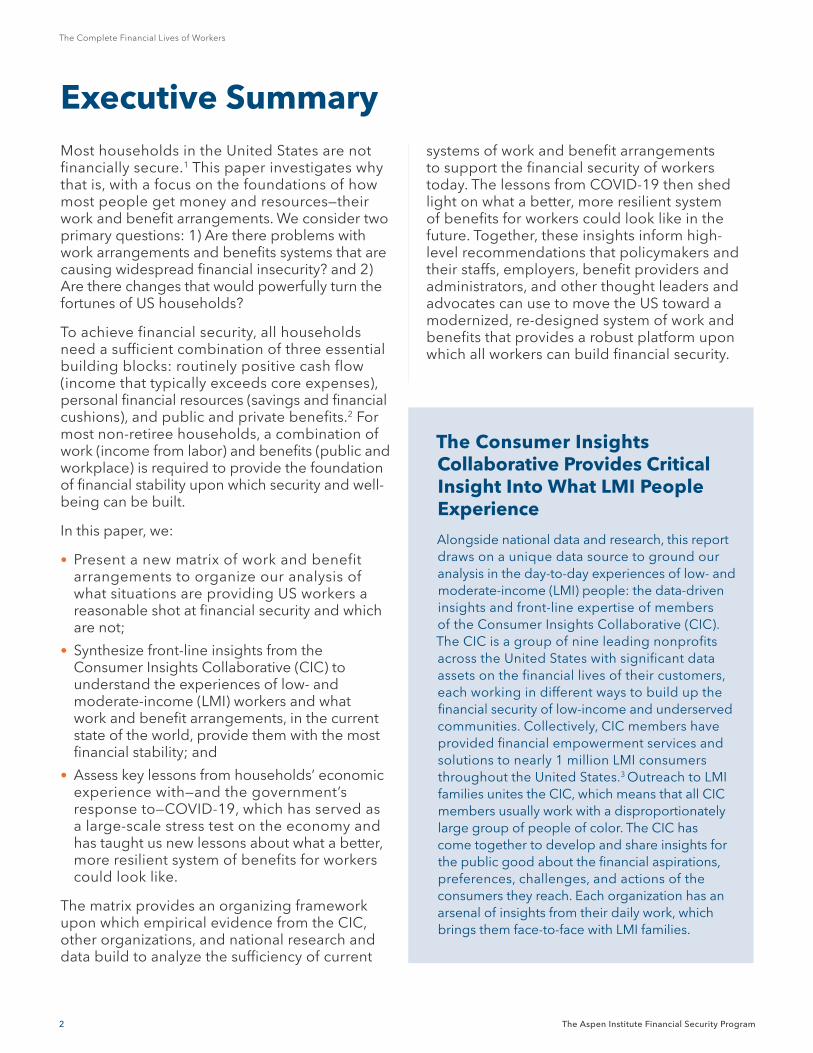
Executive SummaryMost households in the United States are not financially secure.1 This paper investigates why that is, with a focus on the foundations of how most people get money and resources—their work and benefit arrangements. We consider two primary questions: 1) Are there problems with work arrangements and benefits systems that are causing widespread financial insecurity? and 2) Are there changes that would powerfully turn the fortunes of US households?
To achieve financial security, all households need a sufficient combination of three essential building blocks: routinely positive cash flow (income that typically exceeds core expenses), personal financial resources (savings and financial cushions), and public and private benefits.2 For most non-retiree households, a combination of work (income from labor) and benefits (public and workplace) is required to provide the foundation of financial stability upon which security and well-being can be built.
In this paper, we:
• Present a new matrix of work and benefit arrangements to organize our analysis of what situations are providing US workers a reasonable shot at financial security and which are not;
• Synthesize front-line insights from the Consumer Insights Collaborative (CIC) to understand the experiences of low- and moderate-income (LMI) workers and what work and benefit arrangements, in the current state of the world, provide them with the most financial stability; and
• Assess key lessons from households’ economic experience with—and the government’s response to—COVID-19, which has served as a large-scale stress test on the economy and has taught us new lessons about what a better, more resilient system of benefits for workers could look like.
The matrix provides an organizing framework upon which empirical evidence from the CIC, other organizations, and national research and data build to analyze the sufficiency of current
systems of work and benefit arrangements to support the financial security of workers today. The lessons from COVID-19 then shed light on what a better, more resilient system of benefits for workers could look like in the future. Together, these insights inform high-level recommendations that policymakers and their staffs, employers, benefit providers and administrators, and other thought leaders and advocates can use to move the US toward a modernized, re-designed system of work and benefits that provides a robust platform upon which all workers can build financial security.
The Consumer Insights Collaborative Provides Critical Insight Into What LMI People Experience
Alongside national data and research, this report draws on a unique data source to ground our analysis in the day-to-day experiences of low- and moderate-income (LMI) people: the data-driven insights and front-line expertise of members of the Consumer Insights Collaborative (CIC). The CIC is a group of nine leading nonprofits across the United States with significant data assets on the financial lives of their customers, each working in different ways to build up the financial security of low-income and underserved communities. Collectively, CIC members have provided financial empowerment services and solutions to nearly 1 million LMI consumers throughout the United States.3 Outreach to LMI families unites the CIC, which means that all CIC members usually work with a disproportionately large group of people of color. The CIC has come together to develop and share insights for the public good about the financial aspirations, preferences, challenges, and actions of the consumers they reach. Each organization has an arsenal of insights from their daily work, which brings them face-to-face with LMI families.
3
A Holistic Exploration of Work and Public and Workplace Benefit Arrangements
The Aspen Institute Financial Security Program
WHAT’S IN THIS PAPERExecutive Summary ......................................2Introduction ...................................................4What Workers Across America Face ...........5Work Arrangements, Benefits, and Employer Practices are Not Meeting the Needs of Workers ..................................9Similar Patterns Hold for LMI Workers, but Some Structural Barriers Are Particularly Acute for Them ....................... 13
Worker Security in a Time of Crisis: Lessons from COVID-19 ............................ 18
To Truly Make Work a Meaningful Pathway to Financial Security, We Need to Modernize our Work and Benefits Systems ................................ 22
Conclusion .................................................. 24
Key Findings
The results of our analysis reveal:
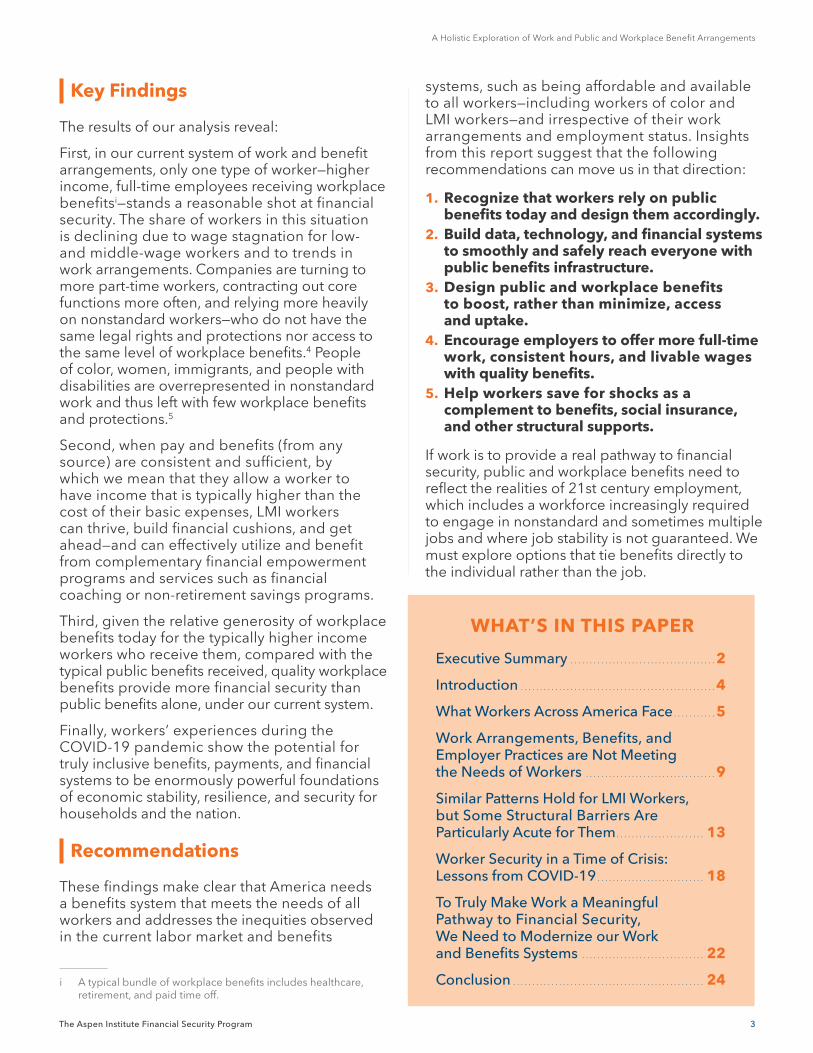
First, in our current system of work and benefit arrangements, only one type of worker—higher income, full-time employees receiving workplace benefitsi—stands a reasonable shot at financial security. The share of workers in this situation is declining due to wage stagnation for low- and middle-wage workers and to trends in work arrangements. Companies are turning to more part-time workers, contracting out core functions more often, and relying more heavily on nonstandard workers—who do not have the same legal rights and protections nor access to the same level of workplace benefits.4 People of color, women, immigrants, and people with disabilities are overrepresented in nonstandard work and thus left with few workplace benefits and protections.5
Second, when pay and benefits (from any source) are consistent and sufficient, by which we mean that they allow a worker to have income that is typically higher than the cost of their basic expenses, LMI workers can thrive, build financial cushions, and get ahead—and can effectively utilize and benefit from complementary financial empowerment programs and services such as financial coaching or non-retirement savings programs.
Third, given the relative generosity of workplace benefits today for the typically higher income workers who receive them, compared with the typical public benefits received, quality workplace benefits provide more financial security than public benefits alone, under our current system.
Finally, workers’ experiences during the COVID-19 pandemic show the potential for truly inclusive benefits, payments, and financial systems to be enormously powerful foundations of economic stability, resilience, and security for households and the nation.
Recommendations
These findings make clear that America needs a benefits system that meets the needs of all workers and addresses the inequities observed in the current labor market and benefits
i A typical bundle of workplace benefits includes healthcare, retirement, and paid time off.
systems, such as being affordable and available to all workers—including workers of color and LMI workers—and irrespective of their work arrangements and employment status. Insights from this report suggest that the following recommendations can move us in that direction:
1. Recognize that workers rely on public benefits today and design them accordingly.
2. Build data, technology, and financial systems to smoothly and safely reach everyone with public benefits infrastructure.
3. Design public and workplace benefits to boost, rather than minimize, access and uptake.
4. Encourage employers to offer more full-time work, consistent hours, and livable wages with quality benefits.
5. Help workers save for shocks as a complement to benefits, social insurance, and other structural supports.
If work is to provide a real pathway to financial security, public and workplace benefits need to reflect the realities of 21st century employment, which includes a workforce increasingly required to engage in nonstandard and sometimes multiple jobs and where job stability is not guaranteed. We must explore options that tie benefits directly to the individual rather than the job.
4
The Complete Financial Lives of Workers
The Aspen Institute Financial Security Program
IntroductionIn the United States, work, and the opportunity to earn income from work, has long been understood as the route to security and success, and the antidote to poverty. This is not the reality for workers in America today. For too many people, earning a wage that covers one’s living expenses is elusive.
Nearly half of all US workers earn wages too low to cover basic living expenses, and a similar share of households report income lower than or equal to their spending over the course of a year.6 Even before the pandemic, despite a decade of strong national economic indicators—measured by high stock market returns, low unemployment rates, and extraordinary economic growth—these positive shifts had not translated into equivalent improvements in financial well-being at the individual and family level.
One of the underlying reasons that households remain financially insecure is that employment is becoming more precarious, as full-time jobs with generous benefits decline and contingent work arrangements with minimal benefits increase. Unpacking the wide variety of today’s work and benefit arrangements for workers in America is essential for understanding their prospects for financial security. This report provides a new matrix to analyze these arrangements and identifies the key structural enablers and barriers to US workers’ financial security, with a focus on the role of work arrangements and public and workplace benefits. Although we do not address them in depth here, we acknowledge the critical impact that factors such as collective bargaining, state and federal minimum wages, structural inequities that result in a disproportionate number of people of color in the low-wage workforce, workplace power dynamics, and related issues have on the financial security outcomes of workers.
Financial Security Rests on Three Pillars
The Consumer Financial Protection Bureau defines financial well-being as “a state of being wherein a person can fully meet current and ongoing financial obligations, can feel secure in their financial future, and is able to make choices that allow them to enjoy life.7 The Aspen Institute
Financial Security Program has adopted this definition of financial security and in November 2020 published a new framework outlining the three pillars that support financial security.8 In order to evaluate the contributions of work and benefit arrangements to the financial security of workers, we briefly describe the three pillars that together provide the financial stability and well-being that individuals and families need to realize their full potential. These pillars are:
1. Routinely positive cash flow, where income typically exceeds expenses, which allows people to meet basic needs and build savings;
2. Personal resources, such as savings and other financial cushions (including wealth, assets, and individually purchased insurance) that allow people to weather smaller financial shocks and to invest in well-being, asset building, and economic mobility; and
3. Public and private benefits to insure against extraordinary shocks, boost cash flow, and invest in wealth and mobility. These include benefits provided by government, employers, or other parties that supplement or replace income, reduce an individual’s cost of living, or protect against major economic shocks such as job loss, major medical expenses, or natural disasters. They also include other benefits that help individuals build wealth and support economic mobility, such as tax policies and incentives that support homebuying and retirement savings.9
These pillars are mutually reinforcing, and if all are present, each can fill in the gap when a different pillar is absent or less robust. For instance, personal resources such as savings, or benefits such as unemployment insurance, can help stabilize a person’s cash flow during a period of temporary unemployment. In reality, financial security is elusive, especially for low- and moderate-income (LMI) households, because workers today do not have equal or sufficient access to these pillars.10
This definition and understanding of the three pillars of financial security provide a lens to explore the financial security needs of workers in the United States. The analysis presented here will, in particular, unpack the third pillar to explore the role of public and workplace benefits, as well as the impact of different work arrangements, in improving or deteriorating financial security.
10th Percentile Median Wage 90th Percentile
20192015201120072003199919951991198719831979-20%
-10%
0%
10%
20%
30%
40%
50%
-20%
-10%
0%
10%
20%
30%
40%
50%
Cum
ulat
ive
Gro
wth
in R
eal W
ages
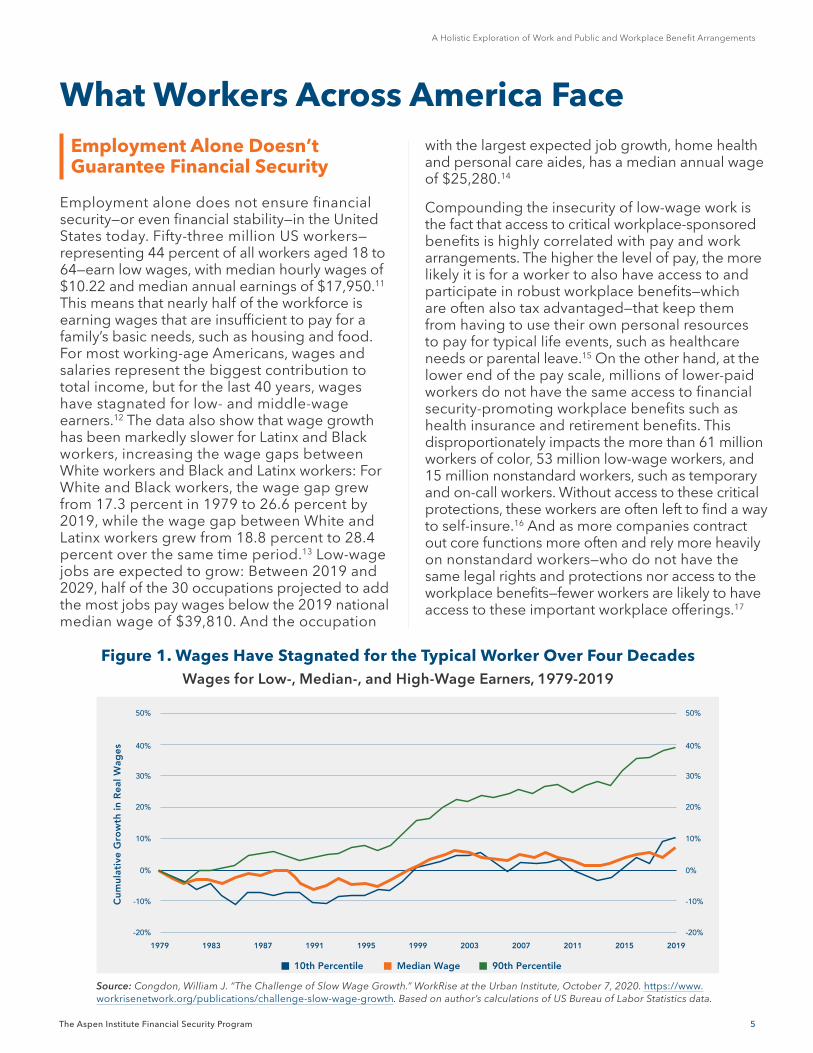
Source: Congdon, William J. “The Challenge of Slow Wage Growth.” WorkRise at the Urban Institute, October 7, 2020. https://www.workrisenetwork.org/publications/challenge-slow-wage-growth. Based on author’s calculations of US Bureau of Labor Statistics data.
5
A Holistic Exploration of Work and Public and Workplace Benefit Arrangements
The Aspen Institute Financial Security Program
with the largest expected job growth, home health and personal care aides, has a median annual wage of $25,280.14
Compounding the insecurity of low-wage work is the fact that access to critical workplace-sponsored benefits is highly correlated with pay and work arrangements. The higher the level of pay, the more likely it is for a worker to also have access to and participate in robust workplace benefits—which are often also tax advantaged—that keep them from having to use their own personal resources to pay for typical life events, such as healthcare needs or parental leave.15 On the other hand, at the lower end of the pay scale, millions of lower-paid workers do not have the same access to financial security-promoting workplace benefits such as health insurance and retirement benefits. This disproportionately impacts the more than 61 million workers of color, 53 million low-wage workers, and 15 million nonstandard workers, such as temporary and on-call workers. Without access to these critical protections, these workers are often left to find a way to self-insure.16 And as more companies contract out core functions more often and rely more heavily on nonstandard workers—who do not have the same legal rights and protections nor access to the workplace benefits—fewer workers are likely to have access to these important workplace offerings.17
What Workers Across America FaceEmployment Alone Doesn’t Guarantee Financial Security
Employment alone does not ensure financial security—or even financial stability—in the United States today. Fifty-three million US workers—representing 44 percent of all workers aged 18 to 64—earn low wages, with median hourly wages of $10.22 and median annual earnings of $17,950.11 This means that nearly half of the workforce is earning wages that are insufficient to pay for a family’s basic needs, such as housing and food. For most working-age Americans, wages and salaries represent the biggest contribution to total income, but for the last 40 years, wages have stagnated for low- and middle-wage earners.12 The data also show that wage growth has been markedly slower for Latinx and Black workers, increasing the wage gaps between White workers and Black and Latinx workers: For White and Black workers, the wage gap grew from 17.3 percent in 1979 to 26.6 percent by 2019, while the wage gap between White and Latinx workers grew from 18.8 percent to 28.4 percent over the same time period.13 Low-wage jobs are expected to grow: Between 2019 and 2029, half of the 30 occupations projected to add the most jobs pay wages below the 2019 national median wage of $39,810. And the occupation
Figure 1. Wages Have Stagnated for the Typical Worker Over Four DecadesWages for Low-, Median-, and High-Wage Earners, 1979-2019
6
The Complete Financial Lives of Workers
The Aspen Institute Financial Security Program
Millions of workers therefore rely on public benefits to close the gap between wages and basic living expenses—such as via nutritional assistance and housing assistance—and to provide important supports individuals may not otherwise have access to or an ability to afford, such as Medicaid to help with healthcare costs. For instance, an October 2020 study by the Government Accountability Office found that two-thirds of wage-earning adults enrolled in Medicaid or receiving Supplemental Nutrition Assistance Program (SNAP) benefits worked full time (35 hours or more per week).20 Researchers at the Urban Institute examined six “means-tested” programs, or those programs available only to people with income below the program’s threshold, that provide monthly benefits. These estimates thus do not include people receiving benefits from programs like Social Security (because the benefits go to both low- and high-income individuals), or tax credits like the Earned Income Tax Credit (that typically provide a single annual benefit). The Urban Institute estimates that in the average month, just under 1 in 5 people (19 percent), or 59 million people, is served by at least one of these six programs.ii Among those receiving public assistance, 43 percent are White, 26 percent are Hispanic, 23 percent are Black, and 8 percent are Asian, Pacific Islander, Alaskan Native, or American Indian.21 By age, half of US safety net recipients are working age (ages 18 to 64), 41 percent are children under 18, and 9 percent are ages 65 and older.22
Public and Workplace Benefits Create a Complex and Uneven Support System
Our systems of public and workplace benefits provide critical financial support for the millions of people who have access to and are able to participate in these programs. They provide a range of supports, such as cash and in-kind resources to reduce material hardship and cover basic needs, insurance to protect against health and economic risks, and on-ramps to financial
ii The programs examined in the Urban Institute’s analysis are Sup-plemental Nutrition Assistance Program (SNAP), Supplemental Security Income (SSI), Temporary Assistance for Needy Families (TANF), public or subsidized housing, Special Supplemental Nu-trition Program for Women, Infants, and Children, and childcare subsidies through the Child Care and Development Fund.
What Are Public and Workplace Benefits?
Public Benefits
Public benefits are delivered to individuals by the government. They include public assistance programs that are means-tested—where households can qualify based on having income below the program’s threshold—such as nutrition, housing, utility assistance, and Medicaid. These programs—sometimes referred to as the social safety net—are intended to fill the gap between what households earn and the cost of basic needs like food, housing, and medical care. Public benefits also include social insurance programs like Social Security retirement benefits, Social Security Disability Insurance, Medicare, and Unemployment Insurance, which are designed to protect individuals from major economic risks. While not the focus of this paper, there are also many public benefits that are administered through our tax system, such as the Earned Income Tax Credit (EITC) and the Child Tax Credit (CTC), as well as many ways that the tax code subsidizes wealth building, especially for higher income households.18
Workplace Benefits
Workplace benefits are private benefits that are distributed to workers through their employers. These include benefits such as retirement, health insurance and paid sick leave, and are part of a core bundle of benefits that contribute to workers’ financial stability. Workplace benefits are primarily discretionary in nature, but some workplace benefits are mandated (e.g., workers compensation) and publicly subsidized (e.g., health insurance, retirement contributions). There are also other workplace benefits, often known as “financial empowerment” or “financial wellness” programs, that are geared to help employees manage their finances to become more financially stable—such as financial coaching and counseling, savings programs, and workplace resource navigation services.19
7
A Holistic Exploration of Work and Public and Workplace Benefit Arrangements
The Aspen Institute Financial Security Program
participation rates, where resource dollars are not reaching those eligible: For example, SNAP participation in fiscal year 2016 was 75 percent, and for TANF it was just 23 percent in 2019.25 And over the last decade, a declining share of families eligible for the Special Supplemental Nutrition Program for Women, Infants, and Children (WIC) has participated.26
While public benefits are critical for workers, they are often not enough. Public benefits reduce levels of poverty in the United States by nearly half, yet even when accessed, households often struggle to make ends meet because programs are not necessarily designed to fully cover needs.27 For instance, SNAP reaches millions of households, but nearly one-third of participating families also utilize food banks.28
Additional variables impact public benefit receipt. There are also geographic and demographic variables impacting the likelihood that public benefits will support financial security, based on the likelihood people are eligible for benefits and that eligible people apply for benefits. These variables include geographic differences in the cost of living that impact how far the support stretches; state differences in public benefit availability, eligibility, generosity, and duration of benefit receipt;29 immigrants, and people with interaction with the criminal justice system, are frequently disqualified from eligibility; and household composition, especially the presence of children in the household.
stability and intergenerational wealth building. But these systems are not equally available to those who could benefit from them, the quality and adequacy of support differs, and programs can be complicated to access. The resulting situation, as described below, effectively leaves out many in-need people.
Public benefits are commonly hard-to-access and often inadequate.
The social safety net is made up of many different programs that vary in benefit and scope. While some public benefit programs are open to anyone who meets the eligibility criteria, known as “entitlement” programs, others are run on lotteries or other systems to distribute programs with limited funding, meaning that not all who qualify will receive support. Some programs are more generous and not time-limited, which may provide a stronger foundation of financial security for recipients than those that build in time limits or restrictions that penalize recipients for earning slightly more or building savings. Moreover, the processes for applying, recertifying, and demonstrating eligibility are not the same across programs and geography. For these reasons, individuals may not receive all the benefits to which they are eligible.23 Furthermore, eligibility criteria themselves keep some in-need people out, often intentionally.
For an individual to be in a stable situation while receiving public benefits thus entails great coordination on the part of the applicant and some luck. An individual who obtains a bundle of generous public benefits may be in a relatively stable position. Unfortunately, in America, this is a rare occurrence. Although more than half (56 percent) of low-income families with children receive multiple public benefits, the majority of those households are receiving only food assistance and public health insurance alone; fewer than 20 percent receive other benefits intended for families like theirs—such as housing or energy assistance, Temporary Assistance for Needy Families (TANF) and Supplemental Security Income (SSI)—or work supports like childcare or transportation assistance. The relatively small share of families who do receive a larger bundle of public benefits tend to be the most economically disadvantaged.24 Program data demonstrate that there are also gaps in
Benefits Vary by State...
In fiscal year 2018, monthly TANF benefits averaged $423 nationally, but ranged from $137 in Mississippi up to $707 in New Hampshire.30
But Are Less Generous in States with Larger Proportions of Black Residents
States with a higher share of Black residents have TANF benefits that are less generous and more restrictive.31 Similarly, RAND finds that states with a higher share of Black workers have less generous unemployment benefits.32
8 The Aspen Institute Financial Security Program
The Complete Financial Lives of Workers
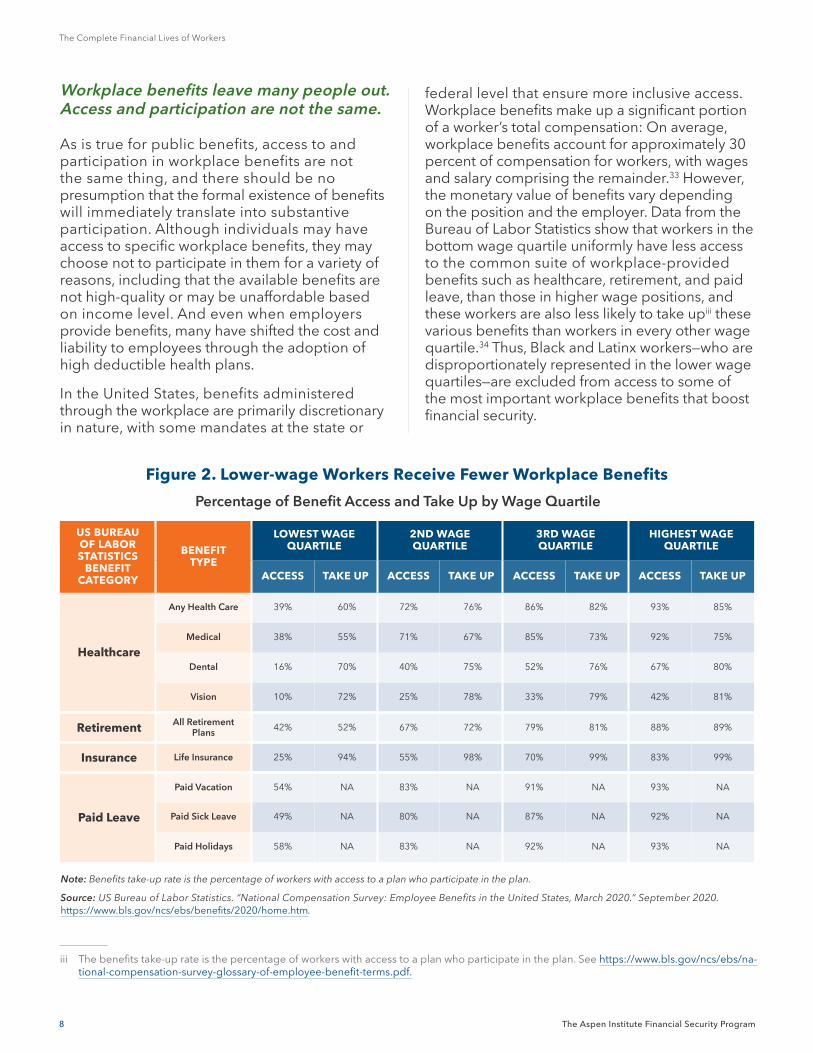
federal level that ensure more inclusive access. Workplace benefits make up a significant portion of a worker’s total compensation: On average, workplace benefits account for approximately 30 percent of compensation for workers, with wages and salary comprising the remainder.33 However, the monetary value of benefits vary depending on the position and the employer. Data from the Bureau of Labor Statistics show that workers in the bottom wage quartile uniformly have less access to the common suite of workplace-provided benefits such as healthcare, retirement, and paid leave, than those in higher wage positions, and these workers are also less likely to take upiii these various benefits than workers in every other wage quartile.34 Thus, Black and Latinx workers—who are disproportionately represented in the lower wage quartiles—are excluded from access to some of the most important workplace benefits that boost financial security.
iii The benefits take-up rate is the percentage of workers with access to a plan who participate in the plan. See https://www.bls.gov/ncs/ebs/na-tional-compensation-survey-glossary-of-employee-benefit-terms.pdf.
Workplace benefits leave many people out. Access and participation are not the same.
As is true for public benefits, access to and participation in workplace benefits are not the same thing, and there should be no presumption that the formal existence of benefits will immediately translate into substantive participation. Although individuals may have access to specific workplace benefits, they may choose not to participate in them for a variety of reasons, including that the available benefits are not high-quality or may be unaffordable based on income level. And even when employers provide benefits, many have shifted the cost and liability to employees through the adoption of high deductible health plans.
In the United States, benefits administered through the workplace are primarily discretionary in nature, with some mandates at the state or
Figure 2. Lower-wage Workers Receive Fewer Workplace Benefits
Percentage of Benefit Access and Take Up by Wage Quartile
Note: Benefits take-up rate is the percentage of workers with access to a plan who participate in the plan.
Source: US Bureau of Labor Statistics. “National Compensation Survey: Employee Benefits in the United States, March 2020.” September 2020. https://www.bls.gov/ncs/ebs/benefits/2020/home.htm.
US BUREAU OF LABOR STATISTICS
BENEFIT CATEGORY
BENEFIT TYPE
LOWEST WAGE QUARTILE
2ND WAGE QUARTILE
3RD WAGE QUARTILE
HIGHEST WAGE QUARTILE
ACCESS TAKE UP ACCESS TAKE UP ACCESS TAKE UP ACCESS TAKE UP
Healthcare
Any Health Care 39% 60% 72% 76% 86% 82% 93% 85%
Medical 38% 55% 71% 67% 85% 73% 92% 75%
Dental 16% 70% 40% 75% 52% 76% 67% 80%
Vision 10% 72% 25% 78% 33% 79% 42% 81%
Retirement All Retirement Plans 42% 52% 67% 72% 79% 81% 88% 89%
Insurance Life Insurance 25% 94% 55% 98% 70% 99% 83% 99%
Paid Leave
Paid Vacation 54% NA 83% NA 91% NA 93% NA
Paid Sick Leave 49% NA 80% NA 87% NA 92% NA
Paid Holidays 58% NA 83% NA 92% NA 93% NA
9
A Holistic Exploration of Work and Public and Workplace Benefit Arrangements
The Aspen Institute Financial Security Program
The discretionary nature of workplace benefits can also be seen in the fact that nonstandard workers have far less access to workplace benefits. According to the BLS’ Contingent Worker Supplement, 13 percent of temporary agency workers, 28 percent of on-call workers, and 41 percent of contract company workers
This section provides a new matrix of work arrangement and benefits that demonstrates the heterogeneity of people’s experiences with work and benefit situations and the resulting likelihood of financial security at the individual level. The matrix and the accompanying definitions and subsequent analysis help identify where solutions and interventions to support workers are most needed.
Work and Benefit Arrangements Greatly Impact Financial Outcomes
US workers—defined here as everyone earning income for labor performed, regardless of classification—do not all have the same work arrangements nor access to the same types or quality of workplace and public benefits. Millions of other US adults—such as people who are unemployed and seeking work, retirees, family caregivers, and people whose disabilities preclude paid work—need income from other sources. This variety of circumstances results in different financial security outcomes. In addition, people may have different needs from work based on their age and individual situations.
have employer-provided health insurance compared with 53 percent of workers in traditional work arrangements.35 People of color, women, immigrants, and people with disabilities are overrepresented in nonstandard arrangements, which often have low pay and limited access to workplace benefits.36
Someone close to retirement may place greater importance on an employer’s retirement contributions or the quality of healthcare benefits, while a recent graduate may be more interested in a job that contributes to paying off student loan debt. These personal preferences matter and may affect an individual’s ability to move between jobs or remain in the labor market, but ultimately it is critical that wages and benefits provide a foundation of stability and security.
Work Arrangements, Benefits, and Employer Practices Are Not Meeting the Needs of Workers
On average, workplace benefits account for approximately 30 percent of compensation for workers, with wages and salary comprising the remainder.
“
”
A Matrix of Work and Benefit Arrangements
About the Matrix
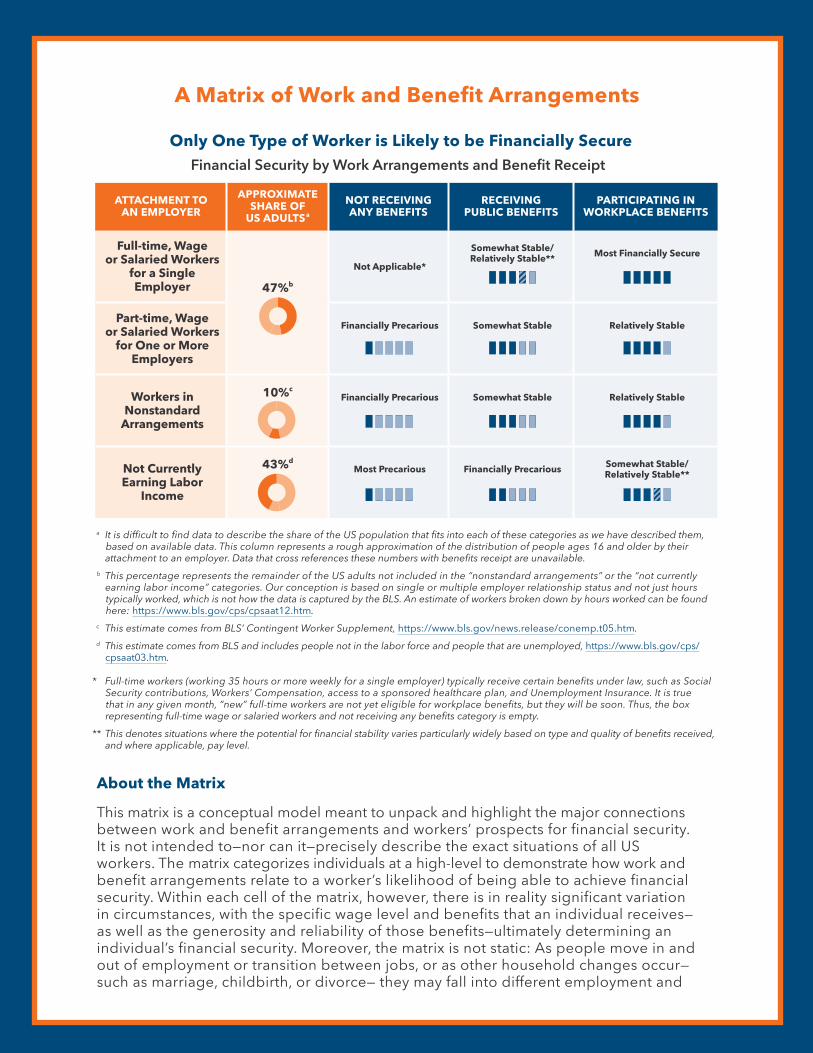
This matrix is a conceptual model meant to unpack and highlight the major connections between work and benefit arrangements and workers’ prospects for financial security. It is not intended to—nor can it—precisely describe the exact situations of all US workers. The matrix categorizes individuals at a high-level to demonstrate how work and benefit arrangements relate to a worker’s likelihood of being able to achieve financial security. Within each cell of the matrix, however, there is in reality significant variation in circumstances, with the specific wage level and benefits that an individual receives—as well as the generosity and reliability of those benefits—ultimately determining an individual’s financial security. Moreover, the matrix is not static: As people move in and out of employment or transition between jobs, or as other household changes occur—such as marriage, childbirth, or divorce— they may fall into different employment and
Only One Type of Worker is Likely to be Financially Secure Financial Security by Work Arrangements and Benefit Receipt
a It is difficult to find data to describe the share of the US population that fits into each of these categories as we have described them, based on available data. This column represents a rough approximation of the distribution of people ages 16 and older by their attachment to an employer. Data that cross references these numbers with benefits receipt are unavailable.
b This percentage represents the remainder of the US adults not included in the “nonstandard arrangements” or the “not currently earning labor income” categories. Our conception is based on single or multiple employer relationship status and not just hours typically worked, which is not how the data is captured by the BLS. An estimate of workers broken down by hours worked can be found here: https://www.bls.gov/cps/cpsaat12.htm.
c This estimate comes from BLS’ Contingent Worker Supplement, https://www.bls.gov/news.release/conemp.t05.htm. d This estimate comes from BLS and includes people not in the labor force and people that are unemployed, https://www.bls.gov/cps/
cpsaat03.htm.
* Full-time workers (working 35 hours or more weekly for a single employer) typically receive certain benefits under law, such as Social Security contributions, Workers’ Compensation, access to a sponsored healthcare plan, and Unemployment Insurance. It is true that in any given month, “new” full-time workers are not yet eligible for workplace benefits, but they will be soon. Thus, the box representing full-time wage or salaried workers and not receiving any benefits category is empty.
** This denotes situations where the potential for financial stability varies particularly widely based on type and quality of benefits received, and where applicable, pay level.
ATTACHMENT TO AN EMPLOYER
APPROXIMATE SHARE OF
US ADULTSa
NOT RECEIVING ANY BENEFITS
RECEIVING PUBLIC BENEFITS
PARTICIPATING IN WORKPLACE BENEFITS
Full-time, Wage or Salaried Workers
for a Single Employer 47%b
Not Applicable*
Somewhat Stable/ Relatively Stable** Most Financially Secure
Part-time, Wage or Salaried Workers
for One or More Employers
Financially Precarious Somewhat Stable Relatively Stable
Workers in Nonstandard
Arrangements
10%cFinancially Precarious Somewhat Stable Relatively Stable
Not Currently Earning Labor
Income
43%dMost Precarious Financially Precarious Somewhat Stable/
Relatively Stable**
47+10+43+x
47+10+43+x47+10+43+x
benefit categories. Individuals may receive benefits via their own eligibility or through other household members. In addition, people get benefits from a range of sources, often overlapping, and thus, there are certainly people that participate in both public and workplace benefit systems (here, we categorize those individuals in the “participating in workplace benefits” category). Workers with multiple jobs could fall into more than one employment arrangement, but we focus on where people receive the majority of their income (so people with multiple jobs would likely fall into either the “part-time, wage or salaried workers” or “workers in nonstandard arrangements” categories). Lastly, though we focus here on the individual, it should be noted that having multiple earners in a household will affect prospects for financial security and can also affect public benefit eligibility which is often conditional on household—not individual—income.
Definitions and Descriptions
Full-time, wage or salaried workers are those typically working 35 hours or more weekly for a single employer. Working hours and pay for these individuals are most likely stable and these positions often include access to workplace benefits. Wage level will be a large determinant for how financially secure these workers are, and as discussed previously, wage level is also highly correlated with access to workplace benefits.
The category of part-time, wage or salaried workers is more varied, with some workers holding jobs with stable and predictable hours and pay, and others experiencing more volatility in their number of hours and the stability of those hours, and as a result, in their paychecks. Workers in this category may work 35 hours or more weekly, but not all for a single employer (i.e., they may have multiple part-time jobs). These workers may have access to some workplace benefits, such as paid time off, retirement benefits, or sick leave, depending on their geographic location and their position.
The workers in nonstandard arrangements category also represents a range of employment situations— including temporary workers, on-call workers, subcontracted workers, and independent contractors—some of whom work through online platforms.37 Workers that face employment barriers, like those without documentation or the formerly incarcerated, are more likely to hold these positions. But this category also includes high-earning freelancers and consultants that have more control over their schedules and the means to purchase benefits on the private market.
Individuals not currently earning labor income encompasses people who are unemployed and seeking work, retirees, and individuals who are unable to work for any number of reasons, such as caregiving responsibilities, a temporary illness or injury, or a permanent disability. Without any benefits to fall back on, these individuals are likely in a more financially precarious position than those receiving public or workplace benefits.
Those individuals that are not receiving any public or workplace benefits fall into the not receiving any benefits category. These individuals are also not receiving benefits through other household members.
Those individuals receiving public benefits only could be on a range of social insurance or public assistance programs intended to serve different purposes and may be receiving support from more than one program.
Individuals participating in workplace benefits are participating in at least one workplace-provided benefit program, which could be a private benefit program or a program created, funded, mandated, or regulated by policy, but delivered through or dependent on a relationship with an employer—such as state paid leave programs, health insurance, and many retirement plans.38

12
The Complete Financial Lives of Workers
The Aspen Institute Financial Security Program
likely to be financially secure than those individuals receiving public benefits or those participating in workplace benefits.
• Quality workplace benefits currently provide more financial security than public benefits alone. To qualify for public assistance, one must often demonstrate deep financial insecurity—or in the case of social insurance program, an inability to work—and the typical amount and duration of benefits received leave many individuals still only somewhat financially stable. Workplace benefits, on the other hand, typically do not consider one’s level of financial security for eligibility and do more to boost workers’ financial resilience and stability in the short-term and to build financial security in the long-term—for workers lucky enough to have access to high-quality benefits.
• Variation in voluntary employer practices drives unequal outcomes. Work in each of the employment categories varies greatly in stability, pay, and benefits access, meaning that one part-time job in hourly retail is not the same as another. Certain positions are unlikely to provide the same financial security prospects as working part-time in a position with higher median wages and more stable hours.
• Public and workplace benefits are critical sources of financial stability for people not currently earning labor income. The financial security prospects of adults not currently earning labor income—such as unemployed individuals, retirees, or those unable to work—will be largely dictated by whether they have access to public and workplace benefits through their own eligibility or through someone in their household, and whether those supports are offered temporarily or permanently. Individuals permanently out of the labor force and receiving permanent income streams—like Social Security retirement benefits or Social Security Disability Insurance, in addition to Medicaid or subsidized housing—tend to be more financially stable than others not receiving these benefits. People in this category may also be receiving payments derived from prior employment, such as private pension payments or support through employer-provided short-term or long-term disability insurance.
The Matrix Highlights that Today’s Labor Market and Benefits Systems Leave Many Workers Behind
Taken together, work and benefit arrangements greatly impact whether an individual will experience financial instability, stability, or security. The interior boxes of the matrix presented in the Matrix depict the financial security situations of those that fall into each category. These range from individuals that struggle to maintain financial stability, to those that have some meaningful resilience against shocks and are relatively stable, to those that are more financially secure and best positioned to pursue mobility-enhancing endeavors such as education, training, and entrepreneurship. Based on the analysis from the matrix and the work and benefits landscape described above, we observe the following patterns across all US workers in today’s labor market and policy landscape:
• In our current system of work and benefit arrangements, only one type of worker—higher income, full-time employees receiving workplace benefits—stands a reasonable shot at financial security. Full-time workers are more likely to have stable and predictable hours and pay, resulting in a more stable situation overall, than individuals in other employment categories. Workers with higher earnings across all our employment categories are also likely to be more financially secure than those with lower wages, so long as their employment is stable. In fact, the stability and predictability of hours and pay is a large determinant of the financial security prospects of part-time workers as well as self-employed and gig workers—especially as these latter groups are among those least likely to have access to workplace benefits on their own.39 In addition, workers with volatile earnings or unpredictable hours are also more likely to churn off and onto public benefits.
• Benefits of any kind are additive, boosting people beyond their earnings alone. Many public and workplace benefits directly boost people’s cash flows, by adding income or subsidizing the cost of living. Furthermore, people cannot self-insure against large shocks all the time, so individuals that are not receiving any benefits are less
13
A Holistic Exploration of Work and Public and Workplace Benefit Arrangements
The Aspen Institute Financial Security Program
workers in America value job security and stability above all other workplace benefits. This benefit was top of mind for 40 percent of African American workers, 38 percent of Asian American workers, 34 percent of White workers, and 26 percent of Latinx workers.41
• Paid leave. Some benefits provide particularly valuable support for workers’ likelihood of experiencing routinely positive cash flow, such as paid leave. Paid leave supports routinely positive cash flow because it allows a worker to take needed time off to address a health issue that prevents them from working, bond with a new baby, or serve as a caretaker for a loved one, without losing income while doing so.
• Benefits navigation support. Benefits or resource navigation services, which help connect workers to needed community, public, and employer-provided benefits, can help workers identify and secure available resources to stabilize income in times of uncertainty or volatility. Assistance with a utility payment can free up cash if a worker experiences an unexpected car repair or a roommate unexpectedly moves out; help navigating local childcare can help a new parent make the decision to return to work. Resource navigation can help workers stay at work and maintain a steadier income stream or lower cost of living overall.42
Similar Patterns Hold for LMI Workers, But Some Structural Barriers are Particularly Acute for ThemBeyond the patterns observed in the matrix for all US workers, insights from the Consumer Insights Collaborative (CIC) provide additional nuance to the conditions that improve, and impede, financial security for LMI workers in particular. For more information on the CIC members referenced in this section, see page 1.
Four Work and Benefit Conditions that Support Financial Stability for LMI Workers
The CIC finds that LMI workers’ financial security is improved if four conditions are present: (1) Consistent, predictable pay and workplace benefits that facilitate routinely positive cash flow; (2) full-time, non-low-wage work; (3) comprehensive workplace benefits and support services; and (4) adequate and consistent public benefit receipt.
1. Consistent, predictable pay and workplace benefits that facilitate routinely positive cash flow. Routinely positive cash is the foundation of financial stability and security. Without it, workers can neither meet their financial obligations nor build savings and other financial cushions. The CIC and other data sources identify a number of conditions that support LMI workers’ ability to experience routinely positive cash flow.
• Consistent pay and predictable hours. Workers with consistent pay and predictable hours—a steady paycheck—are more likely to experience routinely positive cash flow. This issue is top of mind for SaverLife’s California members, who in 2019, identified “a more consistent work schedule” as their most pressing economic issue.40 Relatedly, in a nationally representative survey fielded in September 2018, the Joint Center for Political and Economic Studies found that
14
The Complete Financial Lives of Workers
The Aspen Institute Financial Security Program
employees also have less debt in collections, are more likely to have access to workplace benefits, and are more likely to be able to access the credit needed to achieve important financial goals, and at cheaper rates due to their higher credit scores.48 LIFT has also found that their members that work full time have more job stability overall. This was evident during COVID-19, as fewer full-time LIFT members lost their jobs versus those in other work arrangements.49
3. Comprehensive workplace benefits and support services. Traditional workplace benefits are critical for financial security. Complementary support services, often called financial empowerment or financial wellness programs, can help workers build on a foundation of routinely positive cash flow.
Access to traditional workplace benefits. Workers with access to comprehensive benefits via their workplace, including health and retirement benefits and paid leave, are often in a better financial position compared with those without this access. And because jobs that offer benefits tend to pay higher wages, these individuals are also more likely to be able to participate and contribute more to benefits that provide greater financial stability, which compounds the differences in financial outcomes between workers with access and those without access to benefits. In a survey of workers with annual household incomes under $55,000, Commonwealth found that 75 percent of workers surveyed said they were currently struggling or just getting by financially.50 A common challenge faced by these workers is access to health and retirement benefits, across all work categories studied. This lack of access translates directly into people struggling to save for retirement, pay for medical expenses, or save for emergencies. For instance, 32
Despite Its Importance for Worker Financial Security, Paid Leave is Not Available to Most Low-wage Workers
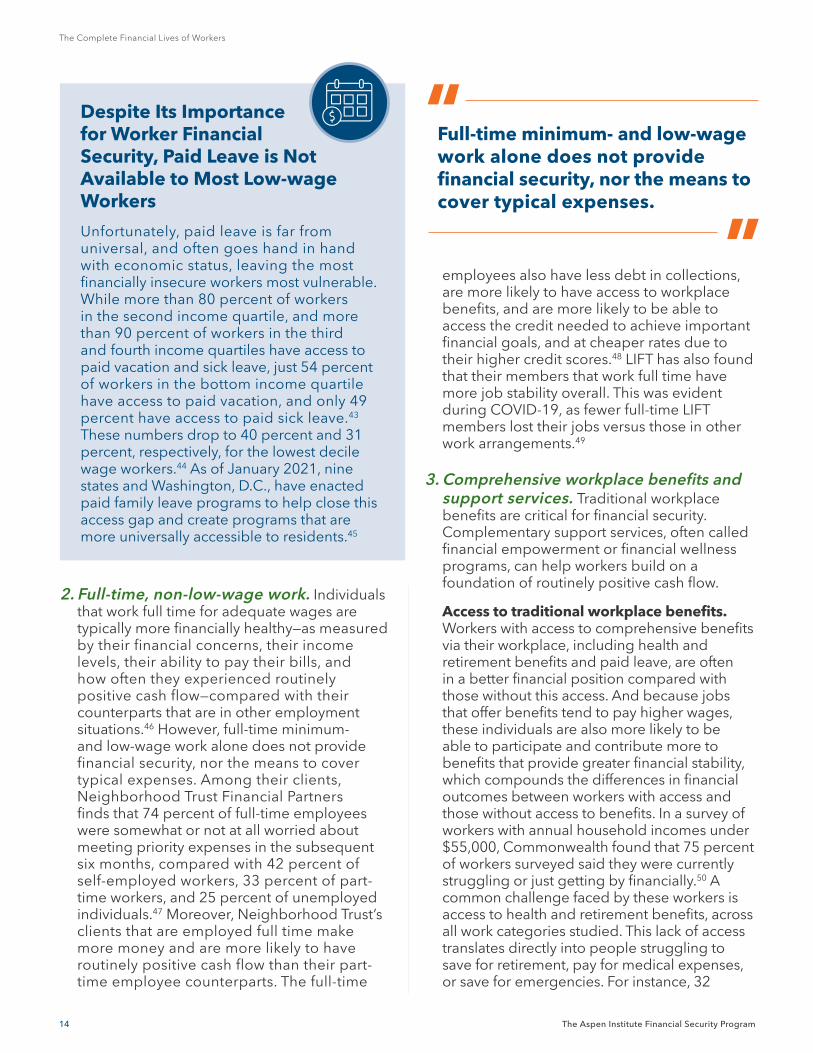
Unfortunately, paid leave is far from universal, and often goes hand in hand with economic status, leaving the most financially insecure workers most vulnerable. While more than 80 percent of workers in the second income quartile, and more than 90 percent of workers in the third and fourth income quartiles have access to paid vacation and sick leave, just 54 percent of workers in the bottom income quartile have access to paid vacation, and only 49 percent have access to paid sick leave.43 These numbers drop to 40 percent and 31 percent, respectively, for the lowest decile wage workers.44 As of January 2021, nine states and Washington, D.C., have enacted paid family leave programs to help close this access gap and create programs that are more universally accessible to residents.45
2. Full-time, non-low-wage work. Individuals that work full time for adequate wages are typically more financially healthy—as measured by their financial concerns, their income levels, their ability to pay their bills, and how often they experienced routinely positive cash flow—compared with their counterparts that are in other employment situations.46 However, full-time minimum- and low-wage work alone does not provide financial security, nor the means to cover typical expenses. Among their clients, Neighborhood Trust Financial Partners finds that 74 percent of full-time employees were somewhat or not at all worried about meeting priority expenses in the subsequent six months, compared with 42 percent of self-employed workers, 33 percent of part-time workers, and 25 percent of unemployed individuals.47 Moreover, Neighborhood Trust’s clients that are employed full time make more money and are more likely to have routinely positive cash flow than their part-time employee counterparts. The full-time
Full-time minimum- and low-wage work alone does not provide financial security, nor the means to cover typical expenses.
“
”
Part-time Workers All Workers Full-time Workers
0 $1,000 $2,000 $3,000 $4,000 $5,000 $6,000 $7,000 $8,000
TYPICAL SAVINGS TOTALS
No Workplace Benefits
At Least One Workplace Benefit
$1,100
$900
$700 $1,600
$4,498 $7,100
15
A Holistic Exploration of Work and Public and Workplace Benefit Arrangements
The Aspen Institute Financial Security Program
• Financial coaching and counseling. Financial coaching and counseling provide clients with customized solutions to meet individual goals, and have been shown to improve clients’ outcomes, such as increased savings balances and lower reliance on payday loans.55 These programs have adjusted to meet clients where they are, such as Neighborhood Trust’s TrustPlus program, which evolved from an in-person model to a tele-coaching model, where clients can meet with their financial coaches via phone or video appointments. Incorporating these services into workplace benefit offerings means they are coming from a trusted entity, and that can help increase program participation.56 Financial coaching can also help connect clients with other needed resources, such as help navigating complex benefit systems. For instance, since the start of the pandemic, more than 25 percent of Neighborhood Trust clients have worked with a financial coach to access public or private benefits.57
• Benefits that protect workers against shocks or manage unexpected large expenses. The provision of employee hardship funds—emergency grants meant to help workers address a disaster-related or personal financial hardship—is one way employers can support workers in moments of need. However, these funds are not a replacement for sufficient wages and accompanying benefits. Rather, they
percent of workers skipped a medical treatment in the prior 12 months because they could not afford it.51
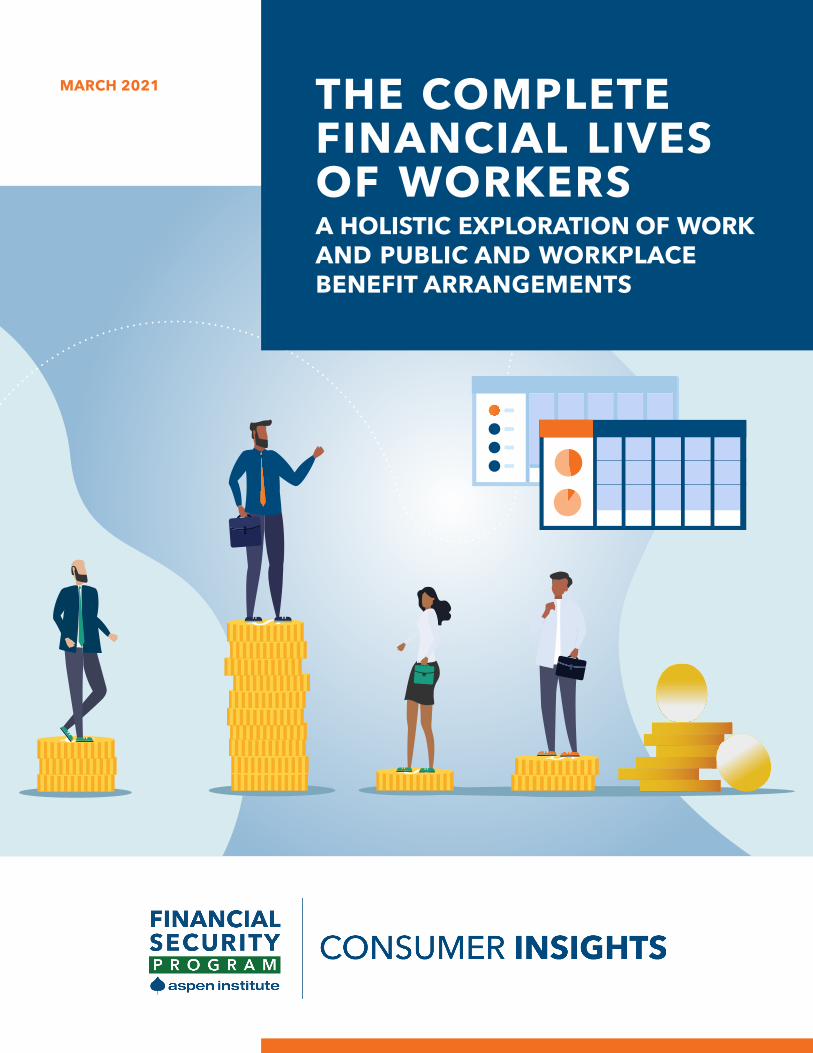
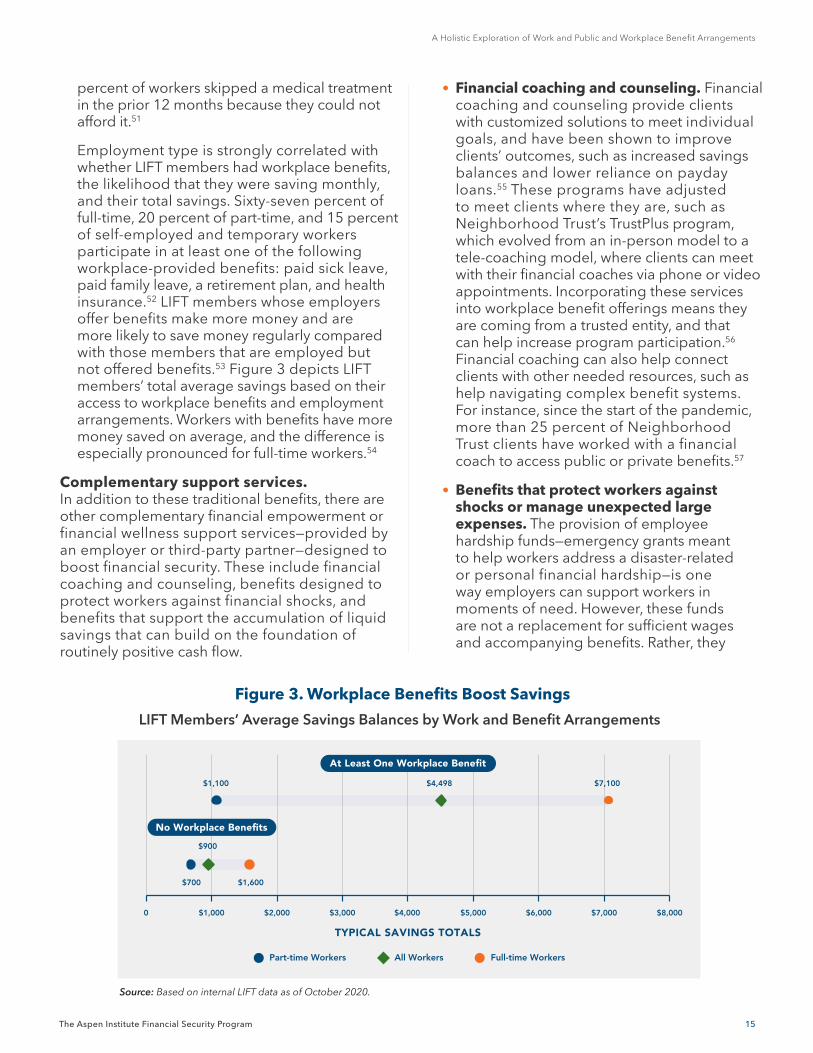
Employment type is strongly correlated with whether LIFT members had workplace benefits, the likelihood that they were saving monthly, and their total savings. Sixty-seven percent of full-time, 20 percent of part-time, and 15 percent of self-employed and temporary workers participate in at least one of the following workplace-provided benefits: paid sick leave, paid family leave, a retirement plan, and health insurance.52 LIFT members whose employers offer benefits make more money and are more likely to save money regularly compared with those members that are employed but not offered benefits.53 Figure 3 depicts LIFT members’ total average savings based on their access to workplace benefits and employment arrangements. Workers with benefits have more money saved on average, and the difference is especially pronounced for full-time workers.54
Complementary support services. In addition to these traditional benefits, there are other complementary financial empowerment or financial wellness support services—provided by an employer or third-party partner—designed to boost financial security. These include financial coaching and counseling, benefits designed to protect workers against financial shocks, and benefits that support the accumulation of liquid savings that can build on the foundation of routinely positive cash flow.
Figure 3. Workplace Benefits Boost Savings
LIFT Members’ Average Savings Balances by Work and Benefit Arrangements
Source: Based on internal LIFT data as of October 2020.
16
The Complete Financial Lives of Workers
The Aspen Institute Financial Security Program
their financial institutions to offer no-fee, no-minimum savings accounts to make savings more accessible.65 For example, as part of Blackrock’s Emergency Savings Initiative, Commonwealth partnered with UPS and its recordkeeper, Voya, to offer a liquid savings solution for UPS’s employees—marking a major step forward for employers’ role in supporting workers’ financial security.66
4. Adequate and consistent public benefit receipt. Low-income workers that reliably receive adequate public benefits are in a stronger financial position than those with similar incomes that are not receiving consistent public benefits.67 Moreover, Change Machine coaches report that public benefits provide stability for low-income workers.68 Change Machine finds that employed clients that receive public benefits to cover food, utilities, or housing costs—or support from Medicare or Medicaid—are more likely to reduce their debt burdens than those clients that do not receive this public support.69 The same cannot be said for their unemployed clients receiving public benefits.70 A job loss or an inability to participate in the workforce and a lack of benefit receipt is a combination that can yield extreme financial destabilization, as illustrated in the Matrix
Three Aspects of Our Current System Prevent LMI Workers from Achieving Financial Stability
According to Consumer Insights Collaborative members, three barriers prevent low- and moderate-income workers from achieving financial security:
1. Public benefits are designed to be hard to access. Barriers to accessing public benefits can complicate an individual’s ability to participate or receive the benefits for which they may be eligible. For instance, asset limits—or caps on the amount of cash, savings, or other assets one can have to qualify for a benefit—and benefits cliffs—where benefits decrease as income increases—create disincentives and inhibit a person’s ability to build up the financial cushions needed to achieve financial stability and eventually, financial security and upward economic mobility. Asset limits and benefit cliffs can also prematurely deny access to benefits for
provide an additional, creative support in a 21st century safety net. The Aspen Institute Financial Security Program and Commonwealth found that employee hardship funds are most effective when paired with sufficient wages and comprehensive benefits including paid leave and additional supports such as financial coaching, mental health services, and access to low-cost loans. For example, workers with paid leave benefits were able to leverage their funds received to address their emergency, rather than compensate for any lost wages.58
• Workplace benefits that support the building up of liquid savings. Workplace benefits such as employer matches or incentives can help workers build liquid savings, which research has shown to be the factor most correlated with financial well-being.59 Having liquid savings protects against material hardship and associated declines in financial health.60 For instance, SaverLife and the FINRA Foundation find that a financial buffer of more than $100 helps individuals keep their utilities on and avoid high-cost borrowing, and that having more than $250 in savings increases housing security.61
Yet, while liquid savings provide important financial stability, low- and middle-income workers often struggle to build up this cushion.62 In a nationally representative survey of workers with annual household incomes of under $60,000, Commonwealth found that 45 percent of respondents said that they did not save regularly, and nearly 77 percent of respondents said that they did not save more money because they felt that they could not afford to do so.63
Employers and benefit providers can take steps to help make saving easier or automatic or encourage more savings via seeded accounts, a match, or other monetary incentives. Commonwealth found that workers using split direct deposit—which directly deposits a designated amount of savings automatically out of a paycheck—were far more likely to have more than $400 in their savings account (59 percent) than those making manual deposits (41 percent).64 Employers can also work with
17
A Holistic Exploration of Work and Public and Workplace Benefit Arrangements
The Aspen Institute Financial Security Program
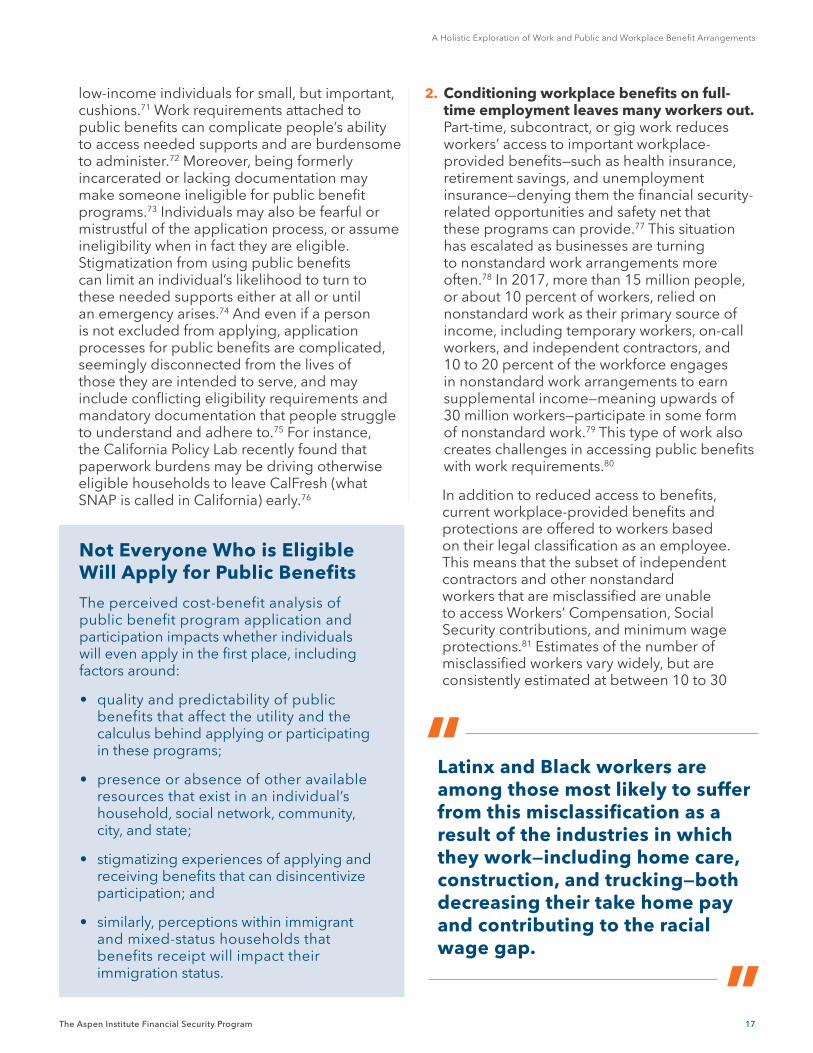
2. Conditioning workplace benefits on full-time employment leaves many workers out. Part-time, subcontract, or gig work reduces workers’ access to important workplace-provided benefits—such as health insurance, retirement savings, and unemployment insurance—denying them the financial security-related opportunities and safety net that these programs can provide.77 This situation has escalated as businesses are turning to nonstandard work arrangements more often.78 In 2017, more than 15 million people, or about 10 percent of workers, relied on nonstandard work as their primary source of income, including temporary workers, on-call workers, and independent contractors, and 10 to 20 percent of the workforce engages in nonstandard work arrangements to earn supplemental income—meaning upwards of 30 million workers—participate in some form of nonstandard work.79 This type of work also creates challenges in accessing public benefits with work requirements.80
In addition to reduced access to benefits, current workplace-provided benefits and protections are offered to workers based on their legal classification as an employee. This means that the subset of independent contractors and other nonstandard workers that are misclassified are unable to access Workers’ Compensation, Social Security contributions, and minimum wage protections.81 Estimates of the number of misclassified workers vary widely, but are consistently estimated at between 10 to 30
low-income individuals for small, but important, cushions.71 Work requirements attached to public benefits can complicate people’s ability to access needed supports and are burdensome to administer.72 Moreover, being formerly incarcerated or lacking documentation may make someone ineligible for public benefit programs.73 Individuals may also be fearful or mistrustful of the application process, or assume ineligibility when in fact they are eligible. Stigmatization from using public benefits can limit an individual’s likelihood to turn to these needed supports either at all or until an emergency arises.74 And even if a person is not excluded from applying, application processes for public benefits are complicated, seemingly disconnected from the lives of those they are intended to serve, and may include conflicting eligibility requirements and mandatory documentation that people struggle to understand and adhere to.75 For instance, the California Policy Lab recently found that paperwork burdens may be driving otherwise eligible households to leave CalFresh (what SNAP is called in California) early.76
Not Everyone Who is Eligible Will Apply for Public Benefits
The perceived cost-benefit analysis of public benefit program application and participation impacts whether individuals will even apply in the first place, including factors around:
• quality and predictability of public benefits that affect the utility and the calculus behind applying or participating in these programs;
• presence or absence of other available resources that exist in an individual’s household, social network, community, city, and state;
• stigmatizing experiences of applying and receiving benefits that can disincentivize participation; and
• similarly, perceptions within immigrant and mixed-status households that benefits receipt will impact their immigration status.
Latinx and Black workers are among those most likely to suffer from this misclassification as a result of the industries in which they work—including home care, construction, and trucking—both decreasing their take home pay and contributing to the racial wage gap.
“
”
18
The Complete Financial Lives of Workers
The Aspen Institute Financial Security Program
Worker Security in a Time of Crisis: Lessons from COVID-19
percent of employers misclassifying workers, and that number has risen in the last decade.82 Latinx and Black workers are among those most likely to suffer from this misclassification as a result of the industries in which they work—including home care, construction, and trucking—both decreasing their take home pay and contributing to the racial wage gap.83
3. The cost of benefits to low-wage workers prevents workers from participating, even when eligible. Access to benefits alone does not guarantee participation in workplace-provided benefits, as can be seen in the gaps
between those who are eligible for benefits and the actual numbers who participate in them. Participation rates in retirement and healthcare plans are low for the lowest-wage workers and part-time workers compared with full-time and the highest-wage workers, which points to the difficulty that workers face in participating in benefits when they need their full paycheck to try to make ends meet.84 In 2019, more than 7 in 10 non-elderly individuals without healthcare insurance cited the high cost of coverage as the reason for remaining uninsured.85
The health and economic ramifications of COVID-19 have been felt across the US. In 2020, unemployment rates went from lows of 3.5 percent in January and February 2020—before the pandemic gained traction in the United States—to a staggering 14.8 percent in April 2020.86
The pandemic did not affect people equally; some groups experienced the impacts disproportionately. As of mid-October 2020, the employment rate for households with annual incomes under $27,000 was down 19 percent compared with January 2020, and up 1.2 percent for those in the highest wage jobs (making over $60,000). For middle-wage workers, employment was down 4 percent.87 The Pew Research Center found that fewer mothers and fathers are working as a result of COVID-19, and that those that are working are putting in fewer hours than they were prior to the pandemic.88 Whereas men gained 16,000 jobs in December 2020, women lost 156,000 jobs, though a deeper exploration reveals that it was women of color who bore the brunt of these job losses.89
Occupational segregation led to certain groups being more impacted by the pandemic through job losses and potential COVID-19 exposure. Demographics are closely tied to
work sectors, meaning that some groups were more likely to be impacted by unemployment and mass layoffs. In a survey, the Social Policy Institute at Washington University in St. Louis found that Hispanic, low-income, and younger individuals (between ages 18 to 24) were most likely to experience job or income loss from the pandemic.90 Hispanic workers are disproportionately represented in sectors affected by the pandemic, such as hospitality and construction, whereas Black workers are overrepresented in industries such as healthcare, which have been less affected by job loss.91 For LMI workers, this can be a double-edged sword, because while some workers are able to maintain an income, they are also less likely to work in jobs that allow teleworking, putting them at a higher risk of COVID-19 exposure if they remain employed.92 And, because LMI workers are also the least likely to have access to workplace benefits, they are vulnerable to the financial and health consequences of a potential exposure, with few, if any, sick days, or an inability to use those days without risking job loss. Beyond the harm to these workers and their families, this inequitable access to paid leave—and paid sick leave, in particular—is a nationwide vulnerability as the world contends with a public health crisis where keeping sick people home is critical.
19
A Holistic Exploration of Work and Public and Workplace Benefit Arrangements
The Aspen Institute Financial Security Program
Fund had improved food and housing security.95 SaverLife members who received SNAP benefits as well as a $500 cash grant were better able to meet their nutritional needs.96 Recipients of #GiveTogetherNow funds from the Family Independence Initiative—including hospitality and restaurant workers, people of color, undocumented immigrants, and others disproportionality impacted by the pandemic—spent these funds on needed essentials, such as food, housing, and utilities, or to provide support to family and friends.97 MyPath began distributing funds monthly to young adults hardest hit by COVID’s economic impacts, including youth transitioning out of foster care and young parents, and the payments are helping cover the cost of housing and other essentials.98
In addition, many cash infusion pilots and programs have been introduced or expanded during the pandemic, including payments made by the US federal government in the form of direct cash infusions and via expanded unemployment benefits. Research has demonstrated that millions were kept out of poverty by the direct cash infusions.99 The JPMorgan Chase Institute found that the additional UI payments helped people build up a savings buffer before the program expired, and then use those savings to stabilize their expenses once the program ended.100 Neighborhood Trust found that clients that received funds from expanded unemployment were in a better position to meet financial obligations: credit scores improved, debt loads decreased, and clients were able to avoid having debt fall into collections at rates similar to prior to the crisis, despite 44 percent of their clients reporting that the pandemic had significantly or completely reduced their income.101
COVID-19 Revealed Four Lessons
The far-reaching scale of COVID-19 has exaggerated what we already knew to be true about worker financial security, laying bare the stark differences experienced by workers depending on where they live, where they work, and the public and workplace benefits they receive. But this public health emergency has caused an economic fallout—a dual combination unprecedented in living memory—that has served as a stress test on the system that is teaching us new lessons about what workers need and who has been best positioned to weather the crisis.
1. The risk of critical benefits being delivered through the workplace becomes clear when millions lose their jobs.COVID-19 has revealed the risk the United States as a society undertook by conditioning the provision of essential benefits, especially health insurance, to the workplace. As millions of people were losing their jobs and main sources of income, those lucky enough to have health insurance and other workplace benefits were losing those supports at the same time. In addition, with the rise in gig, contract, and other nonstandard work arrangements, the delivery of benefits through the workplace leaves these workers without protections against large shocks.93
2. Cash infusions on a never-before-seen scale underscore that benefits are critical to maintain stability of workers’ cash flow. Cash infusions are helping workers address the economic consequences of the pandemic. CIC members Family Independence Initiative and LIFT have continued providing cash infusions to their members as they had before the pandemic as a part of their programming, and others, including SaverLife, the Mission Asset Fund, MyPath, and Neighborhood Trust, have shifted their programming during the pandemic to include or add cash infusions.94 Members have found these efforts helped recipients stabilize finances and cover basic needs in the face of interrupted earnings: For instance, low-income workers, immigrant families, and students that received unrestricted funds from the Mission Asset
Occupational segregation led to certain groups being more impacted by the pandemic through job losses and potential COVID-19 exposure.
“
”
20
The Complete Financial Lives of Workers
The Aspen Institute Financial Security Program
4. Inadequacy of safety net infrastructure created barriers to support in a time of need.A host of reasons have made it difficult for households to access critical public support during the pandemic, including:
• Program changes created confusion and uncertainty. Confusion around eligibility and uncertainty around how long expanded UI would last were cited as barriers by LIFT, MyPath, and Neighborhood Trust financial coaches.109 The Shift Project found that many workers were unaware of the expanded eligibility, and that states’ rollouts of the program and the process to apply varied widely, resulting in delayed benefit receipt and many struggling to receive benefits at all.110 Overall, the Shift Project found that just 27 percent of unemployed service workersiv in April and May 2020 received a payment from unemployment insurance. When these systems became unresponsive, frustrated applicants turned to social media to understand how to navigate complex applications and share or receive advice about how to obtain benefits.111
• Public benefit systems were not capable of fast scaling. A sudden need for support overwhelmed public benefit systems, resulting in system overloads across the country.112 For example, the number of weekly applicants to UI spiked from 200,000 to more than 6,000,000 in March 2020 alone.113 These overburdened systems were not designed to keep up with that demand. An audit of Wisconsin revealed that only 0.5 percent of residents seeking help with UI had their calls answered between March 15 and June 30, 2020.114
• Public benefit application and payment methods failed to connect the most vulnerable. Not everyone was eligible for needed programs, and in some cases, eligible people struggled to access benefits in a timely manner. Despite the CARES Act passing in March 2020, by October 2020, approximately 12 million eligible people—primarily Black and Latinx individuals, unhoused people, very
iv These workers held positions in retail, food service, hospitality, grocery, pharmacy, fulfillment, or hardware sectors.
The Federal Government Used Cash Infusions to Help Workers and Families During the Pandemic
The Coronavirus Aid, Relief, and Economic Security Act (CARES) Act authorized direct cash infusions called Economic Impact Payments (EIPs) of up to $1,200 per adult family member and $500 per child. Moreover, the CARES Act expanded unemployment insurance, authorizing an additional $600 weekly benefit via the Federal Pandemic Unemployment Compensation (FPUC), and the Pandemic Unemployment Assistance (PUA) programs, which expanded states’ ability to include more workers in these payments, such as gig and contract workers.102 In fact, researchers at the University of Chicago found that 76 percent of individuals who lost their jobs were making more with these supplemental UI payments, as the program boosted their income above what they were receiving from their prior employment.103 Researchers found that these $600 payments did not disincentivize people from finding work.104
3. Liquid savings—tested in the face of a mass shock—demonstrated their value. Families with liquid savings prior to the pandemic were in a better position to withstand the economic impacts of the crisis.105 Commonwealth found that of the households that experienced a significant drop in income due to COVID-19, those that already had savings set aside did not have to take on credit card debt, borrow, or postpone their bills, and were able to save more of their EIP and tax refunds.106 Two months later, when their income recovered, these households were also more financially healthy than those who did not have savings prior to COVID-19.107 And a new study by the Social Policy Institute finds that households with over $2,000 in savings were significantly less likely to be experiencing signs of financial distress—like skipping essential bill payments and carrying credit card debt from month-to-month—in the face of job or income losses during the pandemic.108
21
A Holistic Exploration of Work and Public and Workplace Benefit Arrangements
The Aspen Institute Financial Security Program
low-income families with children, and long-term unemployed people—had not yet received their Economic Impact Payment.115 Undocumented workers and their families were initiallyv left out of these payments entirely.116 In addition, the delivery method used for the EIPs did not include adequate consumer protections and inclusive payment options to ensure that recipients could easily receive and access their funds, and in fact, were not protected from wage garnishments and past-due child support offsets.117 Individuals without accounts in the formal financial system faced fees to access their funds, undermining the value of the intended support.118
Because of COVID-19, financial institutions and public benefit applications have shifted to digital services to reach more customers, but this can be a barrier for people with limited computer or cell phone access, unreliable or unaffordable internet service, or limited technological skills.119 Neighborhood Trust found that some clients needed additional support to navigate the new public benefit programs, often because they did not have access to reliable internet service or to computers, printers, and scanners, or had difficulty understanding the complexity of applications for these programs.120 When Neighborhood Trust and SaverLife launched an emergency cash relief and financial coaching effort to support LMI families, they found that 20 percent of recipients who did not have a bank account or were inexperienced or uncomfortable with technology needed extra support, such as assistance with the application and with setting up email accounts.121
v A second round of EIPs was authorized at the end of 2020, this time allowing for a more expansive pool of eligible individuals, including some people living in mixed-status households. These individuals will also be newly eligible for the first round of pay-ments, an important stimulus, but far from timely. This second iteration will not be subject to garnishments.
Despite the CARES Act passing in March 2020, by October 2020, approximately 12 million eligible people—primarily Black and Latinx individuals, unhoused people, very low-income families with children, and long-term unemployed people—had not yet received their Economic Impact Payment.
“
”
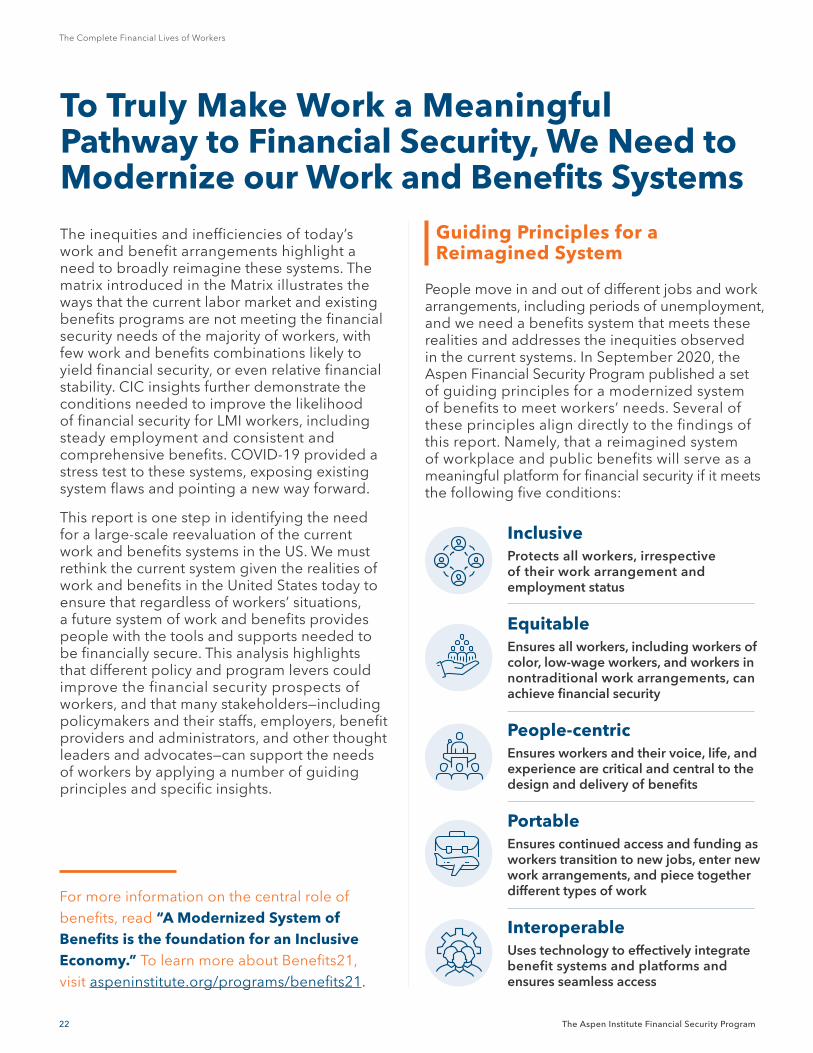
22 The Aspen Institute Financial Security Program
The Complete Financial Lives of Workers
Guiding Principles for a Reimagined System
People move in and out of different jobs and work arrangements, including periods of unemployment, and we need a benefits system that meets these realities and addresses the inequities observed in the current systems. In September 2020, the Aspen Financial Security Program published a set of guiding principles for a modernized system of benefits to meet workers’ needs. Several of these principles align directly to the findings of this report. Namely, that a reimagined system of workplace and public benefits will serve as a meaningful platform for financial security if it meets the following five conditions:
Inclusive Protects all workers, irrespective of their work arrangement and employment status
Equitable Ensures all workers, including workers of color, low-wage workers, and workers in nontraditional work arrangements, can achieve financial security
People-centric Ensures workers and their voice, life, and experience are critical and central to the design and delivery of benefits
Portable Ensures continued access and funding as workers transition to new jobs, enter new work arrangements, and piece together different types of work
Interoperable Uses technology to effectively integrate benefit systems and platforms and ensures seamless access
The inequities and inefficiencies of today’s work and benefit arrangements highlight a need to broadly reimagine these systems. The matrix introduced in the Matrix illustrates the ways that the current labor market and existing benefits programs are not meeting the financial security needs of the majority of workers, with few work and benefits combinations likely to yield financial security, or even relative financial stability. CIC insights further demonstrate the conditions needed to improve the likelihood of financial security for LMI workers, including steady employment and consistent and comprehensive benefits. COVID-19 provided a stress test to these systems, exposing existing system flaws and pointing a new way forward.
This report is one step in identifying the need for a large-scale reevaluation of the current work and benefits systems in the US. We must rethink the current system given the realities of work and benefits in the United States today to ensure that regardless of workers’ situations, a future system of work and benefits provides people with the tools and supports needed to be financially secure. This analysis highlights that different policy and program levers could improve the financial security prospects of workers, and that many stakeholders—including policymakers and their staffs, employers, benefit providers and administrators, and other thought leaders and advocates—can support the needs of workers by applying a number of guiding principles and specific insights.
To Truly Make Work a Meaningful Pathway to Financial Security, We Need to Modernize our Work and Benefits Systems
For more information on the central role of benefits, read “A Modernized System of Benefits is the foundation for an Inclusive Economy.” To learn more about Benefits21, visit aspeninstitute.org/programs/benefits21.
23
A Holistic Exploration of Work and Public and Workplace Benefit Arrangements
The Aspen Institute Financial Security Program
b. Provide timely, smooth delivery. Streamlining benefits delivery and receipt would reduce the time it takes to receive needed supports and help avoid material hardship when a person experiences a job or income loss or must address a health concern or other emergency.
2. Build data, technology, and financial systems to smoothly and safely reach everyone with public benefits infrastructure. Better federal infrastructure is needed to get money and benefits to people quickly and ensure that they are able to access and store funds in a safe and affordable way. This requires the government to be able to identify and transfer money to the most vulnerable people, including unhoused people, individuals unfamiliar with digital services, and people without reliable internet access or without a formal bank account. To be able to do so will require upgrading government data, technology, and financial systems, potentially in partnership with private sector and non-profit organizations.
3. Design public and workplace benefits to boost, rather than minimize, access and uptake. Help households reach needed supports across available platforms.
a. Create consistency in public benefits. Policies are not implemented in the same way across states, nor are the applications and recertifications treated the same way for public benefits. Creating a benefits system that is more consistent would help diminish confusion and reduce the administrative burden of programs across states.
b. Streamline applications for public benefits. Inaccessible and inefficient applications for public benefit programs exist across the country, with few allowing people to quickly apply for multiple programs at once, despite eligibility for more than one program.122
Envisioning a benefits system with these design principles would mean a system of public and workplace benefits that is affordable and available to all workers—including workers of color, low- and moderate-income workers, and workers of all ages—irrespective of their work arrangements and employment status. Moreover, benefit design is often divorced from the lived experiences of the very people they are intended to serve. Program design that incorporates the expertise and knowledge of LMI workers is essential to creating programs and policies that function well for their intended recipients. Lastly, these systems must ensure continued coverage with seamless access across benefit systems in moments of transition, whether to new jobs and work arrangements or between periods of employment, underemployment, and unemployment.
Five Ways to Get Started
We invite readers of this report to contribute to the innovation and cross-sector thinking that will be required to make progress on creating a system of work and benefits that functions for all workers. Given the guiding principles discussed above, insights from this report suggest that the following high-level recommendations can help move us in that direction:
1. Recognize that workers rely on public benefits today and design them accordingly. A key finding of this report is that public benefits already play a critical role in the financial security of millions of US workers. Given that the current situation leaves so many workers vulnerable and without basic stability, there is a clear need to strengthen the design and delivery of public benefits.
a. Design benefits to support consistently positive cash flow. Routinely positive cash flow is a critical factor for financial well-being. Ensuring that benefits are continuous, large enough to support positive cash flow, and do not lapse or get cut off when there is still a need for these supports will contribute to a steady foundation of support that recipients can count on. This includes seamless access to benefits in moments of job loss or transition.
24
The Complete Financial Lives of Workers
The Aspen Institute Financial Security Program
4. Encourage employers to offer more full-time work, consistent hours, and livable wages with quality benefits. For almost half of workers in the US earned income is inadequate to support expenses. Employers can help boost and stabilize incomes by providing workers with livable wages, more consistent hours, advanced notice of hours, and high-quality, affordable benefits.123
5. Help workers save for shocks as a complement to benefits, social insurance, and other structural supports. Policymakers, employers, financial institutions, and financial technology companies can create opportunities that allow for and help build financial cushions.124
c. Consider automatic enrollment for benefits of all kinds. Auto-enrollment for eligible programs—whether public or workplace—can connect people quickly to needed services, without lengthy and complicated application processes which are known to depress enrollment.
d. Offer affordable benefits. Benefits that are too costly are out of reach for many households, as we see in the gap between access and participation with benefits, especially in the workplace.
e. Extend workplace benefits to all types of workers. Workplace benefits are correlated with wage level and are deeply connected to work arrangements and legal classifications. Creating a more inclusive workplace benefit system would be a first step in decreasing unequal outcomes for workers.
Conclusion Financial insecurity, stability, and security lie on a spectrum that is affected by a range of factors, including—but not limited to—people’s work arrangements and their access (or lack thereof) to workplace and public benefits. The likelihood of financial security increases as individuals obtain adequate pay and stable, predictable hours that yield routinely positive cash flow, steady employment with livable wages, full-time jobs, and a strong suite of workplace and public benefits that improve financial resiliency and stability.
If work is to provide a real pathway to financial security, public and workplace benefits must reflect the realities of 21st century employment, which includes a workforce increasingly required to engage in nonstandard and sometimes multiple jobs and where job stability is not guaranteed, generating the need to explore options that tie benefits directly to the individual rather than the job. COVID-19 has demonstrated the precarity of workers having their health insurance and other benefits tied to employment, where losing a job can mean losing other stabilizing supports.
Employers, policymakers and their staffs, benefit providers and administrators and other thought leaders and advocates have opportunities to support worker financial security through efforts to support these foundational needs, including ensuring that benefits are accessible and affordable to all workers, regardless of work arrangements, providing options that help boost personal resources, and considering ways to integrate the delivery of benefits across public and private functions.
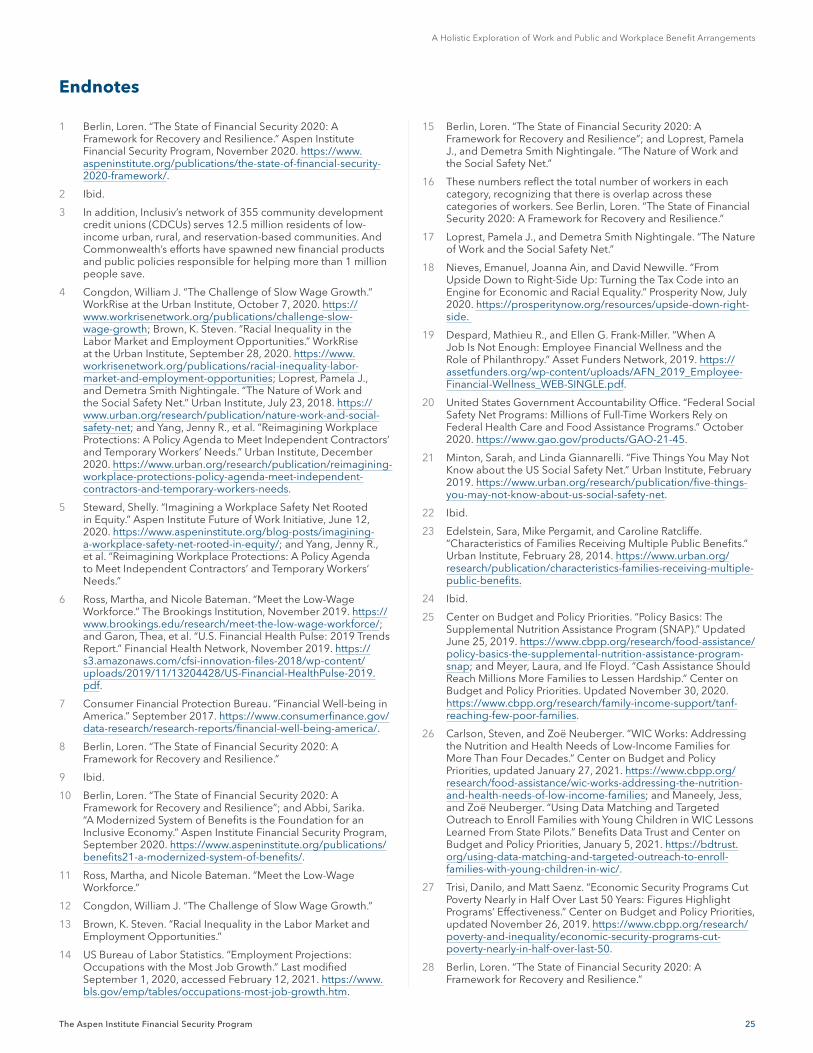
25
A Holistic Exploration of Work and Public and Workplace Benefit Arrangements
The Aspen Institute Financial Security Program
1 Berlin, Loren. “The State of Financial Security 2020: A Framework for Recovery and Resilience.” Aspen Institute Financial Security Program, November 2020. https://www.aspeninstitute.org/publications/the-state-of-financial-security-2020-framework/.
2 Ibid.
3 In addition, Inclusiv’s network of 355 community development credit unions (CDCUs) serves 12.5 million residents of low-income urban, rural, and reservation-based communities. And Commonwealth’s efforts have spawned new financial products and public policies responsible for helping more than 1 million people save.
4 Congdon, William J. “The Challenge of Slow Wage Growth.” WorkRise at the Urban Institute, October 7, 2020. https://www.workrisenetwork.org/publications/challenge-slow-wage-growth; Brown, K. Steven. “Racial Inequality in the Labor Market and Employment Opportunities.” WorkRise at the Urban Institute, September 28, 2020. https://www.workrisenetwork.org/publications/racial-inequality-labor-market-and-employment-opportunities; Loprest, Pamela J., and Demetra Smith Nightingale. “The Nature of Work and the Social Safety Net.” Urban Institute, July 23, 2018. https://www.urban.org/research/publication/nature-work-and-social-safety-net; and Yang, Jenny R., et al. “Reimagining Workplace Protections: A Policy Agenda to Meet Independent Contractors’ and Temporary Workers’ Needs.” Urban Institute, December 2020. https://www.urban.org/research/publication/reimagining-workplace-protections-policy-agenda-meet-independent-contractors-and-temporary-workers-needs.
5 Steward, Shelly. “Imagining a Workplace Safety Net Rooted in Equity.” Aspen Institute Future of Work Initiative, June 12, 2020. https://www.aspeninstitute.org/blog-posts/imagining-a-workplace-safety-net-rooted-in-equity/; and Yang, Jenny R., et al. “Reimagining Workplace Protections: A Policy Agenda to Meet Independent Contractors’ and Temporary Workers’ Needs.”
6 Ross, Martha, and Nicole Bateman. “Meet the Low-Wage Workforce.” The Brookings Institution, November 2019. https://www.brookings.edu/research/meet-the-low-wage-workforce/; and Garon, Thea, et al. “U.S. Financial Health Pulse: 2019 Trends Report.” Financial Health Network, November 2019. https://s3.amazonaws.com/cfsi-innovation-files-2018/wp-content/uploads/2019/11/13204428/US-Financial-HealthPulse-2019.pdf.
7 Consumer Financial Protection Bureau. “Financial Well-being in America.” September 2017. https://www.consumerfinance.gov/data-research/research-reports/financial-well-being-america/.
8 Berlin, Loren. “The State of Financial Security 2020: A Framework for Recovery and Resilience.”
9 Ibid.
10 Berlin, Loren. “The State of Financial Security 2020: A Framework for Recovery and Resilience”; and Abbi, Sarika. “A Modernized System of Benefits is the Foundation for an Inclusive Economy.” Aspen Institute Financial Security Program, September 2020. https://www.aspeninstitute.org/publications/benefits21-a-modernized-system-of-benefits/.
11 Ross, Martha, and Nicole Bateman. “Meet the Low-Wage Workforce.”
12 Congdon, William J. “The Challenge of Slow Wage Growth.”
13 Brown, K. Steven. “Racial Inequality in the Labor Market and Employment Opportunities.”
14 US Bureau of Labor Statistics. “Employment Projections: Occupations with the Most Job Growth.” Last modified September 1, 2020, accessed February 12, 2021. https://www.bls.gov/emp/tables/occupations-most-job-growth.htm.
15 Berlin, Loren. “The State of Financial Security 2020: A Framework for Recovery and Resilience”; and Loprest, Pamela J., and Demetra Smith Nightingale. “The Nature of Work and the Social Safety Net.”
16 These numbers reflect the total number of workers in each category, recognizing that there is overlap across these categories of workers. See Berlin, Loren. “The State of Financial Security 2020: A Framework for Recovery and Resilience.”
17 Loprest, Pamela J., and Demetra Smith Nightingale. “The Nature of Work and the Social Safety Net.”
18 Nieves, Emanuel, Joanna Ain, and David Newville. “From Upside Down to Right-Side Up: Turning the Tax Code into an Engine for Economic and Racial Equality.” Prosperity Now, July 2020. https://prosperitynow.org/resources/upside-down-right-side.
19 Despard, Mathieu R., and Ellen G. Frank-Miller. “When A Job Is Not Enough: Employee Financial Wellness and the Role of Philanthropy.” Asset Funders Network, 2019. https://assetfunders.org/wp-content/uploads/AFN_2019_Employee-Financial-Wellness_WEB-SINGLE.pdf.
20 United States Government Accountability Office. “Federal Social Safety Net Programs: Millions of Full-Time Workers Rely on Federal Health Care and Food Assistance Programs.” October 2020. https://www.gao.gov/products/GAO-21-45.
21 Minton, Sarah, and Linda Giannarelli. “Five Things You May Not Know about the US Social Safety Net.” Urban Institute, February 2019. https://www.urban.org/research/publication/five-things-you-may-not-know-about-us-social-safety-net.
22 Ibid.
23 Edelstein, Sara, Mike Pergamit, and Caroline Ratcliffe. “Characteristics of Families Receiving Multiple Public Benefits.” Urban Institute, February 28, 2014. https://www.urban.org/research/publication/characteristics-families-receiving-multiple-public-benefits.
24 Ibid.
25 Center on Budget and Policy Priorities. “Policy Basics: The Supplemental Nutrition Assistance Program (SNAP).” Updated June 25, 2019. https://www.cbpp.org/research/food-assistance/policy-basics-the-supplemental-nutrition-assistance-program-snap; and Meyer, Laura, and Ife Floyd. “Cash Assistance Should Reach Millions More Families to Lessen Hardship.” Center on Budget and Policy Priorities. Updated November 30, 2020. https://www.cbpp.org/research/family-income-support/tanf-reaching-few-poor-families.
26 Carlson, Steven, and Zoë Neuberger. “WIC Works: Addressing the Nutrition and Health Needs of Low-Income Families for More Than Four Decades.” Center on Budget and Policy Priorities, updated January 27, 2021. https://www.cbpp.org/research/food-assistance/wic-works-addressing-the-nutrition-and-health-needs-of-low-income-families; and Maneely, Jess, and Zoë Neuberger. “Using Data Matching and Targeted Outreach to Enroll Families with Young Children in WIC Lessons Learned From State Pilots.” Benefits Data Trust and Center on Budget and Policy Priorities, January 5, 2021. https://bdtrust.org/using-data-matching-and-targeted-outreach-to-enroll-families-with-young-children-in-wic/.
27 Trisi, Danilo, and Matt Saenz. “Economic Security Programs Cut Poverty Nearly in Half Over Last 50 Years: Figures Highlight Programs’ Effectiveness.” Center on Budget and Policy Priorities, updated November 26, 2019. https://www.cbpp.org/research/poverty-and-inequality/economic-security-programs-cut-poverty-nearly-in-half-over-last-50.
28 Berlin, Loren. “The State of Financial Security 2020: A Framework for Recovery and Resilience.”
Endnotes
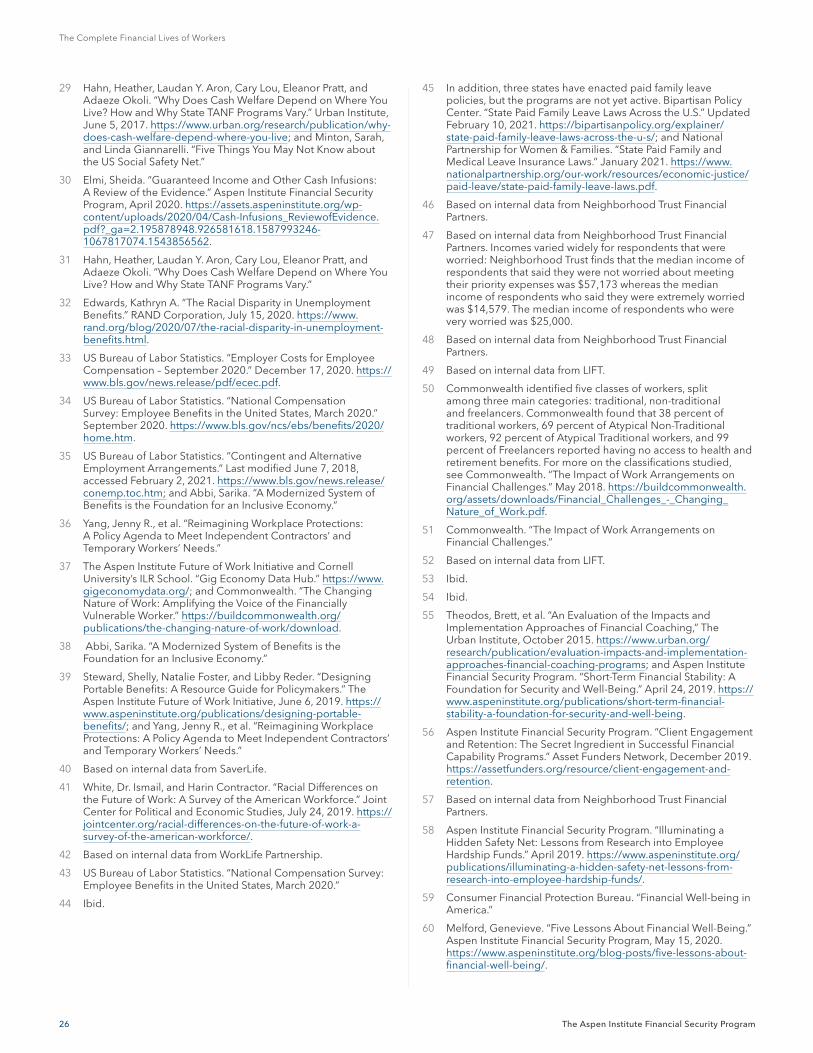
26
The Complete Financial Lives of Workers
The Aspen Institute Financial Security Program
29 Hahn, Heather, Laudan Y. Aron, Cary Lou, Eleanor Pratt, and Adaeze Okoli. “Why Does Cash Welfare Depend on Where You Live? How and Why State TANF Programs Vary.” Urban Institute, June 5, 2017. https://www.urban.org/research/publication/why-does-cash-welfare-depend-where-you-live; and Minton, Sarah, and Linda Giannarelli. “Five Things You May Not Know about the US Social Safety Net.”
30 Elmi, Sheida. “Guaranteed Income and Other Cash Infusions: A Review of the Evidence.” Aspen Institute Financial Security Program, April 2020. https://assets.aspeninstitute.org/wp-content/uploads/2020/04/Cash-Infusions_ReviewofEvidence.pdf?_ga=2.195878948.926581618.1587993246-1067817074.1543856562.
31 Hahn, Heather, Laudan Y. Aron, Cary Lou, Eleanor Pratt, and Adaeze Okoli. “Why Does Cash Welfare Depend on Where You Live? How and Why State TANF Programs Vary.”
32 Edwards, Kathryn A. “The Racial Disparity in Unemployment Benefits.” RAND Corporation, July 15, 2020. https://www.rand.org/blog/2020/07/the-racial-disparity-in-unemployment-benefits.html.
33 US Bureau of Labor Statistics. “Employer Costs for Employee Compensation – September 2020.” December 17, 2020. https://www.bls.gov/news.release/pdf/ecec.pdf.
34 US Bureau of Labor Statistics. “National Compensation Survey: Employee Benefits in the United States, March 2020.” September 2020. https://www.bls.gov/ncs/ebs/benefits/2020/home.htm.
35 US Bureau of Labor Statistics. “Contingent and Alternative Employment Arrangements.” Last modified June 7, 2018, accessed February 2, 2021. https://www.bls.gov/news.release/conemp.toc.htm; and Abbi, Sarika. “A Modernized System of Benefits is the Foundation for an Inclusive Economy.”
36 Yang, Jenny R., et al. “Reimagining Workplace Protections: A Policy Agenda to Meet Independent Contractors’ and Temporary Workers’ Needs.”
37 The Aspen Institute Future of Work Initiative and Cornell University’s ILR School. “Gig Economy Data Hub.” https://www.gigeconomydata.org/; and Commonwealth. “The Changing Nature of Work: Amplifying the Voice of the Financially Vulnerable Worker.” https://buildcommonwealth.org/publications/the-changing-nature-of-work/download.
38 Abbi, Sarika. “A Modernized System of Benefits is the Foundation for an Inclusive Economy.”
39 Steward, Shelly, Natalie Foster, and Libby Reder. “Designing Portable Benefits: A Resource Guide for Policymakers.” The Aspen Institute Future of Work Initiative, June 6, 2019. https://www.aspeninstitute.org/publications/designing-portable-benefits/; and Yang, Jenny R., et al. “Reimagining Workplace Protections: A Policy Agenda to Meet Independent Contractors’ and Temporary Workers’ Needs.”
40 Based on internal data from SaverLife.
41 White, Dr. Ismail, and Harin Contractor. “Racial Differences on the Future of Work: A Survey of the American Workforce.” Joint Center for Political and Economic Studies, July 24, 2019. https://jointcenter.org/racial-differences-on-the-future-of-work-a-survey-of-the-american-workforce/.
42 Based on internal data from WorkLife Partnership.
43 US Bureau of Labor Statistics. “National Compensation Survey: Employee Benefits in the United States, March 2020.”
44 Ibid.
45 In addition, three states have enacted paid family leave policies, but the programs are not yet active. Bipartisan Policy Center. “State Paid Family Leave Laws Across the U.S.” Updated February 10, 2021. https://bipartisanpolicy.org/explainer/state-paid-family-leave-laws-across-the-u-s/; and National Partnership for Women & Families. “State Paid Family and Medical Leave Insurance Laws.” January 2021. https://www.nationalpartnership.org/our-work/resources/economic-justice/paid-leave/state-paid-family-leave-laws.pdf.
46 Based on internal data from Neighborhood Trust Financial Partners.
47 Based on internal data from Neighborhood Trust Financial Partners. Incomes varied widely for respondents that were worried: Neighborhood Trust finds that the median income of respondents that said they were not worried about meeting their priority expenses was $57,173 whereas the median income of respondents who said they were extremely worried was $14,579. The median income of respondents who were very worried was $25,000.
48 Based on internal data from Neighborhood Trust Financial Partners.
49 Based on internal data from LIFT.
50 Commonwealth identified five classes of workers, split among three main categories: traditional, non-traditional and freelancers. Commonwealth found that 38 percent of traditional workers, 69 percent of Atypical Non-Traditional workers, 92 percent of Atypical Traditional workers, and 99 percent of Freelancers reported having no access to health and retirement benefits. For more on the classifications studied, see Commonwealth. “The Impact of Work Arrangements on Financial Challenges.” May 2018. https://buildcommonwealth.org/assets/downloads/Financial_Challenges_-_Changing_Nature_of_Work.pdf.
51 Commonwealth. “The Impact of Work Arrangements on Financial Challenges.”
52 Based on internal data from LIFT.
53 Ibid.
54 Ibid.
55 Theodos, Brett, et al. “An Evaluation of the Impacts and Implementation Approaches of Financial Coaching,” The Urban Institute, October 2015. https://www.urban.org/research/publication/evaluation-impacts-and-implementation-approaches-financial-coaching-programs; and Aspen Institute Financial Security Program. “Short-Term Financial Stability: A Foundation for Security and Well-Being.” April 24, 2019. https://www.aspeninstitute.org/publications/short-term-financial-stability-a-foundation-for-security-and-well-being.
56 Aspen Institute Financial Security Program. “Client Engagement and Retention: The Secret Ingredient in Successful Financial Capability Programs.” Asset Funders Network, December 2019. https://assetfunders.org/resource/client-engagement-and-retention.
57 Based on internal data from Neighborhood Trust Financial Partners.
58 Aspen Institute Financial Security Program. “Illuminating a Hidden Safety Net: Lessons from Research into Employee Hardship Funds.” April 2019. https://www.aspeninstitute.org/publications/illuminating-a-hidden-safety-net-lessons-from-research-into-employee-hardship-funds/.
59 Consumer Financial Protection Bureau. “Financial Well-being in America.”
60 Melford, Genevieve. “Five Lessons About Financial Well-Being.” Aspen Institute Financial Security Program, May 15, 2020. https://www.aspeninstitute.org/blog-posts/five-lessons-about-financial-well-being/.
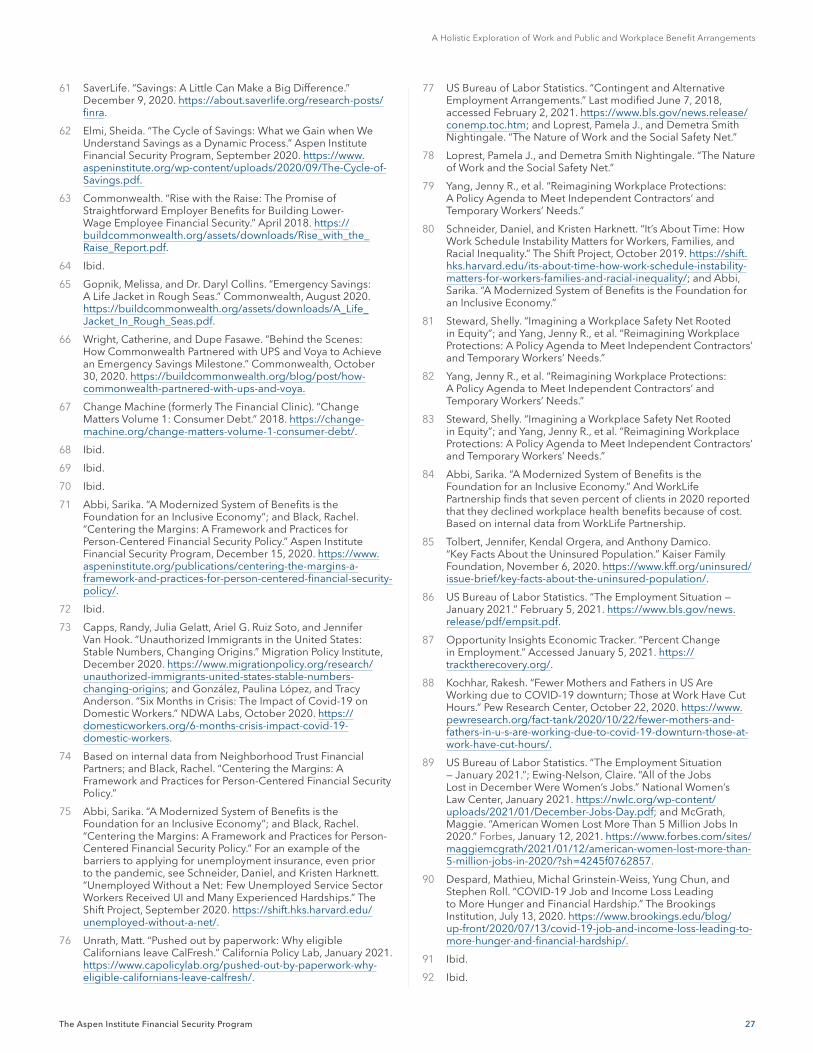
27
A Holistic Exploration of Work and Public and Workplace Benefit Arrangements
The Aspen Institute Financial Security Program
61 SaverLife. “Savings: A Little Can Make a Big Difference.” December 9, 2020. https://about.saverlife.org/research-posts/finra.
62 Elmi, Sheida. “The Cycle of Savings: What we Gain when We Understand Savings as a Dynamic Process.” Aspen Institute Financial Security Program, September 2020. https://www.aspeninstitute.org/wp-content/uploads/2020/09/The-Cycle-of-Savings.pdf.
63 Commonwealth. “Rise with the Raise: The Promise of Straightforward Employer Benefits for Building Lower-Wage Employee Financial Security.” April 2018. https://buildcommonwealth.org/assets/downloads/Rise_with_the_Raise_Report.pdf.
64 Ibid.
65 Gopnik, Melissa, and Dr. Daryl Collins. “Emergency Savings: A Life Jacket in Rough Seas.” Commonwealth, August 2020. https://buildcommonwealth.org/assets/downloads/A_Life_Jacket_In_Rough_Seas.pdf.
66 Wright, Catherine, and Dupe Fasawe. “Behind the Scenes: How Commonwealth Partnered with UPS and Voya to Achieve an Emergency Savings Milestone.” Commonwealth, October 30, 2020. https://buildcommonwealth.org/blog/post/how-commonwealth-partnered-with-ups-and-voya.
67 Change Machine (formerly The Financial Clinic). “Change Matters Volume 1: Consumer Debt.” 2018. https://change-machine.org/change-matters-volume-1-consumer-debt/.
68 Ibid.
69 Ibid.
70 Ibid.
71 Abbi, Sarika. “A Modernized System of Benefits is the Foundation for an Inclusive Economy”; and Black, Rachel. “Centering the Margins: A Framework and Practices for Person-Centered Financial Security Policy.” Aspen Institute Financial Security Program, December 15, 2020. https://www.aspeninstitute.org/publications/centering-the-margins-a-framework-and-practices-for-person-centered-financial-security-policy/.
72 Ibid.
73 Capps, Randy, Julia Gelatt, Ariel G. Ruiz Soto, and Jennifer Van Hook. “Unauthorized Immigrants in the United States: Stable Numbers, Changing Origins.” Migration Policy Institute, December 2020. https://www.migrationpolicy.org/research/unauthorized-immigrants-united-states-stable-numbers-changing-origins; and González, Paulina López, and Tracy Anderson. “Six Months in Crisis: The Impact of Covid-19 on Domestic Workers.” NDWA Labs, October 2020. https://domesticworkers.org/6-months-crisis-impact-covid-19-domestic-workers.
74 Based on internal data from Neighborhood Trust Financial Partners; and Black, Rachel. “Centering the Margins: A Framework and Practices for Person-Centered Financial Security Policy.”
75 Abbi, Sarika. “A Modernized System of Benefits is the Foundation for an Inclusive Economy”; and Black, Rachel. “Centering the Margins: A Framework and Practices for Person-Centered Financial Security Policy.” For an example of the barriers to applying for unemployment insurance, even prior to the pandemic, see Schneider, Daniel, and Kristen Harknett. “Unemployed Without a Net: Few Unemployed Service Sector Workers Received UI and Many Experienced Hardships.” The Shift Project, September 2020. https://shift.hks.harvard.edu/unemployed-without-a-net/.
76 Unrath, Matt. “Pushed out by paperwork: Why eligible Californians leave CalFresh.” California Policy Lab, January 2021. https://www.capolicylab.org/pushed-out-by-paperwork-why-eligible-californians-leave-calfresh/.
77 US Bureau of Labor Statistics. “Contingent and Alternative Employment Arrangements.” Last modified June 7, 2018, accessed February 2, 2021. https://www.bls.gov/news.release/conemp.toc.htm; and Loprest, Pamela J., and Demetra Smith Nightingale. “The Nature of Work and the Social Safety Net.”
78 Loprest, Pamela J., and Demetra Smith Nightingale. “The Nature of Work and the Social Safety Net.”
79 Yang, Jenny R., et al. “Reimagining Workplace Protections: A Policy Agenda to Meet Independent Contractors’ and Temporary Workers’ Needs.”
80 Schneider, Daniel, and Kristen Harknett. “It’s About Time: How Work Schedule Instability Matters for Workers, Families, and Racial Inequality.” The Shift Project, October 2019. https://shift.hks.harvard.edu/its-about-time-how-work-schedule-instability-matters-for-workers-families-and-racial-inequality/; and Abbi, Sarika. “A Modernized System of Benefits is the Foundation for an Inclusive Economy.”
81 Steward, Shelly. “Imagining a Workplace Safety Net Rooted in Equity”; and Yang, Jenny R., et al. “Reimagining Workplace Protections: A Policy Agenda to Meet Independent Contractors’ and Temporary Workers’ Needs.”
82 Yang, Jenny R., et al. “Reimagining Workplace Protections: A Policy Agenda to Meet Independent Contractors’ and Temporary Workers’ Needs.”
83 Steward, Shelly. “Imagining a Workplace Safety Net Rooted in Equity”; and Yang, Jenny R., et al. “Reimagining Workplace Protections: A Policy Agenda to Meet Independent Contractors’ and Temporary Workers’ Needs.”
84 Abbi, Sarika. “A Modernized System of Benefits is the Foundation for an Inclusive Economy.” And WorkLife Partnership finds that seven percent of clients in 2020 reported that they declined workplace health benefits because of cost. Based on internal data from WorkLife Partnership.
85 Tolbert, Jennifer, Kendal Orgera, and Anthony Damico. “Key Facts About the Uninsured Population.” Kaiser Family Foundation, November 6, 2020. https://www.kff.org/uninsured/issue-brief/key-facts-about-the-uninsured-population/.
86 US Bureau of Labor Statistics. “The Employment Situation — January 2021.” February 5, 2021. https://www.bls.gov/news.release/pdf/empsit.pdf.
87 Opportunity Insights Economic Tracker. “Percent Change in Employment.” Accessed January 5, 2021. https://tracktherecovery.org/.
88 Kochhar, Rakesh. “Fewer Mothers and Fathers in US Are Working due to COVID-19 downturn; Those at Work Have Cut Hours.” Pew Research Center, October 22, 2020. https://www.pewresearch.org/fact-tank/2020/10/22/fewer-mothers-and-fathers-in-u-s-are-working-due-to-covid-19-downturn-those-at-work-have-cut-hours/.
89 US Bureau of Labor Statistics. “The Employment Situation — January 2021.”; Ewing-Nelson, Claire. “All of the Jobs Lost in December Were Women’s Jobs.” National Women’s Law Center, January 2021. https://nwlc.org/wp-content/uploads/2021/01/December-Jobs-Day.pdf; and McGrath, Maggie. “American Women Lost More Than 5 Million Jobs In 2020.” Forbes, January 12, 2021. https://www.forbes.com/sites/maggiemcgrath/2021/01/12/american-women-lost-more-than-5-million-jobs-in-2020/?sh=4245f0762857.
90 Despard, Mathieu, Michal Grinstein-Weiss, Yung Chun, and Stephen Roll. “COVID-19 Job and Income Loss Leading to More Hunger and Financial Hardship.” The Brookings Institution, July 13, 2020. https://www.brookings.edu/blog/up-front/2020/07/13/covid-19-job-and-income-loss-leading-to-more-hunger-and-financial-hardship/.
91 Ibid.
92 Ibid.
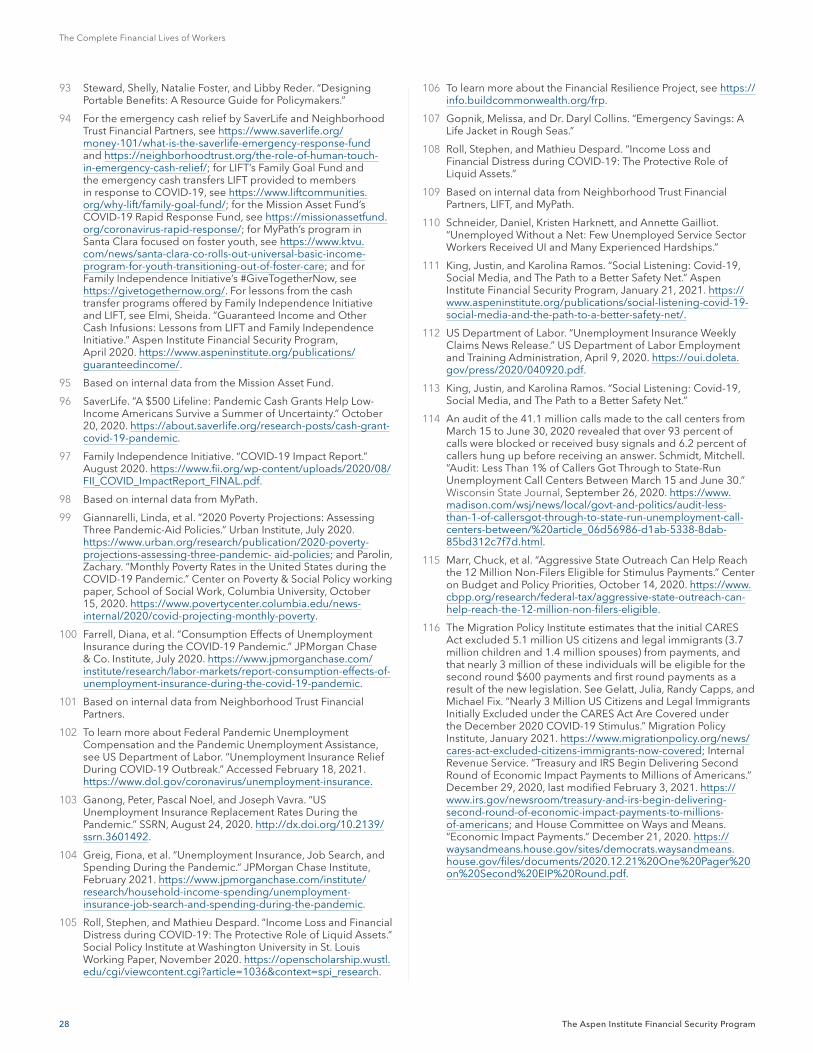
28
The Complete Financial Lives of Workers
The Aspen Institute Financial Security Program
93 Steward, Shelly, Natalie Foster, and Libby Reder. “Designing Portable Benefits: A Resource Guide for Policymakers.”
94 For the emergency cash relief by SaverLife and Neighborhood Trust Financial Partners, see https://www.saverlife.org/money-101/what-is-the-saverlife-emergency-response-fund and https://neighborhoodtrust.org/the-role-of-human-touch-in-emergency-cash-relief/; for LIFT’s Family Goal Fund and the emergency cash transfers LIFT provided to members in response to COVID-19, see https://www.liftcommunities.org/why-lift/family-goal-fund/; for the Mission Asset Fund’s COVID-19 Rapid Response Fund, see https://missionassetfund.org/coronavirus-rapid-response/; for MyPath’s program in Santa Clara focused on foster youth, see https://www.ktvu.com/news/santa-clara-co-rolls-out-universal-basic-income-program-for-youth-transitioning-out-of-foster-care; and for Family Independence Initiative’s #GiveTogetherNow, see https://givetogethernow.org/. For lessons from the cash transfer programs offered by Family Independence Initiative and LIFT, see Elmi, Sheida. “Guaranteed Income and Other Cash Infusions: Lessons from LIFT and Family Independence Initiative.” Aspen Institute Financial Security Program, April 2020. https://www.aspeninstitute.org/publications/guaranteedincome/.
95 Based on internal data from the Mission Asset Fund.
96 SaverLife. “A $500 Lifeline: Pandemic Cash Grants Help Low-Income Americans Survive a Summer of Uncertainty.” October 20, 2020. https://about.saverlife.org/research-posts/cash-grant-covid-19-pandemic.
97 Family Independence Initiative. “COVID-19 Impact Report.” August 2020. https://www.fii.org/wp-content/uploads/2020/08/FII_COVID_ImpactReport_FINAL.pdf.
98 Based on internal data from MyPath.
99 Giannarelli, Linda, et al. “2020 Poverty Projections: Assessing Three Pandemic-Aid Policies.” Urban Institute, July 2020. https://www.urban.org/research/publication/2020-poverty-projections-assessing-three-pandemic- aid-policies; and Parolin, Zachary. “Monthly Poverty Rates in the United States during the COVID-19 Pandemic.” Center on Poverty & Social Policy working paper, School of Social Work, Columbia University, October 15, 2020. https://www.povertycenter.columbia.edu/news-internal/2020/covid-projecting-monthly-poverty.
100 Farrell, Diana, et al. “Consumption Effects of Unemployment Insurance during the COVID-19 Pandemic.” JPMorgan Chase & Co. Institute, July 2020. https://www.jpmorganchase.com/institute/research/labor-markets/report-consumption-effects-of-unemployment-insurance-during-the-covid-19-pandemic.
101 Based on internal data from Neighborhood Trust Financial Partners.
102 To learn more about Federal Pandemic Unemployment Compensation and the Pandemic Unemployment Assistance, see US Department of Labor. “Unemployment Insurance Relief During COVID-19 Outbreak.” Accessed February 18, 2021. https://www.dol.gov/coronavirus/unemployment-insurance.
103 Ganong, Peter, Pascal Noel, and Joseph Vavra. “US Unemployment Insurance Replacement Rates During the Pandemic.” SSRN, August 24, 2020. http://dx.doi.org/10.2139/ssrn.3601492.
104 Greig, Fiona, et al. “Unemployment Insurance, Job Search, and Spending During the Pandemic.” JPMorgan Chase Institute, February 2021. https://www.jpmorganchase.com/institute/research/household-income-spending/unemployment-insurance-job-search-and-spending-during-the-pandemic.
105 Roll, Stephen, and Mathieu Despard. “Income Loss and Financial Distress during COVID-19: The Protective Role of Liquid Assets.” Social Policy Institute at Washington University in St. Louis Working Paper, November 2020. https://openscholarship.wustl.edu/cgi/viewcontent.cgi?article=1036&context=spi_research.
106 To learn more about the Financial Resilience Project, see https://info.buildcommonwealth.org/frp.
107 Gopnik, Melissa, and Dr. Daryl Collins. “Emergency Savings: A Life Jacket in Rough Seas.”
108 Roll, Stephen, and Mathieu Despard. “Income Loss and Financial Distress during COVID-19: The Protective Role of Liquid Assets.”
109 Based on internal data from Neighborhood Trust Financial Partners, LIFT, and MyPath.
110 Schneider, Daniel, Kristen Harknett, and Annette Gailliot. “Unemployed Without a Net: Few Unemployed Service Sector Workers Received UI and Many Experienced Hardships.”
111 King, Justin, and Karolina Ramos. “Social Listening: Covid-19, Social Media, and The Path to a Better Safety Net.” Aspen Institute Financial Security Program, January 21, 2021. https://www.aspeninstitute.org/publications/social-listening-covid-19-social-media-and-the-path-to-a-better-safety-net/.
112 US Department of Labor. “Unemployment Insurance Weekly Claims News Release.” US Department of Labor Employment and Training Administration, April 9, 2020. https://oui.doleta.gov/press/2020/040920.pdf.
113 King, Justin, and Karolina Ramos. “Social Listening: Covid-19, Social Media, and The Path to a Better Safety Net.”
114 An audit of the 41.1 million calls made to the call centers from March 15 to June 30, 2020 revealed that over 93 percent of calls were blocked or received busy signals and 6.2 percent of callers hung up before receiving an answer. Schmidt, Mitchell. “Audit: Less Than 1% of Callers Got Through to State-Run Unemployment Call Centers Between March 15 and June 30.” Wisconsin State Journal, September 26, 2020. https://www.madison.com/wsj/news/local/govt-and-politics/audit-less-than-1-of-callersgot-through-to-state-run-unemployment-call-centers-between/%20article_06d56986-d1ab-5338-8dab-85bd312c7f7d.html.
115 Marr, Chuck, et al. “Aggressive State Outreach Can Help Reach the 12 Million Non-Filers Eligible for Stimulus Payments.” Center on Budget and Policy Priorities, October 14, 2020. https://www.cbpp.org/research/federal-tax/aggressive-state-outreach-can-help-reach-the-12-million-non-filers-eligible.
116 The Migration Policy Institute estimates that the initial CARES Act excluded 5.1 million US citizens and legal immigrants (3.7 million children and 1.4 million spouses) from payments, and that nearly 3 million of these individuals will be eligible for the second round $600 payments and first round payments as a result of the new legislation. See Gelatt, Julia, Randy Capps, and Michael Fix. “Nearly 3 Million US Citizens and Legal Immigrants Initially Excluded under the CARES Act Are Covered under the December 2020 COVID-19 Stimulus.” Migration Policy Institute, January 2021. https://www.migrationpolicy.org/news/cares-act-excluded-citizens-immigrants-now-covered; Internal Revenue Service. “Treasury and IRS Begin Delivering Second Round of Economic Impact Payments to Millions of Americans.” December 29, 2020, last modified February 3, 2021. https://www.irs.gov/newsroom/treasury-and-irs-begin-delivering-second-round-of-economic-impact-payments-to-millions-of-americans; and House Committee on Ways and Means. “Economic Impact Payments.” December 21, 2020. https://waysandmeans.house.gov/sites/democrats.waysandmeans.house.gov/files/documents/2020.12.21%20One%20Pager%20on%20Second%20EIP%20Round.pdf.
29
A Holistic Exploration of Work and Public and Workplace Benefit Arrangements
The Aspen Institute Financial Security Program
117 Elmi, Sheida. “Guaranteed Income and Other Cash Infusions: Opportunities for Scale.” Aspen Institute Financial Security Program, April 2020. https://www.aspeninstitute.org/publications/guaranteedincome/; Internal Revenue Service. “Why the Economic Impact Payment Amount Could Be Different Than Anticipated.” May 11, 2020, last modified September 19, 2020. https://www.irs.gov/newsroom/why-the-economic-impact-payment-amount-could-be-different-than-anticipated; and Elmi, Sheida, and Rachel Black. “Cash Transfers in the US Are Exploding: Here’s How to Make Them Effective, During COVID-19 and Beyond.” NextBillion, June 18, 2020. https://nextbillion.net/effective-cash-transfers-us-covid19/.
118 Black, Rachel. “Centering the Margins: A Framework and Practices for Person-Centered Financial Security Policy”; Elmi, Sheida. “Guaranteed Income and Other Cash Infusions: Opportunities for Scale”; and Murphy, Dan. “Economic Impact Payments: Uses, payment methods, and costs to recipients.” The Brookings Institution, February 17, 2021. https://www.brookings.edu/research/economic-impact-payments-uses-payment-methods-and-costs-to-recipients/.
119 Elmi, Sheida. “The Cycle of Savings: What we Gain when We Understand Savings as a Dynamic Process.”
120 Based on internal data from Neighborhood Trust Financial Partners.
121 Elmi, Sheida. “The Cycle of Savings: What we Gain when We Understand Savings as a Dynamic Process”; and Neighborhood Trust Financial Partners. “The Role of Human Touch in Emergency Cash Relief.” Accessed February 9, 2021. https://neighborhoodtrust.org/the-role-of-human-touch-in-emergency-cash-relief/.
122 King, Justin, and Karolina Ramos. “Social Listening: Covid-19, Social Media, and The Path to a Better Safety Net.”
123 Aspen Institute Financial Security Program. “Income Volatility: Managing the Swings.” September 2016. https://www.aspeninstitute.org/wp-content/uploads/2016/08/EPIC-IncomeVolatility-Managing.pdf.
124 Gopnik, Melissa, and Dr. Daryl Collins. “Emergency Savings: A Life Jacket in Rough Seas.”