Embed Size (px)
Citation preview

Part 1
Slide 1
1
NCSBN’s Multisite Studies in Simulation
and Transition to PracticeNancy Spector, PhD, RN, FAAN, Director, Regulatory Innovations
March 27, 2015, Ohio League for Nursing
___________________________________
___________________________________
___________________________________
___________________________________
___________________________________
___________________________________
___________________________________
Slide 2
Liaison for educators: Nancy Spector, PhD, RN, FAAN
312.525.3657
www.ncsbn.org
___________________________________
___________________________________
___________________________________
___________________________________
___________________________________
___________________________________
___________________________________
Slide 3 NCSBN’s Mission
The National Council of State Boards of Nursing (NCSBN) provides education, service and research through collaborative leadership to promote evidence-based regulatory excellence for patient safety and public protection.
___________________________________
___________________________________
___________________________________
___________________________________
___________________________________
___________________________________
___________________________________

Slide 4 NCSBN’s National Simulation Study
• Jennifer Hayden, MSN, RN;
• Richard Smiley, MS, MA;
• Maryann Alexander, PhD, RN, FAAN;
• Suzan Kardong-Edgren, PhD, RN, ANEF, CHSE; and Pamela Jeffries, PhD, RN, FAAN, ANEF
4
___________________________________
___________________________________
___________________________________
___________________________________
___________________________________
___________________________________
___________________________________
Slide 5 Review of Literature
• Small sample size
• No control group
• No randomization
• Variability in study design
• No longitudinal studies
5
___________________________________
___________________________________
___________________________________
___________________________________
___________________________________
___________________________________
___________________________________
Slide 6 Aims
• Can simulation be effectively substituted in the undergraduate prelicensure curriculum?
• How much?
• What courses?
• Generalizable results
• Provide data for boards of nursing
6
___________________________________
___________________________________
___________________________________
___________________________________
___________________________________
___________________________________
___________________________________

Slide 7 Research Design
• Randomized
• Controlled
• Large-scale
• Multi-site
• Longitudinal
7
___________________________________
___________________________________
___________________________________
___________________________________
___________________________________
___________________________________
___________________________________
Slide 8 Inclusion Criteria: Nursing Education Programs
• BON-approved program
• ADN or BSN
• National accreditation
• NCLEX pass rates at or above the national average pass rate
• Sim lab
8
___________________________________
___________________________________
___________________________________
___________________________________
___________________________________
___________________________________
___________________________________
Slide 9 Core Courses
• Fundamentals of Nursing
• Medical-Surgical Nursing
• Advanced
Medical-Surgical Nursing
• Maternal-newborn Nursing
• Pediatrics
• Mental Health Nursing
• Community Health Nursing
9
___________________________________
___________________________________
___________________________________
___________________________________
___________________________________
___________________________________
___________________________________

Slide 10 Instruments
• Nursing knowledge
ATI Content Mastery Series®
• Clinical competency
Creighton Competency Evaluation Instrument (CCEI)
New Graduate Nurse Performance Survey
• Global assessment of clinical competency & readiness for practice
• National Council Licensure Exam® (NCLEX)
10
___________________________________
___________________________________
___________________________________
___________________________________
___________________________________
___________________________________
___________________________________
Slide 11 Instruments
• Learning needs met
Clinical Learning Environment Comparison Survey (CLECS)
• Critical thinking
Critical Thinking Diagnostic
• Acclimation to the role of the RN
Left first nursing position, patient loads, charge nurse responsibilities, workplace stress
11
___________________________________
___________________________________
___________________________________
___________________________________
___________________________________
___________________________________
___________________________________
Slide 12 Simulation
• Scenario based simulation using high and medium fidelity manikins
• Standardized patients
• Role playing
• Computer-based critical thinking simulations
• Skills stations
12
___________________________________
___________________________________
___________________________________
___________________________________
___________________________________
___________________________________
___________________________________
Slide 13
13
___________________________________
___________________________________
___________________________________
___________________________________
___________________________________
___________________________________
___________________________________
Slide 14 Overall
Control group
25% group
50% group
Number of students randomized 847 268 293 286
Number of students completing the study
666 218 236 212
Rate of Completion 78.6% 81.3% 80.5% 74.1%
Number of students who failed a course during the study
66 25 22 19
Rate of Failure 7.8% 9.3% 7.5% 6.6%
Number of students who withdrew or were withdrawn from the study for any reason
115 25 35 55
Rate of Withdrawal 13.6% 9.3% 11.9% 19.2%**
14
Attrition
___________________________________
___________________________________
___________________________________
___________________________________
___________________________________
___________________________________
___________________________________
Slide 15 Research Question 1
Does substituting clinical hours with 25% and 50% simulation impact educational outcomes (knowledge, clinical competency, critical thinking and readiness for practice) assessed at the end of the undergraduate nursing program?
15
___________________________________
___________________________________
___________________________________
___________________________________
___________________________________
___________________________________
___________________________________

Slide 16 Knowledge: Mean Scores-End of ProgramATI Comprehensive Predictor
16
69.1% 69.5% 70.1%
0%
20%
40%
60%
80%
100%
Control group 25% group 50% groupTo
tal S
core
p=0.478
___________________________________
___________________________________
___________________________________
___________________________________
___________________________________
___________________________________
___________________________________
Slide 17 Clinical Competency: End of Program Preceptor Ratings
New Graduate Nurse Performance Survey (1-6 scale) 1=Lowest; 6=Highest
Control group
(n=155)
25% group (n=171)
50% group (n=136)
Effect size
P value
Mean SD Mean SD Mean SD
Clinical Knowledge 5.12 0.73 5.18 0.60 5.09 0.72 0.14 0.481
Technical Skills 5.06 0.76 5.09 0.64 5.01 0.86 0.11 0.659
Critical Thinking 5.11 0.72 5.06 0.71 5.03 0.88 0.10 0.668
Communication 5.30 0.65 5.34 0.65 5.24 0.87 0.13 0.478
Professionalism 5.38 0.69 5.47 0.61 5.39 0.85 0.14 0.432
Management of Responsibilities
5.22 0.71 5.20 0.70 5.17 0.85 0.06 0.849
17
___________________________________
___________________________________
___________________________________
___________________________________
___________________________________
___________________________________
___________________________________
Slide 18 Critical Thinking: End of ProgramPreceptor Ratings
Critical Thinking Diagnostic (1-6 scale) 1=Lowest; 6=Highest
Control group
(n=155)
25% group (n=171)
50% group (n=136)
Effect size
P value
Mean SD Mean SD Mean SD
Problem Recognition 4.97 0.70 5.07 0.65 5.02 0.75 0.15 0.494
Clinical Decision Making
5.09 0.60 5.18 0.61 5.12 0.81 0.15 0.469
Prioritization 5.14 0.66 5.08 0.63 5.03 0.77 0.15 0.418
ClinicalImplementation
5.10 0.61 5.19 0.60 5.10 0.76 0.15 0.361
Reflection 5.13 0.64 5.23 0.59 5.15 0.78 0.16 0.318
18
___________________________________
___________________________________
___________________________________
___________________________________
___________________________________
___________________________________
___________________________________
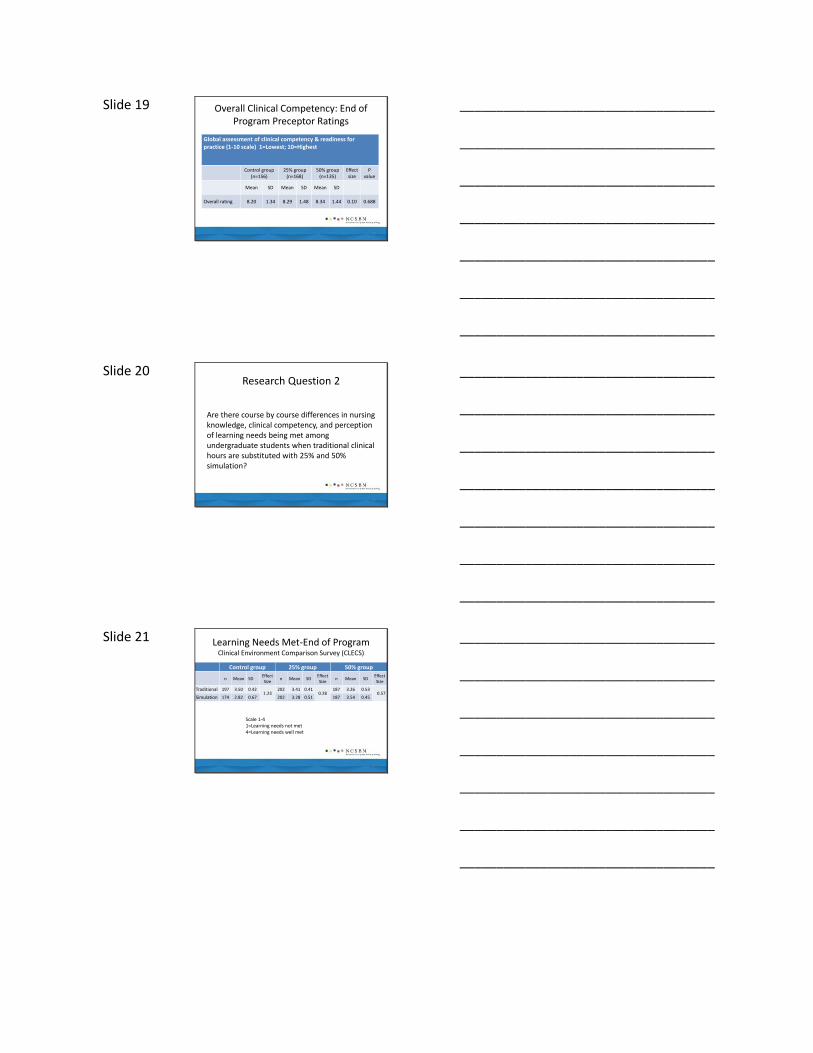
Slide 19 Overall Clinical Competency: End of Program Preceptor Ratings
Global assessment of clinical competency & readiness for practice (1-10 scale) 1=Lowest; 10=Highest
Control group (n=156)
25% group (n=168)
50% group(n=135)
Effect size
Pvalue
Mean SD Mean SD Mean SD
Overall rating 8.20 1.34 8.29 1.48 8.34 1.44 0.10 0.688
19
___________________________________
___________________________________
___________________________________
___________________________________
___________________________________
___________________________________
___________________________________
Slide 20 Research Question 2
Are there course by course differences in nursing knowledge, clinical competency, and perception of learning needs being met among undergraduate students when traditional clinical hours are substituted with 25% and 50% simulation?
20
___________________________________
___________________________________
___________________________________
___________________________________
___________________________________
___________________________________
___________________________________
Slide 21 Learning Needs Met-End of ProgramClinical Environment Comparison Survey (CLECS)
Control group 25% group 50% group
n Mean SDEffect Size
n Mean SDEffect Size
n Mean SDEffect Size
Traditional 197 3.50 0.421.23
202 3.41 0.410.28
187 3.26 0.530.57
Simulation 174 2.82 0.67 202 3.28 0.51 187 3.54 0.45
21
Scale 1-41=Learning needs not met4=Learning needs well met
___________________________________
___________________________________
___________________________________
___________________________________
___________________________________
___________________________________
___________________________________
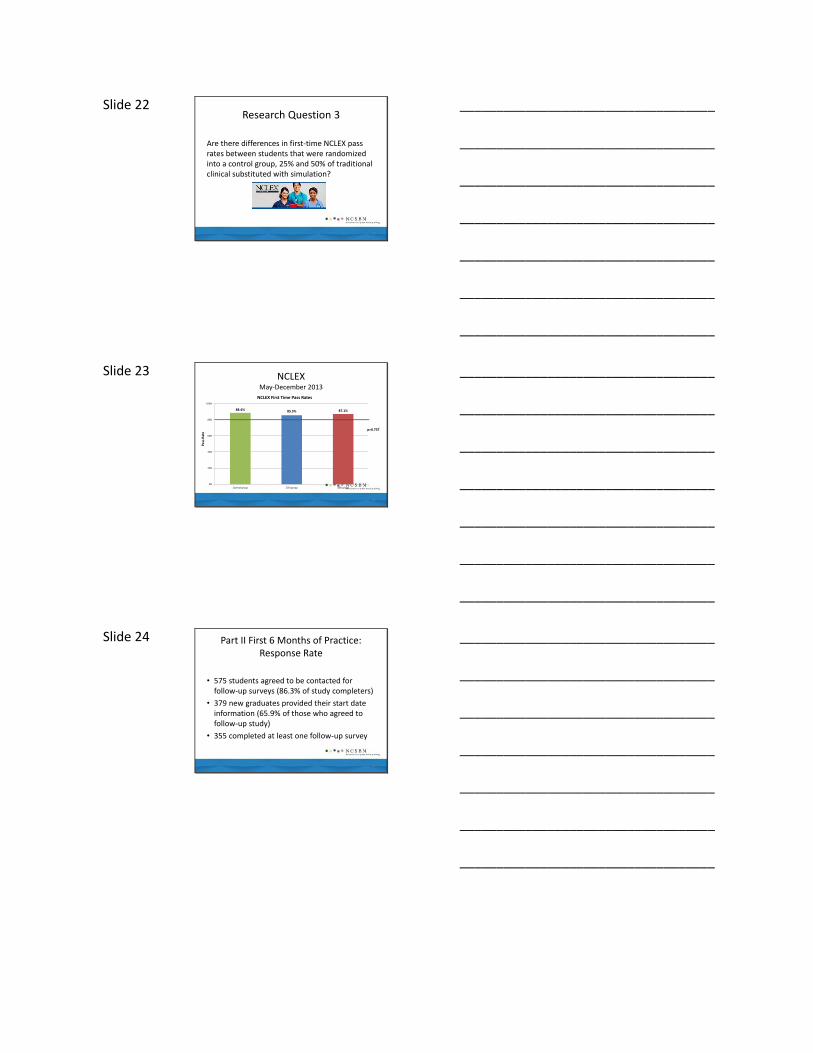
Slide 22 Research Question 3
Are there differences in first-time NCLEX pass rates between students that were randomized into a control group, 25% and 50% of traditional clinical substituted with simulation?
22
___________________________________
___________________________________
___________________________________
___________________________________
___________________________________
___________________________________
___________________________________
Slide 23 NCLEX May-December 2013
23
88.4% 85.5% 87.1%
0%
20%
40%
60%
80%
100%
Control group 25% group 50% group
Pas
s R
ate
NCLEX First Time Pass Rates
p=0.737
___________________________________
___________________________________
___________________________________
___________________________________
___________________________________
___________________________________
___________________________________
Slide 24 Part II First 6 Months of Practice: Response Rate
• 575 students agreed to be contacted for follow-up surveys (86.3% of study completers)
• 379 new graduates provided their start date information (65.9% of those who agreed to follow-up study)
• 355 completed at least one follow-up survey
24
___________________________________
___________________________________
___________________________________
___________________________________
___________________________________
___________________________________
___________________________________
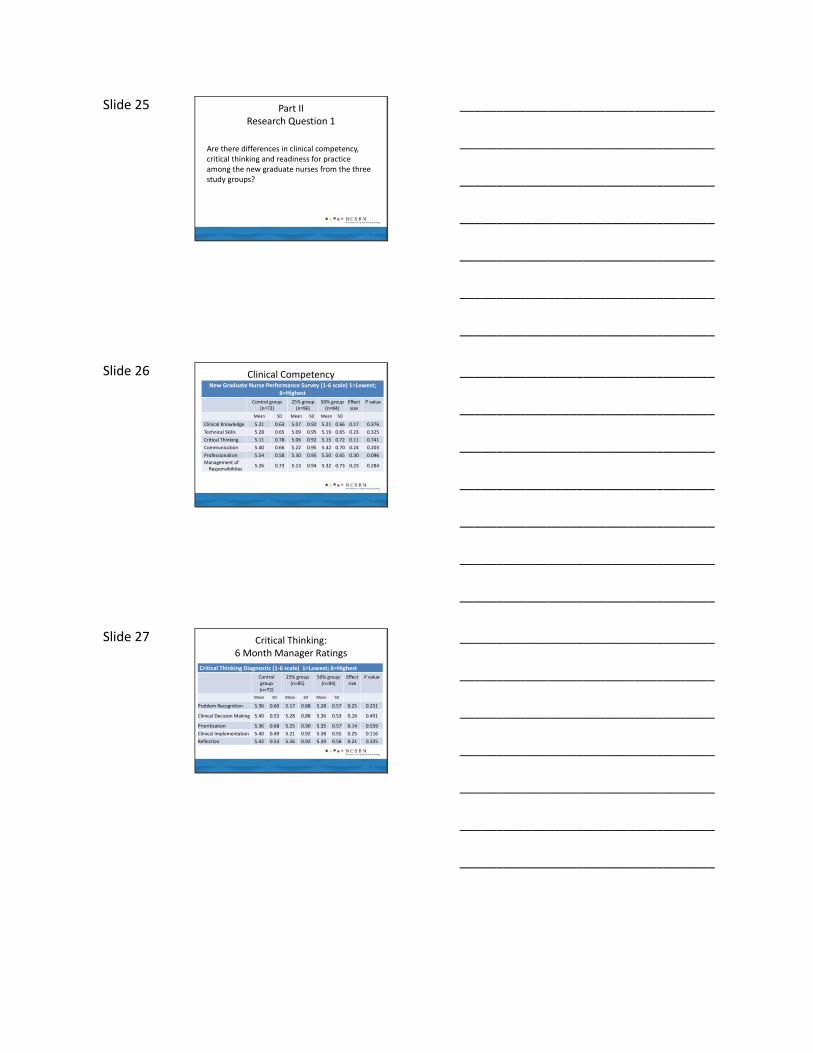
Slide 25 Part IIResearch Question 1
Are there differences in clinical competency, critical thinking and readiness for practice among the new graduate nurses from the three study groups?
25
___________________________________
___________________________________
___________________________________
___________________________________
___________________________________
___________________________________
___________________________________
Slide 26 Clinical Competency6 Month Manager RatingsNew Graduate Nurse Performance Survey (1-6 scale) 1=Lowest;
6=Highest
Control group (n=72)
25% group (n=86)
50% group (n=84)
Effect size
P value
Mean SD Mean SD Mean SD
Clinical Knowledge 5.21 0.63 5.07 0.92 5.21 0.66 0.17 0.376
Technical Skills 5.28 0.65 5.09 0.95 5.19 0.65 0.23 0.325
Critical Thinking 5.11 0.78 5.06 0.92 5.15 0.72 0.11 0.741
Communication 5.40 0.66 5.22 0.95 5.42 0.70 0.24 0.203
Professionalism 5.54 0.58 5.30 0.95 5.50 0.65 0.30 0.096
Management of Responsibilities
5.26 0.73 5.13 0.94 5.32 0.73 0.23 0.284
26
___________________________________
___________________________________
___________________________________
___________________________________
___________________________________
___________________________________
___________________________________
Slide 27 Critical Thinking:6 Month Manager Ratings
Critical Thinking Diagnostic (1-6 scale) 1=Lowest; 6=Highest
Control group (n=72)
25% group (n=85)
50% group (n=84)
Effect size
P value
Mean SD Mean SD Mean SD
Problem Recognition 5.36 0.60 5.17 0.88 5.28 0.57 0.25 0.251
Clinical Decision Making 5.40 0.53 5.28 0.88 5.36 0.53 0.16 0.491
Prioritization 5.36 0.68 5.25 0.90 5.35 0.57 0.14 0.559
Clinical Implementation 5.40 0.49 5.21 0.92 5.38 0.55 0.25 0.116
Reflection 5.42 0.53 5.26 0.92 5.39 0.58 0.21 0.325
27
___________________________________
___________________________________
___________________________________
___________________________________
___________________________________
___________________________________
___________________________________
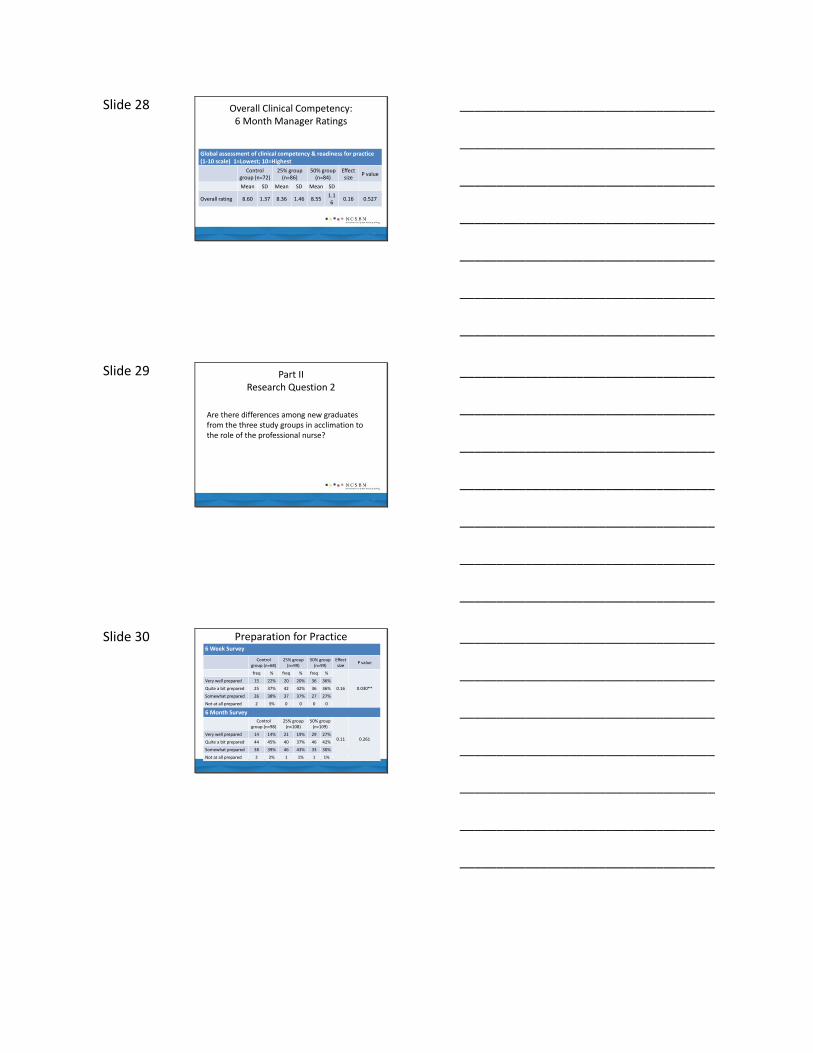
Slide 28 Overall Clinical Competency:6 Month Manager Ratings
Global assessment of clinical competency & readiness for practice (1-10 scale) 1=Lowest; 10=Highest
Control group (n=72)
25% group (n=86)
50% group(n=84)
Effect size
P value
Mean SD Mean SD Mean SD
Overall rating 8.60 1.37 8.36 1.46 8.551.16
0.16 0.527
28
___________________________________
___________________________________
___________________________________
___________________________________
___________________________________
___________________________________
___________________________________
Slide 29 Part IIResearch Question 2
Are there differences among new graduates from the three study groups in acclimation to the role of the professional nurse?
29
___________________________________
___________________________________
___________________________________
___________________________________
___________________________________
___________________________________
___________________________________
Slide 30 Preparation for Practice6 Week Survey
Control group (n=68)
25% group (n=99)
50% group(n=99)
Effect size
P value
freq % freq % freq %
0.16 0.030**
Very well prepared 15 22% 20 20% 36 36%
Quite a bit prepared 25 37% 42 42% 36 36%
Somewhat prepared 26 38% 37 37% 27 27%
Not at all prepared 2 3% 0 0 0 0
6 Month Survey
Control group (n=98)
25% group (n=108)
50% group(n=109)
0.11 0.261Very well prepared 14 14% 21 19% 29 27%
Quite a bit prepared 44 45% 40 37% 46 42%
Somewhat prepared 38 39% 46 43% 33 30%
Not at all prepared 2 2% 1 1% 1 1%
___________________________________
___________________________________
___________________________________
___________________________________
___________________________________
___________________________________
___________________________________

Slide 31 Left First Nursing Position6 Month Survey
Control group
25% group
50% group
freq % freq % freq %Effect size
P value
Left first position
5 7.2% 9 7.3% 11 9.1% 0.07 0.462
31
___________________________________
___________________________________
___________________________________
___________________________________
___________________________________
___________________________________
___________________________________
Slide 32 Patient Care Assignments6 Month Survey
Control group(n=88)
25% group
(n=106)
50% group
(n=105)
freq % freq % freq %Effect size
P value
Not challenging enough
4 5% 5 5% 5 5%
0.01 0.99Just right 73 83% 89 84% 87 83%
Too challenging 11 13% 12 11% 13 12%
32
___________________________________
___________________________________
___________________________________
___________________________________
___________________________________
___________________________________
___________________________________
Slide 33 Limitations
• Schools not randomly selected
• Used one method of conducting simulations
• Quality of the clinical experiences not assessed
• End of program preceptors and nurse managers not blinded
• End of program and nurse manager surveys relied on the study participants
33
___________________________________
___________________________________
___________________________________
___________________________________
___________________________________
___________________________________
___________________________________

Slide 34 Conclusions
1. Up to 50% simulation can be effectively substituted for traditional clinical experience in all core courses across the prelicensure nursing curriculum.
2. 50% simulation can be effectively used in various program types, in different geographic areas in urban and rural settings with good educational outcomes.
34
___________________________________
___________________________________
___________________________________
___________________________________
___________________________________
___________________________________
___________________________________
Slide 35 Conclusions
3. NCLEX pass rates were unaffected by the substitution of simulation throughout the curriculum.
4. All three groups were equally prepared for entry into practice as a new graduate RN.
5. Policy decisions regarding the use and amount of simulation in nursing needs to be dependent upon the utilization of best practices in simulation.
35
___________________________________
___________________________________
___________________________________
___________________________________
___________________________________
___________________________________
___________________________________
Slide 36 Qualifiers
These results were achieved using:
• INACSL Standards of Best Practice
• High quality simulations
• Debriefing method grounded in educational theory
• Trained and dedicated simulation faculty
36
___________________________________
___________________________________
___________________________________
___________________________________
___________________________________
___________________________________
___________________________________

Slide 37 Recommendations for Educators and Regulators
• Formally trained faculty in simulation pedagogy
• Use of theory-based debriefing methods using subject matter experts
• Adequate numbers of simulation faculty to support the learners
• Equipment and supplies to create a realistic environment
37
___________________________________
___________________________________
___________________________________
___________________________________
___________________________________
___________________________________
___________________________________