Embed Size (px)
Citation preview

1
MARCH 5, 2013
MEASURING THE FAIR VALUE OF
ILLIQUID ASSETS UNDER GAAP1
By Priya Chander and Terry Lloyd, CPA, CFA2
Fair value measurements required under GAAP cover a variety of assets and liabilities. However, the
value of many assets and liabilities cannot be determined easily or consistently. This problem is
exaggerated when financial markets are in turmoil, as they were during the 2007-2009 crisis and sell off.
Estimating the values of illiquid or infrequently traded assets and liabilities in such circumstances is
some combination of art and science. Market data from similar assets (or asset classes) can help
companies and analysts more accurately measure those uncertain values. Information from one semi-
liquid asset class—auction rate securities—provides additional market data about the impact of
illiquidity and market pricing of other illiquid assets.
I. FAIR VALUE IN GAAP
Fair Value Requirements Generally
Under the evolving rules of “fair value” in GAAP, companies must report the value of some assets
(primarily securities) and some liabilities on the balance sheet at what they believe the market would pay3
for that asset (its fair value) at the reporting date, not what the company paid for them at some prior date
(the historical cost). Some assets are fairly easy to measure (or “price”)—like a portfolio of publicly
traded stocks or bonds. Other financial instruments, like private equity positions or some foreign
currency exchange contracts, have no active markets and their values may not be known until several
years after the investment is made when the asset is finally converted to cash, or determined to be
worthless.
The Financial Accounting Standards Board (FASB) under Accounting Standards Codification (ASC)
Topic 820, “Fair Value Measurement,” defines fair value as “The price that would be received to sell an
1 Copyright © 2013 Priya Chander and Terry Lloyd.
2 Priya Chander is a manager and Terry Lloyd is a managing director, both in the San Francisco office of Finance
Scholars Group. 3 In the case of liabilities, such as deferred revenue or bonds payable, the question is what the company would have
to pay another party to assume the liability from the obligated party. During the economic meltdown, when many
large banks saw the market value of their long term debt fall, GAAP’s fair value had the perverse effect of
increasing the issuer’s equity since the value of its liabilities had gone down. The issuers could repurchase the debt
for less than they received when it was sold, resulting in hypothetical gains when the bonds were marked down to
their market values.

2
asset paid to transfer a liability in an orderly transaction between market participants at the measurement
date.” This is commonly known as the asset’s “exit value,” or the expected proceeds upon transfer. The
fair value of a liability is the amount at which that liability could be incurred or settled in a current
transaction.
Accounting standards require the use of “market inputs” when estimating the fair value of an asset or
liability. Examples of market inputs are quoted prices (for the same or similar securities), credit data, the
yield curve, and so on. Actual market prices for an asset are the most accurate measurement of its fair
value, though an active market may not always exist for an asset, so other methods have to be used to
estimate the fair value on an asset or liability. The guidance emphasizes that assumptions used to estimate
fair value should be from the perspective of a third party “market participant,” or others who may be
buying and selling similar assets.
The value of assets and liabilities under fair value fall into
a three level hierarchy based on the level of judgment required
to assign a value to the asset/liability. Level one is where an
active market exists for that asset, such as a share traded on an
active exchange. Level two uses “market observables,” which
are, essentially, market comparables on which the value is
based, such as options or other derivatives with features similar
to exchange-traded options. The values are estimated based on
standard models and techniques used by market participants.
Level three also uses standard tools and methods but relies on
“unobservable” data that the reporting company thinks market
participants would use in measuring the asset/liability.
Determining the value for the many illiquid assets held by companies reporting under GAAP requires
the company’s financial personnel to estimate the value of those assets (and liabilities), using market
evidence where available. Of necessity, the accountants and appraisers tasked with determining those
values frequently look to comparable securities to price those assets, just as a homeowner might look at
sales of comparable homes in her neighborhood to estimate the value of her property. As with the pricing
of such assets—whether homes or infrequently traded financial instruments—some amount of judgment
is required. For example, can sales data on townhomes be used in estimating the value of a single family
detached residence? What is a good or valid comparable (or “comp”) to use? The same question arises
when attempting to use market data on one type of financial instrument to estimate the value of a different
type of security.
How to Measure the Fair Value of an Illiquid Security?
A consistent issue in measuring illiquid instruments or securities is how to account for the difference
between fully liquid comparable assets like publicly traded stocks and bonds and their illiquid
counterparts such as private equity or shares that only trade infrequently. Appraisers often look to market
data, where available, to estimate and account for this difference. It is well established that investors in

3
illiquid (or less liquid) securities demand higher rates of return on those instruments to compensate them
for the lack of liquidity.4
In corporate financial reporting, for example, if a financial services firm (a bank, broker, or insurance
company) holds in its portfolio a private mortgage with features very similar to other mortgages that are
regularly bought and sold among market participants, the owner of that illiquid note has to value (or
price) that instrument on its balance sheet as part of its regular reporting. If the mortgage held by the
investor is a private contract between parties with no ready market to buy and sell it in, but it is
comparable to other market-traded instruments, how would that holder, the financial services firm,
determine the fair value of that asset? If, for example, in this simple hypothetical, the private mortgage
involved had a variable interest rate and other features similar to standard, market-traded mortgages, how
would the investor account for the mortgage’s lack of liquidity in measuring its value? In this case the
holder of the private mortgage might price the note using the market-based data for similar loans and then
apply an adjustment, or discount, to that indicated value for the note’s lack of liquidity (or marketability).
This final amount is what the company holding the note calculates someone in the market would pay for it
based on the available information.
In this case, the adjustment (a discount) for lack of marketability might be estimated as a broker’s
commission, a bid-ask spread, or the costs involved in finding a buyer and transferring the instrument.
There are other methods and market data that speak to how actual buyers and sellers in the market adjust
for an instrument’s lack of marketability.5 The exercise of determining an asset’s fair value becomes
more complicated as the nature of the instrument becomes more complex. For many financial assets held
by investors, there is not even a remote market equivalent which the position can be compared to.
Calculating the value of those investments is much harder and more uncertain than the simple example of
the private mortgage.
II. ANOTHER SOURCE FOR MEASURING ILLIQUIDITY AMONG COMPARABLE
ASSETS
The recent economic crisis, and the collapse of various security markets, provides further data on how
investors react to lack of liquidity and how they price illiquid securities relative to those that can be
readily converted to cash. Data on these two groups provides information on how much less investors
will pay for illiquid instruments compared to their fully liquid counterparts. An alternative perspective is
4 For a review of studies discussing marketability (or liquidity) discounts, see Robert Reilly and Aaron Rotkowski
(Fall 2007), “The Discount for Lack of Marketability: Update on Current Studies and Analysis of Current
Controversies,” 61:1 Tax Lawyer 241-286. 5 See, for example, Robert Reilly and Aaron Rotkowski (Fall 2007), “The Discount for Lack of Marketability:
Update on Current Studies and Analysis of Current Controversies,” 61:1 Tax Lawyer 241-286; Shannon P. Pratt
(2001), Business Valuation: Discounts and Premiums, Hoboken, NJ: John Wiley & Sons, Inc.

4
that investors require higher returns to invest in illiquid positions versus their liquid counterparts and
achieve this by paying a lower price.
A more recent example is the comparison of auction rate securities (“ARS”) to money market funds
(“MMR”). While money market accounts offer daily liquidity, like checking accounts, ARS are an
alternative that, for a long period of time, provided liquidity through frequent auctions held at set
intervals.6 Before 2007, market returns on ARS were similar to, or slightly higher than, national average
MMR generally. During the financial crises and the “freeze” of the ARS market, spreads between ARS
and money market yields changed dramatically. Yields on ARS jumped substantially, primarily due to
the inability of investors to get liquidity on those positions and their willingness to sell them at very low
prices.7 The relative behavior of ARS to a fully liquid comparable before, during, and after the meltdown
provides additional market data on the effect of illiquidity on returns required by the market.
III. AN OVERVIEW OF AUCTION RATE SECURITIES8
An ARS is a debt instrument that acts like a long-term bond for the issuer but resembles a short-term
security for the investor, who can purchase and re-sell it at fairly regular intervals—the auctions. The
time to maturity of an ARS instrument is typically 20 years or longer, and its interest rate is re-set at fixed
intervals through a “Dutch auction”9 among regular market participants. The bonds, like U.S. Treasuries,
are issued with the expectation that they will be bought and sold frequently over their lives. During the
auction, potential buyers/investors specify the amount of securities they want to buy and the minimum
interest rate they will accept from the existing holders of these securities, which results in a price
determined by the required return. A higher required rate means the investor pays less for the stream of
income; a lower acceptable rate results in a higher “bid” price. The lowest rate that clears the market—
matching buyers and sellers—is known as the “clearing rate.” Securities are allocated among bidders
who specified an interest rate that was at or below the clearing rate. Consistent with a “Dutch auction,”
all investors receive the clearing rate for their holding, regardless of the specific rate they bid. Because an
ARS holder had the option of redeeming its holding at the next auction, the ARS was considered to be a
6 Stephanie Lee, NERA Economic Consulting, Auction-Rate Securities: Bidder’s Remorse? A Primer (May 6,
2008). 7 This was part of the larger “flight to safety” when investors fled to the least risky assets available. For a brief
period, returns on some treasuries were negative, meaning investors paid more than they expected to get back when
the instruments matured. 8 Some of the material in this section is adapted from Adrian D’Silva et al., The Federal Reserve Bank of Chicago,
Explaining the Decline in the Auction Rate Securities Market, (Nov. 2008); Stephanie Lee, NERA Economic
Consulting, Auction-Rate Securities: Bidder’s Remorse? A Primer (May 6, 2008); John J. McConnell and Alessio
Saretto (Apr. 2009), “Auction Failures and the Market for Auction Rate Securities,” 97 Journal of Financial
Economics 451-469. 9 A “Dutch auction” is a market mechanism where an object, in this case a bond, is offered by the seller and the
price is reduced in increments until a buyer for the entire allotment is found. U. S. Treasury securities are sold in
this way.

5
fairly liquid asset. Auctions were held at a variety of different intervals, including one, four, five, or
seven weeks.
ARS were historically issued by municipalities, student loan finance authorities, and other tax-exempt
entities. They were viewed as relatively low-risk securities and as a result, earned high credit ratings
from the rating agencies. Before the 2008 market crash, it was also common for issuers to purchase
insurance to enhance the credit-worthiness of their bonds and to make them even more attractive to
potential investors, thereby lowering the interest rate on the bond even further.
As long as there was sufficient interest in holding ARS, auctions proceeded with few recorded
failures. Because interest rates adjusted smoothly and frequently over short intervals between auctions, in
what appeared to be well-functioning, regular sales, it was always easy to re-sell the bonds quickly, at par
value (or face value). These observed characteristics led issuers to characterize and market ARS as
virtually fully liquid securities, directly comparable to money market funds and other assets considered to
be “cash-equivalents.” This perceived liquidity was attractive to corporate investors and other
conservative investors seeking slightly higher returns by slightly compromising liquidity.
From the inception of ARS, it was understood that the auction process could fail. However,
according to Moody’s, between 1984 and 2006, there were a total of only 13 auction failures out of more
than 100,000 auctions.10
An auction is said to have failed when there are not enough bids to cover the
number of securities offered for sale. In those cases, the rate reverts to the “penalty” rate set in the bond’s
prospectus. A failed auction results in the current holder of the bond being unable to liquidate its position
and forces the issuer to pay a higher rate than expected until another attempt can be made to re-sell the
position at the next auction.
IV. OVERVIEW OF THE ARS MARKET11
The first ARS security was issued in 1984 and the market expanded significantly during the early part
of the current decade and was estimated to have reached about $330 billion by 2007. While the ARS
market freeze in 2008 was unexpected, there were some signs that indicated significant changes or
expected trouble before then. In May 2006, the SEC had imposed a $13 million fine against 15 broker-
dealers for engaging in questionable auction practices, such as intervening in the auction process to
10
See citation to “Prolonged disruption of the auction rate market could have negative impact on some ratings:
absence of liquidity jars market’s orderly functioning,” Special Report, Moody’s Investors Service, February 20,
2008 in John J. McConnell and Alessio Saretto (Apr. 2009), “Auction Failures and the Market for Auction Rate
Securities,” 97 Journal of Financial Economics 451-469, at footnote 6. 11
Some of the material in this section is adapted from Adrian D’Silva et al., The Federal Reserve Bank of Chicago,
Explaining the Decline in the Auction Rate Securities Market, (Nov. 2008); Stephanie Lee, NERA Economic
Consulting, Auction-Rate Securities: Bidder’s Remorse? A Primer (May 6, 2008); Gretchen Morgenson, “It’s a
Long, Cold, Cashless Siege,” The New York Times (Apr. 13, 2008).
6
prevent failure, and not disclosing those actions to investors. In the same year, institutional investors12
held the majority of all ARS issues, at 80%. By the end of 2007, they only held 30%. Additionally, in
July 2007, corporations owned approximately $170 billion of ARS, which decreased to $98 billion (a
42% drop) by the end of 2007. These changes in the investor base indicated an expectation—or a fear—
that a decline of the ARS market was looming, followed by a significant jump out of the market by
normal investors. This specific panic, like others, may have been self-fulfilling.
In 2007, defaults on subprime mortgages were also increasing. This led to some doubt on whether
monoline insurers13
would be able to support their obligations, which included backing ARS. As a result,
rating agencies began to downgrade insurers such as Ambac, MBIA, FGIC and XL Capital, leading to a
decline in value of their insured securities.
Many investors buying ARS during 2007 were unaware of any liquidity or credit risks. They were
under the assumption that these securities were as liquid as money market funds. However, increasing
turbulence in financial markets in 2007 led to the decline and ultimate freeze of the ARS market,
demonstrating its risky nature.
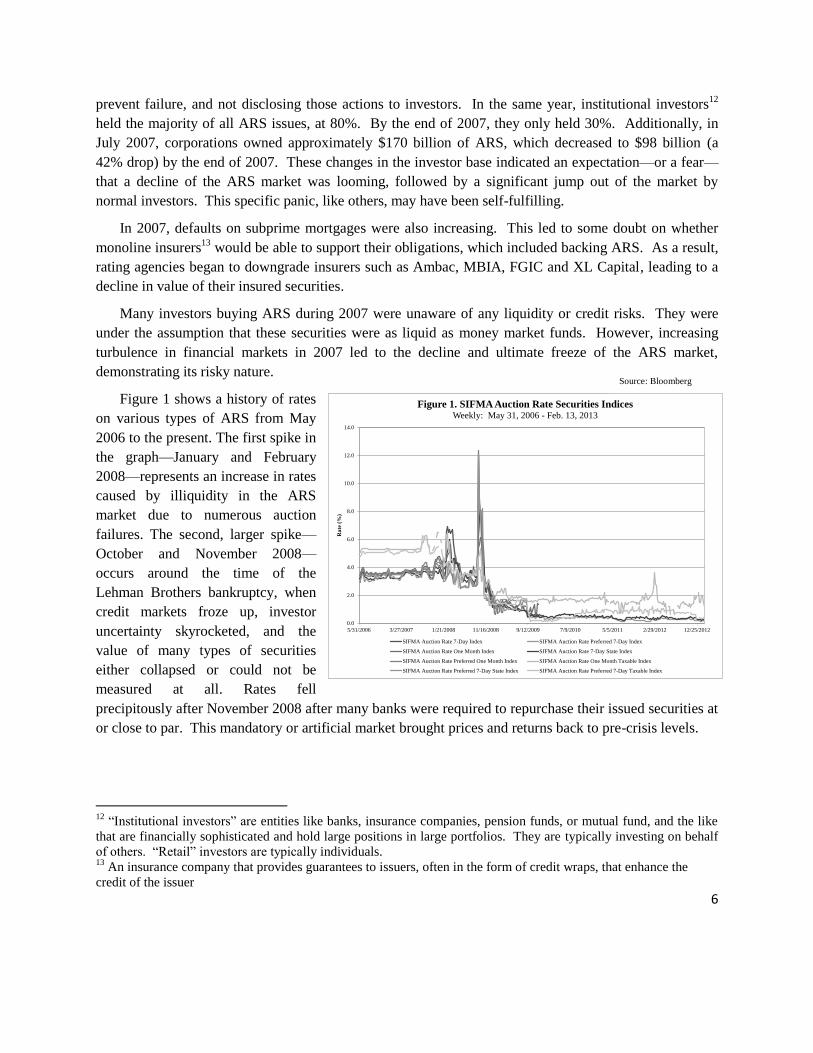
Figure 1 shows a history of rates
on various types of ARS from May
2006 to the present. The first spike in
the graph—January and February
2008—represents an increase in rates
caused by illiquidity in the ARS
market due to numerous auction
failures. The second, larger spike—
October and November 2008—
occurs around the time of the
Lehman Brothers bankruptcy, when
credit markets froze up, investor
uncertainty skyrocketed, and the
value of many types of securities
either collapsed or could not be
measured at all. Rates fell
precipitously after November 2008 after many banks were required to repurchase their issued securities at
or close to par. This mandatory or artificial market brought prices and returns back to pre-crisis levels.
12
“Institutional investors” are entities like banks, insurance companies, pension funds, or mutual fund, and the like
that are financially sophisticated and hold large positions in large portfolios. They are typically investing on behalf
of others. “Retail” investors are typically individuals. 13
An insurance company that provides guarantees to issuers, often in the form of credit wraps, that enhance the
credit of the issuer
0.0
2.0
4.0
6.0
8.0
10.0
12.0
14.0
5/31/2006 3/27/2007 1/21/2008 11/16/2008 9/12/2009 7/9/2010 5/5/2011 2/29/2012 12/25/2012
Ra
te (
%)
Figure 1. SIFMA Auction Rate Securities IndicesWeekly: May 31, 2006 - Feb. 13, 2013
SIFMA Auction Rate 7-Day Index SIFMA Auction Rate Preferred 7-Day Index
SIFMA Auction Rate One Month Index SIFMA Auction Rate 7-Day State Index
SIFMA Auction Rate Preferred One Month Index SIFMA Auction Rate One Month Taxable Index
SIFMA Auction Rate Preferred 7-Day State Index SIFMA Auction Rate Preferred 7-Day Taxable Index
Source: Bloomberg

7
V. LIQUIDITY AND RETURNS ON ARS COMPARED TO MONEY MARKET FUNDS
In order to measure the effects of
illiquidity on returns, we have used
index data tracking returns required
by investors to compare average
rates on ARS and fully liquid money
market instruments.
As previously noted, ARS were
considered for many years to be
relatively safe, highly-liquid
investments and as such, offered
rates (short term yields) comparable
to, or higher than, rates on money
market accounts nationwide. Figure
2 shows a comparison between
various auction rate indices14
and
money market indices15
between
May 2006 and February 2013.
We have adapted the rate index
data to chart historical spreads—rate
differentials—between ARS and
Money Market Accounts (See Figure
3). To calculate the spread, we took
the average of the SIFMA Auction
Rate Preferred 7-day Index and the
SIFMA Auction Rate Preferred One
Month Index and compared it to the
average Credit Union MMR and the
National Average MMR.
Figure 3 shows that through
14
Source: SIFMA Auction Rate Securities Indices. The Securities Industry and Financial Markets Association
(SIFMA) is a trade association representing securities firms, banks, and asset management companies. Members
provide research and historical statistics on financial markets and the general economy. The SIFMA ARS Indices,
produced by Municipal Market Data, are indices of actual ARS issues provided by broker dealers and auction
agents. The number of issues used to calculate the Indices may vary from week to week as new issues come to
market, are called, converted, or mature. 15
Source: Bankrate.com Money Market Indices. Bankrate, Inc. is an aggregator of financial rate information.
Bankrate regularly surveys approximately 4,800 financial institutions in all 50 states.
0.0
2.0
4.0
6.0
8.0
10.0
12.0
14.0
Ra
te (
%)
Figure 2 - Interest RatesAuction Rate Securities & Money Market Accounts
SIFMA Auction Rate Preferred 7-Day Index SIFMA Auction Rate Preferred One Month Index
Bankrate.com Credit Union Money Market Rate Bankrate.com US Money Market National Average
(150)
(100)
(50)
0
50
100
150
200
250
300
350
400
450
500
550
600
650
700
750
800
850
900
950
1,000
1,050
1,100
1,150
5/31/2006 3/27/2007 1/21/2008 11/16/2008 9/12/2009 7/9/2010 5/5/2011 2/29/2012 12/25/2012
Sp
rea
d -
Ba
sis
Po
ints
Figure 3 - Weekly Rate Spread (BPS)Auction Rate Securities & Money Market Accounts
Spread - ARS to Credit Union MMR Spread - ARS to National Average MMR
Source: Bloomberg
Source: Bloomberg

8
November 2007, there was a very small spread between the ARS indices and the National Average MMR,
with ARS averaging one basis point16
higher over the period. Both rates fluctuated between
approximately 3.5%-4.0%. A larger spread is shown through November 2007 between the ARS indices
and the Credit Union MMR, averaging around 142 basis points in the same period through November
2007.
During 2007, the subprime mortgage crises intensified and banks were forced to write down the value
of many of their holdings across many asset classes beyond their subprime portfolios. It was also
revealed that Wall Street firms in charge of auctions had been bidding with their own capital to artificially
prop up the market instead of finding the thousands of market participants necessary to “clear” the
auctions each week.17
As the credit crises emerged with the recession and market sell offs continued,
brokerage firms were no longer
willing to put their own capital at
risk to keep auctions running
smoothly.18
The absence of buyers
and motivated (fearful) sellers led to
a price collapse and yields to soar.
At the beginning of 2008,
auctions began to fail and the Wall
Street Journal noted that the ARS
market had “virtually collapsed” in
February 2008.19
Figure 4 shows
that auction failure rates peaked at
close to 90% during the month and
in just one week, almost 1,000
separate auctions failed.20
Spreads
between ARS and MMR not only
widened but also began to fluctuate more dramatically that they had historically. During this period,
significantly different rates were produced for virtually identical ARS, demonstrating increased difficulty
with accurately pricing these instruments.21
Investors were no longer able to readily liquidate their
16
A basis point (or “bp”) is one one-hundreth of a percent (.0001 or .01%). Two instruments with rates of 2.25%
and 2.50% have a spread or rate differential of 25 basis points. 17
Gretchen Morgenson, “It’s a Long, Cold, Cashless Siege,” The New York Times (Apr. 13, 2008). 18
Gretchen Morgenson, “It’s a Long, Cold, Cashless Siege,” The New York Times (Apr. 13, 2008). 19
Liz Rappaport, “Auction-Rate Debt Market Faces Probe,” The Wall Street Journal (Apr. 18, 2008). 20
There is a gap in the failure rate data on 2/18/2008 due to a market holiday. 21
For example, the East Bay Municipal Utility District in California issued two ARSs with virtually identical terms,
except for the original underwriter—one was underwritten by Merrill Lynch, the other by Citigroup. On February
19, 2008, the reset auction for the Merrill Lynch issue produced a clearing rate of 7.98%, while that for the
Citigroup issue produced a clearing rate of 5.0%. (The previous week’s auctions for the same securities had
produced interest rates of 4.25% for the Merrill issue versus 7.0% for the Citigroup issue.) See Adrian D’Silva et al.,
The Federal Reserve Bank of Chicago, Explaining the Decline in the Auction Rate Securities Market, (Nov. 2008)
0%
10%
20%
30%
40%
50%
60%
70%
80%
90%
100%
2/7/2008 2/9/2008 2/11/2008 2/13/2008 2/15/2008 2/17/2008 2/19/2008 2/21/2008 2/23/2008 2/25/2008 2/27/2008
Figure 4. ARS Market CollapseAuction Failure Rates - February 2008
Source: NERA

9
holdings in the securities in the now illiquid market and many holders were stuck with large holdings of
what had once been regarded as a “cash-equivalent.” This was not only a liquidity crisis but, for some
investors, required reclassification of the instruments in their financial statements from the “cash-
equivalent” category to long-term asset classes and uncertain pricing.
From December 2007 to the end of October 2008, the spread between auction rate indices and the
national average MMR increased from an average of one basis point (.01%) to an average of 109 basis
points (1.09%). In the same period, the spread between the ARS indices and the Credit Union MMR
increased from an average of 142 basis points to 208 basis points.
Extreme volatility came in the wake of the Lehman Brothers bankruptcy filing on September 15,
2008. Financial markets were in chaos and the value of many types of securities became almost
impossible to determine given the lack of active buying and selling. Investors were desperate to liquidate
riskier positions. Many of the holders like brokerages and mutual funds were facing waves of
redemptions and had to convert their positions to cash during the downward spiral.22
During the week of
September 24, 2008, the spread between ARS rates and the national average MMR jumped to 975 basis
points (nearly 10%). Rates on illiquid ARS were 12.2% while rates on fully liquid money market
accounts held at around 2.45%. Many ARS defaulted to their “penalty rates,” which was slightly above
LIBOR in some cases and in excess of 20% in others.
Investors filed numerous lawsuits against ARS issuers claiming the securities had been falsely
marketed to them as safe, liquid investments. Between August 2008 and the present, many banks have
entered into settlements with investors to repurchase outstanding ARS holdings.23
As a result, ARS rates
stabilized near or below money market fund rates, which have currently dropped to well below 1%.
VI. PRESENT SITUATION
From November 2008 to the present, the spread between Auction Rate indices and the National
Average MMR fell to minus 30 basis points, with money market funds paying higher returns on average.
In the same period, the spread between the ARS indices and the Credit Union MMR decreased to seven
basis points, with ARS investors still demanding slightly higher returns.
Since the collapse of the market in February 2008, there have been no new municipal auction rate
issuances.24
In March 2009, SIFMA announced its plans to end coverage of many of its auction rate
indices. Due to the decrease in the amount of auction rate security issues outstanding and the stagnant
22
On September 16, 2008, the day after Lehman Brothers filed for bankruptcy, the Reserve Primary Fund, a giant
money market fund, “broke the buck” due to exposure to Lehman Brothers’ debt securities. This happens when a
money market fund’s shares fall below a dollar in value. See Tara Siegel, “Money Market Funds Enter a World of
Risk,” New York Times (Sep. 17, 2008). 23
“More Banks Make Auction-Rate Deals,” Financial Times (Aug. 22, 2008). 24
SIFMA, “Auction Rate Securities Resource Center – Overview,” http://www.sifma.org/issues/capital-
markets/auction-rate-securities/overview/ (visited Feb. 25, 2012).

10
outlook for future issuances, SIFMA felt there were no longer enough data for the indices to give an
accurate picture of the market.25
Figure 5 shows that the ARS
market was unable to recover from
the liquidity crises it faced in 2008.
Due to bank repurchases and lack of
new issuances, the ARS market was
estimated to be shrinking by $15
billion annually in 2010.26
At that
rate and assuming no new issuance,
the ARS market could be extinct
within the next few years. The value
of assets in money market funds also
decreased during the recession
period, but is still significant and
markets are functioning.
VII. CONCLUSION
The market conditions described above provide reliable market data about the impact of illiquidity on
otherwise comparable investments. Before November 2007, the possibility of being “stuck” with an
illiquid ARS holding was remote and returns on those investments were only slightly higher than those of
fully liquid money market accounts. However, our analysis shows that as the probability of auction
failure increases, causing liquidity to decrease, investors require increasingly higher returns to
compensate for the additional risk they take on. In this case, it’s the risk of not being able to convert that
position to cash. The total amount of ARS outstanding dropped as investor’s factored illiquidity and
future uncertainty into the pricing of ARS positions.
25
Katrina Cavalli, SIFMA, “SIFMA to Terminate Auction Rate Securities Indices,”
http://www.sifma.org/news/news.aspx?id=10622 (Mar. 12, 2009). 26
Figure 5 only shows the Face Value of 7-Day Preferred ARS outstanding, but the downward trend in value
outstanding is representative of the entire ARS market.
-
2,000
4,000
6,000
8,000
10,000
12,000
14,000
-
500,000
1,000,000
1,500,000
2,000,000
2,500,000
3,000,000
3,500,000
4,000,000
4,500,000
Pa
r Va
lue A
RS
Ou
stan
din
g ($
-millio
ns)
Mo
ney
Ma
rket
Fu
nd
Ass
ets
($-m
illi
on
s)
Figure 5. Value OutstandingAuction Rate Securities vs. Money Market Funds
ICI Money Market Funds Assets ARS Preferred 7 Day Total Par
Source: Bloomberg and SIFMA

11
Figure 6. ARS-to-MMR Spread Comparison
Era Period
Average Spread - ARS
to:
National
MMR
Credit Union
MMR
1 05/2006 – 11/2007
(ordinary market) 1 142
2 12/2007 – 09/15/2008
(accelerating risk) 58 156
3 09/16/2008 – 10/31/2008
(maximum illiquidity) 407 514
4 11/2008 – Present
(mandatory, shrinking market) -30 7
Maximum Maximum Spread
(Sept. 24, 2008) 975 1,079
The data in the ARS market show that minor illiquidity – such as one week between markets – results
in higher returns of one basis point on average when compared to National MMR and 142 basis points on
average when compared to Credit Union MMR. (See period 1, Figure 6)
When auctions fail completely and illiquidity expands to weeks, or even months, higher average
returns of 58 basis points (above National MMR) and 156 basis points (above Credit Union MMR) were
required by investors. (See period 2, Figure 6)
Further, under extreme market illiquidity and uncertainty, as in the period immediately following the
Lehman Brothers Bankruptcy, even higher required returns of 407 basis points (above National MMR)
and 514 basis points (above Credit Union MMR) were recorded. (See period 3, Figure 6)
The maximum spreads of ARS above MMR were observed during the week of September 24, 2008.
Spreads above national MMR rose to 975 while spreads above credit union MMR rose to 1,079. (See
Maximum, Figure 5)
Though this is an extreme example of the impact of illiquidity on otherwise similar assets, the data
detailed above are consistent with other research and market realities: investors require higher returns to
invest in illiquid positions compared to their liquid counterparts and these higher returns result is a lower
“price” on the security.

12
Appraisers and others must consider many factors, such as illiquidity or marketability, when pricing
assets at fair value under GAAP. Historical market data, as outlined in this article, provide evidence of
the impact of these factors.
ABOUT THE AUTHORS
Terry Lloyd, CPA, CFA
Managing Director, Finance Scholars Group
Terry Lloyd, a CPA and CFA, has been handling valuation assignments for over 30 years. His practice
includes work in tax, disputes, and transactions. Mr. Lloyd has been qualified as an expert in federal and
state courts, arbitration forums, and the International Court of Arbitration. He has testified for and against
the IRS. His clients include law firms, governmental agencies like the SEC, businesses, and other CPAs
and appraisers. He has successfully defended the work of other appraisers’ conclusions before the IRS.
His work has taken him to many states, Europe, the Caribbean, and Latin America. In addition to
carrying out hundreds of engagements, he has published widely, including portions of a law school text
and has guest lectured at both law schools and graduate business schools, including Notre Dame,
Berkeley, and UCLA. He has trained lawyers, accountants, financial analysts, and judges on accounting
and finance topics. He is an arbitrator with the American Arbitration Association, FINRA, and works as a
neutral under court appointment. He once deposed a CPA. He is a shareholder Finance Scholars Group
and was previously a partner with BDO Seidman and a managing director with the Huron Consulting
Group.
Priya Chander, MBA Candidate
Manager, Finance Scholars Group
Priya Chander has five years of professional consulting experience in the areas of finance, accounting,
valuation, antitrust, and regulatory economics, among others. She has provided analytical and litigation
support on a variety of high-profile cases including the Lehman Brothers Bankruptcy and the Deepwater
Horizon oil spill settlement. Priya has also managed teams of analysts through large consulting
engagements.
Priya is currently an MBA candidate graduating in 2015 with a specialization in analytical finance. She
continues to work in the consulting industry.