Embed Size (px)
Citation preview

Strategic Marketing Performance Overview (SMPO)
(specimen)
Prepared by: Sergey Sleptsov Done on a base of my real report

Agenda
Prepared by: Sergey Sleptsov
Branding/Customer Relationship
Demand Generation
Action Plan

Branding/Customer Relationship
Marketing Productivity
Marketing Mix
Campaign Analysis
Leads Conversion Rate
Why Buy
Customer Satisfaction
Brand Awareness
Prepared by: Sergey Sleptsov

Key Indicators
Prepared by: Sergey Sleptsov
Study Result Comments Ad Readership Studies ++++ Beat Competitor 1 and Competitor 2
Response Tracking +++ Improving discipline
Secret Shopper -- 40% improvement entitlement
Closure Study ++ 20% Opportunity for DM xsell, events worst ROI performer for both partners and endusers
How Hear? / Why buy? + Good Upside for more marcom, sales performance diff per city
Yield Study ++ 33% found leads
Corporate Magazine +++ strong
Campaign Impact: Field +++++ 2M in new opps, influenced WON
Campaign Impact: Partners Q2
Campaign Impact/VOC Q2
Campaign Impact: Employees Q2

Adding new competencies, and impactFunction (1-10) good Was Is Key Improvement
Campaign Planning 1 8 Figure of Merit Internal Comms 4 7 Measurement, calendar Business Press 4 9 Training, agency management Media Buying 1 9 Registrations Creative/SETV 1 8 Message testing E-Marketing 3 9 Vendor consolidation Direct Marketing 1 0 List Management Event Management 2 8 Integrated approach Social Media 0 2 Policies Channel/Partner Mktg0 3 will-be PRM Voice of Customer 0 3 need scale /Analysis/Pricing 0 0 need scale Marketing Perf Sys 0 1 management Secret Shopper 0 management Competence Training 2 8 closed loop Activity Tracking 0 3 improving satisfaction Brand Development 2 7 need scale Lead PreQual 0 6 call center Speakers Bureau 0 6 subject matter experts
Prepared by: Sergey Sleptsov

Overview by Product Lines
Prepared by: Sergey Sleptsov
Product Line A YoY QoQ
Product Line B YoY QoQ
Product Line C YoY QoQ
Marcom OPEXMarcom Tactical Spend % RevenuePlanned Campaign vs Non-Campaign SpendMARS Tactical SpendMARS Advertising SpendMARS DM SpendMARS Events SpendImpressionsCost per ImpressionUnique ResponsesCost per ResponseResponse RateContacted Lead - Opportunity Conversion RateMarcom OpportunitiesOpportunity Initial Value
Product Line D YoY QoQ
Product Line E YoY QoQ
Product Line F YoY QoQ
Marcom OPEXMarcom Tactical Spend % RevenuePlanned Campaign vs Non-Campaign SpendMARS Tactical SpendMARS Advertising SpendMARS DM SpendMARS Events SpendImpressionsCost per ImpressionUnique ResponsesCost per ResponseResponse RateContacted Lead - Opportunity Conversion RateMarcom OpportunitiesOpportunity Initial Value

Plan vs MARS (Marketing Activities Registration System)
Difference between CMP and MARS – 2 main factors came from Events. 1. Wrong events registration. 2. Significant part of Events budget was allocated to Customers trips, not fixed in MARS.
Prepared by: Sergey Sleptsov

Plan vs OPEX
OPEX figures still unreliable. E.g. we still have negative people cost in Systems Dept. New reporting system in Q1 should rectify these issues.
Prepared by: Sergey Sleptsov
Business Unit
Marcom People Cost
Avg Total Marcom as % Rev.
Avg External Marcom as % Rev.
Product Line AProduct Line BProduct Line CProduct Line DProduct Line EProduct Line F

Planned Campaign vs Non-Campaign Spend
UnitedBrand campaign was finished. As Non Systems Dept campaigns generated small number of responses. It was decided to spend money more on to customers trips and business gifts on a New year eve. Though two depts significantly increased campaign spend but for niche campaigns for specific products/ So for now overall campaign spend on multiproduct campaigns is extremely low for the year - this needs to be improved.
Prepared by: Sergey Sleptsov

Spend by Tactic
Decrease of spent in Q4 was due to 1. Finish of UnitedBrand campaign. 2. Some advertising activities continued to work sucessfully in Q4, been paid in Q2, Q3 (Web ads in HEC). 3. Marcom mix is wrong. Spend in Q4 was more customer oriented like customer trips and business gifts – very important business generating activities in Russia on New Year eve, but without records in MARS. Its important to have these activities registered so we can see the return of investments. As such type of events are very expensive in terms of CPR, we need to understand is this activity generating enough leads and invoiced revenue, to consider such type of Marcom activity efficient.
Prepared by: Sergey Sleptsov

Impressions/CPM
With finish of UnitedBrand campaign in Q3, number of impressions significantly decreased. Probably it’s a risk for Brand Awareness. When the Brand Awareness survey shows that we lag behind main competitors. Decrease publication spend lead to CPM decrease.
Prepared by: Sergey Sleptsov
CPM
Clicks

Volume Deviation, compared to Ad weight
Prepared
Prepared by: Sergey Sleptsov
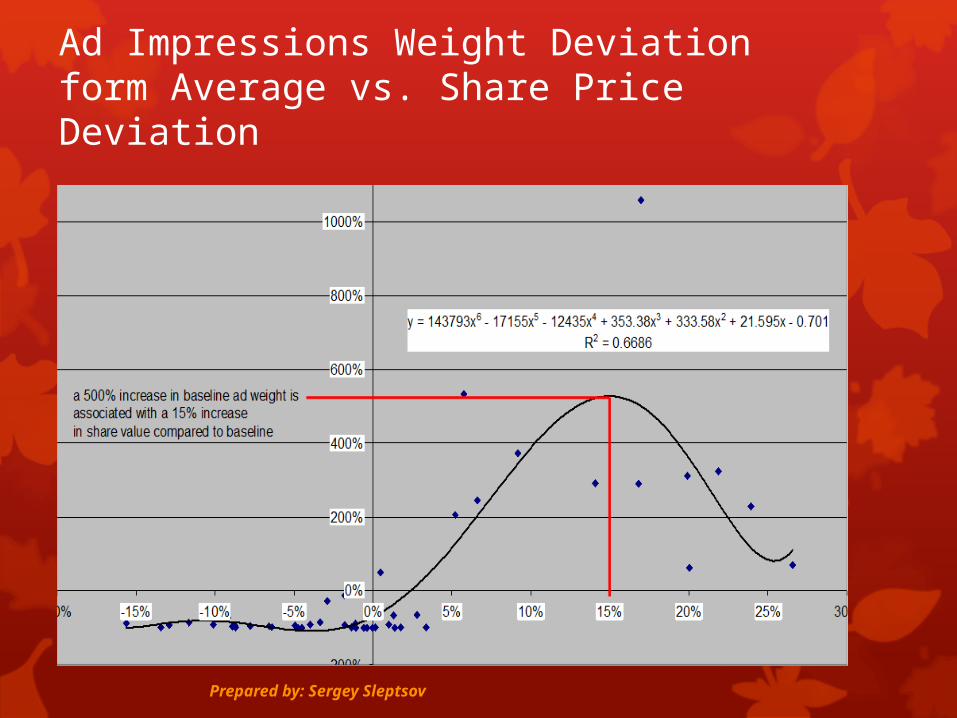
Ad Impressions Weight Deviation form Average vs. Share Price Deviation
Prepared by: Sergey Sleptsov

Responses/CPR
Direct Marketing – Corporate Magazines – main responses generator suffer decrease from Q2. Need to be done update of Customer DB used, and to invest in new DB purchase.
Prepared by: Sergey Sleptsov
CPR DM $100
CPR Media decreased to $400 due to web advertising growth

Small experience with Social/Web
Closure rates do not vary as much as cost per lead. A lower cost per lead almost always leads to much higher ROI
Prepared by: Sergey Sleptsov
Direct Marketing Event Media Webinar Social Web
CPM/Impr .55/18300 $420/238 .035/5M $45/500 Fixed, then effectively 0
Clicks 45000
CPR/Res $100/915 $1100/90 $400/250 $98/102 ,03
Closure Rate/AOS 5%/25,000 38% 0,005% 20% ?
Closed Deals 180250
18 25 200 ?
Channel Effect 2 8 Likely very high
Rate of return 10000% 332% 5500% 5500% High
Keep dependency Advertising for fresh names
Direct marketing for attendance
Creative testing for response
Direct Emarketing ???

Positive impact on Product Campaigns
Prepared
Prepared by: Sergey Sleptsov
Clear web impact of corporate campaign

Key Indicators by Campaign
Email DM generated biggest number of opportunities (Tier 4) campaign, with lowest CPR. This tactic neede to be implemented for other Product Lines. Web Banner Advertising for Tier 2 Campaign generated 25 responses.
Prepared by: Sergey Sleptsov
Tier 0 Campaign Tier 1 Campaign Tier 2 Campaign Tier 3 Campaign Tier 4 Campaign
CPM/Impr $41/60K $1220/409 $200/260K $60/2M $121/200K
Clicks 1450 35000 6000 3500
CPR/Res $70/36 $1000/20 $36/2000 $1000/100 $6/3000
Closure Rate 6% 5% 0,7% 0,005% 1,5%
Opportunity Initial Value
$10000 $25000 $150000 $5000 $750000
Opportunities Detected
2 0 25 1 50
Cost for Opportunities
Detected
Cost for Opps to be re-calculated
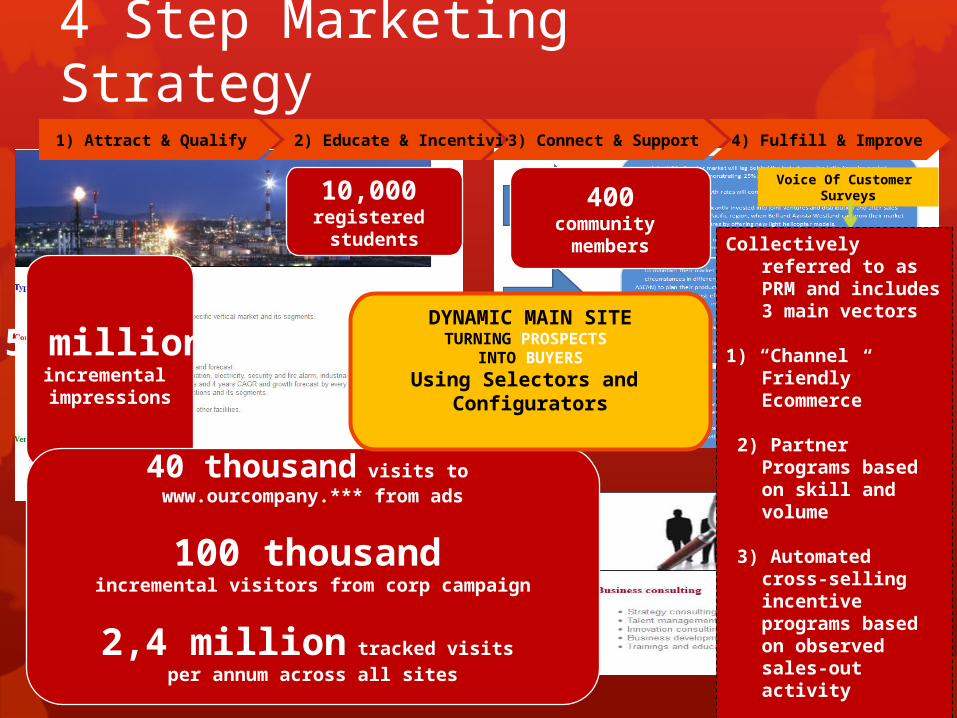
4 Step Marketing Strategy
Prepared by: Sergey Sleptsov
1) Attract & Qualify 2) Educate & Incentivise 3) Connect & Support
5 million
incremental impressions
10,000 registered students
400community
members
Voice Of Customer Surveys
Collectively referred to as PRM and includes 3 main vectors
1) “Channel Friendly” Ecommerce
2) Partner Programs based on skill and volume
3) Automated cross-selling incentive programs based on observed sales-out activity
Applies to both B2B and B2C
4) Fulfill & Improve
40 thousand visits to www.ourcompany.*** from ads
100 thousand
incremental visitors from corp campaign
2,4 million tracked visits
per annum across all sites
DYNAMIC MAIN SITETURNING PROSPECTS
INTO BUYERS
Using Selectors and Configurators

Leads Funnel
Prepared by: Sergey Sleptsov
Situation improved but still lag behind last year

Why Buy
Prepared by: Sergey Sleptsov

Key Web Priorities• One Domain
• Pre-requisites for: One Download, Transverse Configurators which are key to better control Solution pricing, cross selling, and attachment of services
• CPRM (Customer and Partner Relationship Management) strategy
• Key to measurement of customer and partner experience
• Key to optimization of pricing
• Key to move to Solution selling thru handing channel at much lower cost than traditional sales force
• Channel Insight and E-commerce
• Consumer Experience including “Channel Friendly” shopping cart
• Social Media Marketing and E-marketing expansion
• Customer software and transverse configurators
• Need consolidation of teams, transverse focus, and policy docs especially to optimize “Apps” and configurators
• 5 different website locations to offer more then 20 customer software
• 80% direct traffic
Prepared by: Sergey Sleptsov

How Hear
Prepared by: Sergey Sleptsov
Channel and Peers are the leading sources of information for both brandsResellers notably dropped from last year levels for both brands
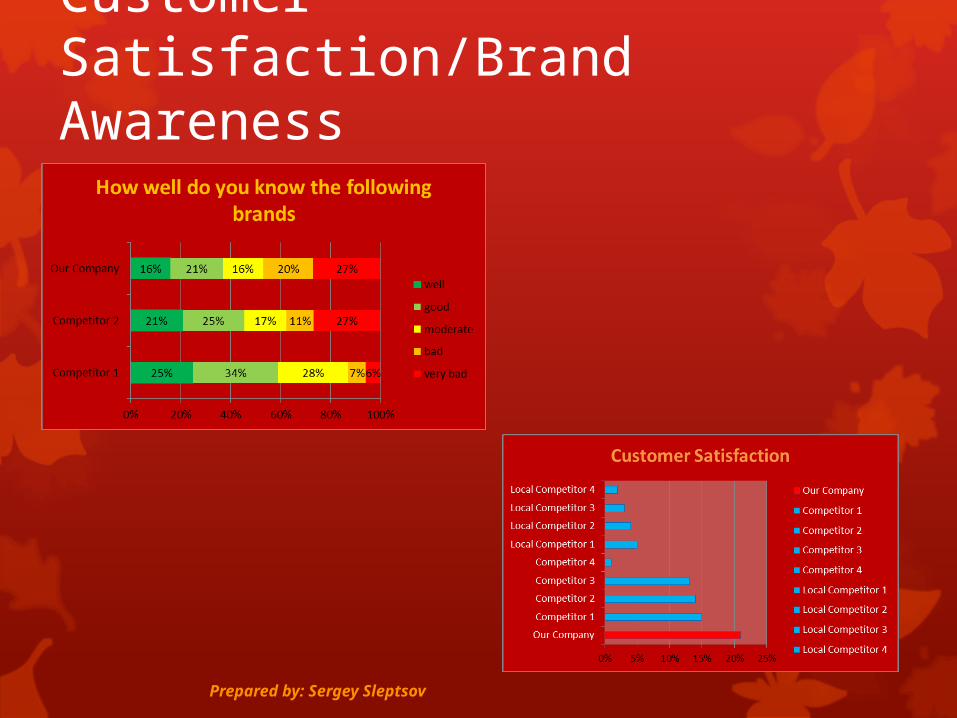
Customer Satisfaction/Brand Awareness
Prepared by: Sergey Sleptsov

Demand Generation and Customer Fulfilment
Strategy and Marketing Plan Roadmap
Revenue from New Products
Revenue from New Customers
Programs Incremental Revenues
Customers Buying Potential (Wallet Share)
Market Share and Penetration
Customer Profitability
Return on Marketing Investment
Sales per Salesperson
Customer Lifetime Value
Prepared by: Sergey Sleptsov

4P Strategy
Prepared by: Sergey Sleptsov
Product Price Place Promotion
OPTIMUM
Price= 100
MEDIUM
65 to 75
MINIMUM
25 to 45
•Current product, solution and service offers •Full compliance with standards performance• High quality• Strong R&D
•Current product• full compliance with standards and good performance• Proven technology
•New product•Average to low quality•Limited features•No R&D
•Market-down price strategy
•Optimized price/performance
•Cost plus price strategy
• Strong channel management (distributors, VARS, contractors etc)• Leading distributors
•Strong distribution network (usually tier 2 distributors)
•Distribution only
• Global brand with high awareness in target markets
•Global or local good brand
• low or no brand awareness

Yearly Marketing Plan Roadmap.
Prepared by: Sergey Sleptsov
PhasesLead
Corporate team
Businessleader
Businessleader
Corporate Team
Corporate team
August September October November December
Launch Preparation Data collection Cross check & Exchanges
Data consistency & validation
Synthesis
● Corporate team● Product line Leader● Solutions leader● Marketing- Preparation- Guidelines-Resource Allocation- tool testing
●
- Field data- Third party data
● Product& Solution Leaders
- Data reliability analysis/cross check- Exchanges
●Strategy Leader
- Exchanges- Product View consistency
● Gen Man
- Exchanges-Depts viewconsistency
● Product Leaders ● Corporate team● Top regions
-Data Consoli-dation- Market & -Competition reports- Key findings
1 month 1 month 1 month 2 Weeks 3 Weeks
Validation
Deliverables • End of phase Report
•Mid phase Report
Product lines and solutions leaders
•End of phase Report
Strategy & Regions Leaders
•End of phase Report
• Product lines report•Top regions report•Competition report

Revenue, New Products, Competition
Prepared by: Sergey Sleptsov
Product Line A Revenue
Revenue from new Customers
Market Share PAM
Share Growth %
Comp 1Comp
2Comp
3Comp
4
Local Comp
1
Local Comp
2
PLAP1 2 500 000 510 000 59% 4 237 288 11% 30% 5% 5% 1% 0% 0%PLAP2 1 700 000 356 000 65% 2 615 385 9% 25% 10% 0% 0% 0% 0%PLAP3 809 765 145 678 55% 1 472 300 10% 35% 3% 1% 1% 2% 3%PLAP4 (New Product) 965 700 650 789 61% 1 583 115 10% 40% 2% 0% 0% 0% 0%Total 5 975 465 1 662 467 60% 9 908 088 10,0% 30% 5% 2% 1% 1% 1%
Product Line BPLBP1 34 800 5 000 27% 128 889 -1,0% 15% 25% 10% 20% 2% 1%PLBP2 (New Product) 24 800 4 700 23% 107 826 -1,0% 17% 27% 12% 15% 3% 3%PLBP3 89 768 19 000 25% 359 072 -1,0% 11% 23% 8% 25% 4% 4%Total 149 368 28 700 25% 595 787 -1,0% 15% 25% 10% 20% 3% 2%Product Line CPLCP1 175 680 101 235 49% 358 531 5,0% 10% 20% 15% 6% 0% 0%PLCP2 (New Product) 97 543 65 900 50% 195 086 6,0% 10% 10% 15% 5% 5% 5%PLCP3 356 785 124 800 51% 699 578 8,0% 0% 15% 10% 10% 4% 10%Total 630 008 291 935 50% 1 253 195 7,0% 7% 15% 12% 8% 3% 5%Product Line DPLDP1 21 790 12 356 12% 181 583 -2,0% 20% 21% 23% 15% 5% 4%PLDP2 15 643 4 532 18% 86 906 -2,0% 22% 20% 15% 16% 5% 4%PLDP3 28 765 1 340 27% 106 537 -2,0% 15% 18% 13% 18% 5% 4%PLDP4 (New Product) 35 679 2 346 3% 1 189 300 -2,0% 37% 14% 18% 19% 5% 4%Total 101 877 20 574 15% 1 564 326 -2,0% 25% 17% 18% 16% 5% 4%Product Line EPLEP1 56 890 15 631 45% 126 422 2,0% 5% 5% 3% 20% 10% 12%PLEP2 45 783 12 542 46% 99 528 1,0% 2% 2% 4% 24% 12% 10%PLEP3 (New Product) 23 457 14 578 44% 53 311 3,0% 0% 0% 4% 18% 16% 18%Total 126 130 42 751 45% 279 262 2,0% 3% 3% 4% 21% 14% 10%Product Line FPLFP1 45 218 12 568 29% 155 924 2,0% 30% 20% 15% 3% 2% 1%PLFP2 78 564 24 587 31% 253 432 0,0% 25% 15% 10% 5% 5% 9%PLFP3 24 569 11 568 28% 87 746 2,0% 20% 30% 21% 1% 0% 0%PLFP4 (New Product) 12 367 5 426 32% 38 647 1,0% 21% 22% 25% 0% 0% 0%Total 160 718 54 149 30% 535 750 1,0% 23% 22% 19% 3% 2% 1%

Revenue from New Customers
Prepared by: Sergey Sleptsov

Programs Incremental Revenues
Prepared by: Sergey Sleptsov
Optimistic EstimateAt average price of a sold of 156 and assuming average increase in quarterly sold per active reseller at 4 units Program’s incremental revenue is estimated at 9,278,933
Quarter #signed up resellers
Activity factor: apply to calculate average# of quarters reseller is active
Active Quarters Since Program Sign Up
Est Incremental Product number (at 4 Qtrly Units per active reseller
Incremental Revenue , optimistic estimate
Est Incremental Product numbers (at 2 qtrly units per Active Reseller)
Incremental Revenue , pessimistic estimate
Q1 345 0,6 5 13228 1665008 6164 332504Q2 201 0,6 4,4 5674 241438 2337 120719Q3 1500 0,6 3,8 23864 3624704 11432 1312352Q4 867 0,6 3,2 14859 1949811 6930 474906Q1 530 0,6 2,6 8936 848096 3968 724048Q2 246 0,6 2 3284 596824 1142 398412Q3 235 0,6 1,4 2370 226746 685 140616Q4 281 0,6 0,8 1830 126306 415 90258Total 4205 74045 9278933 33073 3593815
Pessimistic EstimateAt average price of a sold of 156 and assuming average increase in quarterly sold per active reseller at 2 units Program’s incremental revenue is estimated at 3,593,815
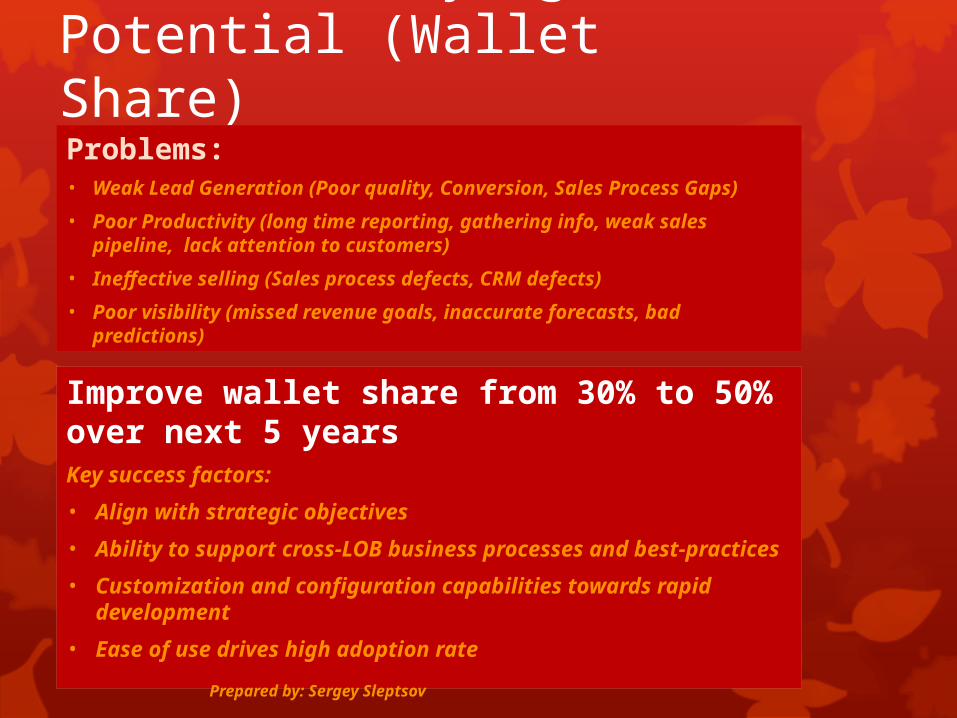
Customers Buying Potential (Wallet Share)
Improve wallet share from 30% to 50% over next 5 yearsKey success factors:
• Align with strategic objectives
• Ability to support cross-LOB business processes and best-practices
• Customization and configuration capabilities towards rapid development
• Ease of use drives high adoption rate
Problems:• Weak Lead Generation (Poor quality, Conversion, Sales Process Gaps)
• Poor Productivity (long time reporting, gathering info, weak sales pipeline, lack attention to customers)
• Ineffective selling (Sales process defects, CRM defects)
• Poor visibility (missed revenue goals, inaccurate forecasts, bad predictions)
Prepared by: Sergey Sleptsov

Market Share and Penetration
Prepared by: Sergey Sleptsov

Customer Profitability
Final design and introduction customer level metrics to be done in second half of the year.
Prepared by: Sergey Sleptsov
High profit customer Mixed bag customer Losing customerProduct line AProduct line BProduct line CProduct line DProduct line EProduct line F
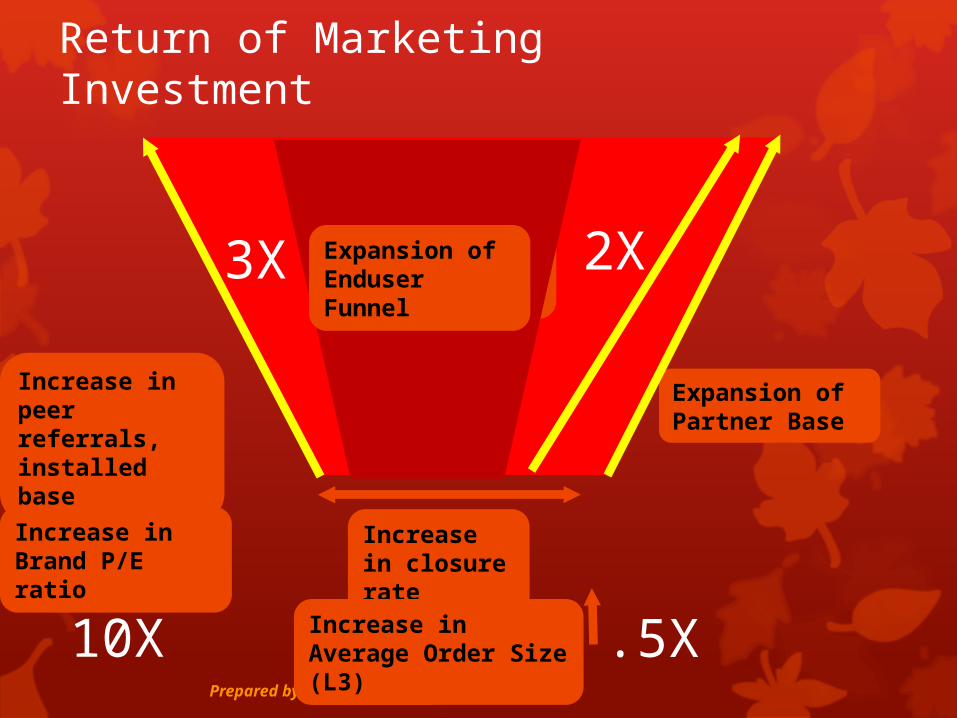
Return of Marketing Investment
Prepared by: Sergey Sleptsov
3X 2XExpansion of Enduser Funnel
Increase in peer referrals, installed base
Expansion of Partner Base
Increase in Brand P/E ratio
10X
Increase in closure rate
Increase in Average Order Size (L3) .5X
Expansion of Enduser Funnel

Sales per Salesperson/Customer Satisfaction
Prepared by: Sergey Sleptsov
Q1 Margin Q2 Margin Q3 Margin Q4 MarginMarketing LeadsAdvertisingDMEventMarcom people costChannel LeadsDisty 1Disty 2Disty 3Disty 4Channel people costSales LeadsDivision ADivision BDivision CDivision DDirect sales people costVAR's LeadsVAR 1VAR 2VAR 3VAR 4
Ease of access and Rep Manner need to be improved to ensure Revenue growth in major accounts for Direct sales dept
Service employees need to be trained additionally, new service engineers need to be hired to meet customer expectations

Convert customer Differentiate actions with brand values Drive measurable action plans per targeted audience / business
Prepared by: Sergey Sleptsov
Marcom
Forum /Blogs
Friends /Peers
Web
Awareness Selection Usage Rebuy Recommend
Shop
Partner Purchase& Payment
Delivery
Installer
OfferUsage
Call Center
Services
LoyaltyProg.
Forum /Blogs
Pre Purchase Purchase Post Purchase
Special focus on these two practices!!!
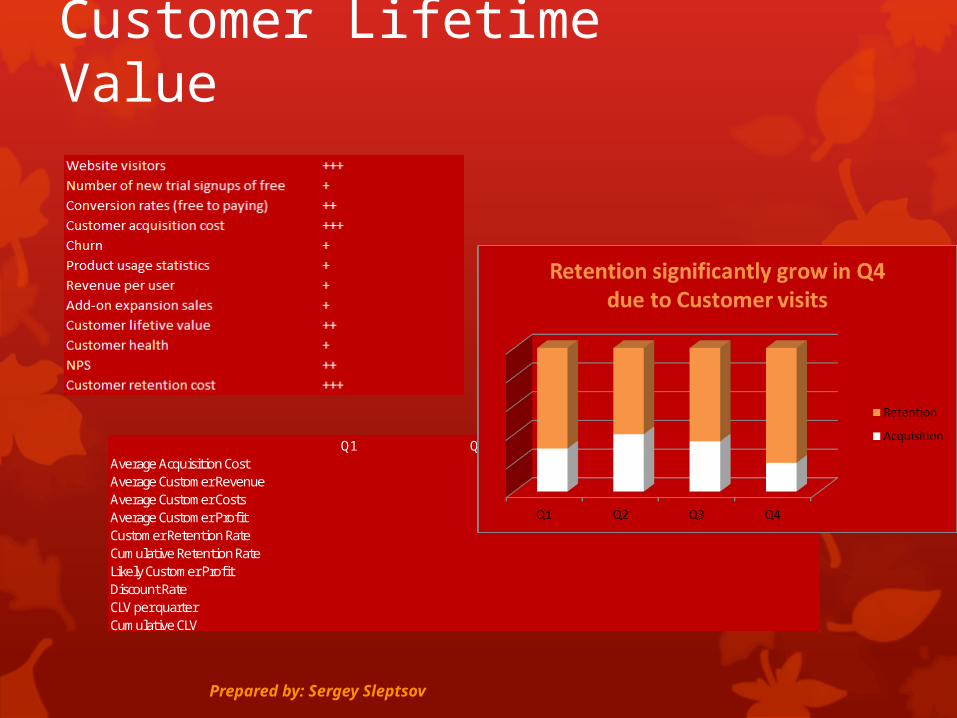
Customer Lifetime Value
Prepared by: Sergey Sleptsov
Q1 Q2 Q3 Q4Average Acquisition CostAverage Customer RevenueAverage Customer CostsAverage Customer ProfitCustomer Retention RateCumulative Retention RateLikely Customer ProfitDiscount RateCLV per quarterCumulative CLV

Action Plan
Prepared by: Sergey Sleptsov
To be done Activity owner Starting date Status Deadline
A lot of spend in CMP – Consolidated Marketing Plan for events management in reality its customer trips that are not visible in MARS – Marketing Activities Registration System. Purchasing types should be reviewed to be able to put any Marcom activity into MARS. Feb TBC Q2
People Marcom Spend in Systems Dept demonstrated negative figures in Q1 and Q2 – not correct filling of the data in finance probably. Sep TBC Q2 Review marketing mix at campaign level to ensure key strategic goals are met. Feb TBC Q2
Definition of process for identifying Our Company Competitors for Media and PR. Still lack competitors for BU’s . Situation improved in Q2 but in Q3 we see again lack of them. The important point that competitors data in the cubes is lag behind delivery schedule of SMPO report. Schedules should be better synchronized. May TBC Q2
Delivery of Share of Voice report for Russia should be sinchronized with SMPO report delivery schedule Feb TBC Q2
Leads follow up procedure and Sales Opportunities Database should be improved to make the whole process more automatic. 20** TBC. TBC
New Goals file for next year is needed Feb TBC Q2
Our Company.com web visitors mistake in statistics. Need to proceed of pushing web development team to return statistics to correct figures. July TBC TBC