Embed Size (px)
Citation preview

Articles
Marginal Abatement Costs of ReducingGroundwater-N Pollution withIntensive and Extensive FarmManagement ChoicesEmmanuel K. Yiridoe and Alfons Weersink
Cost-effectiveness is an important consideration in evaluating choices for meetingenvironmental quality objectives, Estimated crop yield response functions and the associatedgroundwater-nitrate pollution production functions were used to evaluate the optimal Nfertilization and on-farm abatement costs for alternative cropping systems, with managementchoices at both the intensive and extensive margins, The cost-effective corn productionsystem, which meets the Health Canada standard for nitrates with the highest returns ($278ha-’ ) and lowest on-farm abatement cost ($248 ha-’), was a four-yearcorn-corn-soybean-wheat rotation under conventional tillage, At contaminant limits above theHealth Canada standard, the cost-effective wheat cropping system shifted from asoybean-wheat rotation under no-tillage to a corn-soybean-wheat rotation under no-tillage.
Several recent studies document evidence of ni-trate-N leachate loss to groundwater from agricul-tural sources in Ontario (Fleming 1992; Frank,Chapman, and Johnson 199 1; Howard and Falck1986; Lee-Han and Hatton 1991; Rudolph et al,1992; Rudolph and Goss 1993). Nitrate pollutionfrom agriculture is a key groundwater contaminantin rural areas in Ontario, where approximately 90%of the population depend on groundwater supply(Neufeld 1987). Groundwater-N pollution canhave various adverse effects on human health andon environmental quality (Fraser and Chilvers1981; Sullivan et al. 1991). Increasing publicawareness of and demand for environmentalamenities are changing attitudes about agricultureand the agricultural industry’s implicit propertyrights (Batie 1988). One response to this change isa growing use of public policy options for mitigat-ing agricultural pollution problems. First-best so-lutions to pollution control problems require know-ing each firm’s marginal abatement cost (MAC),because this firm-specific knowledge will permit aderivation of the most efficient level of pollutioncontrol. Given the practical difficulty of determin-ing the marginal external cost (MEC) function, an
EmmanuelK. Yiridneis assistantprofessor,Depanmentof Economicsand Business Management, Nova Scotia Agricultural Cotlege. AlfonsWeersink is associate professor, Department of Agricultural Economicsand Business, University of Guelph.
alternative approach for determining the optimalpollution is to use an externally determined stan-dard in setting the framework for resource alloca-tion (Goody and O’Hara 1995). The drinking waterstandard, which in the case of nitrate-N is 10 mg NL-l, replaces the “pollution optimum. ” Conse-quently, the resource allocation problem involvesattaining this given groundwater quality objectivethrough, for example, a reduction in N fertilization.
Evaluating the cost effectiveness of agriculturalpollution control policies is usually based on thegeneral rule that efficiency is improved by adjust-ing farm management practices and reallocatingabatement costs to management choices with lowerMACS (McSweeny and Shortle 1990). The use ofbest management practices for controlling non-point source pollution does not always providecost-minimizing abatement strategies (Segerson1988), in part because these practices do not allowfor flexibility among alternative farm managementchoices. Reduction of groundwater-N leaching, forexample, requires adjustments in farm manage-ment choices at the intensive margin (e.g., N fer-tilization rates) and/or at the extensive margin(e.g., crop choice and rotation).
Empirical studies on nonpoint source pollutioncontrol from agriculture often integrate biophysicalsimulation models with an economic farm optimi-zation model (King et al. 1993; Taylor, Adams,and Miller 1992). Generally, the analysis involvesa mathematical programming model that forces the

170 October 1998 Agricultural and Resource Economics Review
management decisions to be selected from a dis-crete set of choices such as fertilization rate (high,medium, or low), tillage (conventional or conser-vation), or rotations (Randhir and Lee 1997; We-ersink, Dutka, and Goss 1996). The acceptablecontaminant limits, as predicted by the biophysicalsimulation model, are imposed as a constraint onthe programming model. Enforcing the constraintreduces profits from the unregulated optimumlevel and thereby measures the abatement cost ofthe environmental protection. Studies that haveused this approach to obtain on-farm abatementcosts include Helfand and House (1995), Huang,Shank, and Hewitt (1996) and Johnson, Adams,and Perry (199 1) for nitrates; Taylor, Adams, andMiller (1992) for phosphorus (and nitrates); andBoggess et al. (1979) for soil loss control, Helfandand House (1995) offer the only study that exam-ines the MAC of two systems for growing a singlecrop with an intensive management choice (N fer-tilization and irrigation water levels). Previouswork has not considered intensive and extensivemanagement choices together in examining on-farm abatement costs of alternative farming sys-tems. Neither have explicit MAC functions beendeveloped.
The purpose of this study is to explicitly deter-mine the on-farm MAC associated with reducinggroundwater-N leaching loss under alternativefarming systems. The study focuses on character-izing the MAC curve in order to evaluate the costeffectiveness of meeting specific environmentalquality standards. The use of estimated crop yieldresponse and the associated groundwater-N leach-ing functions permits evaluation of the optimal Nfertilizer rates and on-farm abatement costs for al-ternative farming systems as continuous choicevariables. Thus, the approach is most useful whenone has to consider the cost-minimizing abatementstrategies associated with groundwater-N pollutionreduction under alternative farming systems.
Theoretical Model: Deriving Abatement Costs
A representative farmer is faced with farming sys-tem choices consistent with Antle and Just (1991),which include decisions at the extensive marginregarding crop choice, crop rotation, and tillagetreatment, and at the intensive margin regardingnitrogen fertilization rate (N). Abatement costs forthree different scenarios categorized on the basis ofthe management choices available to producers arederived. Initially, only extensive discrete optionsexist: this is the typical approach used in mostempirical studies. Then, the MAC function is de-
rived and illustrated for an intensive managementchoice. Comparative statics are used to determinethe shifts in the MAC. Finally, abatement costs aredeveloped in the case where both extensive andintensive choices exist.
Extensive Management Choices
The on-farm abatement cost for meeting a givenenvironmental quality standard (LR) with extensivemanagement choices is the difference betweenmaximum unregulated profits (T*) and maximumprofits under the regulation requiring LR not to beexceeded, (#). Regulated profits are a function ofrelative prices (w) and the environmental qualityobjective. TR is found by solving the followingconstrained maximization p;oblem:
TrR(w, LR)=kfax~ If (w) xi +(1) {xi} j=,
)t[LR - ~LiXi] +~[~ - 2x,],where n is the total number of crop rotation sys-tems, n:(w) is the net returns per unit area forrotation system i in which intensive managementchoices are fixed, Xi is the area devoted to a dis-crete management choice i, k is the marginal abate-ment cost, L, is the contaminant amount generatedper unit area planted to system i, LR is the totalacceptable level of N contamination, p, represen&the marginal returns to an extra unit of land, a~d Xis the total land resource base, normalized as (X =1) in order to generate profit on per unit area basis.Without other constraints, and given the linearityof the objective function, the firm will devote allthe available land to the farming system that gen-erates the greatest net returns per unit area. Theoptimal system chosen may change if the environ-mental objective changes. Consequently, the MACcurve will be a stepwise function for this problemwith a discrete choice set of extensive managementchoices. Examples of studies that have used thisapproach to estimate abatement costs include Ran-dhir and Lee (1997) and Weersink, Dutka, andGOSS (1996).
Intensive Management Choices
Given management choices at the intensive mar-gin, the MAC curve will be a smooth twice con-tinuously differentiable function generally if theproduction functions for both crop and pollutionare smooth and continuous. The producer can stilladjust to meet LR through intensive managementchoices such as fertilization rate even if the exten-sive choices such as crop rotation are fixed. For

Yiridoe and Weersink Costs of Reducing Groundwater-N Pollu~ion 171
example, assume the level of output per unit areafor a given crop (Y,) depends on the nitrogen fer-tilizer rate applied (N) as summarized by the cropproduction function, Y = F(N), where F(N) istwice continuously differentiable. The fertilizer in-put not only produces a crop but also generatesgroundwater-N pollution or leachate (L) given by L= L(N).
Absence of a groundwater-N leaching constraintimplies that the resource is “free” since no well-defined property rights to the assimilative capacityof the groundwater system exist. With no regula-tions on groundwater nitrates, the optimal level ofN fertilizer applied to a given crop and the asso-ciated groundwater leachate level is determined bymaximizing the following profit function, (m(w)):
(2) IT(w) = kff~ F(N) – WN – C,
where w is the normalized input-output price ratio(@/p), p and ti are the respective per unit crop andN fertilizer prices, and C represents normalizedcost of production for the crop other than N fertil-izer cost. The only costs to the farmer from the useof nitrogen fertilizer are its purchase costs and notany associated environmental costs. Solving ex-plicitly for the level of N fertilizer generates theper unit area fertilizer demand function for thecrop: N* = N* (w). Substituting N* into the ap-propriate functions results in the correspondingoutput supply (F’*(w)), profit (T*(w)), and ground-water-N leaching (L*(w)) functions. The optimallevels of these endogenous variables depend notonly on prices but also on the underlying produc-tion technology that varies with the crop underconsideration, crop rotation it is grown in, and till-age choice.
The solution to the unregulated profit maximi-zation problem involving an intensive managementchoice is illustrated in figure 1. The profit functionT*(w) shows maximum net returns for the level ofN fertilization rate (panel A). Both profit functionsare nonincreasing in W and nondecreasing in p, Inthe case of cropping system 1, profits (ITl(w)) aremaximized at NT (panel A), which generates aleachate level L~ (panel B). In comparison withsystem 1, system 2 is more profitable at fertilizerrates less than NE but less profitable at rates aboveNE. At rates above NE, optimal profits (@), Nfertilization rate (NY), and leachate (Lj) for system2 are all less than the corresponding values forsystem 1.
If there is a regulation to restrict the level ofgroundwater-N leached (LR) and the farmer is re-stricted to a given farming system with the onlymanagement option being changing the fertiliza-
tion rate, the first-best solution involves solving thefollowing problem:
(3)TR(w, LR) = kffy F(N) – WN – C
+ A[LR – L(N)],
where h is the normalized MAC of a unit reductionin groundwater-N leaching standard (LR), Theprofit-maximizing nitrogen demand, which isfound by evaluating the inverse N leachate func-tion, is now a function of only the groundwater-Nleachate standard and not relative prices: NR =L-] (LR), With only one choice variable, there is nosubstitution between inputs prompted by a pricechange. Thus, the level of nitrogen is determinedby the pollution function. Solving the Kuhn-Tucker FOCS results in a marginal abatement costfunction, k = h(w,LR).
The effect of the environmental regulation onthe intensive management choice and farm profitscan be illustrated through figure 1, The right sideof figure 1 summarizes the effects of the leachateregulation on farm returns. For example, if theleachate standard is L$ then the fertilizer rate willbe Nl~ (N2~) for cropping system 1 (2). Profits forthe two systems from using the lower applicationrate will be reduced to ITIA and IT2Arespectively.Panel D shows the positive relationship assumedbetween profits and the leachate level up until themaximum profits for each system, ~~ and n~. Thedifference between these maximum unregulatedprofits and the profits with the environmental stan-dard imposed represents the on-farm abatementcosts. For example, with system 1, abatement costsare zero at Lf, which is the leachate level generatedunder unconstrained profit maximization (panel E).The abatement cost will be ACl~, (TT – IT~) for astandard set at Lf). Imposing a more stringent stan-dard will increase total abatement cost. The MACfunction A(w, LR) is the slope of the abatement costfunction in panel E.
The MAC function could also be derived explic-itly with knowledge of the crop production andgroundwater-N pollution functions. For example, aquadratic functional form best described both cropand pollution production functions in the altern-ativecom cropping systems analyzed in the follow-ing section. 1In general notation, the yield responsecurve to N fertilizer rate can be expressed as:
(4) Y= F(N)= a+ bN+cN2,
where a, b, and c are estimated regression coeffi-
1A similar maximization problem for a production system with asquare?-root yield-response function is presented in the appendix.

172 October 1998 Agricultural and Resource Economics Review
L2 ~1Leacbm3
Panel B1)
(kgN ha-l
T
Panel C
.R I‘A ... . . . . . . . . . .. . . . . .. . . ..~...........p.... ......................... ... ............. . . . . . . . . . . .. . .
.k................... ..........1Ii
‘Ii *;
i!Ili
Rate (kg N ha-l)ii! !
l~;l!
1
Profit ($ -1)
-------------------l-*---(s~~~:* =A ...-...-...-.-.....-.......-.-.....--.4-. . .-.-.-.-.--.4.-.-.-.-.--.-.---.-.-:l(w)----------
N Rate (kg N d)Abatem t Cos
($ ha-7
. . . .. . . . .
. . . . . .. . .
-----------
4
ACI
(%..................
/
,..
.
?
I
\\.-.
-
I
--+--
1-1’Pap r
7j--
~
L4 2=;
P+l E
45”
/
*13(kg NhII-\
I
L ~ L1L&xtclMte(kg N hi-l)
*
Figure 1. Evaluating Abatement Costs of Groundwater-N Pollution with Management Choices atIntensive and Extensive Margins
cients. Since yield is usually positive without any signs are required for F’(N) > 0 and F“(N) < 0.N fertilizer, and fertilizer enhances yield for initial Similarly, the quadratic groundwater-N pollutionN applications and will eventually decrease at high function can be represented as:fertilization levels, the likely signs of the coeffi-cients are a > O; b > O; and c <0. These assumed (5) L= CI+(3N+yN2,

Yiridoe and Weersink Cos~s of Reducing Groundwater-N Pollution 173
where w, ~, and y denote the estimated regressioncoefficients of the pollution function. Assumingsome groundwater-N leaching without any fertil-izer and an increase in leaching level at an increas-ing rate with N suggests that a > O; (3 > O; andy>o.
Substituting the quadratic output and pollutionproduction functions into the maximization prob-lem (equation [3]) and solving generates the fol-lowing optimal N fertilizer demand:
(6) NR (LR) = ~ [~ - ((32+ 4yLR -4cq)05]
and the marginal abatement cost function
(7) h (w, LR) =
- [-by + C~ -c(~2 + 4yLR - 4cq)0”5 + wY]
Y (P2 + 4YLR – 4ay.)05 ‘
The shape of the MAC function can be character-ized by differentiating equation (7) with respect tothe environmental standard, LR. Given the assumedsigns on the production function, differentiationyields:
2 (cP – by + ~W)
(8a) ~= <o(f32+47LR - 4eLy)3’2
and
132A –12(c~-by+yw)-y(8b) —= < ().
(dLR)’ (b*+ 4yLR - 4ay)5’2
The MAC curves decrease at an increasing ratewith higher groundwater-N leachate levels. Thissupports the general empirical observation that it iscomparatively cheap to abate initial amounts ofpollution, but additional reductions require ad-vanced expensive forms of abatement. The MACcurve that can be found as the slope of the abate-ment cost curve in panel E of figure 1 illustratesthis property since the crop (pollution) productionfunctions are assumed to be concave (convex).
Integration of the MAC function with respect tothe leachate standard generates the abatement costof pollution control. Abatement costs depend onthe returns from the productive activities that thefirm may undertake to meet any level of the envi-ronmental health objective. Differentiating equa-tion (7) with respect to the normalized price ratio,w, yields:
1(9) +=- <0.
(ft2+4yLR - 4ay)0”5
Thus, a higher (lower) input-output price ratioshifts the MAC curve inward (outward), implying
that increases (decreases) in N fertilizer (corn)price decrease the marginal cost of environmentalquality. Since profits are nonincreasing in w andMACS will reduce profits, increasing w will reduceabatement cost for a given LR. Increasing w willshift the profit function down in panel A of figure1 and translates to a shift in the AC curve inwardin panel E.
Extensive and Intensive Management Choices
Deriving the MAC function explicitly for cropchoices within a rotation is one contribution of thisstudy. Another contribution is considering both in-tensive and extensive management choices whenexamining on-farm abatement costs for wholefarming systems. Net returns for cropping system iunder the extensive choice problem given earliercan be reformulated as:
(lo) T?(w)=-F’i(Ni)– W~i – Ci,
where Ni is fixed and does not vary with prices.However, the intensive choice problem with Nivarying under groundwater-N regulation can be re-formulated as:
(1 I) ~i(w, LR) = ~i(Ni(LR)) - wNi(LR) - Ci
Both extensive and intensive decision choice prob-lems may be combined as:
$ff x~i (w, LR) Xi +(12)
[LR - ~Li (Ni (w, LR))Xi].
The decision problem for the farmer then reducesto allocating all available land to the crop choiceand rotation under the tillage system (extensivechoices) that, using the optimal N application rates(intensive choices), generates the highest net re-turns. Within each whole farming system, optimalN rates and net returns will vary according to thecrop(s), However, the cost-effectiveness of an en-tire farming system will depend not only on theintensive choices, but also on extensive choicessuch as the impact of other crops in the rotation.Panel D in figure 1 shows the relative net returnsfor two farming systems. At the environmentalquality limit L~, system 1 generates higher returnsthan system 2. Abatement costs are generated froma discontinuous type function. Given the relativemagnitudes of net returns and abatement costs asshown in panels D and E, ml* > T2~ and AC, ~ >AC2~. Thus, pollution abatement will have a moresevere impact on system 1 than on system 2 if @- ACIA K @ – AC1~. The farmer will select sys-tem 1 over system 2 even though abatement costs

174 October 1998 Agricultural and Resource Economics Review
are higher under system 1. The optimal N rate,along with its impact on groundwater-N leachingdepends on a number of other farm managementpractices. Thus, abatement costs will vary witheach farming system. The cost effectiveness of apolicy instrument in reducing groundwater-Nleaching must recognize these differing abatementcosts, in addition to the net returns.
Empirical Bio-economic Model
On-farm abatement costs within and among farm-ing systems were evaluated for a representativecash crop farmer in southwestern Ontario witheight extensive management options and one in-tensive option (N fertilizer rate) under regulationsdesigned to reduce groundwater-N leaching loss tothe root zone. The three crops considered werecorn (Zea mays L), soybeans (Glycine max L), andwinter wheat (Triticum aestivum L). The alterna-tive cropping systems analyzed included continu-ous corn (CC), soybean–winter wheat (SW), corn-soybean–winter wheat (CSW), and corn-corn-soybean–winter wheat (CCS W). These croppingsystems represent the most popular cropping sys-tems in the Delhi region of southwestern Ontario,after traditional tobacco. Details about the studyarea, along with the soil and site characteristics, aredescribed elsewhere (Yiridoe 1997; Yiridoe, Vor-oney, and Weersink 1997). The tillage treatmentsanalyzed were a conventional tillage (CT) systemand no-tillage (NT). Thus, in all, eight farmingsystems (four crop rotations x two tillage systems)were evaluated.
The CENTURY biophysical simulation model(Metherell et al. 1993) was used to generate dis-tribution data to predict crop production and theassociated N Ieachate loss to groundwater for arepresentative farm in the Delhi region of southernOntario. The CENTURY model was calibrated andthen evaluated for its performance in predictinggrain crop yields and groundwater-N leaching be-yond the root zone. The evaluation was based oncomparison of the modified CENTURY’s pre-dicted grain corn, winter wheat, and soybean yieldresponse to N fertilizer application (grown in ro-tation), and predicted N leaching levels with actualfield-measured results reported by Burton et al.(1993) and Yiridoe et al. (1993), Evaluation of theCENTURY-predicted groundwater-N leachinglevels with field data on the limited farming sys-tems for the Delhi area suggests that the predic-tions provide a good representation of the field Nemissions beyond the root zone (Yiridoe, Voroney,and Weersink 1997). Thus, the model was used toanalyze the effect of a variety of specific farm
management practices on crop yields (in rotation)and environmental quality as reflected by ground-water-N pollution. Only one crop was assumed tobe planted to the land allocated to each rotation forany given cropping year, For example, in the three-year CSW rotation, the cropping cycle is repeatedafter every three years.
Crop and Pollution Production Technologies
Crop yield response functions to N fertilizer appli-cation rate were estimated for corn and winterwheat production under several cropping systems.It was found that the concave quadratic (squareroot) functional form best fit the grain corn (wheat)yield distribution data. Separate functions were es-timated for each crop and for each alternative till-age treatment under the various crop rotation sys-tems. These parameter estimates are summarizedin table 1.
In the estimated groundwater-N pollution pro-duction functions used (table 1), the corn andwheat groundwater-N leachate distribution databest fit two forms of the convex quadratic function,with the fertilizer rate regression coefficients (qua-dratic term) being negative or positive dependingon the cropping system considered. A positive qua-dratic term implies that the convex groundwater-Nleaching function rises more sharply at higher Nfertilizer rates.
Farming System Costs
Crop budgets for the alternative cropping systemswere adapted from actual costs of production (ex-cluding land and labor) for the Delhi region, de-veloped by Yiridoe et al. (1993) and the OntarioMinistry of Agriculture, Food and Rural Affairs(1994). Production costs were lower for NT sys-tems than CT systems due largely to higher ma-chinery costs (table 2). Among the three crops,costs of production were highest for corn produc-tion, in large part because of higher seed and vari-able machinery costs. In contrast, winter wheatgenerated the lowest costs.
Results and Discussion
Optimal Conditions with NoGroundwater-N Regulation
Optimal N fertilizer rates and returns were calcu-lated using the estimated yield response functionsand average market prices. Market prices for graincorn ($0. 16 kg-l), winter wheat ($0.19 kg-’), andsoybeans ($0.32 kg-l ) represent the Ontario pro-vincial average for 1995, while N fertilizer price($0.48 kg-l N) represents an average quotation

Yiridoe and Weersink Costs of Reducing Groundwater-N Pollution 175
Table 1. Estimated Yield-Response and Groundwater-N Pollution Production Functions forAlternative Farming Systems
Production Farming System Estimated Production Function Coefficients
Function Crop Tillage Rotation Intercept Nitrogen (N) N2 @15)a Adj R2
Yield Corn CTCTCTNTNTNT
Wheat CTCTCTNTNTNT
Pollution Corn CTCTCTNTNTNT
Wheat CTCTCTNTNTNT
ccCswCcswccCswCcsw
SwCswCcswSwCswCcsw
ccCswCcswccCswCcsw
SwCswCcswSwCswCcsw
2089.3 (10,69)b2581.4 (10,46)2364.2 (8.48)2054.7 (11.07)2399,5 (14.44)2198.6 (6,68)
927,47 (30.92)1430.4 (36.71)1794.8 (64.99)1241.9(17.63)1575,0(69,22)1831.4(51,52)
10,11(3.75)12,73 (6.74)13.69 (4.08)10.87 (2.99)10.13 (3.28)13.98 (3.62)
10.24 (13,18)13.36 (16.02)14.87 (35,71)7.75 (4.07)
13.59 (18,28)14,81(15.81)
50.67 (10.94)50.67 (8,66)51,77 (7.84)46.96 (10.68)47.73 (12.13)48.85 (6.27)
-11.20 (-18.42)-8.98 (-1 1.37)-6.04 (-10.78)-7.80 (-5,47)-6.86 (14.88)-5,19 (-7.19)
-0.127(-1.98)0.086 (2.92)
-0.016 (-1 .20)-0.18 (-2,13)0.119(1.62)
-0.012 (1,13)
0,14(6,52)0,04 (2,49)
0.019(1.52)0.17 (4.12)
0,073 (3.48)0,019(1,31)
-0,156 (-7.03)-0.150 (-5.35)-0.159 (-5.05)-0.144 (-6,84)-0.137 (-7,26)-0.149 (-3,99)
284.05 (32.68)207.82 (18.41)138.62(17,32)209.43 (10,26)160,99 (24,42)
114.5(11,11)
0,0016 (5.31)0.00018 (1.84)0.0008 (2.09)0.0025 (6.08)
0.00003 (0.77)0.00087 (1.98)
0,00004 (1,37)0,00054 (4,21)0,00076 (12.67)
0.0002 (2.00)0.0005 (5.23)0.004 (6.46)
0.9850.9790.9710.9850.9890.956
0,9980,9960.9920,9830,9960.979
0.9730.9580.9130.9810.8940.910
0.990.9850.9980,9820.9940.988
“The corn yield-response to N fertilization, along with both corn and wheat pollution production functions, best fits a quadraticfunctional form (Nz), while the winter wheat yield-response function best fits a square-root functional form (/@5).‘Figures in parentheses swet-ratios,Notation: CT = conventional tillage; NT = no till; CC = corn-corn rotation; CSW = tom-soybean-winter wheat rotation; CCSW= corn-corn-soybean-winter wheat rotation; and SW = soybean-winter wheat rotation.
Table 2. Total Cost of Production (Excluding Land and Labor) for Alternative CroppingSystems ($ ha-’)
Crop Corn Soybean Winter Wheat
Tillage CT NT CT NT CT NT
Variable costsSeed and treatment 45.21 45.21 26.75 26.75 34.2 34.20Fertilizer’Soy inoculant 7.36 7.36 — —Herbicide (defoliant) o 47,81Machinery
o 55.04 0 12.9845.10 33.72 24,44 19.6 9.15 12.01
Otherb 72.50 72.50 72.50 72.50 72.50 72.50Int. on operating expenses’ 17.91 21.92 14,42 19,94 12.74 14,49Total variable costs 180.72 221.16 145.47 201,19 128.59 146,18
Fixed machinery cost 269,77 194.34 269.77 194.34 269.77 194.34
Total cost 450,49 415.50 415.24 395.53 398.36 340.52
‘N fertilization was treated separately as a management choice variable in the objective function.‘Other includes custom hiring of combine and crop insurance,‘Interest on operating expenses was 11% of all other variable cost.SOURCE: Yiridoe et al, (1993) and Ontario Ministry of Agriculture, Food and Rural Affairs (1994).

176 October 1998 Agricultural and Resource Economics Review
Table 3. Crop N Fertilization Rate, Yield, Returns, and N Leached by Farming System
N Fertilizer Rate Grain Yield Profiid N LeachedCrop Tillage Rotation (kg N ha-’) (kg ha-’) ($ ha-’) (kg N ha-’)
Corn CT cc 152,79 6189 466.47 28.06CT Csw 158.90 6845 568.52 30.94CT Ccsw 153.36 6564 526.15 30.05NT cc 152.64 5868 450.05 41.64NT Csw 163.25 6540 552.59 30.36NT Ccsw 153.86 6187 500.63 32.73
Winter wheat CT Sw 107.63 2669 65.07 25.77CT Csw 82,07 2576 59.43 20.28CT Ccsw 66.02 2522 56.77 19,44NT Sw 103,56 2565 104.89 27.50NT Csw 74.12 2453 97,24 21.75NT Ccsw 55.57 2397 95,34 28.22
Soybeanb CT Sw 2336 320.60 9.89CT Csw 2070 236.81 12.61CT Ccsw 2212 281.54 14.79NT Sw 2035 245.50 10.36NT Csw 1563 96.82 13.29NT Ccsw 1634 119.18 16.56
NOTE: Figures in bold represent the highest value for each variable under the alternative tillage systems.‘Defined as net returns from crop production (excluding land and labor costs). Given that land and labor costs differ by farm, itwas found more appropriate to calculate net returns to land and labor so that individual farms would then determine profitabilityfor each situation.‘No N fertilizer was applied to soybean. Soybean grain yield and the resulting N Ieachate 10SSrepresent mean values predicted bythe CENTURY model with N fertilizer level maintained at 90 kg N ha-’ for wheat and at 150 kg N ha-’ for corn.
from local retailers (all prices are in Canadian dol-lars). The optimal conditions under no groundwa-ter-N leaching regulation for the farming systemsconsidered are summarized in table 3. Differencesin the optimal fertilizer rate, yield, and returnsalong with groundwater-N leachate loss betweenfarming systems are discussed in the followingsections.
Nitrogen Fertilizer Rates. The average maxi-mum economic rate of N fertilizer application(MERN) with no N leaching regulation was 155 kgN ha-l for com and 82 kg N ha-l for winter wheatproduction systems, which approximates the tradi-tional rates recommended for corn (150 kg N ha-l)and winter wheat (90 kg N ha-1) for the study area.However, there were differences in the optimal Nrate for individual farming systems depending onother management choices. Among corn produc-tion systems, optimal N fertilizer rates betweenrotations and tillage systems were similar for CCand CCSW rotations. With CSW rotations, N rateswere 5 kg N ha-l higher under CT and 10 kg Nha”l higher under NT than the average, in partbecause of the reduced N intensive corn cycles inthis rotation.
Tillage had no impact on fertilizer rate to cornexcept in the CS W rotations. Differences in theaverage N rate between cropping systems weregreater for wheat than for corn production systems.
N fertilizer rates were greater under CT than underNT among wheat farming systems, supportingHalvin et al.’s hypothesis (1990) that NT regimes,which tend to accumulate crop residues on the sur-face, result in higher concentrations of organic car-bon and nitrogen than do CT regimes. Under thissituation, the CT wheat production systems willrequire greater mineral N additions to meet crop Nrequirements. Optimal N fertilizer rates on wheatdecreased with frequency of com in the rotation,suggesting that the higher rate of decay of the non-com (relative to the corn) crop residues (Woodsand Edwards 1992) may account for part of thegrowing-crop N requirements.
Crop Yields and Net Returns. Profit-maximizinggrain corn2 and wheat yields were obtained by sub-stituting the optimal N fertilizer levels into the ap-propriate production functions (table 3). Net re-turns to crop production (excluding land and laborcost) were then determined for each crop under thealternative management practices. Rotation effectsindicate the influence of extensive management
2 Corn production function under CCSW rotations was estimated frommean yieid data for the first- and second-year production cycles. [t gen-erated a corresponding N pollution function that represents an average ofthe two periods, stabilizing river the long run. In general, first-year graincom yields were higher than second-year yields, in part becauseofprevinuscropeffects,

Yiridoe and Weersink Costs of Reducing Groundwater-N Pollution 177
choices on the optimal N fertilizer rate and hencehighlight the need to estimate a production func-tion for each farming system. For example, al-though CC and CCSW rotations generated similarN fertilizer levels, yields were lower for CC, inpart because of N-rotation credits from previouscrops in CCS W rotations, CT systems generatedhigher yields than NT systems for all three crops.Differences in corn yield due to tillage effect werehighest under CCSW rotations (by 377 kg ha-])and lowest under CC rotations (by 321 kg ha-l),CSW-CT generated the highest net returns ($569ha-l) among the corn production systems. In con-trast, CC-NT generated the lowest profits ($450ha-l ). The most profitable rotation for wheat andsoybeans was a SW rotation,
Groundwater-N Leached. Groundwater-N leach-ate levels were higher than the Health Canadamaximum contaminant limit (MCL) (10 mg N ha-ltranslates to 15.2 kg N ha-l) for all twelve crop-ping systems (table 3). Groundwater-N leachatelosses were similar among the twelve croppingsystems except for continuous corn under NT,which had a markedly higher N leaching loss (42kg N ha-] per year), The high N leaching lossassociated with this system is because the totalamount of NO~-N in the soil profile that is vulner-able to leaching is directly related to frequency ofcorn in the rotation and level of crop residue on thesurface (Olsen et al. 1970).
Although average groundwater-N leaching lev-els were greater under corn production (32 kg Nha-l) than under winter wheat production systems(24 kg N ha-l), leachate levels for wheat systemswere also above the Health Canada MCL. Amongwheat production systems, CT treatments gener-ated lower N leaching levels than did correspond-ing NT systems because of the effects of crop resi-due under NT systems in increasing water drainageand leaching loss. In addition, the effect of an ad-ditional com cycle to the CSW rotation on in-creased groundwater-N leaching loss was higherunder NT than under CT. As a result, CCSW-NTgenerated the highest nitrate Ieachate level amongthe wheat production systems.
The results suggest that systems with the highestN fertilizer rates do not necessarily generate thehighest leaching losses, supporting Burton et al,’shypothesis (1993) that crop rotation pattern can beused to mitigate potential consequences of highnitrate contamination. This finding also has impli-cations for groundwater-N leaching reduction inthat improved grain yields and returns may be ob-tained without necessarily generating high levelsof pollution from N fertilizer use by selecting theappropriate crop rotation system.
Marginal Abatement Cost at theIntensive Margin
Marginal abatement costs (MACS) associated withthe alternative crop production systems were cal-culated by substituting the specific yield and pol-lution function regression parameters into the gen-eral relationships derived in equation (7), whilevarying the contaminant limit, LR, below andabove the Health Canada MCL. MAC curves as-sociated with the individual cropping systems arepresented in figure 2 for corn and in figure 3 forwinter wheat production systems. The MACcurves are convex and negatively sloping, consis-tent with the theory developed earlier,
Among wheat production systems, MAC of re-ducing nitrate leaching to the Health Canada MCLwere generally lower compared with corn andranged from $6 ha-l (SW-NT) to $61 ha-l(CCSW-CT). SW-NT generated the lowest MAC,up until an MCL of 1090 above the Health Canadastandard. Above this point, CCSW-CT generatedthe lowest MAC of pollution reduction. NT treat-ments resulted in lower MACS with SW rotations,as the standard was varied. In contrast, CT gener-ated lower MACS with CSW rotations. The resultssuggest that cropping sequence had a greater effecton magnitude of MAC than did tillage.
The MAC curves in figure 2 and 3 suggest thatdifferences in MACS between crop rotations aregreater at lower levels of N pollution than at higherlevels, Thus, the explicit MAC curves generatedsuggest that management choices at the intensive(extensive) margin may be more (less) effective inmitigating groundwater-N pollution under highMCLS. At high MCLS, crop choice and croppingpatterns are less important for mitigating nitratepollution, so adjusting other farm managementchoices at the intensive margin, such as N fertil-ization, may be more useful. This hypothesis isconsistent with Yiridoe, Voroney, and Weersink’sfinding (1997) that relative reduction in mineral Nleachate level is markedly greater when fertilizer isapplied at rates above the maximum economic rateof N fertilization (MERN) than below the MERN,
Cost-Effective Corn and Wheat CropProduction Systems
With Standards Set to Meet the Health CanadaMCL. Net returns and on-farm abatement costs ofreducing groundwater-N pollution to the HealthCanada standard are summarized for com and forwheat farming systems (table 4). The com farmingsystem that had the lowest abatement cost and alsogenerated the highest net returns under both tillagetreatments was CCSW-CT. With the Health
October 1998 Agricultural and Resource Economics Review
114 ---------------- ~-----------------------------------------------------------------------"-----------------------------
\
124
. . . . . . . . . . . . . ..-.+ . . . . . . . . . . . . ------ . . . . . . . . . . . . . . . . . . . . . . . . . . . . . . . . . . . . . . . . . . ------ . . . . . . . . . . . . ------ ------ ------ ----{
+
-i::!,
1 . . . . . . ------ .- ,,- . . +, . . . . . . ------ . . . . . . . . . . . . . . . . . . . . . . . . . . . . . . . . . . . . . . . . . . . . . . . . . ------------------- --------------------
::
;:
‘: :
4-------------w-! --&---------------------------------------"------"------------"---------"------"------------------"-"‘i, “’”,,
60- .-- . . . . . . ..- . . ..- . . . ...>.<--------------------------------------------------------------------------------------------
-., “.., ‘-.--- w.,
.~ . ...?.k<.L...............................................................................40- - -%.. -. ..-. . . . . . . . . . . . . . . ..b *N
‘... ‘h -.* . .b.. . . -..--.. .
20- -‘% . . . . . . . . . . . . . . . . . . . . . . . . . . . . . . . . . . . . . . . . . . .. .. ----- . . . . . . . . . . . . . . . . . . . . . . . . -.
010 15 20 25 20 25 D
NitrateLevel (kg N per ha)
* CT-CT * CC-NT -Q - CSW-CT
-M- CSW-NT --=-. CCSW-CT -+If- . CCSW-NT I
Figure 2. Marginal Abatement Costs for Corn Farming Systems with Alternative ManagementChoices at the Intensive Margin
i 2C
1004
w
W
4a
20
0
=?.... ... ... .. ..\ ..... ... ... .. .. ..... .. .. .. .. ..... .. ..... .. .. ... .. .. ..... .. .. .. .. ... .. .. .. .... ... .. ... .... .... ..... .. .. .
IIii
-.--------------~ ------ .--. -.-. -..------------------------------------------------------------------------------------\\\\Ii. . . . . . . . . . . . . . . . . . . . . . . . .- y . . . . . . . . . . . . . . . . . . . . . . . . . . . . . . . . . . . . . . . . . . . . . . . . . . . . . . . . . . . . . . . . . . . . . . . . . . . . . . . . . . . . . . . . . .II ‘$
I ‘,
I ;
1;.... .. .... .. ... .... ... ... .. .. A. . . . . . . . . . . . . . . . . . . . . . . . . . . . . . . . . . . . . . . . . . . . . . . . . . . . . . . . . . . . . . . . . . . . . . . . . . . . . . . . . . . . . . . .
‘1 , :, ,,
\ \ -$, “,
\ \ .. ‘,,\\ .%,,............. ...L<. . .. L...y. +. . . . . . . . . . . . . . . . . . . . . . . . . . . . . . . . . . . . . . . . . . . . . . . . . . . . . . . . . . . . . . . . . . . . . . . . . . . . . . . . . . . . .
16 22
Nitrat~Level (kg Nmpr he)24
-E- SW-CT + SW-NT -El- CSW-CT
-%4- CSW-NT - -El-. CCSW-CT -* -. CCSW-NT
Figure 3. Marginal Abatement Costs for Winter Wheat Farming Systems with Alternative Man-agement Choices at the Intensive Margin

Yiridoe and Weersink Costs of Reducing Groundwater-N Pollution 179
Table 4. Farm Returns and Abatement Costs for Corn and Wheat Farming Systems underAlternative Management Choices at the Intensive Margin ($ ha-l)
Groundwater-N Conventional TlllageLeaching Limit
No-TMage
(kg N ha-’) cc Csw Ccsw cc Csw Ccsw
13.6815.20’16.72
Corn 18.24farming 19.00systems 20.00
22.5025.0030.0040.00
54.91 (481.65Y205.98 (260.49)313,62 (196.07)420.68 (94.18)441.89 (45.07)450.84 (15.64)459.62 (6.85)464.54 (1.93)465.78 (0.69)
r.c.
42.11 (526.41) 69.24 (456.91)152.11 (416.40) 277.90 (248.25)243.90 (324.62) 359.18 (166.97)320.38 (248.13) 410.98 (115.17)353.55 (214.96) 430.63 (95.52)392.62 (175.90) 451.98 (74.17)469.90 (98.61) 489.52 (36.63)522.26 (46.25) 511.44 (14.71)567,47 (1.05) 526.15 (0.00)449.87 (0.19) r.c.
84.35 (436.71)165.78 (284.27)217.50 (280.71)377.69 (126.01)389.82 (69.98)400.66 (49,39)414.07 (35.98)424.54 (25.52)438.85 (11.20)
r,c.
161.11 (391.47) b
231.19 (321.40) 217.9:282.67)293.98 (258.61) 305.72 (194.91)349.61 (202.98) 360.57 (140.06)374.81 (177.78) 381,50 (119.13)405.31 (147.28) 404.54 (96.10)468.66 (83.93) 446.25 (54.38)513.92 (38.66) 472.73 (27.90)552.42 (0.17) 497.70 (2.93)
r.c. r.c.
Sw Csw Ccsw Sw Csw Ccsw
13,68 -13.01 (78,09) -30.18 (89,626) 66.69 (38.20) -4,25 (101.50) r.c.15.20 12.67 (52.40) 33.90 (25.54) 20.52r~36.25) 77,47 (27.42) 65,59 (31.66) 63.05 (32.29)
Wheat 16.72 30.51 (34.56) 50.73 (8.70) 50.63 (6.14) 85,57 (19.32) 84.02 (13.23) 81.74 (13.59)farming 18.24 43.20 (21,87) 57.22 (2.21) 55.97 (0.80) 91.70 (13.20) 92.28 (4.96) 87.76 (7.58)systems 19.00 48.11 (16.97) 58.65 (0.79) 56.67 (0.09) 94.16 (10.73) 94.56 (2.68) 89.57 (5.77)
20.00 53.34 (11.73) 59.40 (0.03) r.c. 96.90 (7.99) 96.39 (0.86) 91.30 (4.04)22.50 61.69 (3.38) r.c. r.c. 101.68 (3.21) r.c. 93.82 (1.52)25.00 64.90 (0.17) r,c. r.c. 104.16 (0.74) r.c. 94.94 (0.40)30.00 r.c. r,c. r.c. r.c. r.c. r.c.
‘On-farm abatement cost ($ ha-’) is in parenthesis.bThe notation r.c. implies that the groundwater-N restriction was a nonbinding constraint. Consequently, the (least cost) optimalconditions will be as occur under no groundwater-N regulation.‘Health Canada MCL for nitrates is equivalent to 15.2 kg N ha-’.
Canada nitrate pollution restriction, returns forCCSW-CT exceeded the next best alternative (CC-CT) by $72 ha-l. In contrast, CSW rotations gen-erated the lowest returns and the highest abatementcosts despite being the most profitable corn pro-duction system under no pollution regulation (table3), The reason for the change is that the yield re-sponse function or pollution function is more re-sponsive to changes in N fertilization rate for CSWthan for the other rotations. For example, the im-provement in groundwater-N quality to the HealthCanada standard was achieved under CCSW-CTby reducing optimal N fertilizer rate by 64% andsubsequently com yield by 28%. In contrast, opti-mal N fertilization rate and yield decreased by 83%and 4490, respectively, under CSW-CT. A yieldreduction of this magnitude is unlikely to be ac-ceptable to farmers,
Among the wheat production systems, CSW ro-tation generated the lowest abatement cost ($26ha-l) and the highest returns ($34 ha-l) at theHealth Canada standard under CT systems (table4). Under NT, SW was the most cost-effective sys-tem with the highest net returns ($78 ha-l) andlowest on-farm abatement cost to the producer($27 ha-’). SW-CT was the most negatively im-pacted upon by the groundwater-N quality regula-
tion. This finding underscores the need to evaluateboth net returns and abatement costs for policydecision-making. The lowest cost wheat produc-tion system for reducing groundwater-N leachingloss is to shift to a noncom (less N-intensive) croprotation system, consistent with Johnson, Adams,and Perry’s analysis (199 1) of the least-costmethod of reducing N pollution for potato, alfalfa,and grains crops. In a similar analysis, Swinton andClark (1994) found a substitution of less N-intensive soybean crops for corn with tighter pol-lution restrictions.
Under Alternative Groundwater-N Standards.In general, returns were highest under less N-intensive rotations with stringent pollution-standards and were highest for CCSW rotationsamong com production systems (table 4), At LR s16.72 kg N ha-l, the most cost-effective corn farm-ing system was CCSW-CT, which consistentlygenerated the highest profits and lowest abatementcost, CC-CT generated the lowest abatement costwith relaxed (higher) leachate restrictions (LR a18.24). Thus, more stringent restrictions on leach-ing had the lowest impact on CCSW-CT, amongthe corn production systems. However, less strin-gent restrictions on pollution had the lowest impacton CC-CT rotation. Among corn production sys-

180 October 1998
terns, relative ranking of the level of abatementcost seems to correlate inversely with relativeranking in profitability at low environmental stan-dards. At higher standards (LR >20 mg N ha-l),there was not necessarily a direct correlation be-tween abatement cost and returns. Thus, relativeranking of the corn production systems dependedon the standard considered.
The effect of tillage on relative ranking of thelevel of abatement cost depended on the rotation.For example, NT systems generated higher abate-ment costs under CC and CCSW rotations, whileCSW rotations generated higher abatement costsunder CT as the standard was varied. Althoughtillage did not have a consistent trend on profit-ability across standards, at lower nitrate limits(with L~ <20 mg N ha-l), CT treatments weremore cost-effective than were NT systems underCC and CCSW rotations. In contrast, NT systemswere more cost-effective than were CT for CSWrotations.
Among wheat production systems, SW-NTranked first in profitability under the various re-strictions on N leaching (table 4). In contrast, SW-CT generated the lowest returns under the stan-dards considered. NT systems generated higher re-turns than the corresponding CT systems. SW-CTconsistently generated the highest on-farm abate-ment cost as the groundwater-N restriction wasvaried. The only exception was when the leachingrestriction was set at 13,68 kg N ha-l, in which itranked third. Relative abatement cost rankingamong the remaining systems depended on thestandard. The effect of tillage on abatement costsalso depended on the rotation. NT generated highabatement costs under CSW rotations. In contrast,CT generated higher abatement costs under SWrotations.
Cost-Effective Whole Farming System
In the preceding section, the cost-effective cornand wheat production technologies were analyzedunder the alternative corn and wheat crop produc-tion systems. In this section, net returns and abate-ment costs were generated for all the crops withineach crop rotation system, with decision choices atboth the intensive and the extensive margins. Thepurpose was to determine the most profitable of theeight farming systems that yould be allocated toall the land resource base (X = 1) under a givenenvironmental quality standard. In the first part ofthis section, cost-effectiveness is evaluated underpeak nitrate leaching conditions in which N leach-ate is assumed to be associated with the individualcorn and wheat crops within each crop rotationsystem.
Agricultural and Resource Economics Review
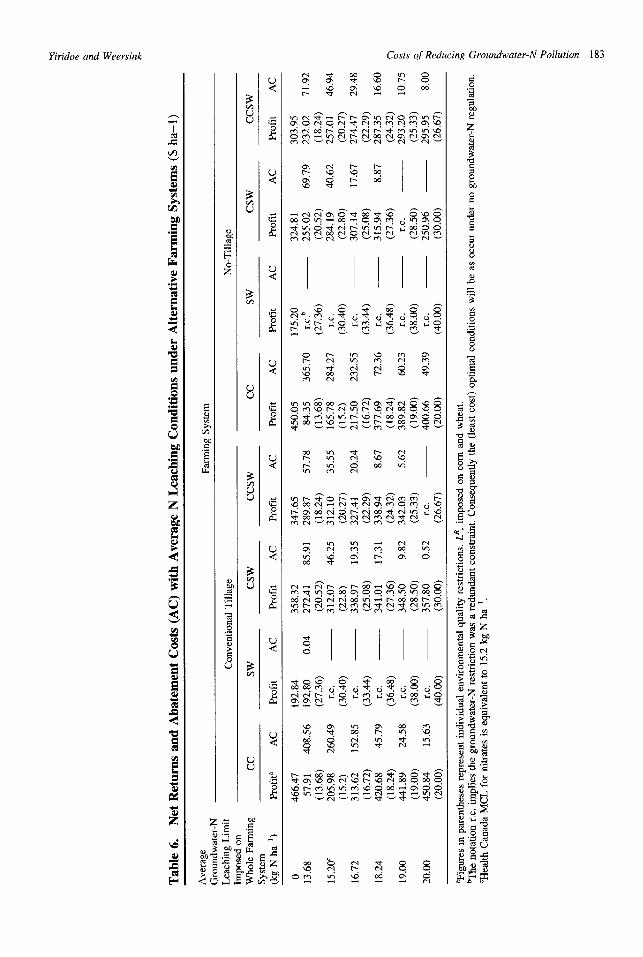
However, in reality a multicrop rotation shouldallow some abatement to occur through other cropsin the cropping system, Given that no N fertilizer isnormally recommended for soybean crops, therewere no smooth N leachate loss production curvesestimated (as a function N fertilization) for the soy-bean production systems. In the first part of thissection, the objective of allocating all the availableland resource to the most profitable whole farmingsystem was examined with the assumption thatthere was no environmental constraint imposed onthe soybean production technologies. Although Nleaching loss associated with the soybean produc-tion systems, due mainly to inherent soil N, may beless of a concern compared with N contaminationresulting from crops to which N fertilizer is ap-plied, the analysis below could exaggerate N leach-ing loss from systems where corn is rotated withcrops that leach less than corn. To evaluate thispossibility, the same whole farming systems wereanalyzed with “average” N leachate levels inwhich a given multicrop rotation system allows forsome abatement to occur through other crops in therotation. For example, with the Health CanadaMCL restriction, an “average” N leachate restric-tion is imposed on the whole farming system undera CC rotation, similar to that for the individual com
R = 15.2 kg N ha-l). How-crops in the rotation (Lever, the average N leachate level associated withan SW rotation would require double the leachatelevel (i.e., 30.4, or 2 x 15.2 kg N ha-l) from thewheat crop since it was assumed that no N leachingloss from N fertilization resulted from soybeanproduction. In other words, the soybean crop isassumed to mitigate, at least in part, the high levelof N leachate (30.4 kg N ha-l) associated with thewheat crop. Results of the cost-effective farmingsystem under average N leaching for all the cropsunder each of the eight systems follow the analysisunder peak N leaching conditions.
Under Peak N Leachate Loss, Net returns andon-farm abatement costs for whole farming sys-tems are summarized in table 5. With no environ-mental regulation, continuous com under CT wasthe most profitable farming system, followed byCC-NT. In contrast, SW farming systems gener-ated the lowest profits. Average com yields were2.5 (3.2) times greater than wheat (soybean) yields(table 2), so differences in profitability rankingwith no constraints on groundwater quality to thefarmer were influenced by the differences in grainyields. In addition, the yield response functions forthe CC rotations were relatively flat for the rangewithin the optimal N fertilization rates. Thus, re-ductions in N rate as the standard was tightened
Yiridoe and Weersink Costs of Reducing Groundwater-N Pollution 181

182 October 1998 Agricultural and Resource Economics Review
generated less than proportionate reductions inyield and hence profits, Consequently, continuouscorn systems generated higher profits than didfarming systems with only soybean-wheat crops inthe rotations. An interesting finding was that theSW rotations were the most profitable systemswhen the pollution restriction was set at 13.68 kg Nha-l, The N-intensive rotations involving corn areunprofitable at very low MCLS.
Environmental standards set at the HealthCanada MCL had the greatest adverse effect (interms of reduction in net returns) on CC farmingsystems under NT (table 5). In contrast, SW-NThad the lowest negative impact. As a result, theon-farm abatement cost was highest under CC-NT($284 ha-l) and lowest under SW-NT ($14 ha-l).In contrast to the results under no environmentalregulation, CCSW-CT was the most profitablefarming system that meets the Health Canada stan-dard. On-farm abatement cost reduced CCSW-CTreturns by 38%. The adverse impact of the envi-ronmental constraint resulted in CSW-CT generat-ing the lowest net returns ($144 ha-l), a shift fromSW-NT in the unregulated scenario.
As the environmental standard was varied abovethe Health Canada MCL, CC-CT consistently gen-erated the highest profits. Yet the same farmingsystem was not the least adversely affected by thegroundwater pollution control standards. For ex-ample, with standards set at (LR s 19.00 kg Nha-]), percentage reductions in net returns weresimilar for SW-CT, SW-NT, and CC-CT, Thus, theearlier hypothesis that profitability ranking amongfarming systems is influenced, in large part, bydifferences in system yields is consistent with thisfinding. Although abatement costs reduced net re-turns, farming systems with higher crop yieldsmore than made up for pollution control costs.
Under Average N Leaching Conditions. Resultsof the impact of average N leaching loss on thecost-effective whole farming system under the al-ternative farming systems considered are presentedin table 6. Analyzing cost-effectiveness using av-erage N leached for whole farming systems (result-ing in higher N leaching from the associated cornand wheat crops in the multicropping systems) fur-ther makes the CC systems unprofitable at slightlyhigher average N pollution levels (LR s 16.72 kgN ha-’) than in the preceding analysis. For ex-ample, the cost-effective system to allocate all theland with standards set to meet the Health CanadaMCL for whole farming systems was a CCSW-CT,followed by the three-year CSW-CT rotation. Incontrast, the two CC rotations ranked the lowest incost-effectiveness. The CC rotations generated thehighest cost-effectiveness ranking at slightly
higher average N pollution standards (LR a 18.24kg N ha-l). Thus, consideration of systems wherecorn is rotated with crops that leach less than comgenerates higher net returns and lower abatementcosts than the results summarized in table 5 sug-gest.
Policy Implications
The results provide several useful insights for bothfarmers and policymakers. The key issue underly-ing the policy implications or usefulness of theresults concerns minimizing both environmentaland abatement costs. On-farm abatement cost es-timates are important particularly in watershedswith small overall off-farm net benefits. In thatcase, if there are significant net costs to farmers,the decision may tilt in favor of maintaining thestatus quo, rather than abate. Moreover, the abate-ment cost estimates are likely to be the upperbounds associated with the individual farming sys-tems analyzed because of the possibility of discov-ering cost-saving technologies from enforcingtighter pollution standards. Porter and van derLinde (1995) noted that unforeseen technologicalinnovations in groundwater-N pollution control orprevention can also generate lower abatement coststhan previously envisaged.
Another policy implication of the MAC resultsstems from the fact that many agricultural pollu-tion control programs involve cost-sharing initia-tives (between farmers and a pollution controlagency). Under such circumstances, the agencywill need to know the level of payment and thespecific farmers who should benefit from the pay-ment program in order to encourage producers toadjust their farming practices. Accurate knowledgeof farming system-specific MAC functions is es-sential in this regard, since higher abatement costsassociated with particular farming systems will re-quire higher incentives in order to encourage pro-ducers to adjust their production practices.
Implementing the cost-effective farming systemthat meets the Health Canada standard requires ac-curate crop yield and pollution production func-tions in order to determine the optimal N fertiliza-tion rates. In turn, this requires an effective systemto monitor farmers’ compliance to the recom-mended N application rates, Incorporating moni-toring costs adds a further dimension to this mul-tistage, simultaneous issue, where compliance tothe recommended rates may require reevaluatingthe cost-effective cropping systems. The cost ofmonitoring compliance is a technical issue involv-ing an analysis that is beyond the scope of thepresent study,
Yiridoe and Weersink Costs of Reducing Groundwater-N Pollution 183
6?’
i!
z
3Gv
184 October 1998
Summary
Agricultural and Resource Economics Review
References
Knowledge of the characteristics of MAC func-tions is necessary to determine how farmers cancost-effectively adjust their production practices inorder to meet pollution regulation objectives. Thestudy found that because the maximum economicrate of N fertilization and the level of groundwa-ter-N leaching loss depend on a variety of farmmanagement practices, such as crop choice, croprotation, and tillage treatment, on-farm abatementcosts also varied with the farming systems. With-out any regulation, groundwater-N leachate levelswere higher than the Health Canada MCL for allthe farming systems considered. Systems that re-quired the highest optimal N fertilizer rates did notgenerally result in the highest leaching losses, im-plying that crop rotation pattern can be used tomitigate potential consequences of high nitratecontamination. It is important to note that theseresults are sensitive and highly dependent on cropprices. For example, soybean acreage has in-creased tremendously in recent years in response toincreased prices.
The explicit MAC curves generated support theconventional wisdom that choice of a cost-effective farming system for mitigating nitrateleaching is more critical under more stringent stan-dards than at higher pollution levels. Differences inMACS among farming systems are more signifi-cant under more stringent standards (lower leach-ate levels). At high pollution levels, crop choiceand cropping pattern are less important, so adjust-ing other farm management practices, such aschoices at the intensive margin, may be more useful.
The cost-effective corn production system,which meets the Health Canada MCL, with thehighest returns and lowest on-farm abatement costsof groundwater-N leaching regulation was a four-year CCSW rotation under CT. Among wheat pro-duction systems, SW-NT generated the highest re-turns and the lowest abatement costs in order tomeet the Health Canada standard. At MCLS abovethe Health Canada standard, the cost-effectivewheat farming system shifted from SW-NT toCSW-NT. The results highlight the importance ofdecomposing the elements of the abatement costfunction for each farming system, involving pollu-tion production and yield response functions.Knowledge of these system-specific abatementcosts is particularly relevant under a cost-sharinginitiative between farmers and a pollution controlagency in which the agency needs to base any in-centive packages to farmers on accurate informa-tion about the MACS associated with particularfarming systems.
Antle, J.M., and R.E. Just. 1991, “Effects of Commodity Pro-gram Structure on Resource Use and the Environment.” InCommodity and Resource Policies in Agricultural Sys-
tems, ed, R.E. Just and N. Bockstael Sweeney. New York:Springer-Verlag.
Batie, S. 1988, “Agriculture as the Problem: The Case ofGroundwater Contamination.” Choices 3:4-7.
Boggess, W., J. McGrann, M, Boehlje, and E,O. Heady, 1979.
“Farm-Level Impacts of Alternative Soil Loss Control
Policies.” Soil and Water Conservation 34: 177–83.
Burton, D.L., M.F. Younie, E.G. Beauchamp, R.G. Kachanosk],D,M, Brown, and DE. Elrick. 1993.Alternate Crop Man-
agement Practices and Nitrate Contamination of Ground-
water with Sandy Soils Used for Tobacco Production. Re-port prepared for Tobacco Diversification Plan/AlternateEnterprise Initiative Development Branch, AgricultureCanada, and Supplies and Services Canada. Ottawa,Canada.
Fleming, R,J. 1992.Rural Well Water Survey, Huron CounV—1991. Report to the Ministry of Agriculture and Food.Toronto, Canada.
Frank, R.N., N. Chapman, and R. Johnson, 1991, ‘‘Survey ofFarm Wells for Nutrients and Minerals,” Bulletin of Erz-
vironmental Contamination and Toxicology47:146–51.Fraser, P., and C. Chilvers. 1981. “Health Aspects of Nitrate in
Drinking Water.” Science of the Total Environment 18:
103-16.
Goody, J,, and S. O’Hara. 1995. Economic Theory for Environ-
mentalists. Delray Beach, Fla.: St. Lucie Press.Halvin, J,L,, D.E, Kksel, L.D. Maddux, M.M. Classen, and J.H.
Long. 1990. “Crop Rotation and Tillage Effects on SoilCarbon and Nitrogen.” Soil Science Society of America
Journal 54:448–52.
Helfand, G.E., and B,W. House. 1995, ‘‘Regulating NonpointSource Pollution under Heterogeneous Conditions. ”American Journal of Agricultural Economics 77:1024-32.
Howard, K., and H. Falck. 1986. “Interrelationships of LandUse, Soil Conditions and Groundwater Contaminationnear Lindsay, Ontario.” Canadian Water Resources Jour-nal 11:111–25.
Huang, W-Y,, D. Shank, and T.I. Hewitt, 1996. “On-FarmCosts of Reducing Residual Nitrogen on Cropland Vulner-able to Nkrate Leaching.” Review of Agricultural Eco-
nomics 18:325–39,
Johnson, S.L,, R.M. Adams, and G.M. Perry. 1991. ‘‘The On-Farm Costs of Reducing Groundwater Pollution.” Ameri-
can Journal of Agricultural Economics 73: 1063–73.
King, R.P., D.W. Lybecker, A, Regmi, and S,M. Swinton. 1993.‘‘Bioeconomic Models of Crop Production Systems: De-sign, Development, and Use. ” Review of AgriculturalEconomics 15:389401.
Lee-Han, H., and B. Hatton. 1991. Survey of Bacterial and
Nitrate Contamination of Private Well Water. Report pre-pared for the Regional Municipality of Waterloo. Water-100,Ontario.
McSweeney, W.T., and J.S. Shortle. 1990. “Probabilistic CostEffectiveness in Agricultural Nonpoint Pollution Con-trol. ”Southern Journal of Agricultural Economics 22;95–
104.
Yiridoe and Weersink
Metherell, A.K., LA. Harding, C.V, Cole, and W,J, Parton.1993. “CENTURY Soil Organic Matter Model Environ-merit,” Technicat Documentation. Agroecosystem version4,0 Great Plains System Reseaxch Unit Technical Reportno. 4, Fort Collins, Colorado: USDA-ARS.
Nrrefeld, D. 1987. ‘‘Groundwater: Its Management and Protec-tion in Ontario.” Ontario Legislative Library Paper no. 58.Toronto, Canada: Legislative Library.
Olsen, R.J., R.F, Hensler, O.J. Attoe, S.A, Witel, and L.A.Peterson. 1970. “Fertilizer Nitrogen and Crop Rotation inRelation to Movement of Nitrogen through Soil Profiles.”Soil Science Society of America Journal 34:448-S2.
Ontario Ministry of Agriculture, Food and Rural Affairs(OMAFRA). 1994. “’1994Crop Budgets.” Publication 60.Toronto: OMAFRA.
Porter, M.E., and C. Van der Linde. 1995, “Toward a NewConception of the Environment-Competitiveness Relation-ship.” Journal of Economic Perspectives 9:97-118,
Randhir, T.O., and J.G, Lee. 1997. ‘‘Economicand Water Qual-ity Impacts of Reducing Nitrogen and Pesticide Use inAgriculture.” Agricultural and Resource Economics Re-
view 26:39–5 1.
Rudolph, D., and M. Goss. 1993. Orrtario Farm Groundwater
Quality Survey: Summer 1992. Report prepared for Agri-culture Canada. Ottawa: Agriculture Canada.
Rudolph, D., M. Goss, A, Graham, G, Kachanoski, M, Scafe, D,Aspinafl, B. Van den Broek, S. Clegg, D. Barry, and J.Stimson. 1992. Ontario Farm Groundwater Quality Sur-
vey: Winter 1991/92. Report prepared for AgricultureCanada. Ottawa: Agriculture Canada.
Segerson, K. 1988. “Uncertainty and Incentives for NonpointPollution Control.” Journal of Environmental Economics
and Management 15:87–98.
Sullivan, J.B., M, Gonzales, G.R. ICrieger, and C.F. Runge.1991. “Health Related Hazards of Agriculture.” Staff pa-per P91- 13. Department of Agricultural Economics andApplied Economics, University of Minnesota.
Swinton, S.M., and D,S. Clark. 1994. ‘‘Fnrm-Level Evaluation
Costs of Reducing Groundwater-N Pollution 185
Canada: Agroecosystem Health Project, University ofGuelph.
Woods, C.W., and J.H. Edwards. 1992. ‘‘Agroecosystem Man-agement Effect on Carbon and Nitrogen.” Agriculture,
Ecosystems and Environment 39: 123–38,
Yiridoe, E.K. 1997. ‘‘Bio-Economics of Agricultural NonpointSource Pollution Control: Nitrates in Southwestern On-tario.” Ph.D. diss, Department of Agricultural Economicsand Business, University of Guelph, Canada.
Yiridoe, E.K., A, Weersink, R,C. Roy, and C.J. Swanton. 1993.“Economic Analysis of Alternative Cropping Systems fora Bean/Wheat Rotation on Light-Textured Soils.” Cana-dian Journal of Plant Service 73:405-15.
Yiridoe, E.K., R.P. Voroney, and A, Weersink. 1997. “Impactof Alternative Farm Management Practices on NitrogenPollution of Groundwater: Evaluation and Application ofCENTURY Model.” Journal of Environmental Quality
26(5):1255-63.
Appendix: MAC Curve with a Square RootWheat Production Functional Form
The maximization problem for wheat productionsystems with square-root yield response functionalforms is represented as:
(Al) ~$=R= (a+ bN+~N1’2)-~N
-t k [LR – (a + @N+ yN2)],
where a >0, b e O, and c >0 represent the regres-sion coefficients for the wheat production function;% ~, and y denote regression coefficients for thecorresponding groundwater-N leaching function.Solving the first-order conditions simultaneouslyfor h yields the MAC function:
[[
c– b+ l/2
1 1,l/2–~
(A2a) ; (P - (P2 + 4Y~R - 4rW’)”2)
A (w, LR) =
- ~ - 2y [+ (~ - (~z + 4yLR - 4~7)’’2)]
of Alternative Policy Approaches to Reduce Nitrate which can be reduced to:Leaching from Midwest Agriculture.” Agricultural and
Resource Economics Review 23:66-74.
TayIor, M.L., R.M. Adams, and S.F. Miller. 1992. ‘‘Farm-LeveI(A2b) h (w, LR) =
-[(b+’(+Response to Agricultural Effluent Control Strategies: The - (p+ 2yq)Case of the Willamette Valley.” Journal of Agricultural
and Resource Economics 17:173-85.where p, = (~z + 4yLR - 4rx~)05 and q = ~ (~ –
Weersink, A., C. Dutka, and M. Goss. 1996, {‘Crop Price and I.J,). Under varying MCLS (L ), the on-farm abate-
Risk Effects on Farmer Abatement Costs of Reducing Ni- ment cost per unit area, representing the area under
trate Levels in Groundwater Imposed by Environmental the MAC curve, can be estimated for each crop-Policy Instruments.” Discussion Paper no. 35. Guelph, ping system by integration.