Embed Size (px)
Citation preview

Out of sight and out of mind?
Are marginalised communities being overlooked in decision making?
Water and sanitation equity report, 2009 TAWASANET September 2009
Tanzania Water and Sanitation Network (TAWASANET)
TAWASANET PO Box 80099, Dar es Salaam, Tanzania [email protected] 0784-809542

TAWASANET - WaterAid Tanzania - Daraja - Shahidi wa Maji
The Tanzania Water and Sanitation Network (TAWASANET) is a recently formed network of Tanzanian civil society organisations working in the water and sanitation sector. The network works to increasing sharing between civil society organisations, promote partnerships between civil society and other sector stakeholders, build the capacity of civil society in the water and sanitation sector, and to strengthen the voice of civil society in national policy debates.
WaterAid is a leading international NGO which works to enable the world’s poorest people to gain access to safe water, sanitation and hygiene education. We work in Africa, Asia and the Pacific region and advocate globally with our partners to realise our vision of a world where everyone has access to these basic human rights.
Daraja is a recently formed organisation working in rural Tanzania, aiming to make local government more responsive to the community, with a particular focus on the water sector. We believe in bringing government closer to the people and are committed to making democratic local government work for the poor.
Shahidi wa Maji is a Tanzanian NGO dedicated to sustainability, equity and accountability in water resource and environment management. Shahidi was formed in 2008 by a group of concerned Tanzanian’s working in business, academia, media, NGOs and the water sector, with support from Water Witness International. Through targeted research, communication, technical advice, training and constructive collaboration we aim to support sustainable development, climate resilience and aid effectiveness.
This is Tanzania’s second annual report on equity in water and sanitation. TAWASANET has committed to prepare such a report on an annual basis. The report is prepared independently, though mandated by the 2008 Joint Water Sector Review. Cover photograph: Water supply in Godegode village, Mpwapwa, May 2009.
Acknowledgements This report was prepared as a collaborative effort between TAWASANET, Daraja, Shahidi wa Maji and WaterAid. The report was edited by Ben Taylor of Daraja and WaterAid Tanzania, who also contributed the chapters on equity in water supply and sanitation (chapter 2) and on obstacles to equity in local government planning (chapter 3). Meab Mdimi, Austin Harrison and Nick Hepworth of Shahidi wa Maji contributed the chapter on equity in water resource management (chapter 4). The authors would like to thank the following for their contributions to this process: Nyanzobe Malimi, Director of TWESA and Chairperson of TAWASANET; Mathias Mulagwanda of PEVODE and Vice Chairperson of TAWASANET; Jörg Henkel of IDYDC and Secretary of TAWASANET; representatives of other TAWASANET member organisations; Alejandro Jimenez and Daniel Mwita of ISF; Vivienne Abbott, Herbert Kashililah, Laura Hucks, Damas Debwa and Fidelis Paul at WaterAid Tanzania; and of course DFID and WaterAid for their financial support.

i
TAWASANET - WaterAid Tanzania - Daraja - Shahidi wa Maji
Out of sight and out of mind? Water and sanitation equity report 2009
Executive Summary This second annual Water Sector Equity Report aims to ensure that the profile of equity issues in the sector remains high. The overall objective of this report is to raise awareness of and promote debate on the equity orientation of the water and sanitation sector in Tanzania. This report replicates and extends key aspects of the 2008 report. The quantitative analysis of budgets, infrastructure and access is updated with new data (chapter 2). This includes 2009/10 budget data, enabling analysis of emerging trends in budget equity trends, and newly available household survey data from the 2007 Household Budget Survey is analysed, including data on household expenditure on water. School water supply, sanitation and hygiene is also included for the first time, using data from school mapping surveys. There are also two major new areas for this report. First a qualitative analysis of obstacles to equity in local government planning processes (chapter 3) explores the reasons behind inequitable targeting of new resources as uncovered in the 2008 report. And second, equity in water resource management (WRM) is considered (chapter 4), including budget equity as well as equity in access to water rights. Findings: Equity in Water Supply and Sanitation Budgets for urban and rural water supply continue on an equitable basis. However, the gap between access to clean and safe water in urban and rural areas remains wide. This can be seen in lower levels of citizens’ satisfaction with water supply services in rural areas. There is a worrying shift away from use of the LGCDG system and formula-based allocations to districts for rural water supply funding. This shift partly reverses the good progress made by introducing the formula sharing resources more fairly between districts since the launch of the WSDP. Greater use of the formula system would be a positive move towards greater budget equity. School sanitation is a challenge in both urban and rural areas, though in urban areas the challenge is more acute and more pressing. There are also wide variations in the number of school sanitation facilities between districts. Targeting of rural water supply investments by local government continues to be poor, with over half of new investments targeted at relatively well-served communities. However, some districts are targeting their resources more equitably, notably Kondoa and Singida Rural. The gap in access to water supply between richer and poorer households has widened considerably since the early 1990s, though has recently closed very slightly. The biggest difference is in access to piped domestic connections. Poorer households also spend a much greater proportion of their income on water. Gender representation in national level decision-making bodies is improving steadily, though from a low base. The proportion of women among utility staff has declined slightly, raising questions about whether utilities could create a more gender-friendly working environment. Overcoming Obstacles to Equity in Local Government Planning Processes Based on the analysis in section 3 of this report, the following recommendations can be proposed in order to overcome existing obstacles to equity in the local government planning process: • Water fund balances should not be used as a means of selecting communities. As an alternative,
communities should be identified primarily on the basis of need, followed by concerted efforts to

ii
TAWASANET - WaterAid Tanzania - Daraja - Shahidi wa Maji
Out of sight and out of mind? Water and sanitation equity report 2009
mobilise the necessary community contributions. This would ensure that demand and contributions are still given appropriate weight but without making it difficult for poorer and less well connected communities to access investment.
• Provide LGAs with specific guidance to prioritise under-served wards. This could come in several forms, including the following options (which could be used in combination):
i. Guidance that a certain percentage of investment funding should be targeted at wards in the bottom half of the district league table.
ii. A requirement for water departments to produce a report on all wards in the bottom half, explaining why they are underserved, and detailing a plan for helping these wards to access new infrastructure.
iii. A national target that all wards will have a minimum of 1 functioning improved waterpoint per 1000 people by 2015, including at least 1 waterpoint in each village.
• Make transparency a reality, including making a simple table of funded water projects publicly accessible across the district. This would have several benefits, including highlighting inequalities and encouraging more public scrutiny of plans and performance.
• Make information on funding mechanisms, criteria and application procedures easily accessible to ward and village leaders and community members in all communities, not just those that have been pre-selected for projects.
• Support access to information by putting a stronger focus on transparency in LGA audits and annual assessments, insisting on genuine public accessibility of specific reports and information as part of the minimum criteria for eligibility for funding.
• Make the bottom-up planning process more realistic, in order to provide an alternative means by which to assess demand at an early stage. This could be achieved by providing accurate indicative planning figures for village and ward planning and requesting that village plans should clearly specify top priority projects.
• Adopt a multi-year planning approach, whereby wards and villages are selected for projects over an extended time period. This would ensure that wards that do not benefit in the first year get priority in later years and that funds reach all parts of the district over several years.
• Target councillors in underserved wards with specific capacity building efforts. This could include capacity building in political arts such as lobbying. This option is more suited to NGOs with an interest in equitable planning than to government action.
• Develop a guidance manual for LGAs for working in difficult areas. A useful first step would be to study past successes and failures in difficult areas. Innovation-minded NGOs could also usefully explore possible new solutions.
Fulfilling the Potential of WRM This report finds that the poor struggle most to access adequate water resources. Poor communities are less aware of the water resource law and the obligations and protections it provides. Where they are aware, they are less able to access decision making processes and platforms within water governance. The poor also suffer most through water conflicts and water pollution. As demand for water increases and the climate becomes even more uncertain these imbalances threaten to further entrench inequality. Effective mechanisms for protecting and sustaining water resources and for resolving water use conflicts are therefore critical for the poor. Based on the analysis of this report, the following recommendations can be made towards fulfilling the potential of WRM institutions as the guardians of equity in the sector: • The process of applying for and processing water use permits is not well-understood, well communicated
or accessible, especially to the poor. The application process could be simplified. The basis of determining

iii
TAWASANET - WaterAid Tanzania - Daraja - Shahidi wa Maji
Out of sight and out of mind? Water and sanitation equity report 2009
water rights should be established and made clear to all. A transparent tracking system for water permit applications and an accessible register of rights would help greatly.
• In order for the water rights system to be seen as legitimate and to serve the needs of the poor, the BWOs need the resources to process applications, to follow up on illegal use and conflicts and disputes. Immediate priority should be focused on the rational and timely dispersal of funds to BWOs.
• An accessible system for reporting, tracking and resolving water conflicts, degradation and pollution problems would help ensure that effective solutions are found. Institutional roles and responsibilities in resolving water conflict, degradation and pollution need to be clearly defined and communicated. Waste water management and pollution control needs greater priority for implementation.
• Efforts should be made to accelerate the formation and registration of WUAs. Basin offices need sufficient resources to support WUA formation and importantly, to co-ordinate and set up relationships between WUAs across the basin.
• The tiered system for representing the small water users in BWBs poses a challenge to equity because it may take years to get the institutions in place. Is there a simpler way of ensuring the voices of small water users are heard? A phased plan should be developed to shift NWB and BWB composition towards that envisioned in the law so that the needs of all stakeholders (including the poor) are represented.
• Minutes and representation at BWB meetings should be publicly accessible information and will support accountability of BWBs in their important responsibilities.
• More transparency and better data are needed on the financial planning and disbursement process between the donors, MoWI and the BWO to allow robust analysis to support pro-equity, pro-poor WRM.
… kwa sababu sisi sote tupo mtoni TAWASANET and its members, including WaterAid, Daraja and Shahidi wa Maji as the co-authors of this report, are keen to work with the Ministry of Water and Irrigation, local government, the BWOs and the development partners to help put equity at the heart of the water sector in Tanzania. The WSDP promises great things for the country and has the potential to have a significant and positive impact. By working together, pooling our resources, energy, ideas and reach, we can ensure that this development is sustainable, accountable and equitable for all.

iv
TAWASANET - WaterAid Tanzania - Daraja - Shahidi wa Maji
Out of sight and out of mind? Water and sanitation equity report 2009
Table of Contents Executive Summary ............................................................................................................................. i
Findings: Equity in Water Supply and Sanitation ......................................................................................................i Overcoming Obstacles to Equity in Local Government Planning Processes.............................................................i Fulfilling the Potential of WRM................................................................................................................................ ii … kwa sababu sisi sote tupo mtoni ......................................................................................................................... iii
Table of Contents .............................................................................................................................. iv
List of boxes, tables and figures ...............................................................................................................................v Acronyms and abbreviations...................................................................................................................................vi
1. Introduction ................................................................................................................................... 1
1.1 Background and Objectives................................................................................................................................1 1.2 What’s New in the 2009 Report? .......................................................................................................................1 1.3 What is Equity in Water and Sanitation? A Brief Reminder...............................................................................2 1.4 Data Sources and Challenges .............................................................................................................................3
2. Equity in Water Supply and Sanitation ............................................................................................ 4 2.1 Urban-Rural Equity.............................................................................................................................................4 2.2 Inter-Town Equity...............................................................................................................................................6 2.3 Inter-District Equity ............................................................................................................................................6 2.4 Inter-Ward Equity...............................................................................................................................................8 2.5 Social Equity .....................................................................................................................................................10
3. Obstacles to Equity in Local Government Planning ........................................................................ 14 3.1 Background and Introduction ..........................................................................................................................14 3.2 Local Government Planning Processes in Practice...........................................................................................14 3.3 Analysis: Overcoming Obstacles to Equity .......................................................................................................16
4. Equity in Water Resource Management ........................................................................................ 18 4.1 Background to this New Section on WRM .......................................................................................................18 4.2 Equitable Access to Water Rights: Waiting for benefit? ..................................................................................18 4.3 Water Conflict and Resource Degradation: Who wins, who loses?.................................................................20 4.4 Water User Associations: Promising progress towards equitable WRM? .......................................................22 4.5 Equitable Representation in Basin Water Boards: Who’s at the table? ..........................................................22 4.6 Equitable & Efficient Financial Disbursement: Where is the money going and when?...................................24 4.7 Concluding Remarks.........................................................................................................................................25
5. Conclusions and Recommendations .............................................................................................. 26 5.1 Equity in Water Supply and Sanitation.............................................................................................................26 5.2 Overcoming Obstacles to Equity in Local Government Planning Processes....................................................26 5.3 Fulfilling the Potential of WRM ........................................................................................................................27

v
TAWASANET - WaterAid Tanzania - Daraja - Shahidi wa Maji
Out of sight and out of mind? Water and sanitation equity report 2009
List of boxes, tables and figures Figure 1.1 – Turning money into water: equity fault lines at each stage 2 Figure 2.1 – Budget equity for urban and rural water supply and sanitation 4 Figure 2.2 – Urban and rural outcome equity in water supply and sanitation 4 Figure 2.3 - Public opinion in the water sector 5 Figure 2.4 – Urban-rural equity in school latrines 5 Figure 2.5 - Urban water supply output equity 6 Figure 2.6 – Comparing pupil-latrine ratios between district 7 Figure 2.7 – Pupil-latrine ratios in selected districts 7 Figure 2.8 – Targeting new investments in three districts 8 Figure 2.9 – Rating councils for pro-poor targeting of new investments in rural water supply 9 Figure 2.10 – Widening disparities in access to water supply by wealth 10 Figure 2.11 – Access to different types of water and sanitation services, by wealth grouping 10 Figure 2.12 – The poor pay more: expenditure on water 11 Figure 2.13 – Gender equity in school sanitation 11 Figure 2.14 – Gender representation in key decision-making bodies 12 Figure 2.15 – Gender balance in utilities 13 Figure 4.1 – Who’s at the table? Actual Basin Water Board composition against statutory requirement 23 Figure 4.2 – When is the money arriving? Actual cumulative disbursements to BWOs, 2008/09 25 Table 2.1 – School latrine numbers and shortages 13 Box 3.1 – “Tumeshinda”: Winning and losing in Mwakashanhala and Itobo wards, Nzega district 15 Box 4.1 – Water rights: hard to obtain and for what benefit? 19 Box 4.2 – Pollution on our doorstep – but who suffers? 21 Box 4.3 – Water User Associations: Promoting equity and better WRM in Kilimanjaro region 22

vi
TAWASANET - WaterAid Tanzania - Daraja - Shahidi wa Maji
Out of sight and out of mind? Water and sanitation equity report 2009
Acronyms and abbreviations
AGM Annual General Meeting BEST Basic Education Statistics for Tanzania BWB Basin Water Board BWO Basin Water Office CBO Community Based Organisation CWC Catchment Water Committee DAWASCO Dar es Salaam Water and Sewerage Corporation DHS Demographic and Health Survey DMDD Diocese of Mbulu Development Department DPG Development Partner Group EWURA Energy and Water Regulatory Authority HBS Household Budget Survey HIV/AIDS Human Immunodeficiency Virus / Acquired Immune Deficiency Syndrome JWSR Joint Water Sector Review LGA Local Government Authority LGCDG Local Government Capital Development Grant MoEVT Ministry of Education and Vocational Training MoWI Ministry of Water and Irrigation MP Member of Parliament NBS National Bureau of Statistics NEMC National Environment Management Council NGO Non-Governmental Organisation NWB National Water Board RWSS Rural Water Supply and Sanitation SNV Dutch Development Agency SWASH School Water, Sanitation and Hygiene TAWASANET Tanzania Water and Sanitation Network UNICEF United Nations Children’s Fund UWSA Urban Water and Sewerage Authority UWSS Urban Water Supply and Sanitation WASH Water, Sanitation and Hygiene WEO Ward Executive Officer WPM Waterpoint Mapping WRM Water Resource Management WRMA Water Resource Management Act WSDP Water Sector Development Programme WSWG Water Sector Working Group WUA Water User Association
TAWASANET - WaterAid Tanzania - Daraja - Shahidi wa Maji
1 Out of sight and out of mind? Water and sanitation equity report 2009
1. Introduction 1.1 Background and Objectives The water and sanitation sector in Tanzania has been evolving rapidly in the past few years. A sector-wide approach has been adopted, funding increased dramatically and new legislation passed. In the past year alone there has been a great deal of activity to improve national level planning, budgeting and procurement, on institutional strengthening and improving performance monitoring systems. With so much attention being given to these reform processes and on adjusting to new roles and responsibilities, there is a danger that important issues in the sector will be sidelined. Sustainability, accountability and equity are three such issues in danger of being overlooked. This report aims to ensure that the profile of equity issues in the sector remains high. It is the second annual sector equity report to be prepared by TAWASANET, following the first, highly-successful report1 launched at the 2008 Joint Water Sector Review (JWSR). That report had been requested by the 2007 JWSR, a request that was extended to an annual mandate for TAWASANET at the 2008 review. The overall objective of this report is to raise awareness of and promote debate on the equity orientation of the water and sanitation sector in Tanzania. The specific objectives are as follows: • To report on geographical and social equity in sector inputs, processes, outputs and outcomes • To present additional qualitative equity analysis beyond reporting on specific indicators • To propose specific measures to improve the equity orientation of the sector.
The report presents data in both user friendly formats to encourage general debate as well as more technical formats for use by specialists, and works with existing agreed indicators and definitions as much as possible. 1.2 What’s New in the 2009 Report? This report replicates and extends key aspects of the 2008 report. The quantitative analysis of budgets, infrastructure and access is updated with new data (chapter 2). This includes 2009/10 budget data, enabling analysis of emerging trends in budget equity trends, and newly available household survey data from the 2007 Household Budget Survey is analysed, including data on household expenditure on water. School water supply, sanitation and hygiene is also included for the first time, using data from school mapping surveys. There are also two major new areas for this report. First a qualitative analysis of obstacles to equity in local government planning processes (chapter 3) explores the reasons behind inequitable targeting of new resources as uncovered in the 2008 report. And second, equity in water resource management (WRM) is considered (chapter 4), including budget equity as well as equity in access to water rights.
1 Water: more for some or some for more? TAWASANET, 2008.

TAWASANET - WaterAid Tanzania - Daraja - Shahidi wa Maji
2 Out of sight and out of mind? Water and sanitation equity report 2009
1.3 What is Equity in Water and Sanitation? A Brief Reminder Defining equity Before going into the analysis, it is worth reminding ourselves of the concept of equity and its relevance in the water sector2. Equity is essentially a simple concept. It relates closely to the idea of fairness, and the idea that all members of a society have equal rights. A particular aspect of the sector can be described as being equitable if it affects all sections of society equally. For example, perfect equity in budgets would be a situation where every citizen is allocated an equal amount for investment, whichever part of the country they live in. Similarly, equal levels of access to clean and safe water would be an equitable outcome. On the other hand, a situation where some part of society has a lower level of access to sanitation services would be inequitable. Equity fault lines Society can be divided into different groups in a wide variety of ways, such as by geography, by social or health status, by gender, by ethnicity, etc. These divisions can be described as equity fault lines where one group is affected differently from others. In the water and sanitation sector, two types of equity fault lines are important. The first is geographical, where groups can be defined by where they live. The rural and urban divide is an important part of this, as is the division of the country into districts, towns, wards, etc. The second is social, where groups are defined on the basis of some aspect of their identity that cuts across geographical boundaries. Where a given group is particularly vulnerable, this is of interest to any measures of equity. Women, people living with HIV/AIDS, the elderly, the disabled, orphans and widows are all obviously examples. The poor form a group that is perhaps less obvious but also very important. These fault lines are important at different stages in the process of turning money into water (or into safe disposal of faeces, sustainable management of water resources, etc.) Figure 1.1 lists key fault lines at each stage.
Figure 1.1 – Turning money into water: equity fault lines at each stage What equity monitoring cannot tell us The concept of equity has some inherent difficulties that should be borne in mind when preparing and reading a sector equity strategy and report. This includes the following: 2 This section is a brief summary of a longer introduction to the concept of equity that was included in the 2008 equity report. Readers are encouraged to refer back to that report for more detail.
How equitable are budget allocations? – geographical equity
Who is represented in key decision making bodies? – social equity
Do some groups have less access to services? – geographical and social equity
Important but too complex to include in the scope of this report
How equitably distributed is the infrastructure? – geographical equity
Impact
Inputs
Processes
Outputs
Outcomes
TAWASANET - WaterAid Tanzania - Daraja - Shahidi wa Maji
3 Out of sight and out of mind? Water and sanitation equity report 2009
• Equity in inputs does not connect automatically to equitable outputs or outcomes. The cost of outputs
varies according to a number of factors, such as hydro-geology, population density, etc, and therefore spending the same amount per person in two places does not necessarily produce the same results.
• Equity considerations are important but must also be balanced against other factors, such as the need for investments that will promote economic growth.
• Looking at equity is not the same as looking at overall performance. For example, it is very possible for a district to have a large number of waterpoints that are unevenly distributed or to have low coverage spread evenly.
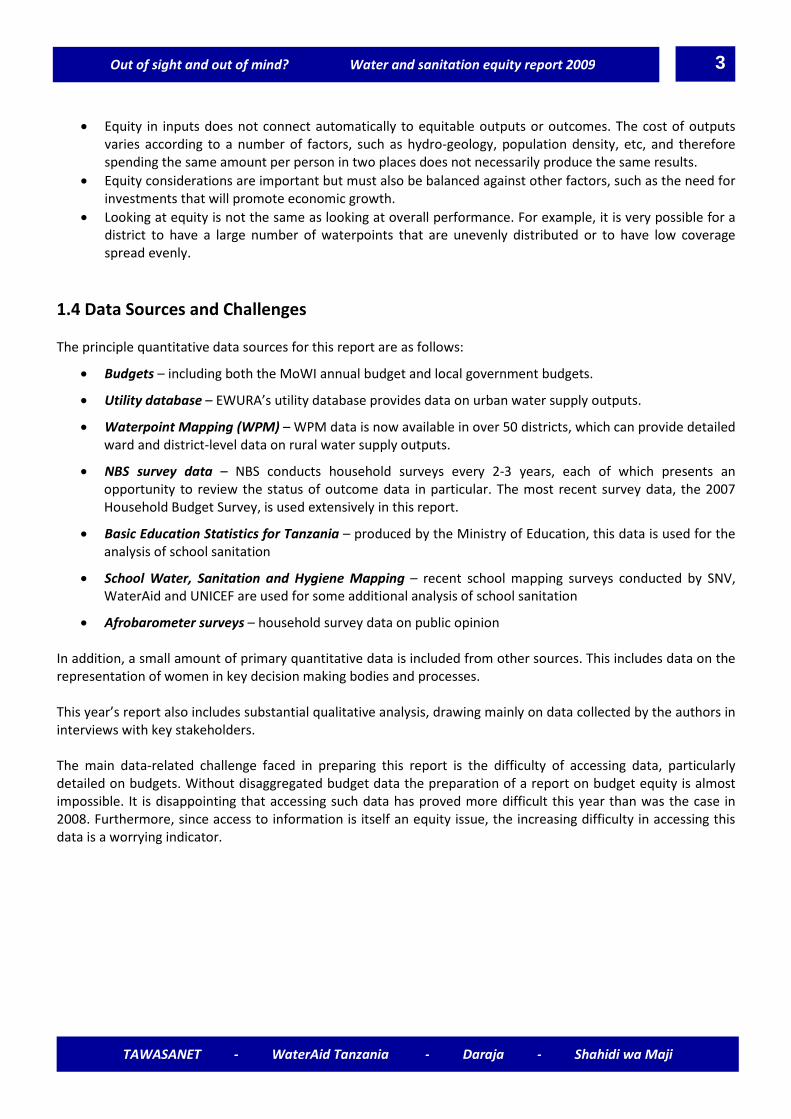
1.4 Data Sources and Challenges The principle quantitative data sources for this report are as follows: • Budgets – including both the MoWI annual budget and local government budgets. • Utility database – EWURA’s utility database provides data on urban water supply outputs. • Waterpoint Mapping (WPM) – WPM data is now available in over 50 districts, which can provide detailed
ward and district-level data on rural water supply outputs. • NBS survey data – NBS conducts household surveys every 2-3 years, each of which presents an
opportunity to review the status of outcome data in particular. The most recent survey data, the 2007 Household Budget Survey, is used extensively in this report.
• Basic Education Statistics for Tanzania – produced by the Ministry of Education, this data is used for the analysis of school sanitation
• School Water, Sanitation and Hygiene Mapping – recent school mapping surveys conducted by SNV, WaterAid and UNICEF are used for some additional analysis of school sanitation
• Afrobarometer surveys – household survey data on public opinion In addition, a small amount of primary quantitative data is included from other sources. This includes data on the representation of women in key decision making bodies and processes. This year’s report also includes substantial qualitative analysis, drawing mainly on data collected by the authors in interviews with key stakeholders. The main data-related challenge faced in preparing this report is the difficulty of accessing data, particularly detailed on budgets. Without disaggregated budget data the preparation of a report on budget equity is almost impossible. It is disappointing that accessing such data has proved more difficult this year than was the case in 2008. Furthermore, since access to information is itself an equity issue, the increasing difficulty in accessing this data is a worrying indicator.

TAWASANET - WaterAid Tanzania - Daraja - Shahidi wa Maji
4 Out of sight and out of mind? Water and sanitation equity report 2009
2. Equity in Water Supply and Sanitation Ben Taylor, Daraja and WaterAid Tanzania 2.1 Urban-Rural Equity Urban-rural budget equity Figure 2.1 shows budget trends for urban and rural water supply and sanitation since 2005/06. There is clearly a significant improvement in budget equity over this time: in 2005/06 over 80% of the water sector development budget was allocated to urban areas and less than 20% to rural, whereas since 2007/08 the two sub-sectors have received approximately equal budget allocations.
Figure 2.1 – Budget equity for urban and rural water supply and sanitation
Proportion of water sector development budget, urban and rural, 2005-10
0.0%10.0%20.0%30.0%
40.0%50.0%
60.0%70.0%
80.0%90.0%
2005/06 2006/07 2007/08 2008/09 2009/10
UWSS
RWSS
Water sector development budget, urban and rural, 2005-10
-
20,000
40,000
60,000
80,000
100,000
120,000
140,000
160,000
2005/06 2006/07 2007/08 2008/09 2009/10
UWSS
RWSS
Urban-rural outcome equity: access to water and sanitation services The most recently available household survey data comes from the 2007 Household Budget Survey – see figure 2.2. The data shows no major new developments. In the case of water supply, access to clean and safe water in urban areas continues to be much lower in rural areas than in urban – urban citizens are twice as likely to have access to clean and safe water than their rural counterparts. In the case of sanitation (basic latrines), the urban-rural difference is less marked, although the poor quality of the data on sanitation makes it hard to draw strong conclusions on this.
Figure 2.2 – Urban and rural outcome equity in water supply and sanitation
Urban and rural access to clean and safe water
85.3 78.6 79.5
42 45.3 40.5
0
20
40
60
80
100
2002 2004-5 2007
%
UrbanRural
Urban and rural access to basic latrines
98.5 97.6 97.688.9 83.3 90.4
0
20
40
60
80
100
2002 2004-5 2007
%
UrbanRural
z
The disparity in access to clean and safe water between urban and rural areas is echoed in a recent public opinion survey – the latest Afrobarometer survey (2008), see figure 2.3. Urban Tanzanians expressed greater satisfaction
Source: Household surveys (2002 Census, 2004/5 Demographic and Health Survey, 2007 Household Budget Survey

TAWASANET - WaterAid Tanzania - Daraja - Shahidi wa Maji
5 Out of sight and out of mind? Water and sanitation equity report 2009
with government efforts to deliver urban water and sanitation services than rural Tanzanians (51% of urban residents were “satisfied”, compared to 39% in rural areas). This survey also found that rural Tanzanians ranked the water sector as a higher priority for government action than urban Tanzanians. 44% of rural respondents cited water supply among the top 3 priority issues for government action (more than any other sector), compared to 25% in urban areas, where water supply came third behind the economy and health concerns. Urban-rural output equity: school latrines Fundamental differences between how services are delivered in urban and rural areas make it difficult to compare outputs – how can you compare the number of household connections to the number of public waterpoints, for example? However, school latrines are one area where such a comparison can meaningfully be made – see figure 2.4. In this case, the overall ratio of pupils per latrine (drop hole) is compared between urban and rural councils. The data suggests that school sanitation is a greater challenge in urban areas than rural – there are over 75 pupils per drop hole in urban councils compared to less than 60 pupils per drop hole in rural councils. The greater pressure on space in urban areas is likely to be part of the reason for this difference. The same factor also makes it more important for urban schools to have an adequate number of latrines – greater population density increases the risk of disease transmission. A second likely contributory factor is the greater average size of urban schools.
Urban and rural citizens priorisation and satisfaction of public action on water supply
urban 51%
urban 25%
rural 39%
rural 44%
0% 10% 20% 30% 40% 50% 60%
% citizens expressing satisfaction w ithgovernment efforts to deliver w ater and
sanitation services
% citizens citing w ater supply among top 3issues for government to address
Figure 2.3 - Public opinion in the water sector
Source: Afrobarometer survey, 2008
Source: Basic Education Statistics for Tanzania (BEST) data from MoEVT (2008)
Figure 2.4 – urban-rural equity in school latrines School-pupils per latrine (drop hole) in urban
and rural councils
61.1
22.5
75.8
59.3
0 20 40 60 80 100
average
urban
rural
target
pupils per latrine

TAWASANET - WaterAid Tanzania - Daraja - Shahidi wa Maji
6 Out of sight and out of mind? Water and sanitation equity report 2009
2.2 Inter-Town Equity It has proved impossible to access sufficiently disaggregated data on public investment in different urban centres in the 2009/10 budget, and therefore this section will focus only on output equity. Inter-town output equity: household water connections and public kiosks The three charts in figure 2.5 present data on urban water supply outputs: utility water connections and public water kiosks, showing data for 2005/06 and 2007/08. The first chart presents the actual number of water connections, while the second looks at the average number of households per connection. Moshi, Iringa, Morogoro, Arusha and Mbeya have less than 2.5 households for every connection, whereas Singida, Songea, Mwanza and Sumbawanga all have over four times as many households as water supply connections. The accessibility of public water kiosks is an important equity consideration, since kiosks are an ideal way of targeting the poor – see third chart. According to the available data on the number of public water kiosks, Tanga, Shinyanga, Moshi, Mbeya and Morogoro are providing a more widespread water kiosk service, though only Tanga has a very large number of kiosks. 2.3 Inter-District Equity Inter-district budget equity As with budget equity between towns, it has proved impossible to access disaggregated data on budget allocations to each district council for rural water supply. However, this does not prevent us from drawing some conclusions on the adoption and use of the Local Government Capital Development Grant (LGCDG) system and formula-based allocations. In particular, the formula-based allocation system was developed as a mechanism for ensuring that each LGA is allocated a fair amount for rural water supply investments. The formula takes population, poverty, existing access
Figure 2.5 - Urban water supply output equity
Number of water supply connections, by town
-
5,000
10,000
15,000
20,000
25,000
30,000
Aru
sha
Ba
bati
Bu
kob
a
Dod
om
a
Irin
ga
Kig
om
a
Lin
di
Mb
eya
Mor
og
oro
Mos
hi
Mtw
ara
Mu
som
a
Mw
an
za
Sh
inya
nga
Sin
gid
a
So
ng
ea
Su
mb
awan
ga
Tab
ora
Ta
nga
nu
mb
er o
f co
nn
ecti
on
s
2005/06
2007/08
Average number of households per connection, by town
-1.02.03.04.05.06.07.08.0
Aru
sha
Ba
bat
i
Bu
kob
a
Dod
om
a
Irin
ga
Kig
om
a
Lin
di
Mb
eya
Mor
og
oro
Mos
hi
Mtw
ara
Mu
som
a
Mw
an
za
Sh
inya
nga
Sin
gid
a
So
ng
ea
Su
mb
awan
ga
Tab
ora
Ta
ng
aho
use
ho
lds
per
co
nn
ecti
on
2005/06
2007/08
c
Number of operational public water kiosks, by town
0
50
100
150
200
250
300
Aru
sha
Ba
bati
Bu
kob
a
Dod
om
a
Irin
ga
Kig
om
a
Lin
di
Mb
eya
Mor
og
oro
Mos
hi
Mtw
ara
Mu
som
a
Mw
an
za
Sh
inya
nga
Sin
gid
a
So
ng
ea
Su
mb
awan
ga
Tab
ora
Ta
nga
nu
mb
er o
f ki
osk
s
2005/06
2007/08
Source: Annual Report for Urban Water and Sewerage Authorities Financial Year 2007/08

TAWASANET - WaterAid Tanzania - Daraja - Shahidi wa Maji
7 Out of sight and out of mind? Water and sanitation equity report 2009
and hydro-geological factors into account. The 2008 Equity Report found that the adoption of the LGCDG system and the allocation formula had brought about a major improvement in budget equity for rural water supply. The intention was that all rural water supply investment funding should be allocated in this way, ensuring that districts all receive fair allocations. However, the limited budget data available on rural water supply investment funds suggests a relatively low proportion of rural water supply development funding is actually flowing through the LGCDG system. The total rural water supply development budget for 2009/10 is Tshs 124bn/-, of which only just over half (Tshs 65bn/-) is allocated to LGAs through the LGCDG system using the equitable formula. The remaining Tshs 59bn/- includes a large number of projects funded centrally, including both donor-funded projects and projects funded by the government’s own revenues. This worrying development is a step backwards for equitable budgeting in the sector. Inter-district equity in school sanitation Figures 2.6 and 2.7 compare pupil-latrine ratios between districts, first for all districts nationwide using Ministry of Education and Vocation Training data, and second for a selection of districts for which more detailed surveys have been conducted by SNV, WaterAid and UNICEF. In both cases, there is a wide variation in pupil latrine ratios between districts. In nine districts (Lindi, Bariadi, Temeke, Kinondoni, Muleba, Ilemela, Meatu, Kigoma Urban, and Bukombe), there are over 100 pupils for every latrine, while several others (notably Tanga Urban, Nkasi, Hai, Kisarawe, Hanang and Mafia) have much lower ratios of around 30 pupils per latrine. This is not far from the Ministry of Education and Vocation Training’s “minimum standard” of 20 girls per latrine and 25 boys per latrine.
Pupils per Latrine, by District All pupils, 2008
0 50 100 150 200 250
dis
tric
ts
pupils per latrine
Source: Basic Education Statistics for Tanzania (BEST) data from MoEVT (2008)
target
Figure 2.6 – Comparing pupil-latrine ratios between district
Pupil-latrine ratios in 8 districts
27 31
49
71 73 7787
105
68
22.5
0
20
40
60
80
100
120
targ
et Hai
Sih
a
Bag
amoy
o
Nga
ra
Mas
wa
Mag
u
Kah
ama
Tem
eke
aver
age
pu
pils
per
latr
ine
Source: School WASH Mapping (SNV-WaterAid-UNICEF) surveys in 8 districts
Figure 2.7 – Pupil-latrine ratios in selected districts
TAWASANET - WaterAid Tanzania - Daraja - Shahidi wa Maji
8 Out of sight and out of mind? Water and sanitation equity report 2009
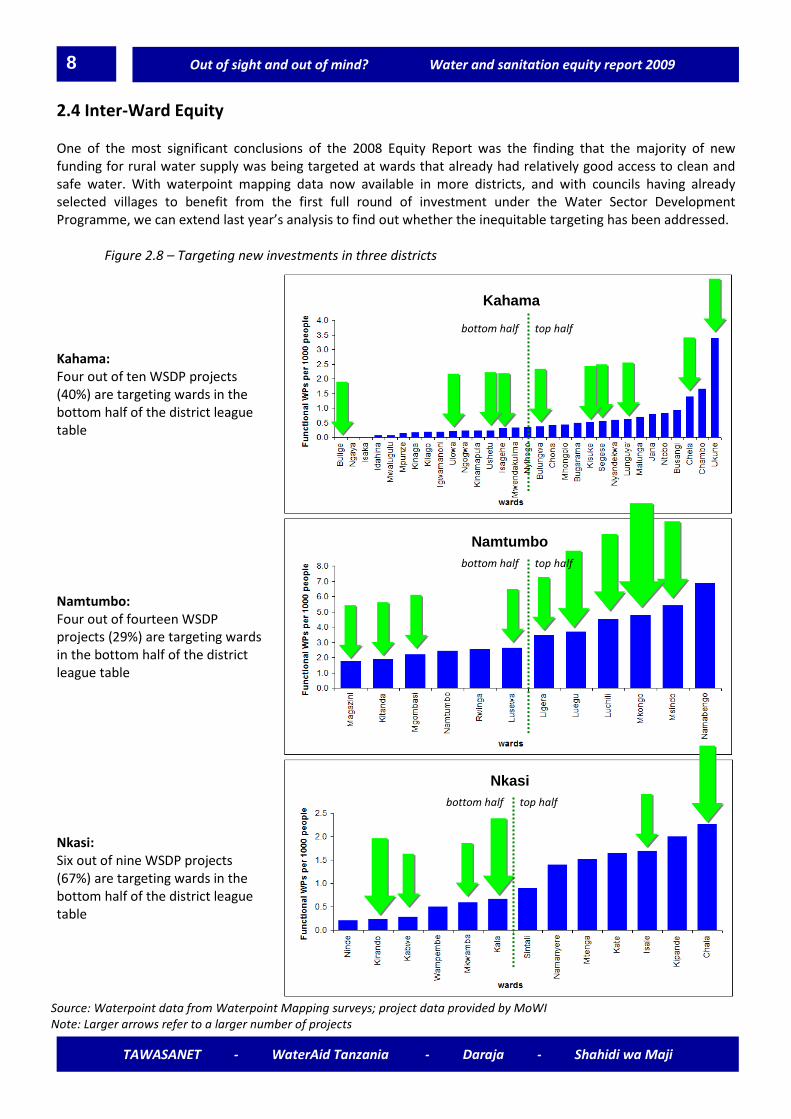
2.4 Inter-Ward Equity One of the most significant conclusions of the 2008 Equity Report was the finding that the majority of new funding for rural water supply was being targeted at wards that already had relatively good access to clean and safe water. With waterpoint mapping data now available in more districts, and with councils having already selected villages to benefit from the first full round of investment under the Water Sector Development Programme, we can extend last year’s analysis to find out whether the inequitable targeting has been addressed.
Figure 2.8 – Targeting new investments in three districts
Kahama: Four out of ten WSDP projects (40%) are targeting wards in the bottom half of the district league table
Namtumbo: Four out of fourteen WSDP projects (29%) are targeting wards in the bottom half of the district league table
Nkasi: Six out of nine WSDP projects (67%) are targeting wards in the bottom half of the district league table
Kahama
Nkasi
Namtumbo
bottom half top half
bottom half top half
bottom half top half
Source: Waterpoint data from Waterpoint Mapping surveys; project data provided by MoWI Note: Larger arrows refer to a larger number of projects

TAWASANET - WaterAid Tanzania - Daraja - Shahidi wa Maji
9 Out of sight and out of mind? Water and sanitation equity report 2009
Figure 2.8 on the previous page shows that the targeting of resources at the relatively well-served continues in some cases. Nkasi is an exception: two thirds of their selected projects are in wards with low existing levels of water supply infrastructure, compared to 40% of projects in Kahama and only 29% in Namtumbo. But even in Nkasi, the ward with the highest existing level of services is due to benefit from two new projects. The ward with the highest existing access in Kahama is also due to benefit further. Figure 2.9 groups all the councils for which sufficient data is available into categories according to how equitably they have targeted new resources. Kondoa and Singida Rural score highly, with over two thirds of their selected projects being targeted at under-served wards. Uyui, Muheza, Mpwapwa, Namtumbo and Nzega all score poorly, with no more than a third of new projects aimed at the least served. Targeting resources at the least-served clearly remains a major challenge. The reasons behind this challenge and ideas for how it can potentially be overcome are discussed in section 3 of this report.
Figure 2.9 – Rating councils for pro-poor targeting of new investments in rural water supply
Districts targeting 33% or less of new projects at wards in the
bottom half of the district league table
Districts targeting over 33% but no more than 50%s of new
projects at wards in the bottom half of the district league table
Districts targeting between 50% and 67% of new projects at wards in the bottom half of the district
league table
Districts targeting over 67% of new projects at wards in the bottom half of the district league table
% of new projects targeted at wards in the bottom half of the district league table
Source: Waterpoint data from Waterpoint Mapping surveys; project data provided by MoWI

TAWASANET - WaterAid Tanzania - Daraja - Shahidi wa Maji
10 Out of sight and out of mind? Water and sanitation equity report 2009
2.5 Social Equity Social equity in water supply outcomes: access to water supply by wealth The latest Household Budget Survey (2007) provides an opportunity to monitor trends in access to clean and safe water by wealth grouping – see figure 2.10. The figure shows that in 1991/2, there were only relatively small differences in access to clean and safe water between the poorest households and the wealthiest, but that these differences have widened significantly. The difference has narrowed slightly in the most recent survey compared to 6 years previously, but wealth remains a strong factor in determining access to clean and safe water. It is unlikely that economic constraints make it impossible for the poor to afford the cost of clean and safe water (though that may be the case for some poor households). Indeed, as will be shown below, the poor currently pay more for water than wealthier households. More likely is that the poor face a range of obstacles in the way of accessing clean and safe water, including network access. Figure 2.11 below shows how the difference between access to clean and safe water for poorer and wealthier households is greatest in the case of piped supplies to households. A more fundamental problem is a governance issue: are the needs and views of the poor prioritised in decision making. Without this, it is likely that the gap in access to clean and safe water supply will continue to widen. Section 3 of this report looks at how different criteria are taken into account in decision making around new investments in rural water supply, suggesting that the poor continue to be sidelined.
Figure 2.11 – Access to different types of water and sanitation services, by wealth grouping
Source: Public Expenditure Review of the Water Sector, 2009, using data from Household Budget Surveys
Figure 2.10 –Widening disparities in access to water supply by wealth
Source: Public Expenditure Review of the Water Sector, 2009, using data from Household Budget Surveys
Trends in access to water supply by wealth
30
35
40
45
50
55
60
65
70
75
80
1991/2 2000/1 2007
% h
hs w
ith a
cces
s to
impr
oved
wat
er s
uppl
y
Q5 - least poor
Q4
Q3
Q2
Q1 - poorest

TAWASANET - WaterAid Tanzania - Daraja - Shahidi wa Maji
11 Out of sight and out of mind? Water and sanitation equity report 2009
Social equity in water supply outcomes: expenditure on water by income group Figure 2.12 presents data from the 2007 Household Budget Survey on households’ expenditure on water. It finds that the poorest households use a much greater proportion of their income on water – around 4.5% compared to just over 1% for the wealthiest households. Wealthier households spend a greater actual amount on water. This is likely to be in part due to lower consumption of water in poorer households and in part due to poorer households collecting water from unprotected sources where no payment for water is needed, though of course the use of such sources carries considerable health risks. Gender equity in school sanitation Most data on outcomes and outputs in the water sector is gender-blind – services may affect men and women differently but the data doesn’t tell us how. An exception to this rule is school sanitation facilities, where specific facilities for girls and boys can be counted separately. This is an important exception since school sanitation is particularly critical for girls. It is widely recognised that girls often miss school days or drop out of school altogether when sanitation facilities are inadequate for dealing with menstrual hygiene. Partly for this reason, the Ministry of Education and Vocation Training’s “minimum standards” for school sanitation require more latrines for girls than boys – 20 girls per latrine and 25 boys per latrine. Figure 2.13 and table 2.1 look at two sources of data on the number of school latrines available for girls and boys – data for eight districts from SNV, WaterAid and UNICEF School WASH Mapping surveys and official nationwide data from the Ministry of Education. Both sources provide similar conclusions: there is a major shortfall for both girls’ and boys’ latrines, but that this shortfall is greater for girls than for boys.
Table 2.1 – School latrine numbers and shortages
actual # DHs pupils per DH required # DHs shortage Girls 6,401 64 20,551 14,150 SWASH
(8 LGAs) Boys 5,849 71 16,698 10,849 Girls 67,985 58 196,501 128,516 BEST
(nationwide) Boys 66,407 64 171,146 104,739 Sources: School Mapping surveys by SNV, WaterAid and UNICEF; Basic Education Statistics for Tanzania (BEST) from MoEVT
Source: Poverty and Human Development Report 2009, using data from Household Budget Surveys
Figure 2.12 – The poor pay more: expenditure on water Expenditure on Water by Income Group, 2007
0500
1,0001,5002,0002,500
3,0003,5004,000
4,5005,000
Q1 – poorest Q2 Q3 Q4 Q5 – wealthiest
Tsh
0.0%0.5%
1.0%1.5%2.0%2.5%
3.0%3.5%4.0%
4.5%5.0%
Mean Expenditure Proportion of Total Household Expenditure
Figure 2.13 - Gender equity in school sanitation
Sources: School WASH (SWASH) Mapping surveys by SNV, WaterAid and UNICEF; Basic Education Statistics for Tanzania (BEST) data from MoEVT (2008)
Number and shortage of latrines (drop holes) for girls and boys in schools
6,401 5,849 67,985 66,407
14,150 10,849 128,516 104,739
0%
20%
40%
60%
80%
100%
Girl
s
Boy
s
Girl
s
Boy
s
SWASH: 8 LGAs BEST: national
shortage
drop holes

TAWASANET - WaterAid Tanzania - Daraja - Shahidi wa Maji
12 Out of sight and out of mind? Water and sanitation equity report 2009
Sources: Minutes of meetings; www.maji.go.tz; DPG-Secretariat
Figure 2.14 - Gender representation in key decision-making bodies
Gender representation in decision making – national level Figure 2.14 presents data on the proportion of women and men among key decision making groups. The first chart looks at Joint Water Sector Review (JWSR) participants, showing a slow positive trend from a low start: only 17% of JWSR participants in 2006 were female, rising to 21%% in 2007 and 24% in 2008. A similarly positive trend can be seen in participants of Water Sector Working Group (WSWG) meetings. The proportion of women among the participants has risen steadily from 15% in November 2006 to 22% at the most recent WSWG meeting in September 2009. Finally, the three main stakeholder groups involved in national-level policy debates are all showing improvements in gender representation. 32% of TAWASANET’s AGM participants were female in 2009, compared to 24% in 2008, and the Development Partner Group (DPG) now has over one third female members. The senior management of the Ministry of Water and Irrigation has also made good progress on gender balance, rising from only 7% of the senior management being female in 2008 to 20% in 2009.
TAWASANET - WaterAid Tanzania - Daraja - Shahidi wa Maji
13 Out of sight and out of mind? Water and sanitation equity report 2009
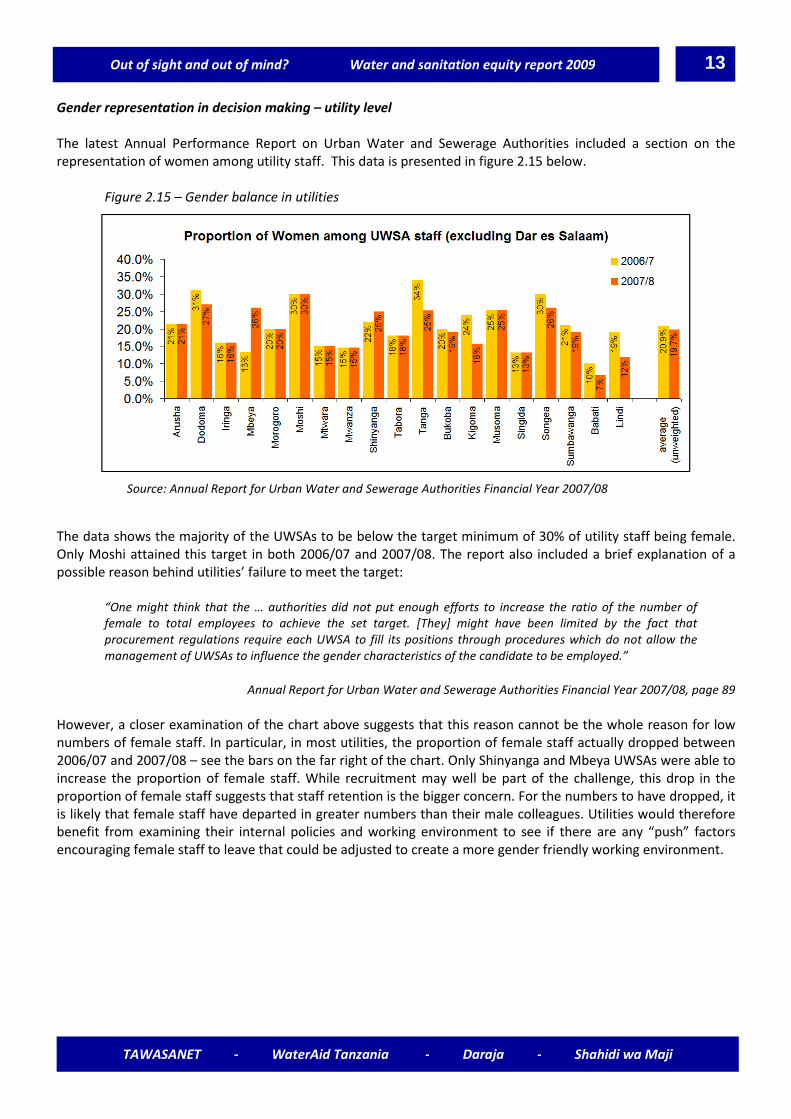
Gender representation in decision making – utility level The latest Annual Performance Report on Urban Water and Sewerage Authorities included a section on the representation of women among utility staff. This data is presented in figure 2.15 below.
Figure 2.15 – Gender balance in utilities The data shows the majority of the UWSAs to be below the target minimum of 30% of utility staff being female. Only Moshi attained this target in both 2006/07 and 2007/08. The report also included a brief explanation of a possible reason behind utilities’ failure to meet the target:
“One might think that the … authorities did not put enough efforts to increase the ratio of the number of female to total employees to achieve the set target. [They] might have been limited by the fact that procurement regulations require each UWSA to fill its positions through procedures which do not allow the management of UWSAs to influence the gender characteristics of the candidate to be employed.”
Annual Report for Urban Water and Sewerage Authorities Financial Year 2007/08, page 89
However, a closer examination of the chart above suggests that this reason cannot be the whole reason for low numbers of female staff. In particular, in most utilities, the proportion of female staff actually dropped between 2006/07 and 2007/08 – see the bars on the far right of the chart. Only Shinyanga and Mbeya UWSAs were able to increase the proportion of female staff. While recruitment may well be part of the challenge, this drop in the proportion of female staff suggests that staff retention is the bigger concern. For the numbers to have dropped, it is likely that female staff have departed in greater numbers than their male colleagues. Utilities would therefore benefit from examining their internal policies and working environment to see if there are any “push” factors encouraging female staff to leave that could be adjusted to create a more gender friendly working environment.
Source: Annual Report for Urban Water and Sewerage Authorities Financial Year 2007/08

TAWASANET - WaterAid Tanzania - Daraja - Shahidi wa Maji
14 Out of sight and out of mind? Water and sanitation equity report 2009
3. Obstacles to Equity in Local Government Planning Ben Taylor, Daraja and WaterAid Tanzania 3.1 Background and Introduction The 2008 sector equity report found that new investments in rural water supply appear to be targeted not at areas with low levels of access to improved waterpoints, but rather at areas with relatively high levels of existing access. In response, the JWSR requested TAWASANET to explore obstacles to equity in local government planning in more detail. This chapter fulfils this request. The basis of this chapter is a longer study on the use of waterpoint mapping at district level in practice and at obstacles to equity in the local government planning process3, conducted in Mpwapwa, Kongwa, Iramba and Nzega by WaterAid with ISF. This looked at the practice of local government planning, including the criteria used to allocate water supply investment funds, how equity fits within these criteria and the roles of different actors. Key stakeholders at district level were interviewed about the planning process in practice and data was collected from water departments on recent rural water supply development projects. In Mpwapwa and Nzega, meetings were also held with key stakeholders in two wards. These were chosen to include one ward with historically low investment in water supply and one with historically high investment, for comparative analysis. 3.2 Local Government Planning Processes in Practice Stated decision making criteria The findings in all districts suggested that the top priority in selecting communities for water projects was to ensure that projects were equally divided between the constituencies of the district’s MPs. This relatively simple-to-apply requirement was stated in all four districts. Demonstrated demand was widely stated to be a key decision making factor. LGA officials cannot easily identify real priorities from village and ward plans since the bottom-up planning process is not working effectively and produces plans with large numbers of projects that are effectively wish-lists. Instead, demand is demonstrated by having a village water fund with a healthy balance. This was said to be important for ownership, willingness to pay and sustainability. It was also seen as a simple and objective measure, easily explained to councillors and villagers. All four district water departments stated that they also considered need, either using waterpoint mapping data or health statistics. However, an examination of recent projects suggests that need was not given very high priority in practice. Less than half of the government-funded projects identified in the four districts were targeted at wards in the bottom half of the district league table, compared to over 75% of NGO-funded projects. Other influences on decision making It was clear that the stated criteria, as discussed above, were not the only factors at work. A range of other factors also played a major role, though perhaps not always consciously in the mind of decision makers. Political influence on decision making was rarely stated initially but is seemingly very powerful in some cases. In Mpwapwa and Nzega, the attempts of councillors to influence planning decisions in favour of their wards were described as significant. The varying persuasiveness and dynamism of different wards’ councillors was cited as a likely contributory factor behind widely varying histories of investment, and multiple examples were given of MPs lobbying for projects in particular areas. Political influence does not have to be an obstacle to equity. Indeed, if there was better availability of data on rural water supply infrastructure in different wards – such as the data 3 Waterpoint Mapping, Planning and Obstacles to Equity in Rural Water Supply, Ben Taylor, WaterAid Tanzania, 2009.

TAWASANET - WaterAid Tanzania - Daraja - Shahidi wa Maji
15 Out of sight and out of mind? Water and sanitation equity report 2009
provided by WPM – this could provide the political representatives of underserved communities with powerful evidence to lobby for this to be addressed. However, given that this data is not widely available, the major role played by political influence is currently an anti-equity influence, benefiting communities with stronger and more influential representatives rather than those with greater need or demand. Though not stated by district officials, access to decision makers, visibility and connectedness became apparent as a major influence on decision making – see box 3.1. Communities that have more regular contact with decision makers (those close to town, located on main roads or with existing social services) have an advantage. Officials visit them more often and they visit town more often. Finally, some parts of the district are simply harder or more expensive areas to work in than others. If there is no reliable road to a community or water is not easy to extract, this can increase the cost and difficulty of installing waterpoints significantly. Where there are a lot of unprotected sources, mobilising the community can be difficult. In places with a history of handpump theft it is hard to justify new investment. These factors can all lead to underinvestment in difficult working areas. Unless this is challenged with efforts to learn how to work effectively in difficult areas, these communities are likely to remain marginalised.
Box 3.1 – “Tumeshinda”: Winning and losing in Mwakashanhala and Itobo wards, Nzega district Mwakashanhala and Itobo wards have had very different experiences in their efforts to access clean and safe water. Mwakashanhala is a large ward of 23,000 people, which before 2008 had never received any investment in rural water supply. Itobo, in contrast, had 24 functioning improved WPs (and a further 14 non-functioning WPs) at the time of the WPM survey in 2005. For just over 8,000 people, this translates into 2.9 functioning WPs per 1000 people, the highest in the district – see chart. Itobo is 35km from Nzega town on the Nzega-Kahama road. There is regular bus transport to town all day. The centre is well developed and the ward office is a large, well furnished building. Mwakashanhala is located 70km south of Nzega town, 10km off the main Nzega-Tabora road along a poor and often impassable track. Communications with Tabora town were stronger than those with Nzega – Tabora is a one-day round trip by bicycle, Nzega takes two days. Itobo has benefited from two major phases of investment in water supply. A dam and piped network was constructed in 1965 and World Vision funded 27 shallow wells with handpumps during 2000-2005. More recently, funds for minor repairs have been provided by the council. And a third phase of major investment is coming soon in the forthcoming first full round (excluding Quickwins) of the WSDP. As a local official put it, “tumeshinda” (“we have won”). Prior to 2008, Mwakashanhala had never received any investment in improved waterpoints from any source. This historical under-investment was the main reason for an NGO deciding in 2008 to fund 46 shallow wells around the ward. Before this, the community had depended on unreliable, unprotected and dirty traditional sources.
The ward had tried regularly to access investment from Nzega council through the bottom-up planning process. Water and a better road have long been the ward’s top priorities (though a secondary school and dispensary were funded). The response was advice to set up user groups and collect contributions to demonstrate their demand. This was done but did not lead to any funding. Some possible reasons why Mwakashanhala had been overlooked for so long were suggested. Leaders in the ward felt that the bottom-up planning process was ineffective and had only a minor influence on budget decisions; that the real decisions were made by district officials, influential councillors and MPs. The water department suggested that ward leaders in Mwakashanhala were not very dynamic or persuasive. Further, Mwakashanhala’s remoteness from Nzega could well result in the ward’s problems being effectively hidden from decision makers. Itobo’s WEO and councillor were both at the council offices in Nzega town the day after seeing them in Itobo – it’s unlikely that Mwakashanhala’s representatives have similarly easy and regular contact with district officials.
TAWASANET - WaterAid Tanzania - Daraja - Shahidi wa Maji
16 Out of sight and out of mind? Water and sanitation equity report 2009
Formal planning processes Short-term planning was found to be a significant obstacle to equitable planning, since a new round of planning each year is likely to favour the same group of well-connected communities with strong representation each time. Marginalised communities face an annual struggle to make their voices heard. Access to information was found to be a challenge. In all four review districts, accessing information on recently-funded projects was surprisingly difficult. None of the district water departments had any comprehensive collated list of water projects in the district. Instead, data was found in multiple lists of projects funded by different sources and even the memory of water department staff. Reporting was not combined into a comprehensive water department report. Information on different funding sources and selection criteria is also important, but village and ward leaders had very little knowledge of funding mechanisms. Only already-selected villages were given details. This makes it harder for officials at district level to accurately perceive demand, for ward councillors and others to look for funding, and for villagers in underserved areas to mobilise and press their leaders. 3.3 Analysis: Overcoming Obstacles to Equity The review identified several obstacles to equitable planning. It found planning to be a politicised process with informal, subconscious factors having a significant effect on decision making in practice, alongside more objective formal criteria. Equity and need were said to be given priority in some cases, though this only appeared to translate into budget allocations on the very simple (and not necessarily equitable) approach of ensuring an equal division of projects between MPs constituencies. Four major obstacles to equity were identified, as follows. 1. Assessment of demand by comparing bank balances Community demand or readiness carried more weight in decision making than need and, more problematically, was found to be judged primarily by comparing bank balances of village water funds rather than through the bottom-up planning process. The bottom-up planning process produces results that cannot easily be used to assess and compare local priorities. In contrast, comparing bank balances has the benefit of objectivity, is easy to carry out and can serve to explain decisions to councillors and community members. However, it also introduces an obstacle to equity: poorer communities, those with no existing water infrastructure (and therefore with no user group or water fund) and those in areas where project costs are high are all effectively discriminated against. Genuine demand and community contributions are both necessary for achieving ownership and sustainability, but it is the way they are currently used in making decisions that turns this into an obstacle to equity. Using an alternative approach that first identifies communities on the basis of need and only then mobilises community contributions would solve this. This would ensure that demand and contributions are still given appropriate weight but without making it difficult for disadvantaged communities to access funds. WaterAid and other NGOs have been working this way, resulting in their funds being more effectively targeted at underserved communities. Making the bottom-up planning more realistic would also help provide a second means by which to assess demand at an early stage. This could be achieved by providing accurate indicative budgets for village and ward planning and ensuring that village plans clearly specify top priority projects. 2. Connectedness, visibility and political influence A second obstacle to equity is the strong apparent influence of connectedness, visibility and political factors on decision making. Better-connected wards have more regular opportunities to exert influence, which, given the politicised decision-making process, puts them at an advantage. Marginalised communities are at a disadvantage.

TAWASANET - WaterAid Tanzania - Daraja - Shahidi wa Maji
17 Out of sight and out of mind? Water and sanitation equity report 2009
A number of measures could help address this challenge. First, LGAs could be given specific guidance from national level to prioritise under-served wards. This could be guidance that a certain percentage of investment funding should be targeted at under-served wards, a requirement that water departments have to provide a report on how they are supporting all wards in the bottom half to access infrastructure, or a national target for all wards to have a minimum of 1 functioning improved waterpoint per 1000 people by 2015, with at least 1 WP per village – similar to target setting in other sectors. These ideas could be used in combination. Second, a multi-year planning approach in the water sector would help, whereby wards and villages are selected for projects over a period of several years, ensuring that wards that do not benefit in the first year get priority in later years. This would help ensure that investment reaches around the whole district over several years. Mpwapwa has employed this approach and it is popular with councillors. However, there is a risk that well-connected wards would still be prioritised in early years, as seems to have been the case in Mpwapwa. Third, more transparency and better sharing of information could help to draw attention to less visible communities. This approach has the advantage of building on the local political system to enhance local democracy rather than to undermine it with national directives. It is discussed further below. 3. Poor access to information Effective mechanisms for community members and their representatives to access information on the state of existing services, planned projects, completed projects and available funding mechanisms was lacking. This has the effect of hiding inequities and makes it difficult for underserved communities to lobby for investment. Producing and make easily accessible a simple annual table of funded water projects would address this. Ideally this would be backed with waterpoint mapping data as well as better communication of available funding mechanisms and planning decisions. And LGA-level measures to improve access to information should be supported nationally by giving more attention to transparency in LGA audits, assessments and criteria for funding. 4. Difficult working areas A range of factors can make investing in water projects in some communities more difficult. Four such challenges can be identified here, though there are likely to be others: i) difficult hydro-geological conditions increase project costs; ii) poor accessibility can also increase costs and time; iii) high need but low demand (e.g. where there are unprotected sources) can make it hard to mobilise contributions; and iv) high risk of failure, such as where earlier projects were mismanaged can make it hard to justify investment. If sector targets are to be met, these are challenges that the sector needs to be able to address. A guidance manual for working in difficult areas would go some way towards solving this problem. A useful first step would be to study past successes and failures in difficult areas. NGOs could usefully explore possible solutions.

TAWASANET - WaterAid Tanzania - Daraja - Shahidi wa Maji
18 Out of sight and out of mind? Water and sanitation equity report 2009
4. Equity in Water Resource Management Meab Mdimi, Austin Harrison and Nick Hepworth, Shahidi wa Maji 4.1 Background to this New Section on WRM Effective water resource management (WRM) is a pre-requisite for meeting Tanzania’s development goals, and we argue that to be effective, WRM must have equity, sustainability and accountability at its core. So many poor communities rely directly on untreated and un-piped water resources for their domestic and health needs, and on the agricultural and ecological systems that water supports for their livelihoods. Access to water resources and the protection of such resources are fundamentally linked to equity and poverty reduction. This year the Water Resource Management Act (WRMA 2009) came into force to strengthen a long established regulatory system of water use permits (water rights) for abstractions, discharge permits to control pollution, and the institutional architecture required for its administration. Improved management by the nine Basin Water Offices (BWOs) is aimed at maximising the potential of water resources through fixing use at equitable, sustainable levels, and so reducing conflict and degradation. This implementation of ‘integrated’ WRM is receiving welcome and significant support from the donors through the WSDP. However it is important that this WRM system and these funds benefit all, not just some. At this early stage in the WSDP, now is an ideal time for us to consider how we can embed equity at the heart of WRM in Tanzania. TAWASANET, led by Shahidi wa Maji and supported by WaterAid have attempted to frame some of the issues to initiate this thinking. We draw on case study material from the Pangani, Wami-Ruvu and Internal Drainage Basins, interviews with stakeholders and existing reports to focus on the following areas: � Equitable access to and benefits from water rights; � WRM conflict and degradation; � The value of Water User Associations; � Equitable representation in Basin Water Boards (BWBs); � Financial planning and disbursement to the BWOs.
In discussing these issues, we raise a set of questions and make some initial recommendations of how we can work together with the ministry and development partners to guide pro-poor WRM into the future. 4.2 Equitable Access to Water Rights: Waiting for benefit? By law, abstracting, storing or diverting water from surface or ground water source requires a water use permit from the BWO. The BWO decides whether a proposed use is appropriate and sets conditions on that water use, with the aim of co-ordinated, sustainable and equitable use. The water right gives users legal protections against threats to their water, though sensibly the law doesn’t guarantee that water will always be there. The law and policy prioritise water for domestic purposes over economic activities such as irrigation and commercial use. It is essential that this system is accessible to everybody, but our research found that many poor communities are not even aware that it exists. Where they are aware, the procedure for applying and obtaining a water right is extremely difficult – see box 4.1. The BWOs where application forms are available can be a great distance away from the people, application forms are in English and there is no information on how to fill the form. This leads to difficulties for poor villagers, improper filling of forms, inappropriate information and unnecessary delays. Even once a right is applied for and application fee paid, some water users we spoke to saw no response. In other cases, the system takes several years. Of all the small water-users that we spoke to during our research none had obtained a water right within two years of applying. In contrast, in 2007 and in another Basin, it took merely five days for a mining company to add one million litres a day to its existing water right. The benefits of having a water right were also questioned by communities. Also in Mbulu – box 4.1 – one village had acquired a water right but the neighbouring village upstream began using this same water without an agreement or a water right – but nobody could seem to help. Where illegal abstractions occur and conflicts over use begin, for those in Mbulu, a right doesn’t seem to make any difference.

TAWASANET - WaterAid Tanzania - Daraja - Shahidi wa Maji
19 Out of sight and out of mind? Water and sanitation equity report 2009
If the poor don’t know about water rights, if the system makes it too difficult for them to get one, or if they don’t see any benefit in having one, their water use will go unrecognised by the law. Commercial water users have been quick to see the benefits of legally protecting their water resource access. As the climate changes and demand increases the preferential access which the system gives to the wealthy and powerful has serious implications. What happens when water use is contested or when there is a drought? Can the water law protect domestic over commercial uses (as per policy) if domestic uses are not known about or registered? The decision making process behind the granting of water rights is also important. A Basin Water Board of stakeholders has to approve new water rights – we look at equitable representation in these BWBs in Section 4.5. But first, is the decision making process behind issuing water rights efficient and transparent? The majority of NGO and CBO staff and villagers we spoke to on this topic were not aware of the procedure through which water right applications are assessed. This makes it difficult for them to follow up on applications. There are no guidelines for those applying for or processing applications. This results in a potentially ‘anti-poor’ loophole: those with power and money are likely to be have more time and energy to follow up their applications. Although there is a statutory requirement for BWO’s to keep a register of water rights it was not easy to obtain records or to track the process of determination. The information available is confusing, with few details. Working out who is applying for water and how long it takes for different types of uses to be granted water is impossible. We know that the Basin Offices are doing their utmost to make the system work fairly. When communities raise questions about why the process is so difficult and takes so long they are told by the BWOs that they do not have enough financial and human resources to administer the water use permit system. This emphasises the importance of the questions we raise about funding disbursement in Section 4.6.
Box 4.1 – Water rights: hard to obtain and for what benefit? Mbulu District in Manyara region is fairly typical of central and northern Tanzania. Half the local population live below the poverty line and half the district receives less than 600mm annual rainfall, though some highland areas get as much as 1,200mm. Crops and livestock production are the most importance economic sectors, including both irrigated commercial farming and dryland livestock keeping. Only 24 % of the population have access to piped water or protected sources. Water is inequitably distributed naturally and competition is mounting. The Diocese of Mbulu Development Department (DMDD) supports poor communities to improve their water supplies and sanitation. The engineers at DMDD have been keen to protect the investment which poor communities are making and advise all their projects to obtaining a water right from the Internal Drainage Basin Water Office in Singida. Their experiences and those of the communities they support reveal some of the links between ineffective WRM, conflict and inequity. But obtaining a water right is not easy. From Mbulu you must travel to Singida (a six hour journey by bus on sometimes impassable roads) to pick up an application form. The forms are written in English and there is no guidance on how to fill out the form. In the past five years DMDD supported communities have applied and paid for 20 water permits and have received only two.
And what benefit does having a water right bring? In the village of Silaloda it does not appear to help. In 2003, the village constructed a gravity fed water supply to their village. The neighbouring village was consulted during planning and invited to joint the project, but declined. In 2004 Silaloda applied for a water right and 2 years later they received the right. But in September 2009 the neighbouring village opened a newly built water scheme which taps the same water used by Silaloda – without a water right. Downstream users in Silaloda now get little or no water, which they attribute to their neighbours new abstraction. The villagers at Silaloda do not know where to turn for help and wonder how the law should protect them as holders of the water right, and if not, what is the point of having and paying for the water right in the first place? In some instances disaffected villagers were, in desperation, taking matters into their own hands – a short way to escalated social conflict. This case raises questions of equitable access to legal protections as well as access to information. The BWO is very far from the village and lack the resources to help – without such issues being resolved at a Basin wide level there is a risk that local politics enter the frame reducing the chances of equitable and pro-poor WRM.

TAWASANET - WaterAid Tanzania - Daraja - Shahidi wa Maji
20 Out of sight and out of mind? Water and sanitation equity report 2009
Administrative systems of this kind are complex and take time to get right. TAWASANET members are keen to work with MoWI and BWOs to ensure the system works for the poor, the value of having a water right is recognised and the system delivers more equitable WRM. We therefore make the following recommendations:
1. The process of applying for and processing water use permits is not well-understood, well communicated or accessible, especially to the poor. Making applications forms available at District level with simple concise information on the process in English and Swahili would improve this.
2. The determination process should be simplified and streamlined and the technical basis of determination established and made clear to all. A transparent tracking system for water permit applications and an accessible register of rights would help greatly.
3. In order for the water rights system to be seen as legitimate and to serve the needs of the poor, the BWOs need the resources to process applications, to follow up on illegal use and conflicts and disputes.
4.3 Water Conflict and Resource Degradation: Who wins, who loses? One critical aim of water management is to reconcile the opposing interests of all water users – individuals, communities, businesses and government itself. Management of water conflicts is thus a fundamental part of the work of BWOs. Unfortunately, conflict and friction over water is common – boxes 4.1 and 4.3 give examples from Manyara and Kilimanjaro. Our research suggests that it is the poor who suffer the brunt of water conflict. The MoWI and BWOs are also responsible for preventing the pollution of water resources. Water quality presents real issues to poor communities and high salinity, high fluoride, faecal contamination and industrial pollution have all been shown to threaten the provision of safe water4. Legislation and policy have been available since 1981 but have not been fully implemented. By law, anyone who wishes to discharge waste water into a river must have a discharge permit, issued by BWOs and must comply with wastewater standards. Until recently, few permits had been issued (even DAWASCO doesn’t have permits for its waste stabilization ponds) though this is improving. The system for administration, monitoring and enforcement is unclear. The impacts of the weak pollution control regime and the degradation it brings are felt most heavily by the poor. We highlight this with our case study on Dar es Salaam’s urban rivers (Box 4.2). We found that many industries and operations discharge raw, untreated industrial effluent and sewage to these urban rivers but that many poor people are forced to come into contact with those rivers – on their way to school, through their work and the use of water in urban agriculture. This uncontrolled pollution is putting the health of the poor and vulnerable at risk. The 2009 Water Sector Status Report5 states that 25 out of 27 reported conflicts over water in 2008-9 were resolved. This is a fantastic success, but we suggest that many conflicts go unreported. Do people who are suffering due to water pollution or conflict know how and where to report this? Are problems left unreported because people have low expectations of the system? This was reportedly the case in the communities we met. To deal effectively with water conflicts and water resource degradation, clear systems of reporting, registering and resolving such issues are needed. In the Basins we visited and at a national level there are no formal systems for recording or monitoring pollution incidents and conflicts. Moreover, the different roles of BWOs, district authorities and NEMC in resolving these issues is not clear to many stakeholders – this makes accountability very difficult. Prevention of conflict is also critical. Improved decision making in the management and allocation of water can reduce potential for conflict between users. This is discussion in sections 4.4 and 4.5 below. 4 WaterAid 2007, Understanding the links between water supply and sanitation and WRM in Tanzania. 5MoWI 2009, Water Sector Status Report, 3rd Draft, URT

TAWASANET - WaterAid Tanzania - Daraja - Shahidi wa Maji
21 Out of sight and out of mind? Water and sanitation equity report 2009
Recommendations: 1. An accessible system for reporting, tracking and resolving water conflicts, degradation and pollution
problems would help ensure that effective solutions are found by clearly assigning responsibility and promoting accountability. Such a system has been set up in Kenya with much success6.
2. Institutional roles and responsibilities in resolving water conflict, degradation and pollution problems are confused, at least in practice. These roles and responsibilities need to be clearly defined and communicated so that the government is more accountable for helping the poor.
3. Waste water management and pollution control have been under-prioritised for implementation. A structured system for dealing with the worst cases of pollution and bringing them within legal control would contribute to equity and environmental protection.
6 LTS International 2008, Review of REMAK Support Programme to NEMA
Box 4.2 – Pollution on our doorstep – but who suffers? It is well known that the urban
rivers of Dar es Salaam, such as the Kizinga and Msimbazi are chronically polluted, though there has been law in place to prevent and control pollution for years (e.g. the Water Utilization Act 1974, amended 1981, 1989). We hope that with the powers now given to the BWOs by the WRMA 2009, and to NEMC under the National Environment Management Act 2004 we will start to see positive change. This case study looks at the uses that some of these rivers are put to and by whom; in order to understand how a lack of effective pollution control affects the rich and the poor in different ways.
The sources of pollution in Dar es Salaam are many, including industrial waste and domestic sewage. The discharge pictured above, from a textile factory, is said to have destroyed a fishery which had a value of around US$25,000 per year to subsistence fishermen. Furthermore, a sample we took in 2008 in the Msimbazi at Mandela Road Bridge revealed a faecal pathogen load which was 30 times the safe limit for wastewater used in agriculture. Exceeding this leads to reported problems with cholera, shigellosis and typhoid. The impact of this pollution and poor water quality on the poor of Dar es Salaam is difficult to quantify but our research suggest that dangerous levels of exposure to microbiological pathogens are commonplace. We found a range of livelihood activities (urban agriculture, irrigation
Uses of the Msimbazi, clockwise from top left: School children crossing; vegetable gardening; water pipes in channel; sand digging; fishing; domestic washing water.
Industrial waste discharge into the Kizinga river
and vegetable washing; sand-digging; brick-making; tree nurseries; fishing), and daily pedestrian travel. As well as direct contact with the water, poor communities are at risk from contamination through leaking water supply pipes which are sometimes laid in the channel and through consumption of vegetables produced and washed using polluted water. The wards adjacent to the river are ‘hotspots’ for water related disease and cholera. On this basis we feel that it is safe to conclude that the lack of effective pollution control in Dar es Salaam, and likely in other parts of Tanzania puts the health and wellbeing of the poor at risk first. It is also likely that those who cause the pollution are neither poor nor vulnerable.

TAWASANET - WaterAid Tanzania - Daraja - Shahidi wa Maji
22 Out of sight and out of mind? Water and sanitation equity report 2009
4.4 Water User Associations: Promising progress towards equitable WRM?
A Water User Association (WUA) is a group of water users, such as irrigators, which, with legal recognition and support from MoWI and BWOs, can pool their financial, technical, material and human resources for the operation, maintenance and management of a water system. WUAs play a critical role in WRM in Tanzania, handing management to water users themselves. A good example of how a WUA can be of great benefit in managing water resources is provided by the SHIMACHE WUA near Moshi – see box 4.3. Users not only manage themselves and their resources and minimize conflicts but also help the BWO in managing water resources sustainably. By having a constitution and by-laws they can deal with issues of pollution, improper usage of water and protect water resources and the environment. Where well established they can reduce the workload of BWOs and bring real efficiency and equity to the process of WRM.
Before the new WRMA 2009, WUAs were registered by MoWI in Dar es Salaam, a process which could take a long time – one WUA in Meru district, for example, applied in 2003 and were finally registered six years later. Speeding up the formation and registration of WUAs could bring clear gains for effective and equitable WRM. According to the National Water Sector Development Strategy, small water users can be represented on Basin Water Boards if they cooperate at Sub-Catchment level and Catchment Water Committee level – two levels of institutional arrangement above the WUA. Accelerating WUA formation may speed up the representation of the poor on BWBs, but this 5 tier system for representing the poor may also be unwieldy, expensive and difficult. Recommendations and questions:
1. Efforts should be made to accelerate the formation and registration of WUAs. Although we know this is no straightforward task, could the process be simplified? Care should be taken to embed equity into the formation of WUAs, and this is something the equity report will explore next year.
2. Basin offices need sufficient resources to support WUA formation and importantly, to co-ordinate and set up relationships between WUAs across the basin. Are additional resources needed for this?
3. We worry that the tiered system for representing the small water users in BWBs, although good in theory, poses a real challenge to equity because it may take years to get the institutions in place. Is there a quicker and easier way of making sure that the voices of small water users are heard at the BWB table?
4.5 Equitable Representation in Basin Water Boards: Who’s at the table? Enabling water users to participate in decision making and oversight of WRM is a fundamental aspect of equitable and effective WRM. As well as at WUA and Catchment Water Committee level, there is legal and policy provision for water user stakeholders to be members of both the National Water Board (NWB) and Basin Water Boards
Box 4.3 – Water User Associations: Promoting equity and better WRM in Kilimanjaro region Seven irrigation schemes along Kiladeda River, near Moshi, serve three villages. Together, they have set up a WUA, SIMACHE, with the help of the Pangani Basin Office and an NGO, TIP. The association has helped users get over a long history of water use conflicts to manage and allocate water amongst themselves and to raise funds for infrastructure maintenance and operation. In the past, downstream irrigators complained bitterly that the upstream users were using more water than their fair share, causing shortages downstream. With facilitation from TIP and the Pangani Basin Office, the water users came together and formed an association to manage and share water more equally and sustainably.
They received leadership training from TIP and help in formulating by-laws for managing their committee. The leadership, comprising of 2 representatives from each irrigation scheme, is responsible for allocating water to users and helps resolve conflicts. They manage the finances of the WUA, which come from water users’ fees and fines. They report to communities twice a year. While WUAs can be a real benefit, they also need support from the BWOs and others to help resolve the difficult challenges of WRM. There is a real need to co-ordinate between WUAs across the scale of the basin or sub-basin and that work requires a properly resourced BWO.

TAWASANET - WaterAid Tanzania - Daraja - Shahidi wa Maji
23 Out of sight and out of mind? Water and sanitation equity report 2009
(BWBs). These boards play an important role in ensuring that everybody concerned – from big commercial water users to small farmers – have a say on how water is managed. Under WRMA 2009, the NWB includes representation from all relevant sectors, one member from local government, three from BWBs, one from the private sector and one from an NGO. At least one third must be women. The NWB is intended to advise on financing patterns and inter-sectoral integration, but also approves ‘priority investment projects’ in WRM. The strategic role of the NWB is therefore an important one and equity in representation is critical. The current interim NWB has met once to approve investment projects but no details were accessible about its composition so it impossible to say whether there is equitable representation. BWBs have much more power, including duties to approve, refuse and revoke water use and water discharge permits, and the responsibility to monitor and enforce pollution control, resolve conflicts and oversee BWO activities and to hold the BWO to account. Equitable representation is therefore vital. Their inclusion in the institutional design for WRM in Tanzania is progressive, and the law lays down requirements for membership composition in attempt to ensure equitable representation. Figure 4.1 compares the actual composition of three Basin Water Boards (Pangani, Wami-Ruvu and Rufiji) against this ideal board composition.
Figure 4.1 – Who’s at the table? Actual Basin Water Board composition against statutory requirement Our first finding was that accessing information about who sits on these boards and details of their deliberations was difficult to obtain – we argue that given their powerful roles in making decisions which affect everyone such information should be freely available. The information we did manage to obtain raises questions about the equity of representation. The needs of poor communities and small-water users is most likely to be represented by Catchment Water Committee (CWC) members. The law provides space for three representatives of CWCs on each board. In both Pangani and Wami Ruvu Basins, none of these CWC seats are filled – their seats appear to be taken by the private sector and line ministries. This may be due to the difficulties in formally registering WUAs and building up the complex

TAWASANET - WaterAid Tanzania - Daraja - Shahidi wa Maji
24 Out of sight and out of mind? Water and sanitation equity report 2009
architecture of CWCs, as already mentioned. Whilst some progress is being made, we also noted that women are under-represented in the BWBs. BWB members are nominated from a list of names representing different sectors, submitted by the BWO to the Minister for appointment. There are no guidelines for the process of appointment – other than that the members should be involved in and have adequate knowledge of water affairs in the basin. None of the small water users in the basins we visited knew who was on the BWB or who was representing them – can their voices be heard? We also noted that MP’s were sitting on BWBs though there is no statutory provision for this. We question whether members of the legislature, representing a geographical segment of the basin are an appropriate membership. First, it seems to go against an accepted principle of good governance: the separation of powers between executive, judiciary and legislature. Also, unless geographical representation is balanced there is a danger that decisions may be skewed to benefit certain parts of the catchment. We were also interested in how BWBs function – how often they meet, issues discussed and decisions made. BWBs ideally meet four times a year, but for example the Pangani BWB only sat for two meetings during the financial year 2008/09. Their most recent meeting took two days but the second day was a field trip to visit a dam that is the main water source for Tanga town. With a backlog of important decisions we wonder why they meet so infrequently and whether a field trip is the most productive use of time? From our understanding of BWB meetings, based on interviews and minutes, the BWBs receive reports from the BWO about plans and implementation status and a list of applications for water user and water discharge permits. In the last meeting of the Pangani BWB, 44 applications were presented and approved and the board received a list of 12 conflicts raised. A board member told us that the level of deliberation of these issues could be improved. There is no indication in the minutes that the issues were discussed very deeply, suggesting that approval of permits is seen as a purely administrative exercise rather than providing proper scrutiny. Policy and law provide a solid foundation for effective BWOs with transparent oversight. The power of the BWBs to scrutinise water permit applications and conflict resolution, together with (theoretical) representation of small water users, provides an opportunity for equity and meaningful stakeholder participation. However, at present, representation seems unbalanced and the efficacy of BWBs in holding BWOs to account questionable. Recommendations:
1. A phased plan should be developed to shift NWB and BWB composition towards that envisioned in the law so that the needs of all stakeholders (including the poor) in the basin are represented.
2. Minutes and representation at BWB meetings should be publicly accessible information and will support accountability of BWBs in their important responsibilities.
4.6 Equitable & Efficient Financial Disbursement: Where is the money going and when? In the previous sections, we have found several issues that seem linked to the disbursement of funding to the BWOs and their capacity. Without funds, BWOs cannot effectively use their capacity to deliver equitable and effective WRM. Is donor support delivering improvements in WRM, and how can blockages be overcome? Figure 4.2 illustrates cumulative fund disbursements to each BWO in 2008-9. Budget data for BWOs is included where this was available. Delays and uneven dispersals appear to be the norm, undermining effective operation of the BWOs. For example, Wami-Ruvu BWO had received only 26% of its approved budget at the half way point of the financial year and in the short time left was only able to spend 46% of what they received. Regular funding flows to Basin Offices are essential for the effective implementation of their work plans. We wonder whether many of the problems we have discussed earlier in this chapter could be reduced or eliminated if

TAWASANET - WaterAid Tanzania - Daraja - Shahidi wa Maji
25 Out of sight and out of mind? Water and sanitation equity report 2009
fund disbursements were reliable – whilst the BWOs may not always have all the capacity they need, the timely provision of funds for them to exercise the growing capacity they do have needs to become a priority.
Figure 4.2 – When is the money arriving? Cumulative disbursements to BWOs during 2008/09
Lake Victoria
0
50
100
150
200
250
Mill
ions
Tsh
s
Internal Drainage
0100200300400500600700800
Mill
ions
Tsh
s
Pangani
0
100
200
300
400
500
600
700
Mill
ions
Tsh
s
Lake Tanganyika
020406080
100120140160180
Mill
ions
Tsh
s
Rufiji
050
100150200250300350400450
Mill
ions
Tsh
s
Wami-Ruvu
0
200
400
600
800
1000
1200
1400
1600
Mill
ions
Tsh
s
Lake Rukwa
0
20
40
60
80
100
120
Mill
ions
Tsh
s
Lake Nyasa
020406080
100120140160
Mill
ions
Tsh
s
Ruvuma
020406080
100120140160180
Mill
ions
Tsh
s
The relative split of finance across all the Basins is also important. Whilst we understand that capacity needs to be in place to spend funds, the lack of capacity in some BWOs shouldn’t deny the local population the chance to benefit from the WSDP – particularly as the basins with low BWO capacity have some challenging WRM problems. Recommendations:
1. Immediate priority should be focused on the rational and timely dispersal of funds to BWOs. 2. More transparency and better data are needed on the financial planning and disbursement process
between the donors, MoWI and the BWO to allow robust analysis to support pro-equity, pro-poor WRM. 4.7 Concluding Remarks Our overview of equity in WRM suggests that the poor struggle most to access adequate water resources. Poor communities are less aware of the water resource law and the obligations and protections it provides. Where they are aware, they are less able to access decision making processes and platforms within water governance. The poor also suffer most through water conflicts and water pollution. As demand for water increases and the climate becomes even more uncertain these imbalances threaten to further entrench inequality. TAWASANET, WaterAid and Shahidi wa Maji are keen to work with MoWI, the BWOs and the donors to help put equity at the heart of WRM in Tanzania. The WSDP promises great things for the country, including making the BWOs fully operational. This has the potential to have a significant and positive impact for sustainable development. By working together, and pooling our resources, energy, ideas and reach, we can ensure that this development is sustainable, accountable and equitable for all.

TAWASANET - WaterAid Tanzania - Daraja - Shahidi wa Maji
26 Out of sight and out of mind? Water and sanitation equity report 2009
5. Conclusions and Recommendations 5.1 Equity in Water Supply and Sanitation Budgets for urban and rural water supply continue on an equitable basis. However, the gap between access to clean and safe water in urban and rural areas remains wide. This can be seen in lower levels of citizens’ satisfaction with water supply services in rural areas. There is a worrying shift away from use of the LGCDG system and formula-based allocations to districts for rural water supply funding. This shift partly reverses the good progress made by introducing the formula sharing resources more fairly between districts since the launch of the WSDP. Greater use of the formula system would be a positive move towards greater budget equity. School sanitation is a challenge in both urban and rural areas, though in urban areas the challenge is more acute and more pressing. There are also wide variations in the number of school sanitation facilities between districts. Targeting of rural water supply investments by local government continues to be poor, with over half of new investments targeted at relatively well-served communities. However, some districts are targeting their resources more equitably, notably Kondoa and Singida Rural. Section 5.2 below includes ideas to address this. The gap in access to water supply between richer and poorer households has widened considerably since the early 1990s, though has recently closed very slightly. The biggest difference is in access to piped domestic connections. Poorer households also spend a much greater proportion of their income on water. Gender representation in national level decision-making bodies is improving steadily, though from a low base. The proportion of women among utility staff has declined slightly, raising questions about whether utilities could create a more gender-friendly working environment. 5.2 Overcoming Obstacles to Equity in Local Government Planning Processes Based on the analysis in section 3 of this report, the following recommendations can be proposed in order to overcome existing obstacles to equity in the local government planning process: • Water fund balances should not be used as a means of selecting communities. As an alternative,
communities should be identified primarily on the basis of need, followed by concerted efforts to mobilise the necessary community contributions. This would ensure that demand and contributions are still given appropriate weight but without making it difficult for poorer and less well connected communities to access investment.
• Provide LGAs with specific guidance to prioritise under-served wards. This could come in several forms, including the following options (which could be used in combination): i. Guidance that a certain percentage of investment funding should be targeted at wards in the bottom
half of the district league table. ii. A requirement for water departments to produce a report on all wards in the bottom half, explaining
why they are underserved, and detailing a plan for helping these wards to access new infrastructure. iii. A national target that all wards will have a minimum of 1 functioning improved waterpoint per 1000
people by 2015, including at least 1 waterpoint in each village. • Make transparency a reality, including making a simple table of funded water projects publicly accessible
across the district. This would have several benefits, including highlighting inequalities and encouraging more public scrutiny of plans and performance.
TAWASANET - WaterAid Tanzania - Daraja - Shahidi wa Maji
27 Out of sight and out of mind? Water and sanitation equity report 2009 • Make information on funding mechanisms, criteria and application procedures easily accessible to ward
and village leaders and community members in all communities, not just those that have been pre-selected for projects.
• Support access to information by putting a stronger focus on transparency in LGA audits and annual assessments, insisting on genuine public accessibility of specific reports and information as part of the minimum criteria for eligibility for funding.
• Make the bottom-up planning process more realistic, in order to provide an alternative means by which to assess demand at an early stage. This could be achieved by providing accurate indicative planning figures for village and ward planning and requesting that village plans should clearly specify top priority projects.
• Adopt a multi-year planning approach, whereby wards and villages are selected for projects over an extended time period. This would ensure that wards that do not benefit in the first year get priority in later years and that funds reach all parts of the district over several years.
• Target councillors in underserved wards with specific capacity building efforts. This could include capacity building in political arts such as lobbying. This option is more suited to NGOs with an interest in equitable planning than to government action.
• Develop a guidance manual for LGAs for working in difficult areas. A useful first step would be to study past successes and failures in difficult areas. Innovation-minded NGOs could also usefully explore possible new solutions.
5.3 Fulfilling the Potential of WRM • The process of applying for and processing water use permits is not well-understood, well communicated
or accessible, especially to the poor. The application process could be simplified. The basis of determining water rights should be established and made clear to all. A transparent tracking system for water permit applications and an accessible register of rights would help greatly.
• In order for the water rights system to be seen as legitimate and to serve the needs of the poor, the BWOs need the resources to process applications, to follow up on illegal use and conflicts and disputes. Immediate priority should be focused on the rational and timely dispersal of funds to BWOs.
• An accessible system for reporting, tracking and resolving water conflicts, degradation and pollution problems would help ensure that effective solutions are found. Institutional roles and responsibilities in resolving water conflict, degradation and pollution need to be clearly defined and communicated. Waste water management and pollution control needs greater priority for implementation.
• Efforts should be made to accelerate the formation and registration of WUAs. Basin offices need sufficient resources to support WUA formation and importantly, to co-ordinate and set up relationships between WUAs across the basin.
• The tiered system for representing the small water users in BWBs poses a challenge to equity because it may take years to get the institutions in place. Is there a simpler way of ensuring the voices of small water users are heard? A phased plan should be developed to shift NWB and BWB composition towards that envisioned in the law so that the needs of all stakeholders (including the poor) are represented.
• Minutes and representation at BWB meetings should be publicly accessible information and will support accountability of BWBs in their important responsibilities.
• More transparency and better data are needed on the financial planning and disbursement process between the donors, MoWI and the BWO to allow robust analysis to support pro-equity, pro-poor WRM.

The Tanzania Water and Sanitation Network (TAWASANET) is a recently formed network of Tanzanian civil society organisations working in the water and sanitation sector. The network works to increasing sharing between civil society organisations, promote partnerships between civil society and other sector stakeholders, build the capacity of civil society in the water and sanitation sector, and to strengthen the voice of civil society in national policy debates.
WaterAid is a leading international NGO which works to enable the world’s poorest people to gain access to safe water, sanitation and hygiene education. We work in Africa, Asia and the Pacific region and advocate globally with our partners to realise our vision of a world where everyone has access to these basic human rights.
Daraja is a recently formed organisation working in rural Tanzania, aiming to make local government more responsive to the community, with a particular focus on the water sector. We believe in bringing government closer to the people and are committed to making democratic local government work for the poor.
Shahidi wa Maji is a Tanzania NGO dedicated to sustainability, equity and accountability in water resource and environment management. Shahidi was formed in 2008 by a group of concerned Tanzanian’s working in business, academia, media, NGOs and the water sector, with support from Water Witness International. Through targeted research, communication, technical advice, training and constructive collaboration we aim to support sustainable development, climate resilience and aid effectiveness.
This is Tanzania’s second annual report on equity in water and sanitation. TAWASANET has committed to prepare such a report on an annual basis. The report is prepared independently, though mandated by the 2008 Joint Water Sector Review.
TAWASANET PO Box 80099, Dar es Salaam
WaterAid Tanzania, PO Box 33759, Dar es Salaam
Daraja PO Box 736,
Njombe
Shahidi wa Maji PO Box 105353, Dar es Salaam
[email protected] 0784 809542
[email protected] 022 2701609
www.wateraid.org
[email protected] 0787 503050
www.daraja.org
[email protected] 0783 111750
www.waterwitness.org