Embed Size (px)
Citation preview

1
Montana Investment Group
12-7-2013
Technology
Covering Analyst: Max Grier
Investment Thesis
Qualcomm is the leader in the mobile communications industry. They lead innovations in new products and intellectual property. Their dedication to research and development gives them security in such a competitive market.
Qualcomm is an ideal position to take control of emerging markets through the global transition from 3G to 4G networks.
The global demand for smartphones is on the rise, and Qualcomm plays a
key role in many of the popular smartphones.
Qualcomm
Ticker: QCOM
Current Price: $73.31
Recommendation: Hold
Implied Price: $66.22
Key Statistics52 Week Price Range
50-Day Moving Average
Estimated Beta
Dividend Yield %
Market Capitalization
3-Year Revenue CAGR
Trading StatisticsDiluted Shares Outstanding
Average Volume (3-Month)
Institutional Ownership
Insider Ownership
EV/EBITDA (LTM)
Margins and RatiosGross Margin (LTM)
EBITDA Margin (LTM)
Net Margin (LTM)
Debt to Enterprise Value
58.11- 70.37
68.55
0.96
1.40 (1.90%)
120.96B
31.31%
13.85
63.00%
36.95%
34.41%
1.25%
79.60%
10,420,000
1.69B
NA

MSIG 2
12-7-2013
Montana Investment Group
BBuussiinneessss OOvveerrvviieeww
Brief history of the company They are located in Sand Diego, CA. Qualcomm was founded in 1985 by MIT alumnus and UC San Diego
professor Irwin M. Jacobs, USC and MIT alumnus Andrew Viterbi. In 1989 they publically introduced the CDMA communication
technique. In 1999 Qualcomm sold its base station business to Ericsson, and later, sold its cell phone manufacturing business to Kyocera. In 2011 they announced Steve Mollenkopf as president and COO of the company.
How the company makes money Revenues
Their revenues come from selling products and services, which include: integrated, Radio Frequency (RF), and Power Management (PM) chips and system software used in mobile devices and in wireless networks. They also generate revenue through software products and services for content enablement across a wide variety of devices for the wireless industry, mobile commerce service, and hardware development service. They also license portions of their intellectual property portfolio, which include patent rights essential for the manufacture and sale of wireless products.
Segmentation Information i. Qualcomm CDMA Technologies (QCT):
Develops and supplies integrated circuits and system software based on CDMA, OFDMA, and other technologies for use in voice and data communications, networking, application processing, multimedia, and GPS products.
ii. Qualcomm Technology Licensing (QTL): Grants licenses or provides rights to use portions of Qualcomm’s intellectual property, which includes certain rights essential for manufacture and sale of certain wireless products. Some of these products include products implementing: CDMA200, WCDMA, CDMA TDD, GSM/GPRS/EDGE/ and/or OFDMA. QTL also collects license fees as well as royalties based on sales incorporating intellectual property.
iii. Qualcomm Wireless & Internet (QWI): This segment consists of four subdivisions: QES, QIS, QGOV, and Firethorn. QES provides fleet management, satellite and terrestrial-based
two-way wireless information and position mainly used for transportation and logistics companies.
QIS provides content enablement services for the wireless industry and push-to-talk.
QGOV works primarily with government agencies and their contracts to provide development and other services related to wireless communications technologies.
Firethorn builds and manages software applications that enable certain mobile commerce services.
iv. Qualcomm Strategic Initiatives (QSI): Is the segment pertaining to Qualcomm’s Ventures, Structures Finance & Strategic Investments, and FLO TV. This segment mainly

MSIG 3
12-7-2013
Montana Investment Group
supports investments in early-stage companies, new capabilities, and new technologies.
Revenues by Segment The revenues for each segment will be given for each segment as a percentage of total revenue for 2009, 2010, 2011, and 2012 respectively.
QCT: 59%, 61%, 59%, and 68%. Net growth from 2009-2012 is 97.83%.
QTL: 35%, 33%, 36%, and 33%. Net growth from 2009-2012 is 75.51%
QWI: 6%, 6%, 4%, and 3%. Net growth from 2009-2012 is -1.25%
QSI: Revenues for QSI were either insignificant or non-existent, because they are not reported in the 10-k.
SSttrraatteeggiicc PPoossiittiioonniinngg
Qualcomm’s general business functions consist of Research and Development, Sales and Marketing, Competition, Patents, Trademarks, and Trade Secrets. What Qualcomm does in each of these areas.
1) Research and Development: The communications industry is rapidly changing and continuously enhancing products and technologies. Qualcomm is a leader in the industry and to keep their competitive advantage they must invest heavily in R&D. R&D expenditures are primarily related to development of integrated circuit products and continuing advancement in CDMA and OFDMA technologies. The goal is to accelerate advanced wireless products with lower cost devices, integration with consumer electronics, convergence of multiband, multimode, multi-network products and technologies, and third-party operating systems. This strategy will keep Qualcomm’s first-mover advantage in the industry and preventing companies from catching up with technologies in production or products being researched.
2) Sales and Marketing: Qualcomm’s marketing activities include public relations, advertising, web marketing, participation in technical conferences and trade shows, competitive analyses, industry intelligence, and other marketing programs to further develop customer relations. Strategic positioning in the market keeps Qualcomm advantageous in comparison to competitors. Gaining an understanding of customer needs gives crucial information on product pricing and timing of products to market.
3) Competition: The communications industry will continuously experience fierce competition as consumers, businesses, and governments realize the potential benefits of wireless communications products and services. They are vulnerable to competitors which may have an advantage with manufacturing companies in emerging regions (i.e. China). These relationships may affect customers’ decisions to purchase products or license technology from us. Although this is a threat the next segment helps combat these factors.
4) Patents, Trademarks, and Trade Secrets: Their competitive position can be maintained or enhanced through the combination of patents, copyrights, trade secrets, trademarks, and proprietary information. A substantial portion of these patents are essential for implementation of CDMA2000, WCDMA (UMTS), TD-

MSIG 4
12-7-2013
Montana Investment Group
SCDMA, TD-CDMA, and OFDMA products. These patents have coverage in many countries around the world and Qualcomm continues to pursue patent applications around the world. Important patents are essential for all 3G standards based on CDMA and patents that might be essential for certain standards based on OFDMA technology. Extensive R&D efforts result in a leading intellectual property portfolio and continuation of increases in important patents, which will be essential for implementation of new technologies.
IInndduussttrryy Overview The wireless communications industry is extremely competitive. The industry has seen dramatic increase over the past decade due to an increased demand for mobile communication devices. The number of worldwide mobile connections is expected to increase over the next years to drive the need for voice calls in the mobile environment. More recent demands are associated with the desire to access high-speed data services. With increased demand for wireless communications comes increased competitors in the industry putting pressure on companies to stay innovative. The largest development in the industry is within China and emerging markets. Qualcomm is staying the leader in the industry through their QCT and QTL segments. They also focus a large percent of revenues to research and development to accomplish their competitive advantage. QCT faces industry challenges through customers demand for increasing performance in modern smartphones. Along with innovating products Qualcomm’s QTL segment is dedicated to developing innovative patents and intellectual property. This is essential to stay the leader in the industry by having the most innovative and efficient patents essential to 3G/4G smartphones. Why does their line of business exist?
Macro factors The United States has the most developed and advanced mobile communications industry in the world. This is due to the enormous growth in demand for smartphones over the past five years. The majority of cell phone owners now own smartphones. American consumers have helped drive the growth of the industry within the United States, but more recent developments show rapid growth in China and emerging markets. Qualcomm’s revenues are relatively small compared to foreign customers. They are continuing to focus their energy on expanding products in China, South Korea, Taiwan, and other foreign countries. The growth in demand for 3G in China has sky-rocketed in the recent years and is expected to increase further in the future. Foreign countries will convert from 3G to 4G, creating an even larger demand for Qualcomm products. Along with increasing focus in emerging markets, Qualcomm faces a huge risk if foreign currencies were to decrease in value. The Chinese currency (Yuan) has been steadily increasing in value compared to the USD, benefiting revenue from China. The Yuan is currently very undervalued which may be good news in future years if the value continues to increase. Qualcomm with also see a detrimental effect on their revenues if foreign currencies decrease in value compared to the USD.

MSIG 5
12-7-2013
Montana Investment Group
Competition The wireless communication industry has intense competition to stay on the forefront of advanced technology. The semiconductor business forces companies to shovel money into research and development to stay innovative. Qualcomm’s main competitors are: Broadcom, Texas Instruments, Analog Devices, Ericsson, and Fujistu. All of these companies have less income and much smaller margins than Qualcomm. Qualcomm’s margins are much more impressive than any of these companies and manages to dedicate a smaller percentage of gross revenue to research and development, while managing to stay the leader in the industry. While Qualcomm has a large market share in the telecommunications industry, much of this market share is in the higher tier markets. It’s competitors in America and abroad appears to be focusing on lower tier markets to gain market share. In the short term these competitors may not affect Qualcomm’s earnings, but as competition drives average device price lower margins may take a hit. Although these companies could take market share in low price tiers, I feel the industry is rapidly progressing and Qualcomm’s price skimming will be the most efficient pricing model. In short these companies will not be able to match Qualcomm’s performance regardless of price tier.
MMaannaaggeemmeenntt aanndd EEmmppllooyyeeee RReellaattiioonnss Paul E. Jacobs - CEO and Chairman - Dr. Paul E. Jacobs, Ph.D., has served as Chairman of Qualcomm, since
March 2009, as a Director since June 2005, and as Chief Executive Officer since July 2005. He served as Group President of the Qualcomm Wireless & Internet Group from July 2001 to June 2005. Jacobs holds a B.S. degree in Electrical Engineering and Computer Science, a M.S. degree in Electrical Engineering and a Ph.D. degree in Electrical Engineering and Computer Science from the University of California, Berkeley. Paul Jacobs is the son of Dr. Irwin Mark Jacobs, former Chairman of Qualcomm.
Steven Altman - Vice-Chairman - Steven "Steve" R. Altman, has been the Vice Chairman of Qualcomm Inc. since October 3, 2011. Mr. Altman earned a B.S. degree in Political Science and Administration from Northern Arizona University in 1983, and a J.D. from the University Of San Diego School Of Law in 1986. Mr. Altman served as President of Qualcomm Inc., from July 2005 to 2011. He served as Qualcomm's Executive Vice President from November 1997 to June 2005, and as President of Qualcomm Technology Licensing Division from September 1995 to April 2005. He became Vice President and General Counsel of Qualcomm in 1992. He joined Qualcomm in 1989 as Corporate Counsel and was the chief architect of Qualcomm's strategy for licensing its broad intellectual property portfolio for wireless communications, which has accelerated the growth of CDMA technology.

MSIG 6
12-7-2013
Montana Investment Group
Steven Mollenkopf - President and COO
- Mr. Mollenkopf joined Qualcomm in 1994 as an Engineer and throughout his tenure at Qualcomm held several other technical and leadership roles. Mr. Mollenkopf was elected to the Qualcomm Atheros, Inc.'s Board of Directors in May of 2011. Mr. Mollenkopf holds a B.S. degree in Electrical Engineering from Virginia Tech and an M.S. degree in Electrical Engineering from the University of Michigan. Mr. Mollenkopf will oversee Qualcomm’s divisions, business operations and market expansion and development areas. He will also continue in his role as President of Qualcomm CDMA Technologies (QCT).
Derek Aberle -Executive Vice President and Division Officer
- In 2000, Mr. Aberle joined Qualcomm after representing the company as outside counsel for several years at the law firms of Pillsbury Madison and Sutro and Heller Ehrman. Mr. Aberle holds a B.A. degree in Business Economics from the University of California, Santa Barbara and a J.D. from the University of San Diego. Derek K. Aberle, has served as an Executive Vice President of Qualcomm Inc., and as President of Qualcomm Technology Licensing (QTL) since September 2008.
George Davis -Executive Vice President and CFO
- George S. Davis, was appointed Qualcomm, Inc.'s Executive Vice President and Chief Financial Officer commencing March 11, 2013. Previously he was an officer of Applied Materials, Inc. until March 8, 2013. He was promoted to Applied Materials, Inc.'s Executive Vice President, Chief Financial Officer in December 2009, after serving as Senior Vice President, Chief Financial Officer, since December 2006. . Mr. Davis received his Undergraduate degree in Economics and Political Science from Claremont McKenna College and his Master's in Business Administration from the University of California, Los Angeles. RReecceenntt NNeewwss
Qualcomm Technologies Announces Fourth-Generation 3G/LTE Multimode Modem and RF Transceiver Chip Qualcomm is now introducing their newest modem chipset, the Qualcomm Gobi9x35, and RF transceiver chip, the Qualcomm WTR3925, designed for the 4G LTE Advanced mobile broadband connectivity. The Gobi 9x35 is the first cellular modem based on the 20 nm technology node, a large improvement from their 26nm node. This is an exciting development for Qualcomm and stands to show their technological advancement and there is no idle time in their R&D.
Qualcomm Snapdragon Processors Continue to Drive the Smartphone Space with Nexus Devices from Google Google’s newest android smartphone, the Nexus 5, will be powered by Qualcomm’s Snapdragon 800 processor. The Nexus 5 is the first smartphone to be released with global LTE support. Google’s newest phone also utilizes the Qualcomm QFE1100 feature, which reduces heat up by up to 30% and power consumption by up to 20%, enabling thinner form factors and longer battery life.

MSIG 7
12-7-2013
Montana Investment Group
CCaattaallyyssttss
Upside
Continued growth in China and emerging markets. Global adoption of 3G and soon global bridge from 3G to 4g
technologies. Qualcomm provides wireless companies with the R&D to bring their
innovations to market. Positive results from partnership with Google’s line of smartphones.
Downside
New competitors in emerging markets may drive average unit selling price down.
Integrating new employees and retaining key employees. A decline in global economic conditions in geographic regions with
high concentrations of wireless voice and data users.
CCoommppaarraabbllee AAnnaallyyssiiss
Texas Instruments-40%
“Texas Instruments designs and makes semiconductors that it sells to electronics designers and manufacturers all over the world. As of Dec 31 2012, Co. had three reportable segments: Analog, consisting of the following major product lines - High Volume Analog & Logic, Power Management, High Performance Analog and Silicon Valley Analog; Embedded Processing, consisting of digital signal processors and microcontrollers used in catalog, communications infrastructure and automotive applications; and Wireless, consisting of OMAP™ applications processors, connectivity products and baseband products.” – Mergent Online.
Texas Instruments was chosen as a comparable because of its participation in the semiconductor industry and its global exposure. They participate in the licensing of its products, which is similar to Qualcomm’s QTL division. They haven’t seen the same growth or size as Qualcomm, but their margins are close to Qualcomm’s.
Analog Devices- 30%
“Analog Devices designs, manufactures, and markets a range of integrated circuits (ICs) that incorporate analog, mixed-signal and digital signal processing technologies. Co.'s ICs are for a range of signal processing applications. Co.'s principal products include analog products which consist of converters, amplifiers/radio frequency, other analog, and power management and reference products; and digital signal processing products. Co.'s products are embedded inside electronic equipment including: industrial process control systems; factory automation systems; energy management systems; automobiles; digital televisions; medical imaging equipment; and optical systems, among others.” – Mergent Online.
MSIG 8
12-7-2013
Montana Investment Group
Analog Devices was chosen as a comparable due to their growth rate and product line. Their wireless segment resembles Qualcomm’s and they both face similar competitive pressures in the industry.
Broadcom- 25%
“Broadcom is a provider in semiconductor applications for wired and wireless communications. Co.'s products deliver voice, video, data and multimedia connectivity in the home, office and mobile environments. Co. provides a range of system-on-a-chip and embedded software applications. Co.'s product portfolio includes: Broadband Communications, which provides application for cable, xDSL, fiber, satellite and IP broadband networks; Mobile and Wireless, which provides integrated applications for the mobile and wireless ecosystem; and Infrastructure and Networking, which provides integrated applications for carriers, service providers, enterprises, small-to-medium businesses and data centers.” – Mergent Online
Broadcom was a good comparable due to their similar revenue, growth rates, and global exposure. Although Broadcom is smaller than Qualcomm they supply similar products and compete for the same customers.
Ericsson- 5%
“LM Ericsson Telephone Co. provides communications infrastructure, services and multimedia solutions. Co. develops and delivers mobile and fixed infrastructure equipment and related software. Co. is also engaged in managed services, consulting, systems integration, customer support and network rollout. In addition, Co. offers mobile phones, accessories, content and applications. Finally, Co. offers wireless platforms and semiconductors for handset manufacturers. Co. divides its operations into four business segments: Networks, Global Services, Support Solutions and ST-Ericcson.” – Mergent Online
Ericsson was chosen as a comparable due to their similar products and services. They also have similar revenues compared to Qualcomm. Although Ericsson is based in Sweden and doesn’t compete as strongly in the regions Qualcomm does. Qualcomm also sold their base station business to Ericsson in 1999.
Fujitsu- 0%
“Fujitsu is a provider of information technology ("IT")-based business solutions. Co.'s operations are divided into three divisions: technology solutions, ubiquitous solutions and device solutions. Technology Solutions division provides system platforms products including servers, storage systems, software as well as system integration, network construction and system installation services. Ubiquitous Solutions division offers personal computers ("PCs"), mobile phones, hard disk drives and optical transceiver modules. Device Solutions division provides large-scale integration ("LSI") devices, electronic components and batteries.” – Mergent Online

MSIG 9
12-7-2013
Montana Investment Group
Regression Beta Weighting
1 year daily 0.8240 20%
2 year daily 1.0388 20%
3 year daily 1.0193 20%
4 year daily 0.9533 20%
5 year daily 0.9684 20%
Qualcomm Beta 0.9607
Fujitsu was used as a competitor based on their involvement in the mobile phone industry. They were not weighted in the model due to strong differences in their revenues and margins compared to Qualcomm. They were also not weighted since most of their products are substantially different than that of Qualcomm’s.
DDiissccoouunntteedd CCaasshh FFllooww AAnnaallyyssiiss
Revenue Model
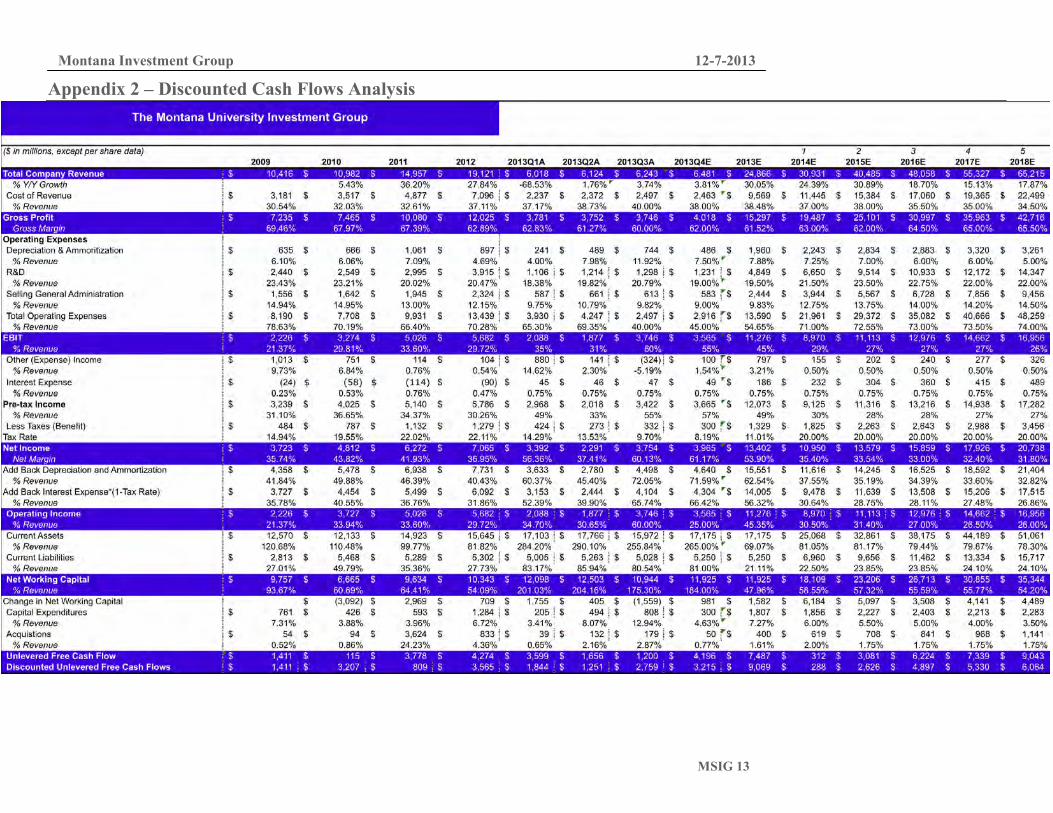
The revenue model was broken down into the main revenue driving segments of the company and the elements they consist of. Revenue is projected to grow over the next five years at an average rate of 21.38%.
QCT revenues are projected to grow at an average rate of 23.80% over the next five years. The QCT segment is mainly comprised of MSM device sales, which are expected to increase globally. Qualcomm has been increasing the efficiency of their multimode chips along with increasing their capabilities, which will increase cell phone service provider demand for these chips. This is the largest revenue driver for Qualcomm, accounting for 67.22% of total revenue in fiscal 2013.
QTL revenue is the second largest revenue driver for Qualcomm accounting for 30.38% of total revenue in 2013. This segment gains revenue through licenses fees royalties. In 2013, 90 companies currently possess licenses or intellectual property of Qualcomm. With increased research and development the potential for increased patents, intellectual property, and companies desiring Qualcomm’s proprietary information are expected to increase.
QWI revenue makes up a very small portion of total revenue. This segment consists of four sub segments, with little guidance in the 10-K about future growth; the revenue growth in this segment is projected to stay close to 2% year over year.
QSI revenue is negligible for the foreseeable future. Revenue in this segment wasn’t even reported in the 2013 10-K, to avoid poor estimates, this segment wasn’t projected in the revenue model.
Beta
Multiple beta regression were performed to asses Qualcomm’s volatility. I ran five regressions and weighed them evenly to get a better understanding of Qualcomm’s volatility over a five-year period.
Cost of Revenue
Cost of revenue is comprised of cost of equipment and services. Qualcomm has minimal control over input costs with both turnkey and integrated fables production. Manufacturers are responsible for procurement of raw materials and assembly, which will directly impact Qualcomm’s cost of equipment.

MSIG 10
12-7-2013
Montana Investment Group
Research & Development
This is arguably the most important expense to a company in the Technology industry. Qualcomm’s devotion to research and development has been a success driver for the company. R&D is projected to increase over the next couple years then level off since it is expected competition will be more fierce in the coming years. There will always be the need for innovation and new technology to stay at the top of the industry.
Selling, General, and Administrative Expense
This expense is mainly comprised of legal fees and employee-related expenses. SG&A is projected to increase with the expectation more employees will be needed to maintain increased growth of Qualcomm.
Depreciation and Amortization
Assets are depreciated using straight-line depreciation. Current assets are going to continue depreciation, although with increased purchase of assets in the future, depreciation is projected to stay at relatively the same percentage of total revenue.
Acquisitions
Qualcomm’s amount of acquisitions per year fluctuates erratically making this expense hard to project. I don’t expect Qualcomm to make any significant acquisitions in the near future since they have leading technology so projections were expected to stay relatively constant.
Capital Expenditures
Capital expenditures are projected to decline slightly over the next five years. This is because I expect Qualcomm to spend to enhance underdeveloped segments in the company. Qualcomm will then allocate their resource efficiently and reduce spending on segments that aren’t worth developing.
Tax Rate
Qualcomm’s tax rate has historically been around 20% and is projected to stay there in the future. Qualcomm is very adamant about keeping their tax rate low, as a strategy to due so they will move headquarters to different countries to receive tax breaks.
Cash and Marketable Securities
Qualcomm typically holds a large portion of total revenue as cash. In 2013 they had $29.4 billion in cash, cash equivalents, and marketable securities only $8.1 billion was in US subsidiaries and $21.3 billion was held in foreign subsidiaries. Of this $21.2 billion of this cash has been reinvested indefinitely. Cash is also used for continuing operations, reducing their need for current liabilities.

MSIG 11
12-7-2013
Montana Investment Group
Qualcomm has also paid off all of their loans leaving no need to allocate cash to loans payable.
RReeccoommmmeennddaattiioonn
I recommend a hold for the Montana Investment Group. Qualcomm is on the leading edge of an industry with huge growth potential. Their products have continued to outperform its competitor’s. Qualcomm’s innovative research and development ensures they will continue to lead the wireless communication industry. Qualcomm has been able to capture emerging markets with 2G and 3G technology; they will increase sales during the 3G to 4G-network conversion. My relative valuation returned an overvaluation of 6.38% and a price target of $67.06. My DCF returned an overvaluation of 10.74% with a price target of $65.55. Overall my valuation of Qualcomm is an overvaluation of 9.83% with a price target of $66.22.

MSIG 12
12-7-2013
Montana Investment Group
Appendix 1 – Comparables Analysis
The Montana Investment Group25.00% 5.00% 0.00% 40.00% 30.00%
($ in thousands except per share data) Qualcomm BRCM ERIC FJTSY TXN ADI
Stock Characteristics
Current Price 71.00$ 27.23$ 12.30$ 21.63$ 42.55$ 49.85$
50 Day Moving Avg. 59.02$ 26.65$ 12.84$ 20.13$ 40.93$ 47.76$
150 Day Moving Avg. - - - - - -
200 Day Moving Avg. 65.27$ 30.16$ 12.32$ 20.10$ 38.51$ 47.11$
Beta 0.74 1.46 - 1.2 1.18
Size
ST Debt (MRQ) 296$ 733$ 1,000$ -
LT Debt (MRQ) 1,394$ 3,674$ 4,161$ 872,104$
Cash and Cash Equiv. (MRQ) 3,800,000$ 1,530,000$ 6,836,346$ 2,894,680$ 1,435$ 528,833$
Minority Interest 21,000$ 244,800$ 1,295,961$ -
Market Value Preferred Stock
Diluted Share Count 1,680,000$ 568,000$ 3,230,000$ 310,690$
Market Cap 115,440,000$ 15,360,000$ 39,710,000$ 8,950,000$ 46,570,000$ 15,490,000$
Enterprise Value 113,341,000$ 14,399,690$ 36,352,861$ 7,351,281$ 46,573,726$ 16,143,961$
Profitability Margins Max Min Avg. Median
Gross Margin 64.45% 27.47% 48.11% 51.04% 63.00% 49.70% 31.64% 27.47% 52.38% 64.45%
EBIT Margin 31.10% -0.97% 14.73% 8.44% 29.72% 8.44% 5.34% -0.97% 31.10%
EBITDA Margin 35.16% 3.43% 20.72% 23.37% 34.41% 14.00% 4.59% 3.43% 32.73% 35.16%
Net Margin 36.95% -1.66% 14.18% 8.98% 36.95% 8.98% 2.54% -1.66% 24.11%
Credit Metrics
Interest Expense (MRQ) 305,000$ 4,000$ 66,134$ 7,000$ 7,000$ 7,000$ 305,000$ 4,000$ 7,672$
Debt/Equity (MRQ) 83.24% 18.78% 37.85% 21.40% 21% 19% 83% 47% 19%
Debt/EBITDA (LTM) 224.18% 97.64% 137.76% 129.01% 129% 108% 224% 130% 98%
EBITDA/Interest Expense (LTM) 122571.43% 524.61% 50050.51% 16014.29% 122571% 16014% 525% 99500% 11642%
Operating Results
Revenue (LTM) 56,690,000$ 2,650,000$ 23,204,365$ 18,515,000$ 24,870,000$ 8,006,000$ 34,850,187$ 56,690,000$ 12,160,000$ 2,650,000$
Gross Profit (LTM) 15,050,000$ 1,740,000$ 8,420,207$ 8,699,120$ 15,050,000$ 3,979,000$ 11,028,240$ 12,354,000$ 6,370,000$ 1,740,000$
EBITDA (LTM) 8,580,000$ 893,190$ 3,302,377$ 2,620,037$ 8,580,000$ 1,121,000$ 1,600,074$ 3,640,000$ 3,980,000$ 893,190$
Free Cash Flow (LTM) 5,680,000$ (1,049,060)$ 1,765,847$ 1,167,650$ 5,680,000$ 1,360,000$ 975,300$ (1,049,060)$ 2,869,000$ 759,840$
Valuation Weighted Avg.
EV/Revenue 6.09 x 0.13 x 2.91 x 2.81 x 4.56 x 1.80 x 1.04 x 0.13 x 3.83 x 6.09 x 3.86 x
EV/Gross Profit 9.28 x 0.60 x 5.27 x 5.47 x 7.53 x 3.62 x 3.30 x 0.60 x 7.31 x 9.28 x 6.78 x
EV/EBITDA 22.72 x 2.02 x 13.43 x 13.03 x 13.21 x 12.85 x 22.72 x 2.02 x 11.70 x 18.07 x 14.45 x
EV/Free Cash Flow 37.27 x -7.01 x 16.38 x 18.09 x 19.95 x 10.59 x 37.27 x -7.01 x 16.23 x 21.25 x 17.38 x
Metric Implied Price Weight
EV/Revenue 59.41$ 10.00%
EV/Gross Profit 62.97$ 10.00%
EV/EBITDA 76.05$ 40.00%
EV/Free Cash Flow 61.00$ 40.00%
Price Target 67.06$
Current Price 73.44$
Under (Over) Valued (6.38)$
MSIG 13
12-7-2013
Montana Investment Group
Appendix 2 – Discounted Cash Flows Analysis

MSIG 14
12-7-2013
Montana Investment Group
Appendix 3 – Revenue Model

MSIG 15
12-7-2013
Montana Investment Group
Appendix 4 – Working Capital Model
MSIG 16
12-7-2013
Montana Investment Group
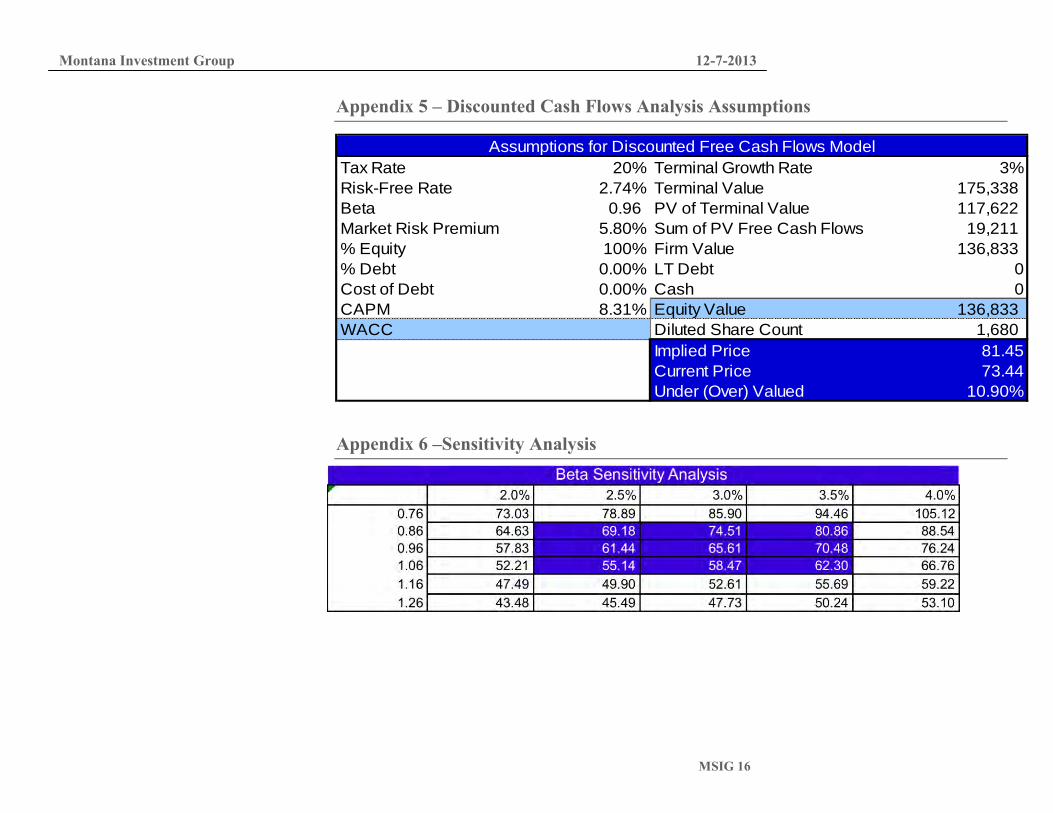
Appendix 5 – Discounted Cash Flows Analysis Assumptions
Assumptions for Discounted Free Cash Flows Model
Tax Rate 20% Terminal Growth Rate 3%
Risk-Free Rate 2.74% Terminal Value 175,338
Beta 0.96 PV of Terminal Value 117,622
Market Risk Premium 5.80% Sum of PV Free Cash Flows 19,211
% Equity 100% Firm Value 136,833
% Debt 0.00% LT Debt 0
Cost of Debt 0.00% Cash 0
CAPM 8.31% Equity Value 136,833
WACC Diluted Share Count 1,680
Implied Price 81.45
Current Price 73.44
Under (Over) Valued 10.90%
Appendix 6 –Sensitivity Analysis

MSIG 17
12-7-2013
Montana Investment Group
Appendix 8 – Sources
SEC Filings Qualcomm Investor Relations Qualcomm Annual Report Qualcomm Conference Calls IBIS World S&P Net Advantage Mergent Online Yahoo! Finance