Embed Size (px)
Citation preview

MARIJUANA AND YOUTH
Rosalie Liccardo Pacula, Ph.D., RAND and NBER
Michael Grossman, Ph.D., CUNY and NBER
Frank J. Chaloupka, Ph.D., UIC and NBER
Patrick M. O’Malley, Ph.D., Univ. of Michigan
Lloyd D. Johnston, Ph.D., Univ. of Michigan
Matthew C. Farrelly, RTI
Research for this paper was supported by grants from the Robert Wood Johnson Foundationto the University of Illinois at Chicago and the University of Michigan, under the Bridgingthe Gap Initiative, and a grant from the National Institute on Drug Abuse to RAND (R01DA12724-01).
MARIJUANA AND YOUTH
Purpose
Ø To describe factors that are significant in predicting trends inmarijuana use among youth and evaluate the importance of thesefactors in contemporaneous demand equations.
Ø Obtain an estimate of the price elasticity of demand using nationallyrepresentative data.
Motivation
Ø Marijuana use, the most commonly used illicit drug, is on the riseamong youth in the United States.
WHY SHOULD WE CAREABOUT MARIJUANA USE IN PARTICULAR?
1. Most widely used illicit substance.
2. Two reports commissioned by the U.S. NIDA and AustralianNational Task Force on Cannabis suggest that there are somenegative consequences attributable to marijuana use inparticular.
a) Diminished cognitive functioning à human capital formation.
b) Diminished psychomotor performance à accidental injury to selfor others.
c) Increased risk of particular types of illnesses à increased healthcare utilization.
d) Potential for developing dependence, although physicalwithdrawal symptoms appear to be minor.
BACKGROUND
Previous work in the sociology literature suggests that significantpredictors of the contemporaneous demand for marijuana cannotaccount for the trends in marijuana demand over time. Attitudinalvariables are by far the most powerful predictors of trends in use.
Ø Bachman, Johnston, O’Malley, and Humphrey (1988) [1976-1986]
Ø Bachman, Johnston and O’Malley (1998) [1976-1996]
Ø Caulkins (1999) challenges this conclusion.! Calculates simple correlation coefficients between seniors’ self-
reported marijuana use and national marijuana prices over theperiod 1981-1997.
! Simple correlation coefficients varied between –0.79 and–0.95.
WHAT WE DO IN THIS STUDY
Ø Examine national trends in annual and thirty-day marijuana participation from1982-1998 using time series analysis.
Ø Compare these findings to those obtained from repeated cross-sectional analysis over the period 1985-1996.
WHY BOTH? Time Series Analysis Enables Us To:
1. Examine purity on equal footing as the other determinants since this variable is only measured at a national level.
2. Determine whether changes in price and perceived harm account for a significant share of the observed changes in youth marijuana use over time.
But there are only a small number of observations and a considerable amount of inter-correlation among the variables.
Repeated Cross-Sectional Analysis Enables Us To:
1. Incorporate more determinants of demand, particularly cross-price effects for alcoholand tobacco.
2. Obtain an estimate of the price elasticity of demand using variation in prices acrosscities as well as over time.
But purity of marijuana cannot be adequately controlled for in these models.
TIME SERIES ANALYSIS
A. DATA
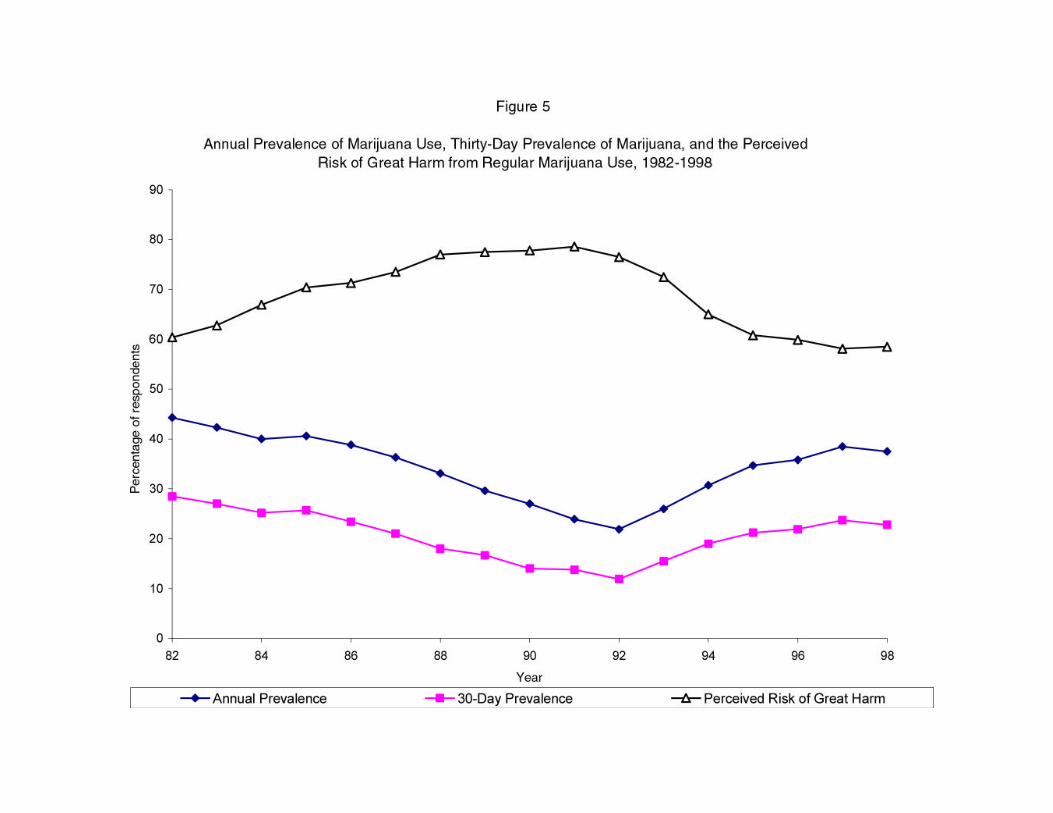
1. USE AND PERCEIVED HARM1982-1998 Monitoring the Future (MTF) Survey of HighSchool Seniors
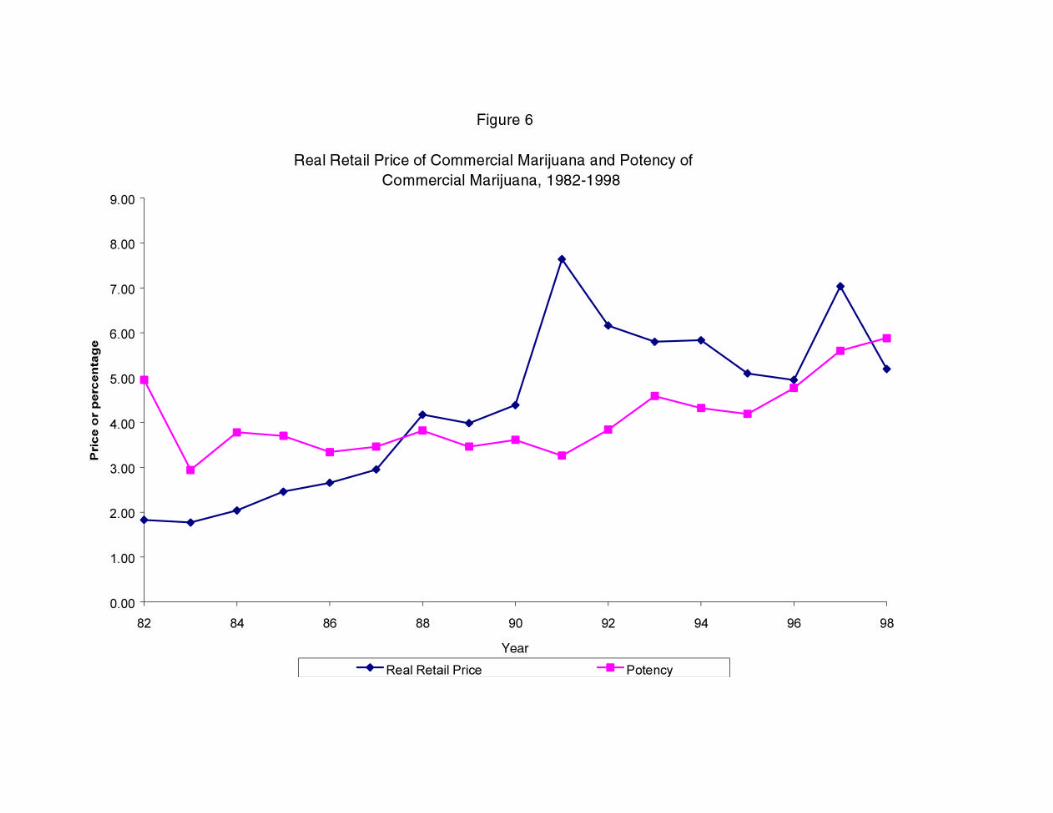
2. PRICE AND POTENCYDEA’s Office of Intelligence or Intelligence Divisions’ publications:Ø The Domestic Cities Report
(1982 – 1985 Q(3)).Ø The Illicit Drug Wholesale/Retail Price Report
(1985 Q4 - 1990).Ø Illicit Drug Price/Purity Report (IDPPR)
(1991- 1998).
! Descriptive statistics on these variables are recorded in Table 1.
! Trends in data can be seen in Figures 5 & 6.
TIME SERIES ANALYSIS
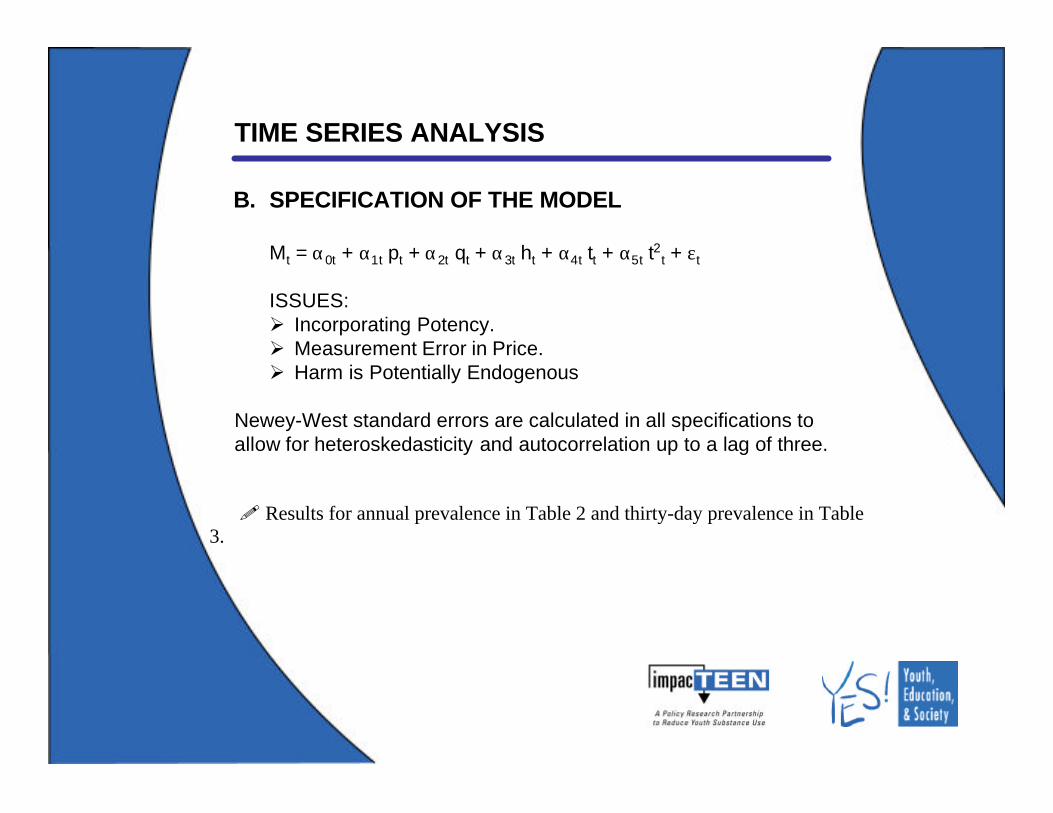
B. SPECIFICATION OF THE MODEL
Mt = α0t + α1t pt + α2t qt + α3t ht + α4t tt + α5t t2t + εt
ISSUES:Ø Incorporating Potency.Ø Measurement Error in Price.Ø Harm is Potentially Endogenous
Newey-West standard errors are calculated in all specifications toallow for heteroskedasticity and autocorrelation up to a lag of three.
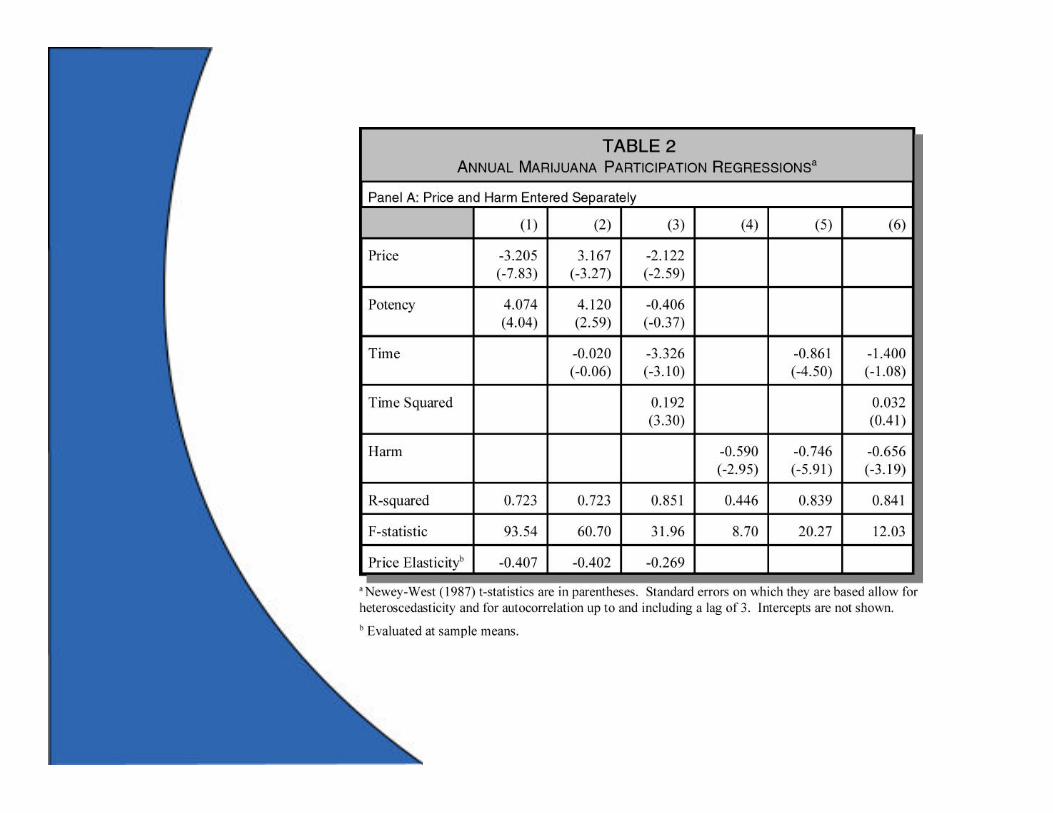
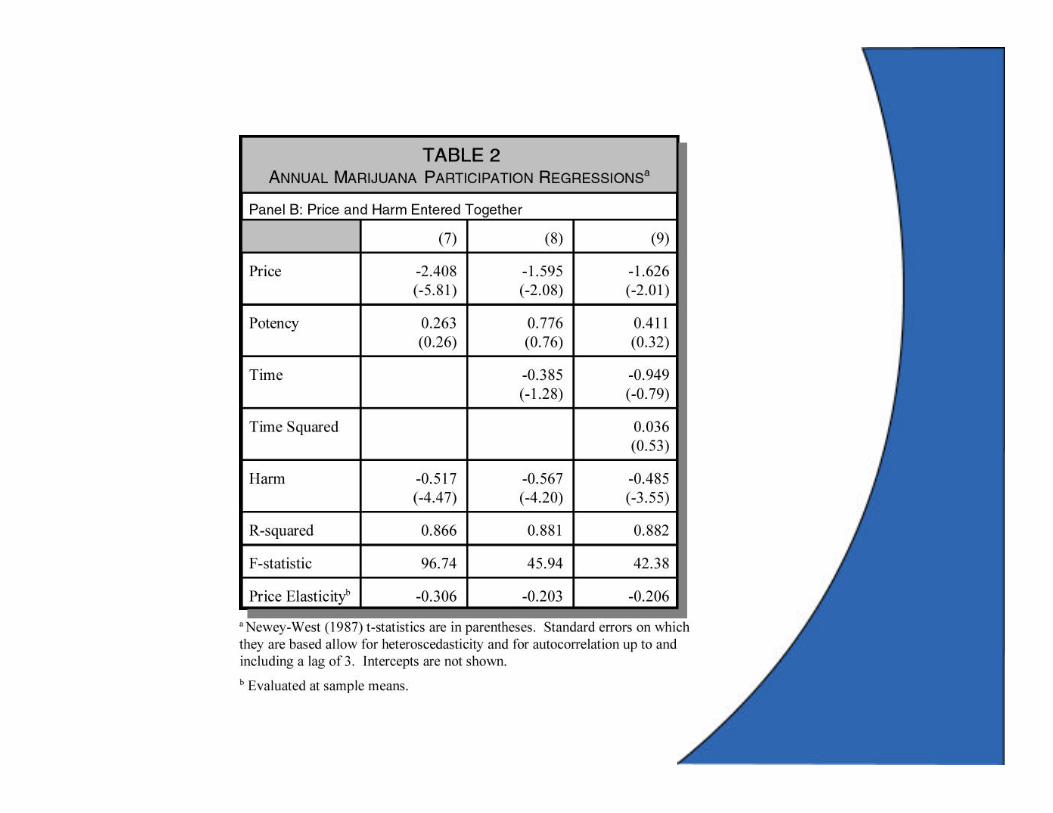
! Results for annual prevalence in Table 2 and thirty-day prevalence in Table3.
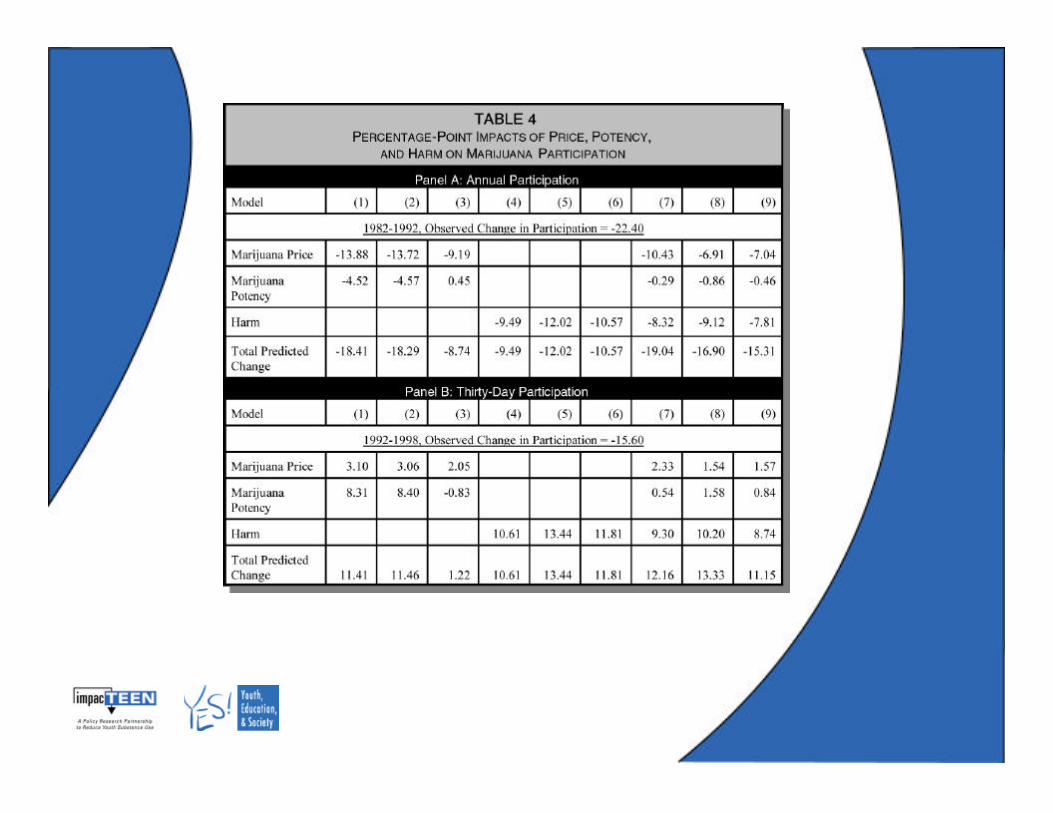
IMPLICATION OF TIME SERIES ANALYSES
Ø Quality adjusted real price and perceived harm are bothimportant factors explaining trends in marijuana use overtime.
Ø How important are price and perceived harm incontemporaneous demand analyses?
ImpacTeen and YES! are part of Bridging the Gap: Research Informing Practicefor Healthy Youth Behavior, supported by the Robert Wood Johnson Foundation.
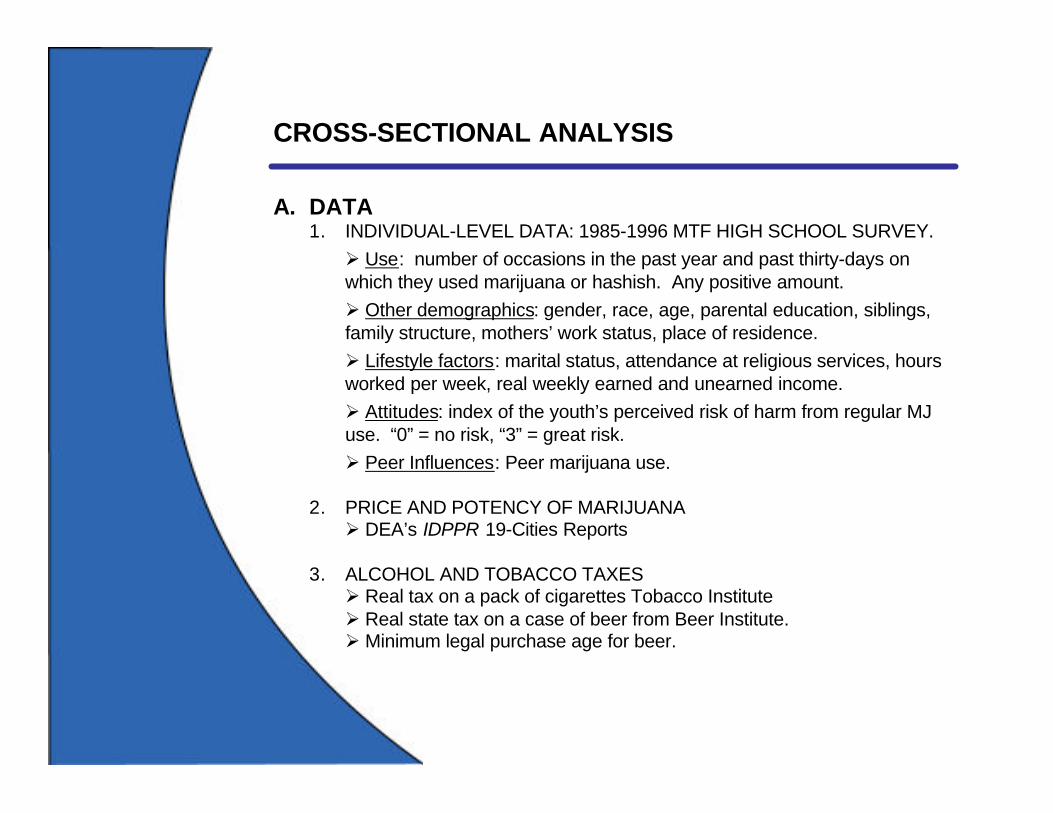
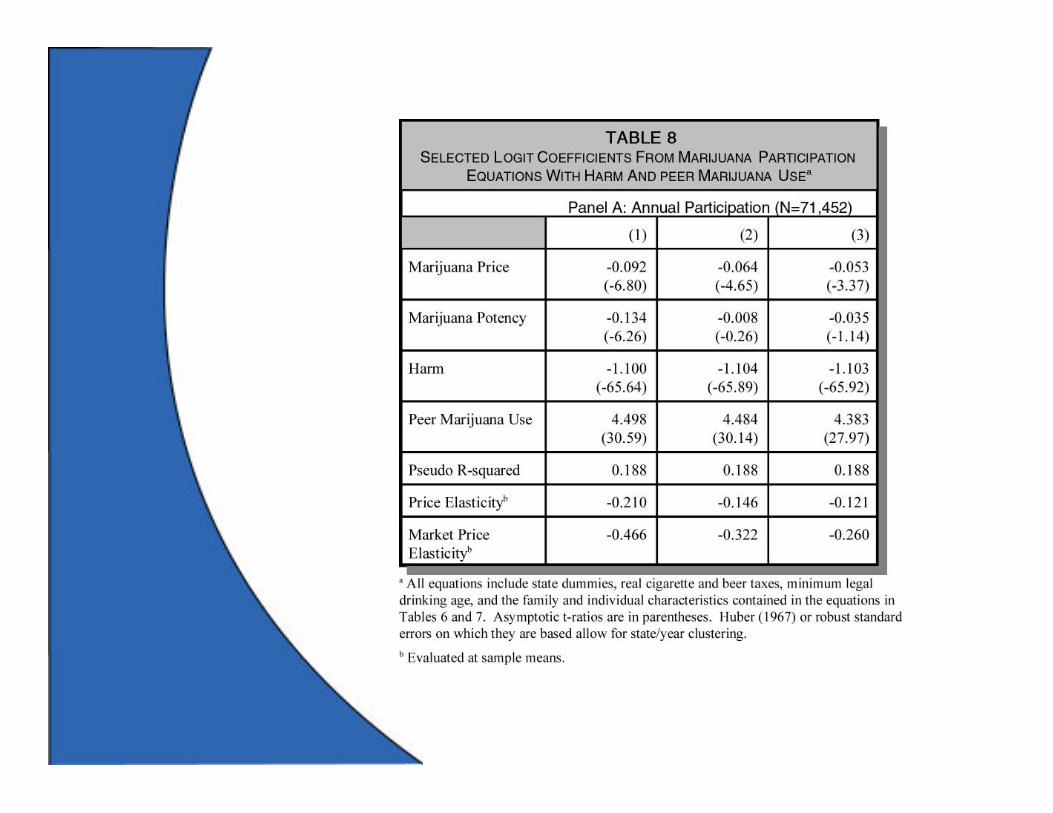
CROSS-SECTIONAL ANALYSIS
A. DATA1. INDIVIDUAL-LEVEL DATA: 1985-1996 MTF HIGH SCHOOL SURVEY.Ø Use: number of occasions in the past year and past thirty-days onwhich they used marijuana or hashish. Any positive amount.Ø Other demographics: gender, race, age, parental education, siblings,family structure, mothers’ work status, place of residence.Ø Lifestyle factors: marital status, attendance at religious services, hoursworked per week, real weekly earned and unearned income.Ø Attitudes: index of the youth’s perceived risk of harm from regular MJuse. “0” = no risk, “3” = great risk.Ø Peer Influences: Peer marijuana use.
2. PRICE AND POTENCY OF MARIJUANAØ DEA’s IDPPR 19-Cities Reports
3. ALCOHOL AND TOBACCO TAXESØ Real tax on a pack of cigarettes Tobacco InstituteØ Real state tax on a case of beer from Beer Institute.Ø Minimum legal purchase age for beer.
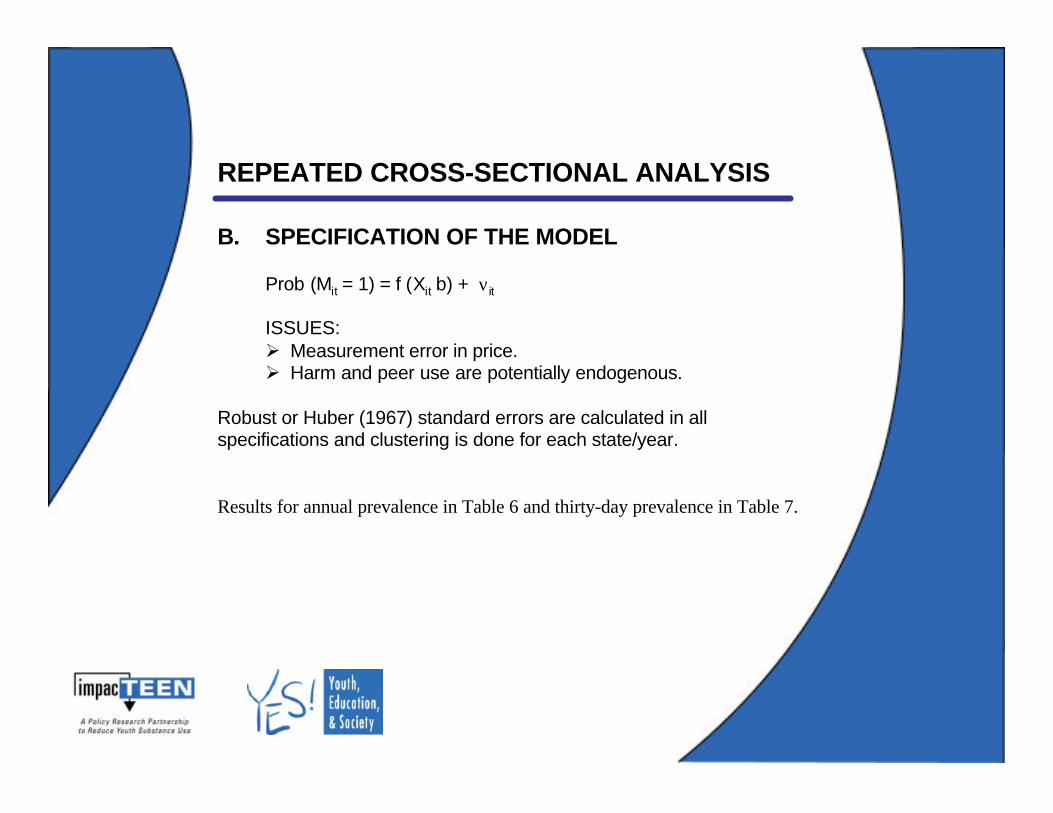
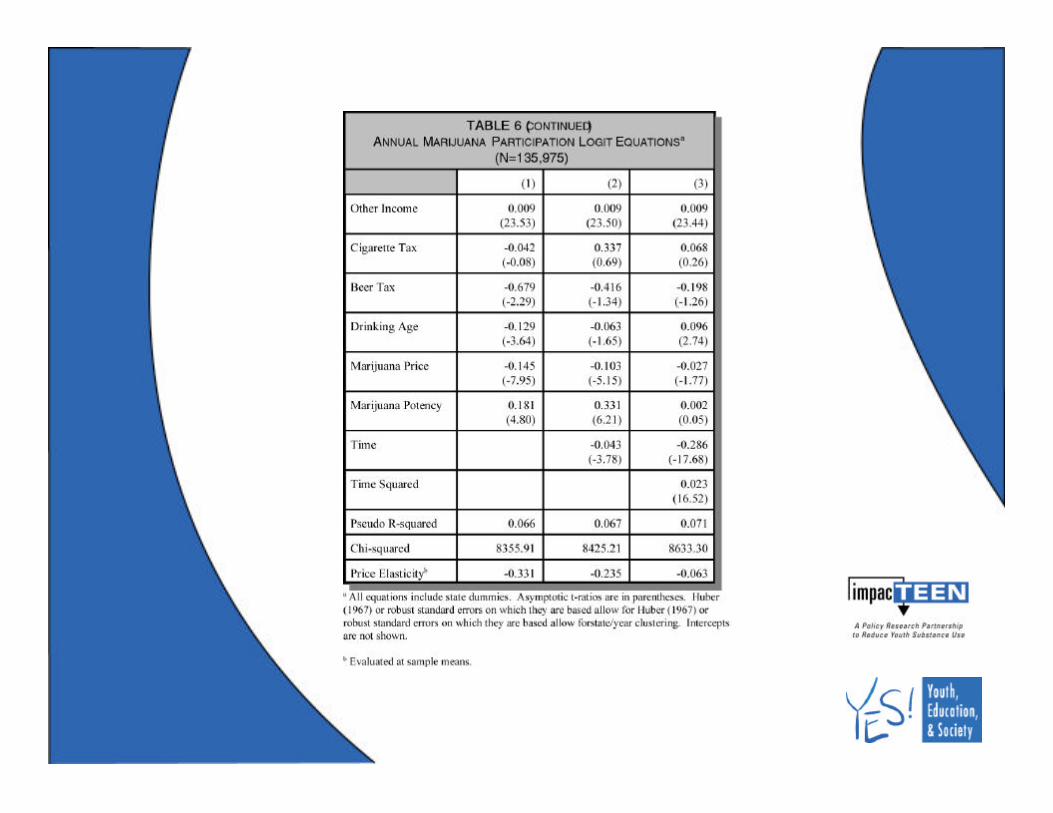
REPEATED CROSS-SECTIONAL ANALYSIS
B. SPECIFICATION OF THE MODEL
Prob (Mit = 1) = f (Xit b) + νit
ISSUES:Ø Measurement error in price.Ø Harm and peer use are potentially endogenous.
Robust or Huber (1967) standard errors are calculated in allspecifications and clustering is done for each state/year.
Results for annual prevalence in Table 6 and thirty-day prevalence in Table 7.
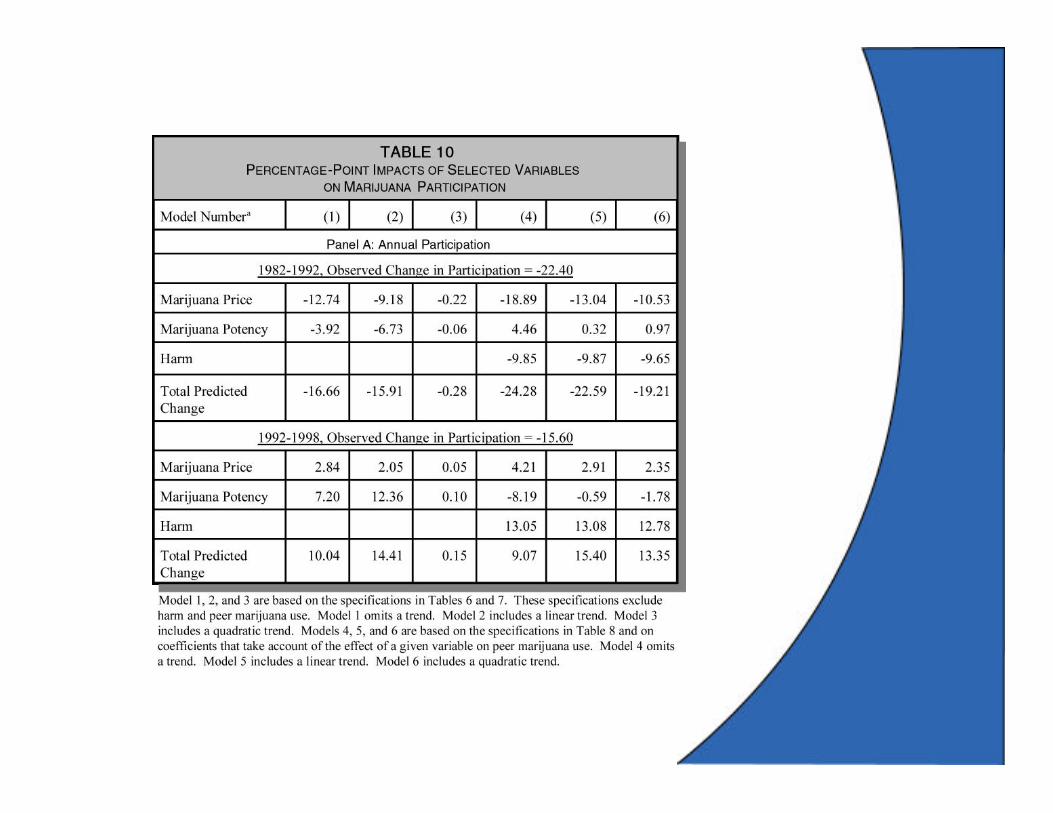
CONCLUSIONS AND POLICY IMPLICATIONS
Ø Like attitudinal variables, price is an important determinant of both the contemporaneous demand for marijuana as well as the trend in marijuana over time, although movements in price do a better job predicting downward trends in use than they do upturns in use.
Ø Given the findings and limitations of these models, we believe a conservative lower-bound estimate of the elasticity of demand for MJ participation among high school seniors is –0.30.
Ø Supply side policies that effectively raise the quality-adjusted price of marijuana will be successful at reducing marijuana use over time.
Research for this paper was supported by grants from the Robert Wood Johnson Foundation to the University of Illinois at Chicago and the University of Michigan, under the Bridging the Gap
Initiative, and a grant from the National Institute on Drug Abuse to RAND (R01 DA12724-01).