Embed Size (px)
Citation preview
National Marine Environmental Monitoring Center, SOA
Brussels, Belgium June 02, 2017
Juying Wang, Weiwei Zhang, Jingli Mu
Marine Debris (micro- & macro-)
Monitoring and Research in China

National Marine Environmental Monitoring Center, SOA
Contents
Conclusions
Governance to Marine Debris1
4
3
2 MD Monitoring Program in China
MPs Research in China

National Marine Environmental Monitoring Center, SOA
Marine debris is present in all marine habitats, from
densely populated regions to remote points far from
human activities.

National Marine Environmental Monitoring Center, SOA
Global Governance
• UNCLOS, Basel Convention on the Control of Transboundary Movements of
Hazardous Wastes and Their Disposal
• UNEP: Global Partnership of Marine Litter (GPML)
• SDG 14

National Marine Environmental Monitoring Center, SOA
EU Marine Strategy Framework Directive
• Came into force in 2008, Aimed at achieving a good
ecological status of marine water in 2020
1. Biological diversity
2. Non-indigenous species introduced by human activities
3. Pressure by fisheries
4. Productivity of marine food web
5. Eutrophication
6. Sea floor integritity
7. Hydrographic alterations
8. Contaminant concentrations in water and sediment
9. Contaminant concentrations in seafood for human consumption
10. Marine litter
11.Introduction of energy (thermal energy, EMF and light) and noise
http://ec.europa.eu/environment/marine/eu-coast-and-marine-policy/marine-
strategy-framework-directive/index_en.htm

National Marine Environmental Monitoring Center, SOA
National Policy Framework in China Environmental Protection Law of the People’s Republic of China
Marine Environmental Protection Law of the People’s Republic of China
Law of the People's Republic of China on Prevention and Control of Water Pollution
Law of the People's Republic of China on Prevention and Control of Environmental
Pollution by Solid Wastes
Regulations Concerning the Prevention and Cure of Pollution Damage of Marine
Environment by Pollutants from Land
Regulations Concerning the Management of Marine Dumping
Regulations Concerning the Prevention and Cure of Pollution Damage of Marine
Environment by Seashore Construction Project
Regulations on Prevention of Environment Pollution by Marine Oil Exploitation and
Development
Regulations Concerning the Prevention of Pollution of Sea Areas by Vessels
Regulations on Prevention of Environment Pollution by Ship Scraping
…… To strictly manage solid wastes, control marine debris
input from both the land and sea based activities
National Marine Environmental Monitoring Center, SOA
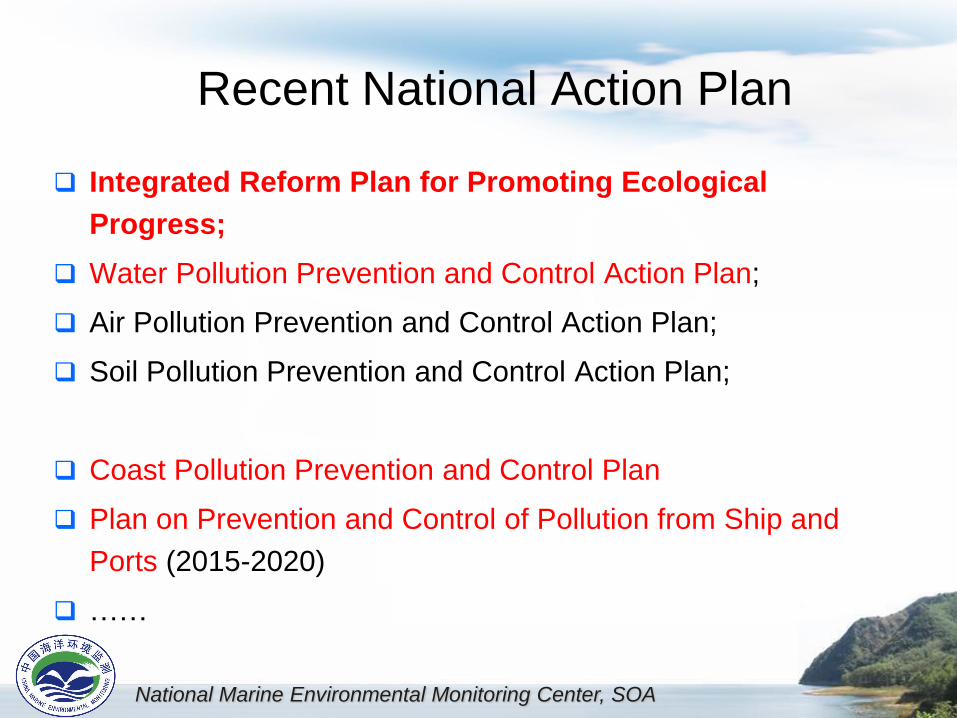
Recent National Action Plan
Integrated Reform Plan for Promoting Ecological
Progress;
Water Pollution Prevention and Control Action Plan;
Air Pollution Prevention and Control Action Plan;
Soil Pollution Prevention and Control Action Plan;
Coast Pollution Prevention and Control Plan
Plan on Prevention and Control of Pollution from Ship and
Ports (2015-2020)
……
National Marine Environmental Monitoring Center, SOA
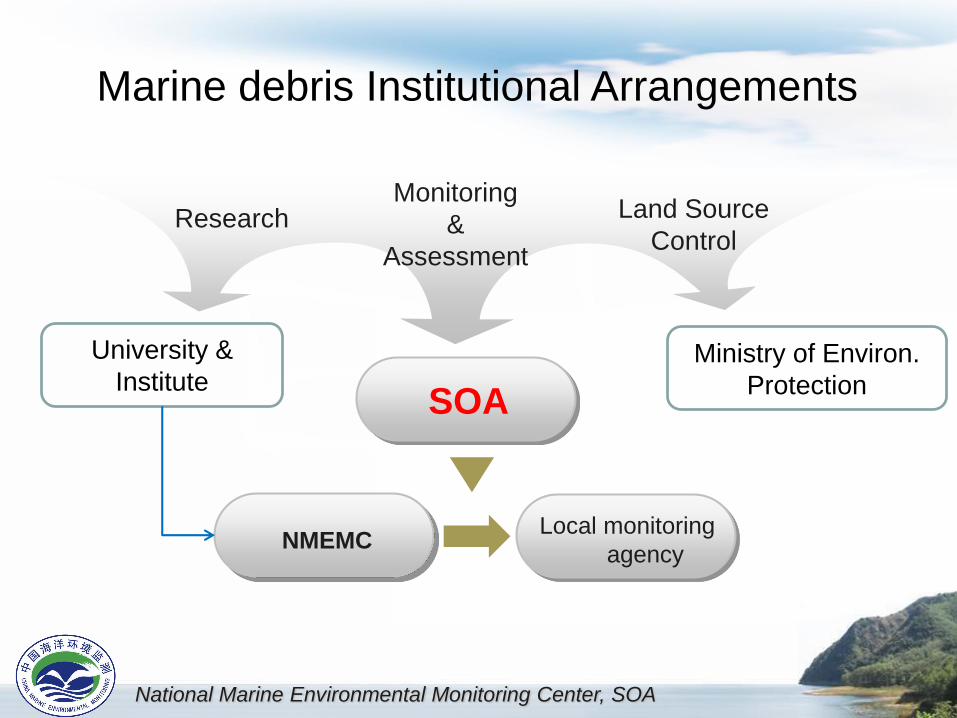
Marine debris Institutional Arrangements
Ministry of Environ.
Protection
University &
InstituteSOA
NMEMC
ResearchMonitoring
&
Assessment
Land Source
Control
Local monitoring
agency

Macro-debris: being
commenced since 2007.
2. SOA’s Marine Debris Monitoring Program
2017 Micro-debris: being
commenced since 2016
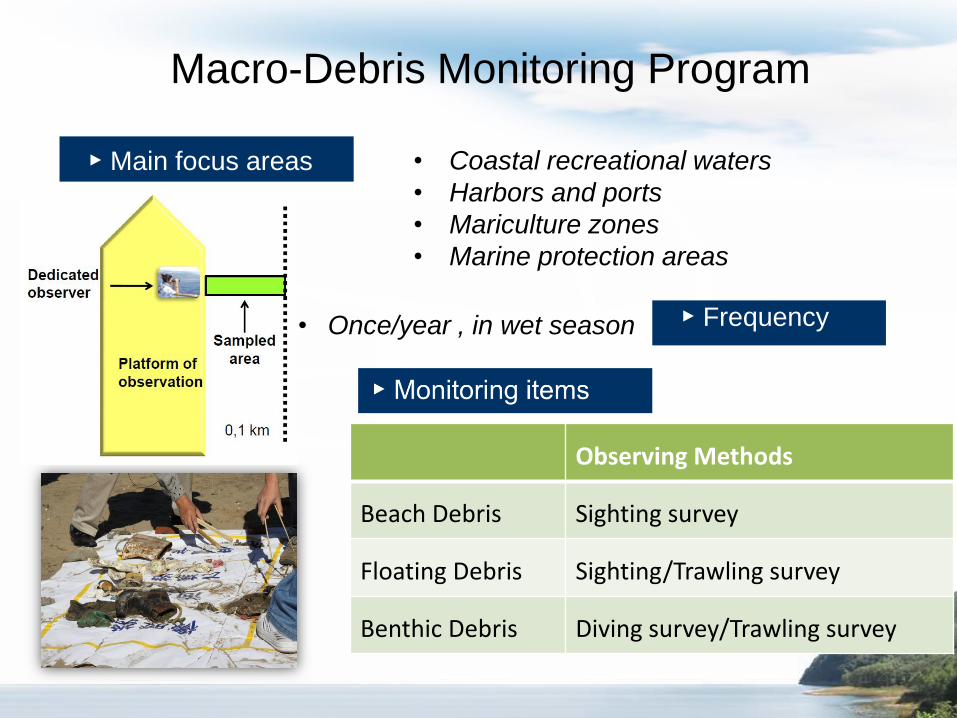
• Once/year , in wet season
Macro-Debris Monitoring Program
▶ Main focus areas • Coastal recreational waters
• Harbors and ports
• Mariculture zones
• Marine protection areas
▶ Frequency
Observing Methods
Beach Debris Sighting survey
Floating Debris Sighting/Trawling survey
Benthic Debris Diving survey/Trawling survey
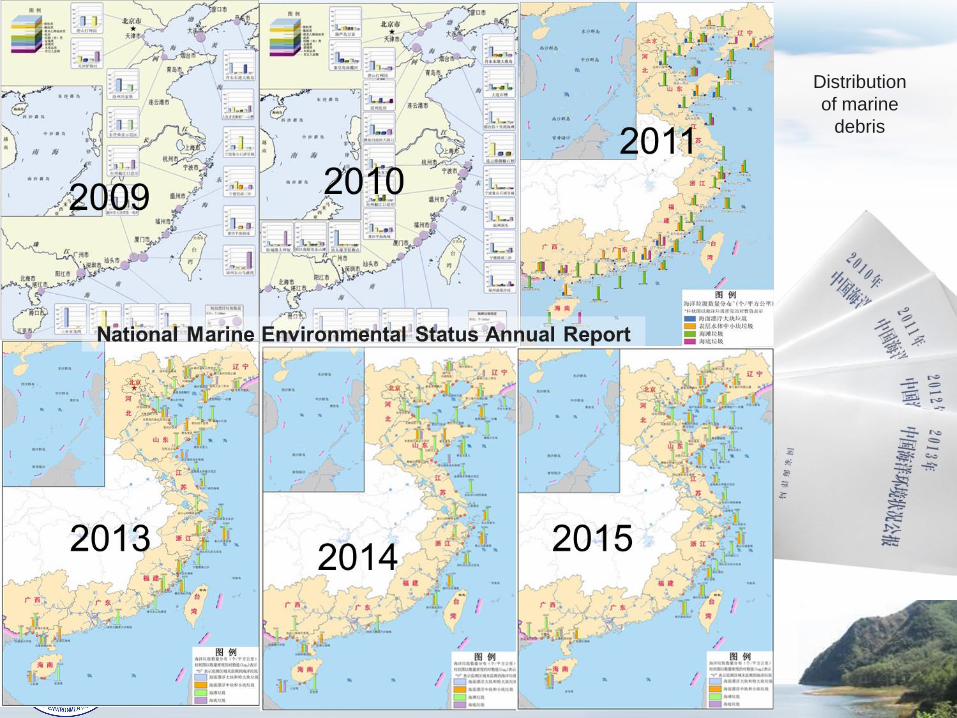
National Marine Environmental Monitoring Center, SOA
Distribution
of marine
debris

National Marine Environmental Monitoring Center, SOA
Macro-Debris In 2016
Floating: 2 284 items/km2, 62 kg /km2;
Beach: 69 203 items/km2 , 1 105 kg /km2;
Seafloor: 1 325 items/km2, 34 kg/km2;
0% 10% 20% 30% 40% 50% 60% 70%
塑料类
金属类
聚苯乙烯泡沫类
橡胶类
玻璃类
织物类
纸类
木制品类
其他
海底垃圾
海滩垃圾
海面漂浮垃圾

National Marine Environmental Monitoring Center, SOA
0
10
20
30
40
2007年 2008年 2009年 2010年 2011年 2012年 2013年 2014年 2015年 2016年
数量密度(个
/平方公里)
(a)大块和特大块漂浮垃圾密度
0
2000
4000
6000
8000
2007年 2008年 2009年 2010年 2011年 2012年 2013年 2014年 2015年 2016年
数量密度(个
/平方公里)
(b)中块和小块漂浮垃圾密度
0
25000
50000
75000
100000
2007年 2008年 2009年 2010年 2011年 2012年 2013年 2014年 2015年 2016年
数量密度(个
/平方公里)
(c)海滩垃圾密度
0
1000
2000
3000
4000
2007年 2008年 2009年 2010年 2011年 2012年 2013年 2014年 2015年 2016年
数量密度(个
/平方公里)
(d)海底垃圾密度
Mega Floating Debris Macro Floating Debris
Sea Floor DebrisBeach Debris
Debris Abundance from 2007 to 2016 in China
National Marine Environmental Monitoring Center, SOA
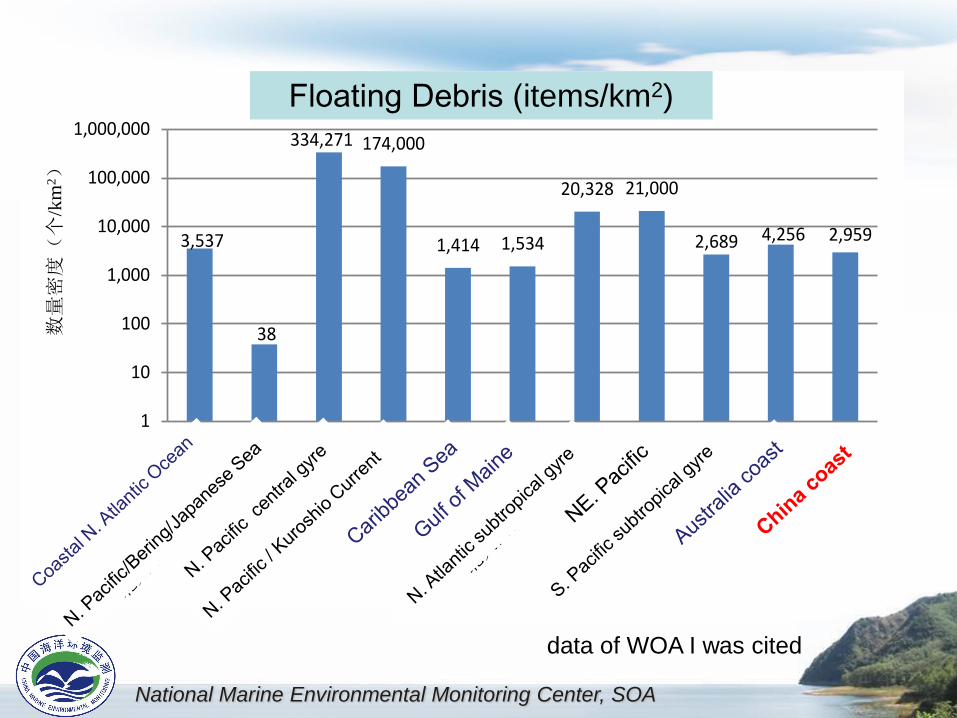
3,537
38
334,271 174,000
1,414 1,534
20,328 21,000
2,689 4,256 2,959
1
10
100
1,000
10,000
100,000
1,000,000
数量密度(个
/km
2)
(a)海水表面漂浮垃圾密度Floating Debris (items/km2)
data of WOA I was cited

National Marine Environmental Monitoring Center, SOA
84
270153
341
2114
570
2800
180
6883
100
6.6
1
10
100
1000
10000
数量
密度
(个
/10
0 m
2)
(b)海滩垃圾密度Beach Debris (items/100 m2)
National Marine Environmental Monitoring Center, SOA
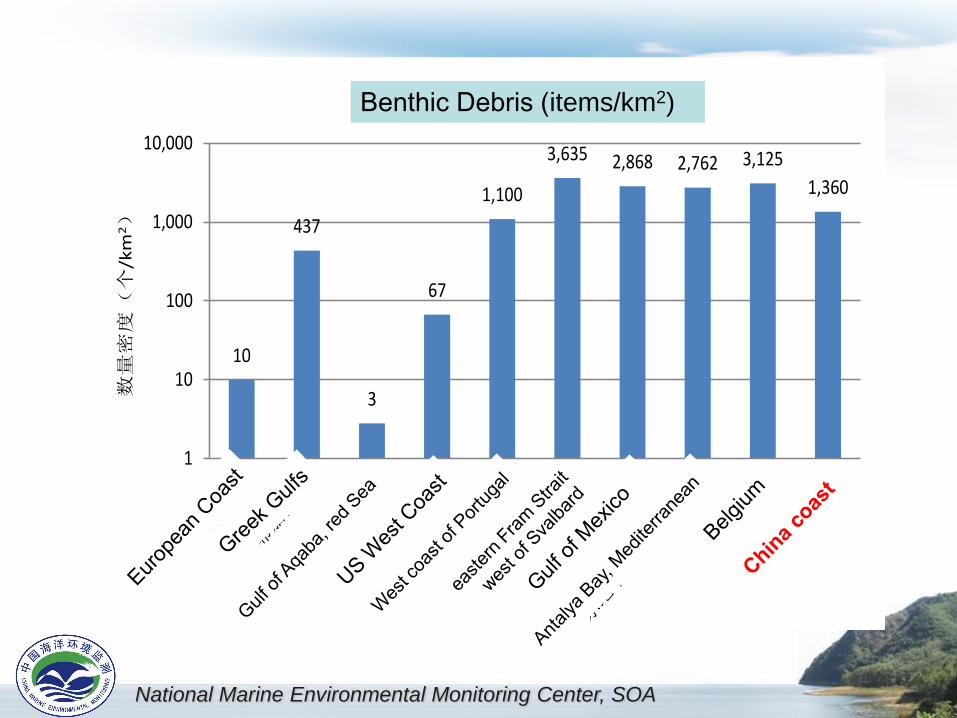
10
437
3
67
1,100
3,635 2,868 2,762 3,125
1,360
1
10
100
1,000
10,000数
量密
度(
个/k
m2)
(c)海底垃圾密度Benthic Debris (items/km2)
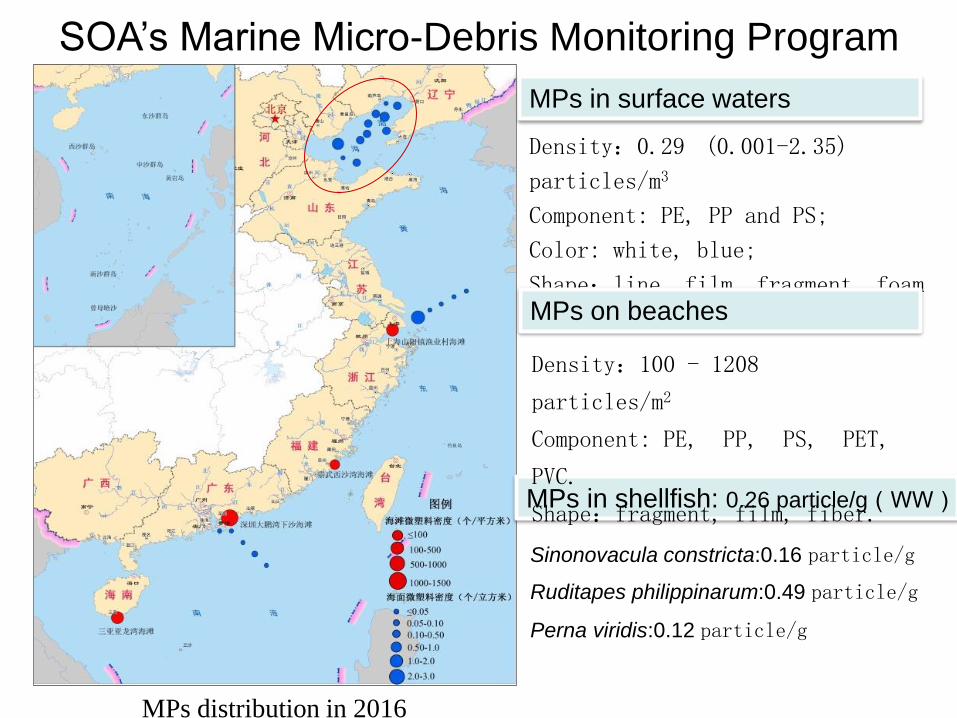
MPs distribution in 2016
Sinonovacula constricta:0.16 particle/g
Ruditapes philippinarum:0.49 particle/g
Perna viridis:0.12 particle/g
Density:0.29 (0.001-2.35)
particles/m3
Component: PE, PP and PS;
Color: white, blue;
Shape:line, film, fragment, foam
spherules.
MPs in surface waters
MPs on beaches
MPs in shellfish: 0.26 particle/g(WW)
Density:100 - 1208
particles/m2
Component: PE, PP, PS, PET,
PVC.
Shape:fragment, film, fiber.
SOA’s Marine Micro-Debris Monitoring Program

National Marine Environmental Monitoring Center, SOA
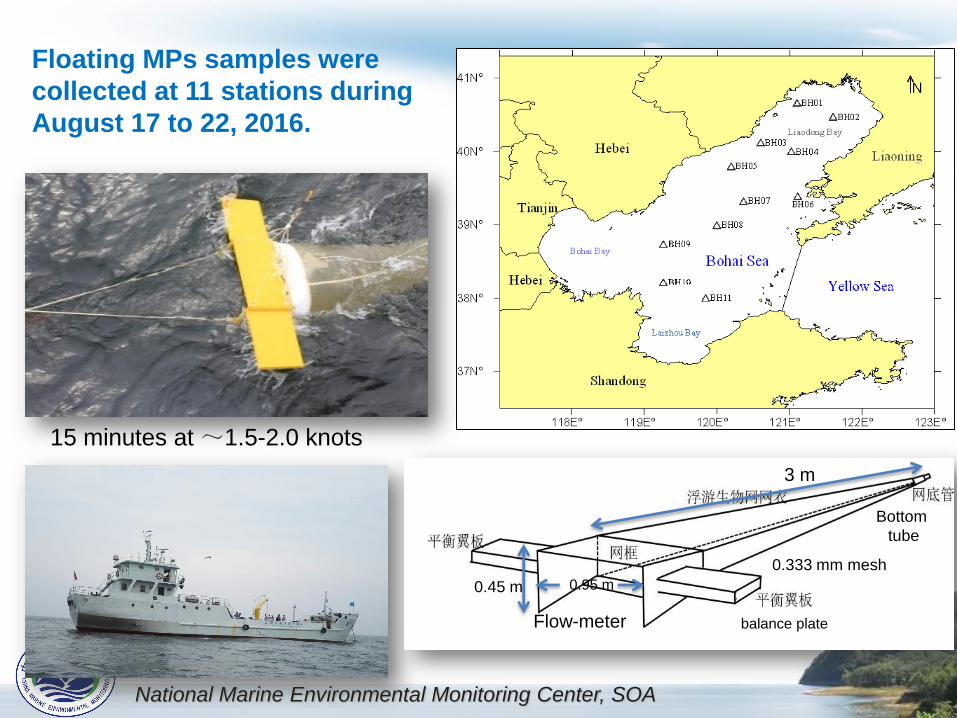
Bohai Sea
The Bohai Sea (BHS) is a shallow semi-enclosed marginal sea of
the NW Pacific, with an area of about 77103 km2, average depth
of 18m, and coastal line length of nearly 3800 km (Sun, 2006).
Low water exchange capacity
National Marine Environmental Monitoring Center, SOA
Floating MPs samples were
collected at 11 stations during
August 17 to 22, 2016.
Bottom
tube
0.333 mm mesh
balance plate
0.95 m0.45 m
Flow-meter
3 m
15 minutes at ~1.5-2.0 knots
National Marine Environmental Monitoring Center, SOA
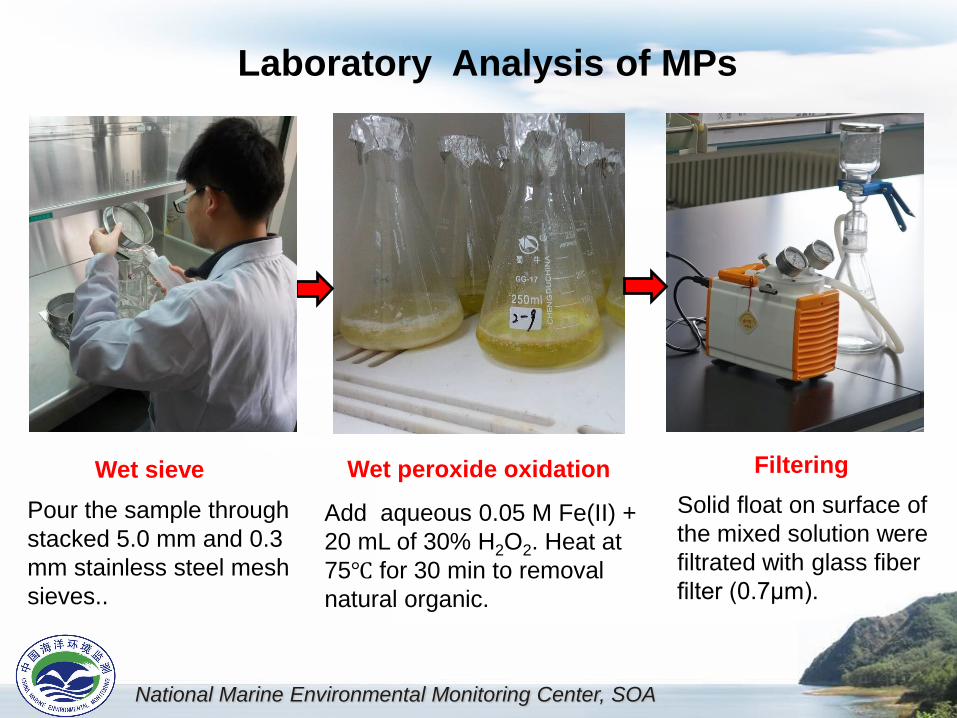
Pour the sample through
stacked 5.0 mm and 0.3
mm stainless steel mesh
sieves..
Solid float on surface of
the mixed solution were
filtrated with glass fiber
filter (0.7μm).
Add aqueous 0.05 M Fe(II) +
20 mL of 30% H2O2. Heat at
75℃ for 30 min to removal
natural organic.
Wet sieve Wet peroxide oxidation Filtering
Laboratory Analysis of MPs

Stereoscopic microscope
Microscope Exam and FTIR Analysis
Fourier Transform Infrared Spectroscopy
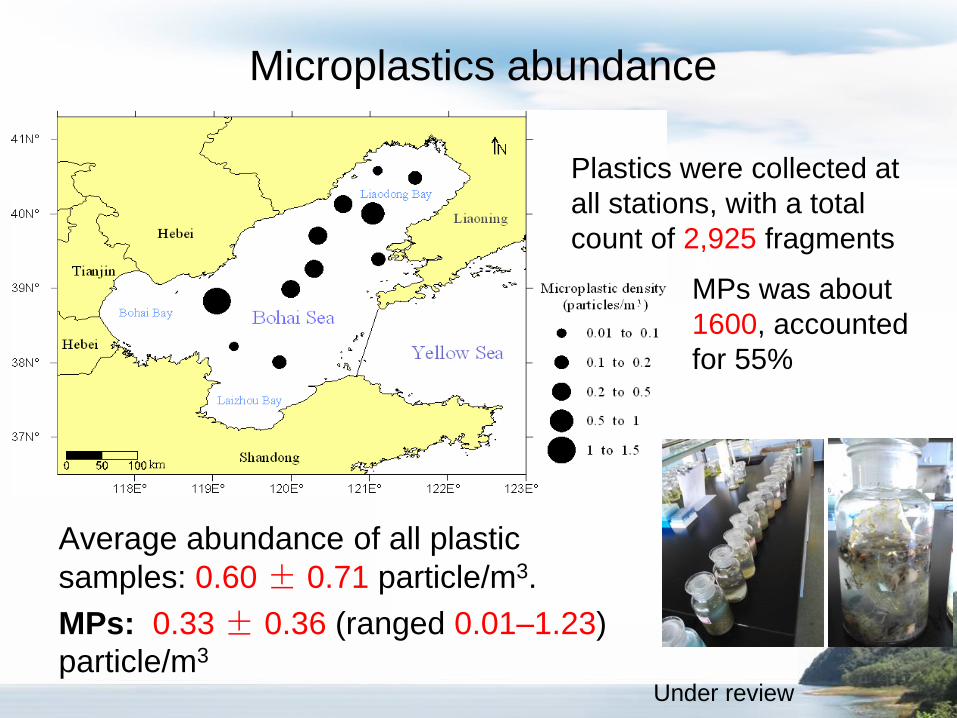
Microplastics abundance
Plastics were collected at
all stations, with a total
count of 2,925 fragments
Average abundance of all plastic
samples: 0.60 ± 0.71 particle/m3.
MPs: 0.33 ± 0.36 (ranged 0.01–1.23)
particle/m3
Under review
MPs was about
1600, accounted
for 55%

National Marine Environmental Monitoring Center, SOA
Map of sampling locations and microplastic abundance along the
north/south transect in the Atlantic Ocean.
Kanhai et al., 2017
ranged from 0 to 8.5 particles m−3, average 1.15 ± 1.45 particles m−3
National Marine Environmental Monitoring Center, SOA
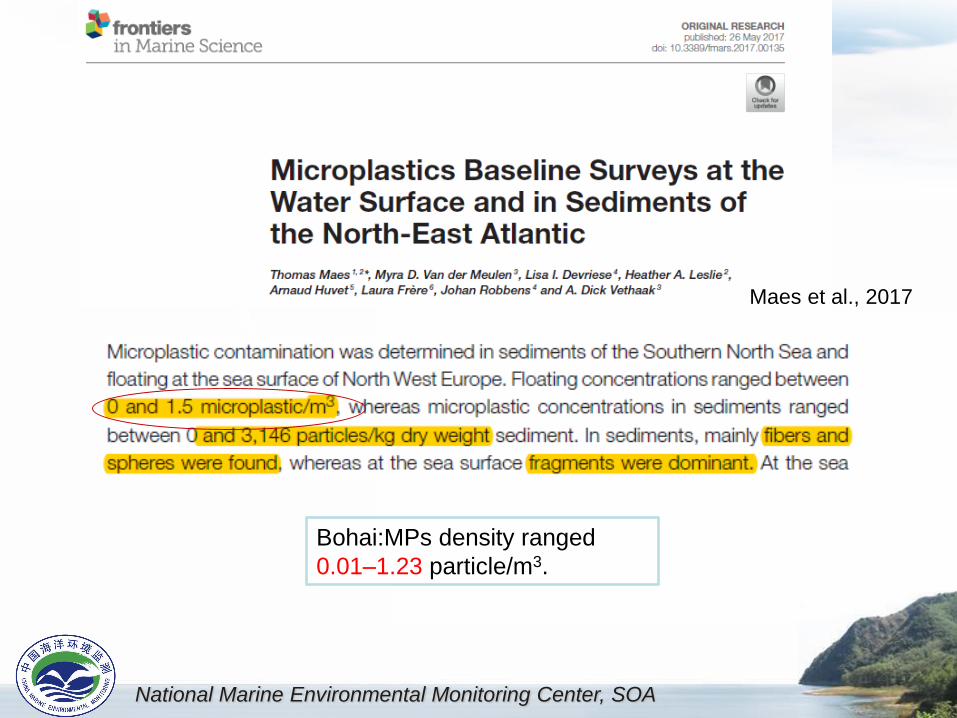
Bohai:MPs density ranged
0.01–1.23 particle/m3.
Maes et al., 2017
National Marine Environmental Monitoring Center, SOA
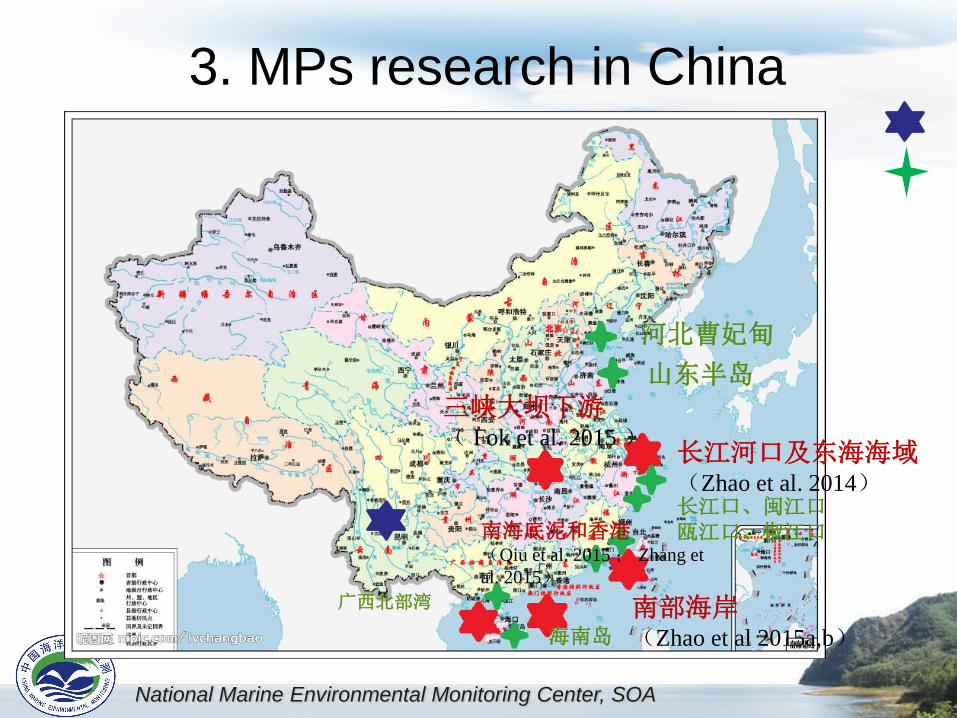
南部海岸(Zhao et al 2015a,b)
三峡大坝下游( Fok et al. 2015 )
长江口、闽江口瓯江口、椒江口
长江河口及东海海域(Zhao et al. 2014)
南海底泥和香港(Qiu et al. 2015 ; Zhang et
al. 2015)
山东半岛
河北曹妃甸
海南岛
广西北部湾
3. MPs research in China


National Marine Environmental Monitoring Center, SOA
0.167±0.138 n/m3
680.0 ± 284.6 nm3
955.6 ± 848.7 n/m3
1245.8 ± 531.5 n/m3
MP in Surface Water
MP abundance:
4137.3 ± 2461.5 n/m3
Zhao et al.,2014; 2015
National Marine Environmental Monitoring Center, SOA
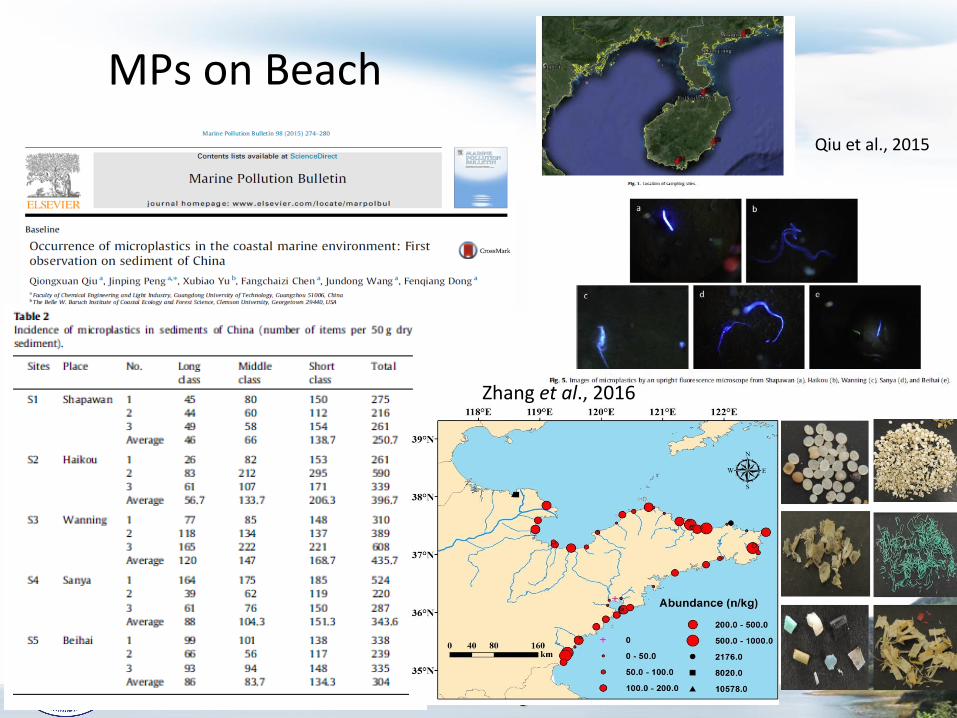
MPs on Beach
Qiu et al., 2015
Zhang et al., 2016
National Marine Environmental Monitoring Center, SOA
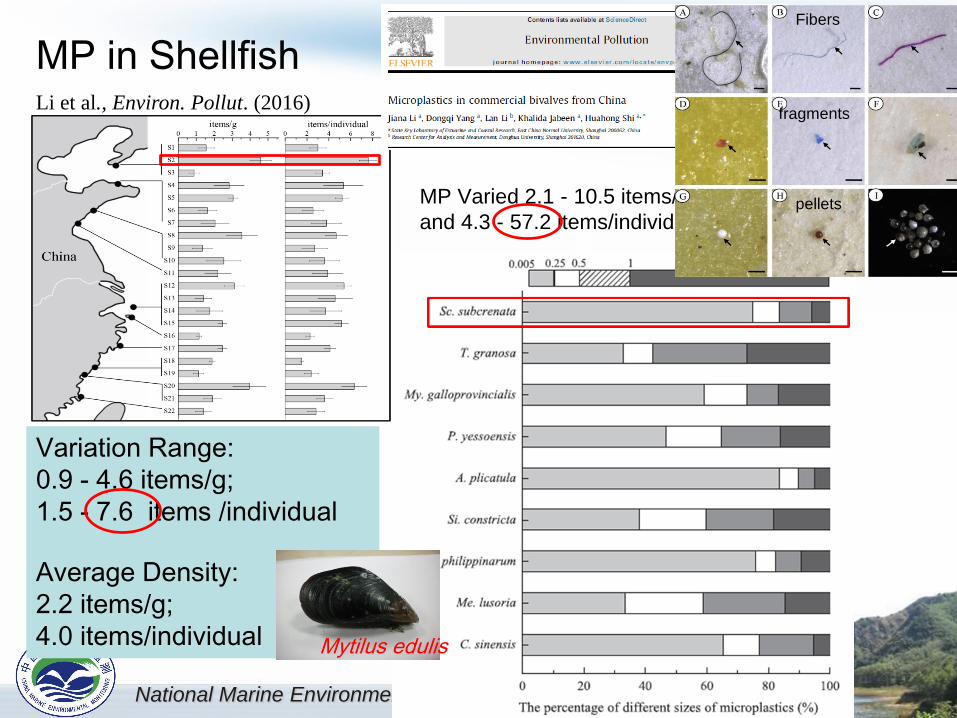
MP in Shellfish
Variation Range:
0.9 - 4.6 items/g;
1.5 - 7.6 items /individual
Average Density:
2.2 items/g;
4.0 items/individual
Li et al., Environ. Pollut. (2016)
Mytilus edulis
MP Varied 2.1 - 10.5 items/g
and 4.3 - 57.2 items/individual
Fibers
fragments
pellets
National Marine Environmental Monitoring Center, SOA
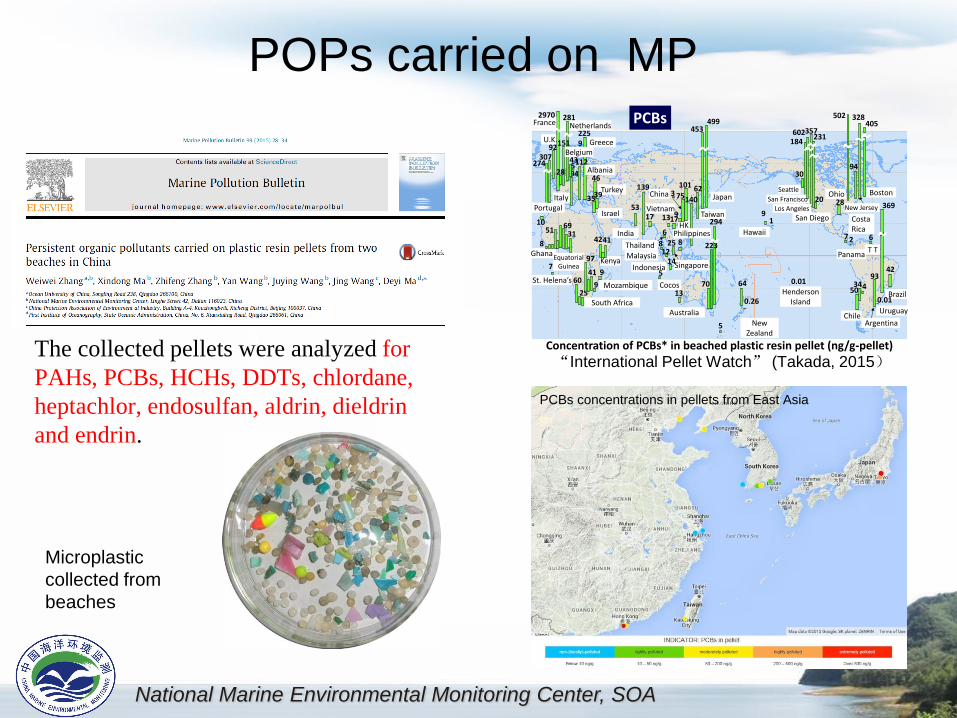
POPs carried on MP
Microplastic
collected from
beaches
“International Pellet Watch” (Takada, 2015)The collected pellets were analyzed for
PAHs, PCBs, HCHs, DDTs, chlordane,
heptachlor, endosulfan, aldrin, dieldrin
and endrin.
499
128
17
94
8 25
913
13
6
Vietnam
Japan
HKIndia
Thailand
Malaysia
Indonesia
Australia
Italy
U.K.
Portugal
South Africa
Mozambique
53
405
Boston
Greece
PCBs
139Turkey
46
453
75
9
101
Singapore
7
Costa Rica
6
4
Chile
T T
30794
Argentina
93
Ghana
Hawaii
62
Taiwan
3China
50
294
14
5
Cocos
369
Brazil
140
Philippines
41 9
25
France
10 1
2
Panama
328
7
St. Helena’s
42
0.01
Uruguay
502
Israel
28
2259
34
5
92
112Albania
17
3935
43
602
San Francisco
30
Seattle
184
9San Diego
357
Los Angeles
231
20
0.01Henderson
Island
Concentration of PCBs* in beached plastic resin pellet (ng/g-pellet)
64
0.26
New Zealand
70
223
Ohio
New Jersey
28274
831
6951
41
Kenya
42
97
60
Equatorial Guinea
2970
151
Netherlands281
Belgium
5
PCBs concentrations in pellets from East Asia

National Marine Environmental Monitoring Center, SOA
Unpublished data
Biologicall effects of MPs
MPs Ingestion of microplastics on copepod Tigriopus japonicus
Photographs of accumulation and egestion of fluorescent polystyrene microspheres in marine medaka

National Marine Environmental Monitoring Center, SOA
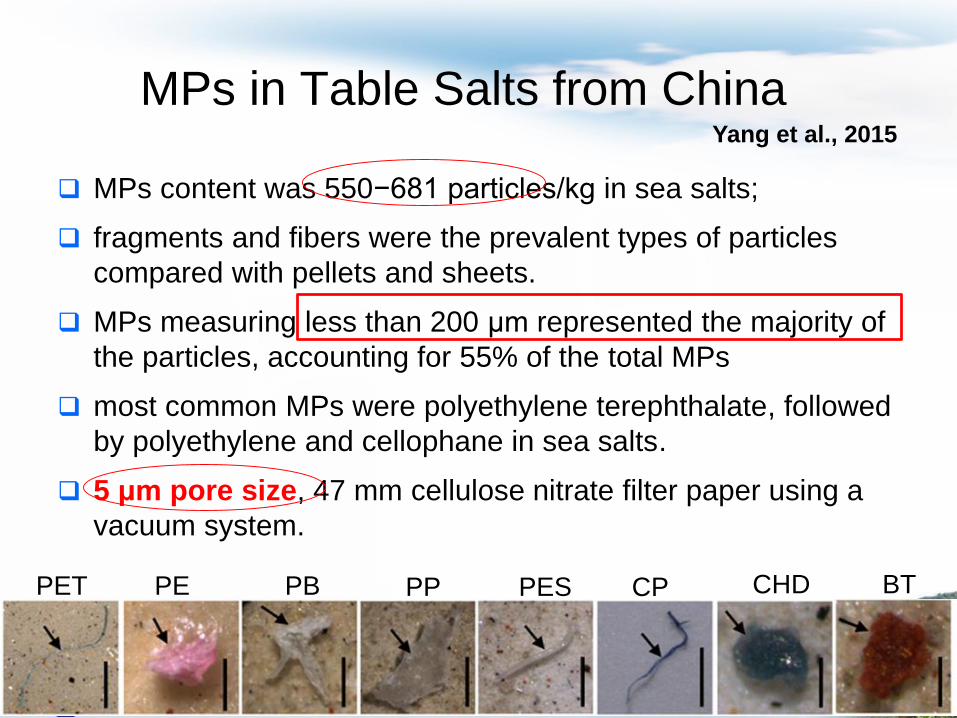
MP in Table saltMPs: 550−681 particles/kg in sea salts;

National Marine Environmental Monitoring Center, SOA
The presence of MP in commercial
salts from different countries
Extracted MP-like particles larger than 149 μm from 17
salt brands originating from 8 different countries;
MP were absent in one brand while others contained
between 1 to 10 MPs/Kg of salt.
Particle size (mean ± SD) was 515 ± 171 μm.
The low level of anthropogenic particles intake from the
salts (maximum 37 particles per individual per annum)
warrants negligible health impacts.
Karami et al., 2017
https://www.nature.com/srep/
149 μm pore size to filter
National Marine Environmental Monitoring Center, SOA
MPs in Table Salts from China
MPs content was 550−681 particles/kg in sea salts;
fragments and fibers were the prevalent types of particles
compared with pellets and sheets.
MPs measuring less than 200 μm represented the majority of
the particles, accounting for 55% of the total MPs
most common MPs were polyethylene terephthalate, followed
by polyethylene and cellophane in sea salts.
5 μm pore size, 47 mm cellulose nitrate filter paper using a
vacuum system.
PET PESPPPBPE CHD BTCP
Yang et al., 2015
National Marine Environmental Monitoring Center, SOA
4. Conclusions
• Governance at local, regional, national, and global scales;
• Rationalization of monitoringDevelop comparable and coherent monitoring
standards and baselines, harmonized protocols
Indicators for monitoring
Intercalibrations between regional and
overlapping indicators species
New approaches for monitoring: automated

National Marine Environmental Monitoring Center, SOA
4. Conclusions
• Research priorityDevelop model for MD transportation:
Accumulation areas, source/fate
Rish assessment: Better understand the environmental consequences of
marco- and micro- MD on wildlife, ecosystem and the
food chain.
Evaluate effects/enable definition of threshold levels.

National Marine Environmental Monitoring Center, SOA
Thanks for your attention!

National Marine Environmental Monitoring Center, SOA
Location item/m3 Reference
N. Pacific SG 32.76 Goldstein et al., 2012
N. Pacific G 2.23 Moore et al., 2001
N. Pacific offshore 0.43-2.23 Moore et al., 2005
N. Pacific inshore 5-7.25 Moore et al., 2005
Southern Californian 3.92 Lattin et al., 2004
East Asian Seas 3.7 Isobe et al., 2015
NE Atlantic 2.46 Lusher et al., 2014
N. Atlantic
(accumulation area)1.7 Reisser et al., 2015
Italian Coast 0.62 Fossi et al., 2012
Plymouth, UK <0.04 Thompson et al., 2004
Seto Inland sea 0.39 Isobe et al., 2014
Bohai Sea 0.33 Our study
Arctic polar waters 0.34 Lusher et al., 2015
East China Sea 0.167 Zhao et al., 2014
Mediterranean Sea 0.15 De Lucia et al., 2014
N. Pacific 0.12 Goldstein et al., 2012
Southern Oceans 0.099 Isobe et al., 2016
Area Refer
ences
Analysis
/Concentration
Taihu
Lake,China
Su et
al.,2016
Plankton net samples:
0.01×10⁶ ~ 6.8×10⁶
n/km2
Surface water:3.4 ~ 25.8 items/L
Three
Gorges
Dam,
China
Zhang
et al.,2015
Main stream: 3407.7
×103 to 13,617.5 ×103
n/km2
Tributary: 192.5 ×10³ to
11,889.7 ×103 n/km2
Yangtze
Estuary,
Zhao et
al.,2014
4137.3 ± 2461.5 n/m3
Estuaries, China
Zhao et
al.,2015
Jiaojiang:955.6 ± 848.7 n/m3
Oujiang:680.0 ± 284.6 n/m3
Minjiang:1245.8 ± 531.5 n/m3
MP in Surface Water

National Marine Environmental Monitoring Center, SOA
Location Microplastic abundance(particles per m3)
Method for surface waters (unless otherwise indicated)
Study
Arctic Ocean
Svalbard, Norway 0.34 ± 0.31; 0–1.31 (mean, range)2.68 ± 2.95; 0–11.5 (mean, range)
Manta trawl (333 μm)Underway system (250 μm)a
Lusher et al. (2015)1
Pacific Ocean
Southern California, USA 7.25 (mean) Manta trawl (333 μm) Moore et al. (2002)
Santa Monica Bay, USA 3.92 (mean) Manta net (333 μm) Lattin et al. (2004)
South Californian current 0–3.141 Manta net (505 μm) Gilfillan et al. (2009)
Southeast Bering Sea 0.004–0.19 Sameoto neuston/manta net (505 μm) Doyle et al. (2011)
NP Subtropical Gyre 0.425 (median) Manta net (333 μm) Goldstein et al. (2012)
North eastern Pacific Ocean 279 ± 178 (mean) Underway system (62.5–250 μm)a Desforges et al. (2014)2
Geoje Island, South Korea 0.4–54 Manta trawl (330 μm) Song et al. (2014)
East China Sea 0.167 ± 0.138 (mean) Neuston net (333 μm) Zhao et al. (2014)
Southern Sea of Korea 1.92–5.51; 2.3–38.77 (2012)
582–924; 10–375 (2013)Manta trawl (330 μm) Hand Net (50 μm)
Kang et al. (2015a)
Geoje and Jinhae Bays, Korea 1.92 ± 1.84; 5.51 ± 11.2 (2012)1.68 ± 0.81; 1.07 ± 0.34 (2013)
Manta Trawl (330 μm) Kang et al. (2015b)
East Asian Sea 3.7 ± 10.4; 0.03–491 (mean, range) Neuston net (350 μm) Isobe et al. (2015)
Indian Ocean
Southeast South Africa 257.9–1215 WP-2 type net (80 μm) Nel and Froneman (2015)
Atlantic Ocean
Bristol Channel, UK 0–100 Lowestoft plankton sampler (270 μm) Morris & Hamilton (1974)
Offshore Ireland 2.46 ± 2.43; 0–22.5 (mean, range) Underway system (250 μm)b Lusher et al. (2014)3
Western English Channel 0.27 Plankton nets (200, 500 μm) Cole et al. (2014)
Portuguese coastal waters 0.002–0.036 WP2 (180 μm), Neuston (280 μm), LH Plankton Recorder (335 μm)
Frias et al. (2014)
St. Peter/St. Paul Archipelago, Brazil 0.01 Plankton net (300 μm) Ivar do Sul et al. (2013)
Western Tropical Atlantic Ocean 0.015–0.04 Manta trawl (300 μm) Ivar do Sul et al. (2014)
North Atlantic Ocean 13–501 Underway system (10, 300 μm)b Enders et al. (2015)4
Atlantic Ocean 1.15 ± 1.45; 0–8.5 (mean, range) Underway system (250 μm)b Kanhai et al.(2017)5
Mediterranean and European Seas
West Coast, Sweden 167–240072–141
Plankton net (80 μm)Zooplankton net (450 μm)
Noren (2007)
West Sardinian Coast 0.15 Manta trawl (500 μm) de Lucia et al. (2014)
Southwest Finland 0–0.74 Manta trawl (333 μm) Magnusson (2014)
Baltic Sea 102–104 WP2 net (90 μm mesh) Gorokhova (2015)

Color
Size
Shape
Component
Plastics in the surface waters of Bohai Sea
Under review
National Marine Environmental Monitoring Center, SOA
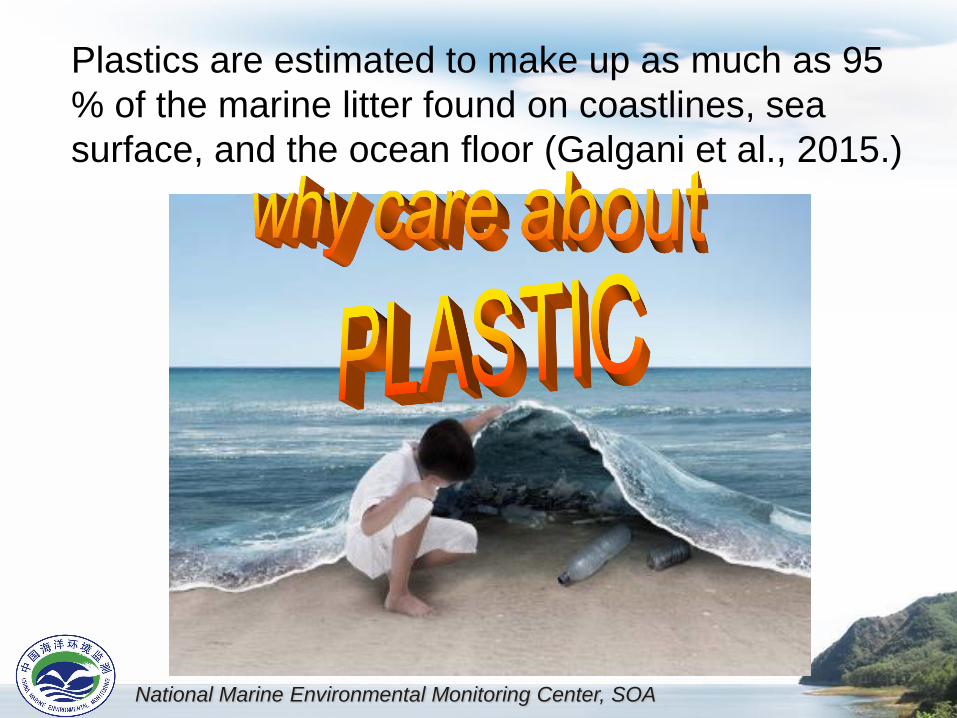
Plastics are estimated to make up as much as 95
% of the marine litter found on coastlines, sea
surface, and the ocean floor (Galgani et al., 2015.)

National Marine Environmental Monitoring Center, SOA
National Marine Environmental Monitoring Center, SOA
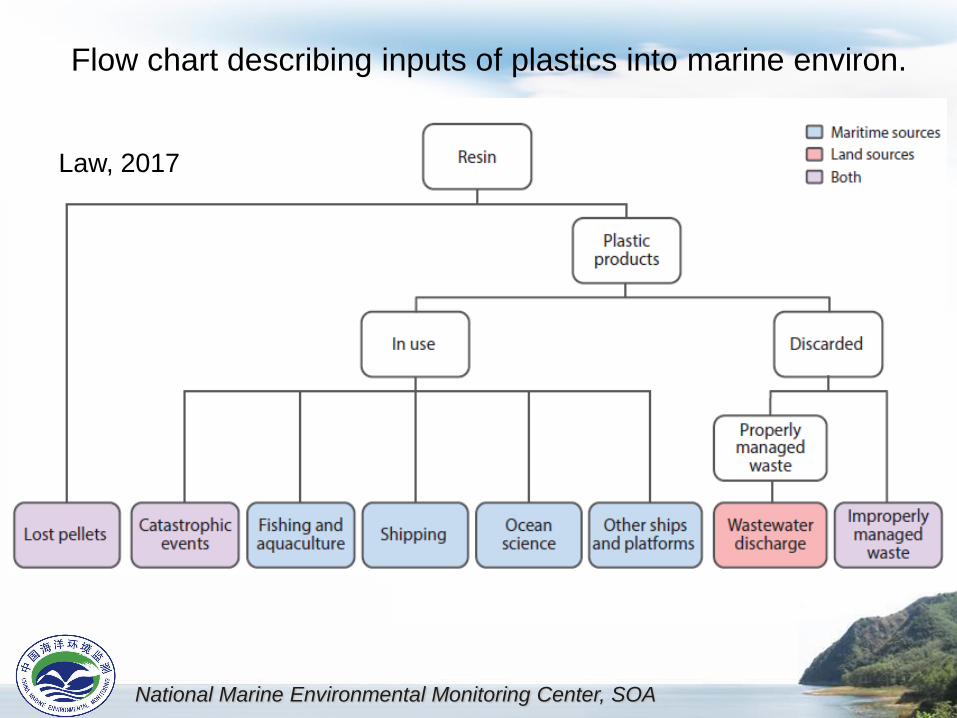
Law, 2017
Flow chart describing inputs of plastics into marine environ.

National Marine Environmental Monitoring Center, SOA
The exact quantity of plastic in the ocean and volumes
entering the ocean from waste generated on land is unknown.
4.8-12.7
million Tons
322

National Marine Environmental Monitoring Center, SOA

National Marine Environmental Monitoring Center, SOA
Macro Micro
National Marine Environmental Monitoring Center, SOA
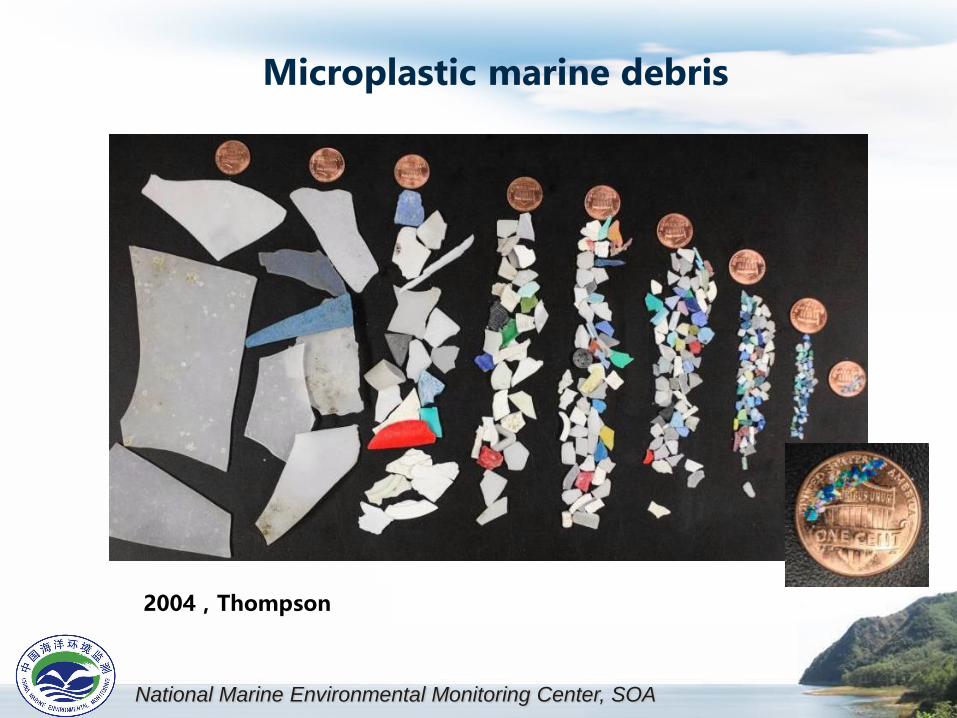
Microplastic marine debris
2004,Thompson
National Marine Environmental Monitoring Center, SOA
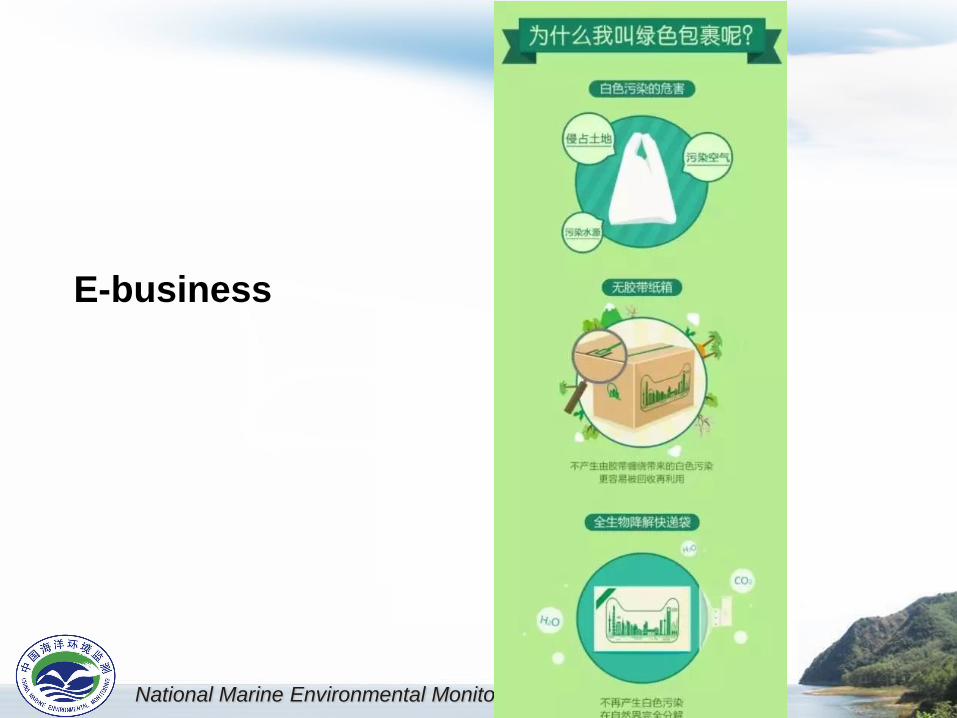
E-business

National Marine Environmental Monitoring Center, SOA
EU: Regional Convention• OSPAR – Convention for the Protection of the
Marine Environment of the North-East Atlantic:– Regional Action Plan in 2014: reduction measures and
targets, taking into consideration an ambitious target resulting in a reduction in 2020.
• 7th EAP and other EU Acquis (e.g. Waste, Port Reception Facilities Directive)
• EU/MSFD- Marine Strategy Framework Directive:– Properties and quantities of marine litter do not cause
harm to the coastal and marine environment.
MSFD is most important legal framework for implementation of measures on Marine Litter.

National Marine Environmental Monitoring Center, SOA
Response To Marine Debris in China
• Strengthening the management to eliminate the use of
plastics products.
• National: Required to limit the use the plastic bags since
Jan. 8, 2008 ;
• Local - Jilin Province, forbid to produce and sale non-
degradable plastics bag and cutlery since Jan. 1st, 2015
• Pushing the recycling and reusing of plastic products.
• Organizing cleaning event to raise awareness.
• Monitoring Marine Debris (Macro- and Micoro-) .