Embed Size (px)
Citation preview

Marine Drive Local Area Plan and Design Guidelines Background Report
April 2017
APPENDIX B

District of West Vancouver2

Marine Drive Local Area Plan and Design Guidelines Background Report 3
Contents
INTRODUCTION 5
1.1 Purpose 5
1.2 History 5
1.3 Study Area 7
1.4 2004OfficialCommunityPlan 8
CONTEXT 11
2.1 Multi-Jurisdictional Context 11
2.2 Housing Context 13
2.3 Transportation Context 14
2.3.1 VehicularTraffic 15
2.3.2 Public Transit 19
2.3.3 Active Transportation 21
2.4 Sustainability Context 22
2.4.1 Land Use and Transportation 25
PROCESS 27
3.1 Context Study 27
3.2 Public Consultation 30
3.3 Revised Context Study 32
3.4 Preparing the Local Area Plan and Design Guidelines 34
1.0
2.0
3.0

District of West Vancouver4
Figure 1.1 - Study area context
STANLEY PARK
VANCOUVER
WEST VANCOUVER
DNV
CNV

Marine Drive Local Area Plan and Design Guidelines Background Report 5
This background report has been prepared to accompany the Marine Drive Local Area Plan and Design Guidelines (the LAP) and provide context and background information. This plan is the first of five Local Area Plans that are anticipated to be included in District of West Vancouver’s updated Official Community Plan (OCP).
The LAP started as a Context Study of the Marine Drive corridor around Park Royal, which was clarified as a Local Area Plan and Design Guidelines in response to Council direction and community input. The planning process included a review of 2004 OCP policies, comprehensive urban design and planning analysis, research into planning best practices and public consultation. The Plan articulates an overall planning and urban design framework for the eastern portion of the Marine Drive corridor, at the gateway to the District of West Vancouver (DWV), and is key to implementing existing District priorities around housing diversity and affordability, and energy and greenhouse gas (GHG) reductions.
Planning work and analysis has been underway for this section of the Marine Drive Corridor since 2012 when the District received a development application at 752 Marine Drive. This application went through planning and design review, public consultation and multiple revisions prior to 2015 when Council requested additional information and analysis to allow for this and other applications in the plan area to be considered within their unique multijurisdictional context. The contextual planning study for the Marine Drive corridor (Park Royal Area) was then endorsed as part of the OCP Review.
The accompanying LAP has been prepared to meet legislated requirements for OCPs. The Province establishes legislative authority and requirements pertaining to municipal OCPs through the Local Government Act (LGA). The LGA stipulates that an OCP “is a statement of objectives and policies to guide decisions on planning and land use management”. There are a number of
1.0 Introduction
1.1 Purpose
1
elements an OCP must address including: the approximatelocation, amount, type and density of residential development required to meet anticipated housing needs, and policies respecting affordable housing, rental housing and special needs housing. OCPs must also include targets for the reduction of GHG emissions in the area covered by the plan, and policies and actions proposed by the local government to achieve these targets. Further context regarding the District’s housing, transportation and sustainability priorities is provided in Section 2.
The LAP covers an approximate 20-year planning horizon. Though much development is anticipated in neighbouring jurisdictions, factors including existing land uses, commercial lease arrangements, ownership, and the age of current structures means that only a handful of DWV sites within the plan area are expected to redevelop over the 20-year planning horizon.
1.2 History

District of West Vancouver6
Figure 1.2 - Study area
TAYL
OR
WAY
LION
`S G
ATE
BRID
GE
study area boundary
MARINE DRIVE
MARINE DRIVE
CAPI
LANO
ROA
D

Marine Drive Local Area Plan and Design Guidelines Background Report 7
AlargeportionofthestudyareaisonSquamishNation land or within the boundary of the DNV (and therefore outside the jurisdiction of the DWV), or part of road infrastructure
Resultantdevelopmentareaandeffectivestudyarea, divided between the Park Royal - Clyde Avenue and Lions Gate - Klahanie sub-areas
1.2 Study Area
1
Twosignificantopenspacefeaturesdefinethestudy area - Klahanie Park and the Capilano River
Overall study area
Figure1.3-Effectivestudyareawhensignificantnaturalandjurisdictionalboundariesareremoved
Park Royal - Clyde Avenue sub-area Lions Gate
- Klahanie sub-area
The study area is focused on lands around the Lions Gate Bridge, extending east and west from the bridgehead to include sites adjacent to and along Marine Drive. The corridor is a busy thoroughfare serving as a major connector between the neighbouring communities of West Vancouver, the Squamish Nation, and North Vancouver, as well as the primary access to the Lions Gate Bridge and Vancouver beyond. The area’s most important natural feature, the Capilano River, bisects the plan area and provides an amenity for local residents. Adjacent to the river is Klahanie Park, which includes sports facilities as well as treed access to the river’s edge. The study area has been split into two sub-areas to acknowledge the different jurisdictions and contexts on either side of the Lions Gate bridgehead.
In the Lions Gate - Klahanie sub-area, a high density mixed-use village centre is being developed around the intersection of Capilano Road and Marine Drive as per the District of North Vancouver’s (DNV) Lions Gate Town Centre Plan, providing the planning context for the broader area and marking the easternmost edge of DWV. The Park Royal - Clyde Avenue sub-area extends to the Park Royal Shopping Centre, an expanding destination retail and shopping experience set amidst an outdoor, walkable, pedestrian environment. The majority of Park Royal South and Park Royal Village are located on Squamish First Nation leased lands, which provide the planning context for the westernmost portion of the study area.
Most of the land identified in the study area is outside the jurisdiction of the DWV. While the DWV has no authority over these lands, they were included in the study area to provide useful and coordinated context for the future development of all lands across this shared corridor.

District of West Vancouver8
Policies supporting development centres:
LE 1: Plan for a hierarchy of commercial areas that serve a variety of roles in the community. Support development that enhances Park Royal’s gateway location and minimizes generation of increased peak hour traffic. Cooperate with the Park Royal Shopping Centre owners and the Squamish Nation to integrate their future development and operational decisions into the larger community planning framework.
BF-C 7: Recognize the role of the Park Royal Shopping Centre as the eastern “gateway” to West Vancouver.
LE 3: Encourage mixed commercial and residential redevelopment projects in commercial centres where consistent with ongoing commercial activity.
BF-C 2: Support the commercial centres by encouraging residential uses.
Policies supporting housing, including rental and supportive:
SP 2: Recognize and plan for people with diverse means and needs [including access to housing].
SP 5: Encourage the provision of housing, services and facilities to meet the needs of young adults and young families with children.
SP 8: Continue to work toward an accessible community, free of social and physical barriers, for people with disabilities [including access to housing].
H 7: Support the provision of non-market housing [including through bonus density].
H 8: Support the provision of adaptable design in a variety of housing forms [including through bonus density].
H 9: Support the provision of rental housing [including through bonus density].
1.3 2004 Official Community Plan
Policies supporting environmental design:
H 12: Encourage more energy efficient buildings that help to reduce community greenhouse gas emissions.
BF-A 1: Promote superior environmental design in new development.
Policies specific to Clyde Avenue (east of Taylor Way):
BF-D 2: Allow for rezoning in the Clyde Avenue area east of Taylor Way to allow for a mix of uses including residential, mixed commercial residential buildings [including to achieve park-like landscaping and connections to Capilano river].
BF-D 3: Provide incentives (with a density of up to 2.0 FAR) for development to encourage property consolidation to create larger parcels of land with better opportunities for design and for improvements to the public street areas, and to encourage uses that would have defined community benefit [including bonus density for rental, parkland, or transfer of development potential for heritage preservation].
Policies supporting integrated land use and transportation planning:
T 1: Coordinate and consult with provincial agencies, neighbouring municipalities and the Squamish Nation.
T 2: Pursue comprehensive approaches to local transportation planning, including support of sustainability principles [including cycle lanes, transit supportive public realm].
T 3: Coordinate transportation infrastructure with local area planning.
T 5: Enhance and expand transportation options to reduce auto dependency and associated environmental impacts [including Marine Drive transit and cycling, bus only lanes and queue-jumpers].
Though the LAP has been prepared as part of the ongoing OCP Review, it followed a unique process requiring interjurisdictional information sharing and broader analysis. As most of the lands within the study area are outside of the DWV’s jurisdiction, a significant amount of the planning context has been established
At the same time, the 2004 OCP provides a significant body of policy direction for this wider area. A key element in the process was to assess how current OCP policy directions could be applied “on the ground”. Excerpts of relevant policy directions are provided below:
Marine Drive Local Area Plan and Design Guidelines Background Report 9
1

District of West Vancouver10
Figure 2.1 - North Shore Area Transit Plan 2040 Visionwithmunicipalgrowthestimatesadded
Lions Gate Town Centre and Marine Drive corridor
(DNV & CNV):~2500 units
Lonsdale Regional Town Centre (includes Central and Lower
Lonsdale) (CNV):~9500 units East 3rd Shed
Corridor and Moodyville (CNV):~1500 units
Lynn Creek Town Centre (DNV):~3000 units
Maplewood Village Town Centre (DNV):~1500 units

Marine Drive Local Area Plan and Design Guidelines Background Report 11
2.0 Context
2.1 Regional and Sub-Regional Growth Management Context
2
Marine Drive is one of two east-west connections on the North Shore and a key structural component of the growth management framework for Metro Vancouver and each North Shore municipality. When looking to the future of the study area it is important to understand planned growth along the corridor and the conditions that support it. In particular the Marine Drive corridor provides opportunities and commitments for rapid transit, amenities and services, both existing and planned.
The study area is situated within a broader growth management framework as part of Metro Vancouver’s Regional Growth Strategy (RGS). This strategy provides guidance for accommodating growth in transit-oriented centres and corridors.
The RGS includes a number of regionally designated areas on the North Shore where transit-oriented development is expected along or close to the Marine Drive corridor:• Lions Gate Town Centre, and the Marine Drive Frequent
Transit Development Areas (DNV and CNV);• Lonsdale Regional Town Centre (CNV, which extends above
the Marine Drive/3rd Street corridor to also include Central Lonsdale);
• East 3rd Street Frequent Transit Development Area (including the Moodyville area, CNV);
• Lynn Creek Town Centre and Frequent Transit Development Area (DNV);
• Maplewood Village Centre (DNV).These locations are acknowledged and planned for in both the City and District of North Vancouver’s recently adopted OCPs. The Squamish Nation’s 2004 Capilano Master Plan also identifies this area (in part) for economic development.
Figure2.2-The2004SquamishNation’sCapilanoIR5MasterPlanidentifiesapreferredlanduse
plan for their jurisdiction

District of West Vancouver12
Figure 2.3 - District of West Vancouver population projections by age cohort 2011 - 2041

Marine Drive Local Area Plan and Design Guidelines Background Report 13
2.2 Housing Context
In addition to considering the plan area’s multijurisdictional context, the LAP also responds to the LGA OCP requirements and West Vancouver’s local needs, particularly those related to housing. These include the approximate location, amount, type and density of residential development anticipated to meet future housing needs and policies for affordable, rental and supportive housing.
Housing is also connected to energy use, which relates to the OCP’s required GHG emission targets and reduction strategies. The connection between housing, transportation and energy use features prominently in the growth management framework of the RGS that supports accommodating growth in transit-oriented centres and corridors. This can create housing choice through a range of multi-family developments that provide a variety of unit types and sizes, sufficient densities to support rapid or frequent transit and high-performance buildings that reduce energy use. These are typically mixed-use developments, which allow for additional energy reductions as residents are able to access employment opportunities and services using active transportation (walking or cycling). The “Sustainability Context” section further describes how the LAP supports these energy and GHG emissions reduction objectives.
Understanding West Vancouver’s demographic profile into the future, and the community’s associated housing needs, provides further meaningful context for the LAP. A recent demographic study commissioned as part of the OCP review forecasts that the aging trend West Vancouver has experienced over the past several decades will accelerate, and that the number of youth will continue to decline.
These current and projected demographics have implications for the community’s housing needs, and not responding to these needs translates to a community where seniors have few options to downsize locally and relocate out of the community, while young families and adults are priced out of the community they grew up in and are unable to return to West Vancouver. The inability to find suitable and affordable housing also means that local employees have longer commute times and there is reduced generational and economic diversity throughout the community.
2
In brief, there is a need for housing options for: • Downsizers and seniors as the population ages;• Working professionals and young families for a balanced
demographic.Housing affordability and diversity have been identified as key issues for West Vancouver residents for a decade and more. In response to the growing concern, Council directed that a series of “housing strategies” that address housing affordability and diversity be used to inform housing policy, area planning processes, and development applications. The LAP takesmeasurable steps towards implementing a number of these strategies including: • Protecting and expanding rental and supportive units;• Providing bonus density for affordable, rental, or supportive
housing in centres and corridors;• Reducing parking requirements for developments that
include affordable, rental, seniors or supportive housing in close proximity to frequent transit, amenities and services;
• Identifying opportunities for a range of housing types (including townhouses, apartments, and mixed use) when preparing local area plans;
• Encouraging residential uses above commercial uses in centres and corridors.
The LAP includes a Planning Objective on housing diversity that supports providing density for affordable or rental housing, given the study area’s proximity to transit, services and amenities. This increased density can also support the provision of a variety of unit types and sizes appropriate for West Vancouver’s demographics with the greatest housing need: downsizing seniors, working professionals and young families. The LAP’s land use policies and built form guidelines provide further details to support the provision of increased housing options within the study area.

District of West Vancouver14
2.3 Transportation Context
Transportation and associated issues of congestion are acknowledged as key challenges in this area, situated as it is along a major east-west North Shore connection, and a major north-south connection between downtown Vancouver and the Upper Levels Highway and the Sea to Sky corridor beyond. The coordination of the transportation network across this corridor is important and requires collaboration from the Province’s Ministry of Transportation and Infrastructure (MOTI), which oversees Taylor Way and the highway; and TransLink which oversees the provision of public transit. Other agencies also impact transportation through this corridor, including BC Ferries and municipalities along the Sea to Sky Corridor. Recent multi-agency transportation plans focus on all facets of the transportation network: improving movement of vehicular traffic; increasing public transit services; and expanding active transportation infrastructure.
The LAP includes a multi-modal approach to transportation within the plan area. It includes Planning Objectives and Urban Design Principles focused on transit-supportive development, complete communities, minimizing trip generation and active transportation infrastructure. This creates a transportation system that provides residents with a number of options while reducing vehicle congestion by reducing the number of single-occupant vehicles from the road and improving the overall efficiency of the transportation network. Directions for transportation improvements provide additional detail and specificity regarding elements like parking ratios for new developments, right-of-way dedications and required improvements to pedestrian and cycling infrastructure. Given the transportation pressures along the Marine Drive corridor and the intersection at Marine Drive and Taylor Way, it is key that the LAP take advantage of one of the best opportunities for transit supportive development within the DWV.

Marine Drive Local Area Plan and Design Guidelines Background Report 15
2
Figure2.5-PublicTransit:Exampleofqueuejumpbuslane
2.3.1 Vehicular TrafficThe road network within the plan area is also multijurisdictional, with MOTI responsible for Taylor Way and the Highway (including the Lions Gate Bridge) and the DNV responsible for Marine Drive along the eastern portion of the plan area. Vehicular traffic in this area has long been acknowledged as an issue and was a prominent topic during the public consultation phase of the planning process.
When looking at vehicular traffic through the plan area there are some factors unique to the DWV that must be considered: • 75% of the District’s workforce commutes into West
Vancouver and a similar percentage of workers commute out of the District each day (2011 Census);
• Between 2006 and 2011 other municipalities saw a decrease in the number of commuters as their local workforces increased;
• This shift did not happen in West Vancouver as the number of commuters remained relatively unchanged between 2006-2011;
• ~1,000 school age children also commute to West Vancouver daily as the result of limited family-friendly housing options in the community.
In other words, a significant amount of traffic in the study area is generated by workers and school traffic. These traffic patterns have remained consistent in West Vancouver and the lack of diverse housing options in the District is a contributing factor to traffic congestion.
Figure 2.4 - Marine Drive and Taylor Way intersection looking north

District of West Vancouver16
Figure2.6-TrafficvolumesontheLionsGateandSecondNarrows Bridges 2006 - 2015
17.5
21.5
25.5
29.5
33.5
37.5
41.5
45.5
49.5
2006 2008 2010 2013 2014 2015
Milli
ons
North Shore Bridges Traffic Volume - 2006 - 2015
Lions Gate Bridge Second Narrows Bridge

Marine Drive Local Area Plan and Design Guidelines Background Report 17
2Another likely impact on traffic within the study area is the significant growth that has occurred through the Sea-to-Sky corridor. Working age residents (over 60% of residents in Squamish are between 24 and 65) continue to seek more affordable housing options throughout this corridor and subsequently face longer commutes that run through the DWV.
The LAP views the provision of housing options in locations that have frequent or rapid transit and are close to employment centres as an important component to address these contributing factors to traffic congestion through the study area.
Another source for insight into traffic patterns within the study area and across the North Shore are traffic counts conducted by MOTI at key points within the transportation network. MOTI tracks total trips across the two North Shore bridges and trip data for the past ten years is included in Figure 2.3. The data is relatively flat from 2006 to 2013 when it increases. This traffic is not evenly distributed across the two bridges however, as traffic on the Iron Workers Memorial Bridge has increased by 1.75%, while Lions Gate Bridge traffic has actually decreased by 2.95%. These commuter traffic trends illustrate the relationship between increased traffic congestion and the increased separation between where people are able to secure appropriate housing and where they work.
The DWV has shown considerable leadership on this issue, working collaboratively with other jurisdictions and levels of government on a range of transportation projects to improve the road network in and through the plan area. Notably, these include the North Shore Trade Area Study (2008), which proposed the extension of the Low Level Road from North Vancouver across the Capilano River to create an east-west bypass to the Lions Gate Bridge. Another initiative, the Lions Gate to Highway 1 Connector Planning Study (2007), focused on options to improve functioning of the Lions Gate bridgehead. Arising from that 2007 study, a number of recommendations have already been implemented including the transit priority signal and bus only lane on Marine Drive (2011) and replacement of the Capilano Bridge (2011).
The LAP includes directions to take advantage of the opportunities presented as part of the development process to improve the functionality of the road network. These include securing additional rights-of-way, setting buildings back, improving existing infrastructure and upgrading access and egress from various sites within the plan area and Marine Drive.
Figure 2.7 - Proposed western lower level route extension to Marine Drive would see an additional vehicular
crossing parallel to the rail bridge

District of West Vancouver18
There are currently 10 bus routes utilizing the Park Royal exchange and connecting West Vancouver destinations across the region.
250
250
257
253
253
257
257
250, 253
251
252
257
252
251
251, 252
250A
250,251, 252, 253, 257, 258
250,
251
, 252
, 253
254,
257
, 258
, 240
242
, 246
, 247
254
254
254
258
258
UNIVERSITY
4, 9, 10, 25, 41,49, 99, 258, 480
PARK ROYAL
239, 246, 250, 251, 252,253, 254, 257, 258
258
258
ENGLISH BAY
EagleHarbour
LION
S GAT
E BR
IDGE
WOODBURN
WO
OD
GRE
EN
WOODCREST
CAULFEILD
KEI
TH
MARINE DR
WESTRIDGE WESTMOUNT
UPPER LEVELS HWY
QUEENS
MATHERS
HAYWOOD
BONNYMUIR
. STAN
DREW
SSO
UTH
BORO
UG
HST
EVEN
SCHARTWELL
EYREMONT
MATHERS
CRESTWELL
INGLEWOOD
FULTON
TAYL
OR
WAY
GA
RDEN
CA
PILA
NO
11 S
T
15 S
T
17 S
T
25 S
T27 S
T31 S
T
ROBSON
DAVIE
BEACH
LAMEY’S MILL
CORNWALL
BROADWAYHIG
HBU
RY
WIL
LOWUNIVERSITY BLVD 10 AVE
4 AVE2 AVE
4 AVE
DENMAN
MARINE DR
CHANCELLOR BLVD
STANLEYPARK
LIGHTHOUSEPARK
FALSE CREEK
UNIVERSITYOF BRITISHCOLUMBIA
AMBLESIDE PARK
CYPRESSFALLSPARK
GRANVILLEISLAND
Lighthouse
MunicipalHall
Park RoyalShopping
Centre
Prospect P
Siwash Rock
LostLagoon
VancouverPublic
AquariumZoo
H.R. McMillianSpace Centre andVancouver Museum
MaritimeMuseum
& St. RochKitsilanoBeach
Old HastingsMill StoreMuseum
LocarnoBeach
Spanish Banks
UBCHospital
Museum ofAnthropology
NitobeMemorialGardens
Second Beach
Third Beach
Parks BoardOffice
Brockton Oval
TO HORSESHOE BAYAND LIONS BAY
WEST VANCOUVER
#250A Dundaravetrips operate toMarine & 25th
0 500 1000 1500 2000 2500metresScale: 0 to 2500 metres
GEORGIA
BURRARD
HOWE
GRANVILLE
SEYMOUR
255,255
241
,oint
255,
Stanley Park Shuttle
14 1513
STA
DIU
M
STN
GRANVILLESTN
BURRARDSTN
St.Pa
ul’s
Hospit
al
CORDOVA
SMITHE
BURR
ARD
HA
MIL
TON
MA
INLA
ND
PACIFICBLV
D
GRA
NVI
LLE
HASTINGS
PENDER
HO
WE
SEYM
OU
R
DRAKE
HO
RNBY
DUNSMUIR
GEORGIA
HELMCKEN
RIC
HA
RDS
HO
MER
BEAT
TY
THU
RLO
W
ALBERNI
ROBSON
HARO
BARCLAY
NELSON
COMO
DAVIE
BURNABY
HARWOOD
PENDRELL
BEACH
258
250, 253,254,257
258
250,
251,
252,
253,
254
WATERFRONTSTATION
HA
MIL
TON
CA
MBI
E
257
1
2 3
4
Wes
t O
verp
ass
NORTH
Park Royal North
Park Royal South
Park Royal 1 Unloading Only: 239, 246
2 254 British Properties 255 Dundarave 253 Caulfeild
3 239 Park Royal 246 Highland 250 Horseshoe Bay 250A Dundarave 251 Queens 252 Inglewood 257 Horseshoe Bay
4 239 Lonsdale Quay/Phibbs Exchange 246 Highland 254 British Properties 255 Capilano University To Vancouver: 250, 251, 252, 253, 254, 257, 258
Centre Road
Marine Drive
Tay
lor
Way
West VancouverBus Routes in Downtown Vancouver
guide_nov-2011-3panel.qxp 11/14/2011 3:59 PM Page 2
17 �18 19
Main Street
19 20 21
Traveltimes(minutes)fromtheParkRoyalexchangetokeydestinations:
Lions Gate Hospital 15 Vancouver Art Gallery: 16 OrpheumTheatre: 17 EdgemontVillage: 18 Queen Elizabeth Theatre: 20 Rogers Arena: 20 Capilano Suspension Bridge: 24 Lonsdale Quay: 25 English Bay: 27 Science World: 31 Capilano University: 37 Granville Island: 44 UBC: 59
There are currently 10 bus routes utilizing the Park Royal exchange and connecting West Vancouver destinations across the region.
Figure2.8-BusroutesthatconnecttoandthroughtheStudy Area

Marine Drive Local Area Plan and Design Guidelines Background Report 19
2
2.3.2 Public TransportThe LAP envisions two urban centres featuring transit supportive developments that include higher-density housing to take advantage of existing frequent (and planned rapid) transit service. Increased densities can increase ridership and lead to improved transit service delivery, which is key to decreasing the use of single-occupant vehicles. Public transportation is the most efficient of all modes: buses carry 28% of passengers crossing the Lions Gate Bridge though they make up only 2% of traffic.
The Marine Drive / Main Street corridor currently receives frequent transit service (defined as at least every 15 minutes in both directions, throughout the day and into the evening, every day of the week). Recent transit improvements include a bus priority lane and signal eastbound on Marine Drive towards the Lions Gate Bridge and expanded Community Shuttle services to Park Royal.
In November 2016, the Translink Board and Metro Vancouver Mayors approved the first phase of Translink’s “10 Year Vision”, a two billion dollar investment in transit improvements throughout the region. The first phase includes the introduction of a new “B-Line or better” bus route along Marine Drive, a 10% increase in bus service across the region including five key DWV routes, a new SeaBus and improvements to Lonsdale Quay and Phibbs bus exchanges. These improvements build on the commitment to rapid transit along this corridor embedded in the North Shore Area Transit Plan (2012) and additional improvements will be forthcoming in the Vision’s second phase.
To facilitate these transit improvements, Metro Vancouver and TransLink are currently coordinating a study (involving staff from the three North Shore municipalities, the Squamish Nation, and MOTI) to help guide transit service and design on this corridor. The District will continue to collaborate with TransLink and other partners to identify opportunities to expand bus transit service and explore additional modes (e.g. using the rail corridor or providing ferry service) to further improve the functionality of this corridor.
The LAP takes advantage of these improvements through the use of transit supportive development (e.g. public realm improvements that increase pedestrian safety and comfort while accessing transit service and other amenities, densities that can support car share initiatives and reduced resident parking requirements), to create two vibrant mixed-use centres where residents will be in close proximity to the best transit service in the District.
AnnualBoardings:4,295,000millionboardings on east-west North Shore transit routes that connect through Park Royal
4,300,000
AnnualBoardings:4,823,000millionboardings on north-south Downtown Vancouver transit routes that connect through Park Royal
4,800,000
Connections Across the North Shore: Increased to Frequent Transit Network in 2011providingserviceevery15minutes(on all days) across the North Shore
15 minutes

District of West Vancouver20
Figure 2.9 - District of West Vancouver Transportation modetoworkbyCensustract(2011)

Marine Drive Local Area Plan and Design Guidelines Background Report 21
2
2.3.3 Active TransportationThe third component of the multi-modal network is active transportation: walking and biking. These networks are key to improving connections both within the study area and across the North Shore. The study area contains an important piece of the Spirit Trail, a multi-modal pathway connecting the North Shore from Horseshoe Bay to Deep Cove. Expanded infrastructure for pedestrians and cyclists, including wider sidewalks, accessible curbs and dedicated bike lanes, increases public safety and accessibility, making these modes of transportation viable for area residents as they are able to easily access shops, services and amenities. A recent example of this is the completed bicycle trail connector between the Capilano Pacific Trail and Spirit Trail behind the West Royal Towers. The plan area is also well positioned to benefit from recent upgrades to the bike lanes on the Lions Gate Bridge and through Stanley Park, providing a safe, direct cycling route to downtown Vancouver.
The LAP includes policies around active transportation and proposes a number of additional improvements to the public realm to enhance transit users’, pedestrians’ and cyclists’ ability to move to and through the study area. The LAP’s public realm guidelines focus on opportunities for public space improvements as this is where considerable gains in active transportation can be met as sites are redeveloped. One important initiative is the completion of a key link of the Spirit Trail over the Park Royal-Welch Street Bridge. These active transportation initiatives will also support the physical health of future residents in the study area as research has shown residents of walkable areas are more active than those living in less walkable areas. This has environmental benefits as well, as residents are able to choose sustainable transportation modes that reduce energy use and GHG emissions.
Figure 2.10 - District of West Vancouver Active Transportation Network in and around the Study Area

District of West Vancouver22
2.4 Sustainablility Context
Figure2.11-CommunityEnergyandEmissionsPlan
Transit oriented developments, and the multi-family buildings and transportation options they feature, are important components of sustainability and GHG reduction strategies. West Vancouver adopted a “Community Energy and Emissions Plan” (CEE Plan) in October 2016, aimed at reducing the District’s greenhouse gas emissions by 40% of 2010 levels by 2040. Developed by a Working Group through a citizen-led planning process, the CEE Plan includes strategic directions that focus on the integration of land use, transportation and energy planning, key principles of the LAP. These strategic directions target land use, buildings, and transportation, which are each responsible for a significant component of the District’s community energy use and GHG emissions.
The LAP is a significant implementation opportunity for the CEE Plan and advances a number of its key strategic directions. These actions will help the DWV meet its GHG reduction targets in both the CEE Plan and the OCP. These strategic directions include:

Marine Drive Local Area Plan and Design Guidelines Background Report 23
2
Places and Spaces:
Activate existing walkable villages (e.g. Park Royal) with modest new residential growth of similar scales that features a strong public realm and infrastructure to support transportation choice, particularly walking and cycling.
Bricks and Mortar:
Facilitate high demand, low supply “missing middle” housing options […] focus high-rise proximate to current and future transit/rapid transit stations (e.g. Park Royal).
Support high efficiency new apartment buildings that use thermal, passive or low carbon heating.
Enable distributed renewable heating systems in high density new apartments and commercial neighbourhoods.
Roll and Stroll:
Support the expansion of high quality, high speed, high frequency transit infrastructure through appropriate land uses, engineering and urban design plans. Rapid transit routes include Marine Drive to Downtown Vancouver and Phibbs Exchange in the District of North Vancouver.
Strengthen pedestrian infrastructure in and around walkable villages and key destinations.
Strengthen All Ages and Abilities and Better than Basic cycling infrastructure in, around and between walkable villages and key destinations.
Enable car sharing in walkable villages through multi-family residential developments, parking allowances and reductions and collaboration with locations that serve as major regional destinations, including Park Royal.
Require electric vehicle charging infrastructure in new buildings.
Figure 2.12 - CEE Plan Strategic Directions

District of West Vancouver24
Factor Definition Travel Impacts
Regional accessibility Location of development relative to regional centers.
Reduces per capita vehicle mileage. Central area residents typically drive 10-30% less than at the urban fringe
Density People or jobs per unit of land area (acre or hectare).
Reduces vehicle ownership and travel, and increases use of alternative modes. A 10% increase typically reduces VMT 0.5-1% as an isolated factor, and 1-4% including associated factors (regional accessibility, mix, etc.).
Mix Proximity between different land uses (housing, commercial, institutional)
Tends to reduce vehicle travel and increase use of alternative modes, particularly walking. Mixed-use areas typically have 5-15% less vehicle travel.
Centeredness (centricity) Portion of jobs in commercial centers (e.g., central business districts and town centers)
Increases use of alternative modes. Typically 30-60% of commuters to major commercial centers use alternative modes compared with 5-15% at dispersed locations
Network Connectivity Degree that walkways and roads are connected
Tends to reduce vehicle travel and improved walkway connectivity increases non-motorized travel
Roadway design Scale, design and management of streets
Multi-modal streets increase use of alternative modes. Traffic calming reduces VMT and increases non-motorized travel
Active transport (walking and cycling)
Quantity, quality and security of sidewalks, crosswalks, paths, and bike lanes.
Improved walking and cycling conditions tends to increase nonmotorized travel and reduce automobile travel. Residents of more walkable communities typically walk 2-4 times more and drive 5-15% less than in automobile-dependent areas.
Transit quality and accessibility
Quality of transit service and whether neighborhoods are considered transit-oriented development (TOD)
Increases ridership and reduces automobile trips. Residents of transit oriented developments tend to own 20-60% fewer vehicles, drive 20-40% fewer miles, and use alternative
Parking supply and management
Number of parking spaces per building unit or acre, and how parking is managed and priced
Tends to reduce vehicle ownership and use, and increase use of alternative modes. Cost-recovery pricing (users finance parking facilities) typically reduces automobile trips 10-30%.
Site design Whether oriented for auto or multi-modal accessibility
Can reduce automobile trips, particularly if implemented with improvements to other modes.
Mobility management Strategies that encourage more efficient travel activity
Tends to reduce vehicle ownership and use, and increases use of alternative modes. Impacts vary depending on conditions.
Integrated smart growth programs
Travel impacts of integrated programs that include a variety of land use management strategies
Reduces vehicle ownership and use, and increases alternative mode use. Smart growth community residents typically own 10-30% fewer vehicles, drive 20-40% less, and use alternative mode 2-10 times more than in automobile-dependent locations, and larger reductions are possible if integrated with improved regional transit and more efficient transport pricing.
Figure 2.13 http://www.vtpi.org/landtravel.pdf
Literaturereviewsummarizingimpactsofland use and design factors on travel choice
(Victoria Transportation Policy Institute)

Marine Drive Local Area Plan and Design Guidelines Background Report 25
2
The CEE Plan’s strategy of energy reduction through the integration of transportation and land use planning, and the direction of new growth to areas with the best transit service, is supported by 2011 Census data on commuting patterns in the DWV. The data on transportation mode to work shows almost a 30% decrease in vehicular use and nearly a tripling in transit, walking or cycling in lands around the study area (with the best transit service, links to cycling routes and a concentration of jobs within a walking distance) compared to the more western and northern census tracts (See Figure 2.6).
The LAP builds on current conditions, which support less GHG intensive transportation options, recently announced transit improvements (the introduction of rapid transit service with a new Marine Drive B-Line Bus) and planned upgrades to the pedestrian and cycling networks (completion of the Spirit Trail). It continues to support diverse transportation options within the study area and provide residents with a range of alternatives to single-occupancy vehicles.
Recent research also confirms the positive impacts of integrating land use and transportation: Increased density can lead to significant reductions in the number of vehicle-kilometres traveled (see Figure 2.11 below), increased the number of trips with zero emissions by between 2 and 10 times and can increase walking trips by up to 20%. Walkable neighbourhoods (like the two centres proposed in the LAP) can reduce transportation-related CO2 emissions by up to 10% by 2050 .
In addition to where buildings are located and how they are designed, the public realm can also impact transportation mode choice and subsequently energy use and GHG emissions. Figure 2.10 summarizes and illustrates the effects of land use and design factors on travel behaviour and the range of benefits a well-designed public realm can have on an urban centre. While actual impacts will vary depending on specific conditions, the importance of a high-quality public realm is an important component of the development process. The LAP includes public realm design guidelines that will create distinctive environments for both centres that support CEE Plan strategic directions, reduce GHG emissions and provide safe active transportation options in the study area.
Figure 2.14 - Research by World Transport, Policy & Practice http://www.eco-logica.co.uk/pdf/wtpp17.2.pdf
The graph below illustrates the negative relationship between density and per capitavehicletravelin58high-incomecities. The relationship is statistically strong. The largest reductions result fromrelativelymodestdensityincreases,indicatingtherelativelymodestlandusepolicychangescansignificantlyreducevehicle travel.
Urban Density vs. Private Car Travel: Increasing density reduces vehicle-kilometres travelled.
2.4.1 Land Use and Transportation Planning

District of West Vancouver26

Marine Drive Local Area Plan and Design Guidelines Background Report 27
3.0 Process3
A systems analysis was conducted to further understand how different elements are connected or work together within the study area. Three key themes were revealed:
1. Natural features contrast and bisect the urban character of the centres. Park space and the Capilano River are unique to this part of West Vancouver and should be celebrated as redevelopment occurs.
2. Taller buildings already exist in each of the identified urban centres. New development will respond to this and contribute to a definable cluster of buildings marking the heart of each urban area.
3. A healthy and complete community benefits from pedestrian connections that link existing and new amenities to housing. Pedestrian connections and cycling routes should be enhanced to be comfortable and safe, and should facilitate access to transit to support transit-oriented new development.
The results of the systems analysis were combined with 2004 OCP policy and planning best practices. From this a planning and design framework was developed. It introduced the concept of two defined centres separated by natural features and connected by green links focused on pedestrian mobility. From this framework a set of Planning Objectives and Urban Design Principles were established.
The final section of the Context study included directions for each sub-area that referenced land use policies and guidelines for built form, the public realm, and transportation for DWV sites. They included building height diagrams that reinforced the importance of existing viewsheds, and the overall theme of two cohesive yet distinct skylines, one in each sub-area.
The Context Study was presented to Council on June 20, 2016 where it was referred for “public comment”.
3.1 Context Study
Development applications in the study area date back to 2012. Following planning and design review, public consultation and multiple revisions, Council requested additional information and analysis to allow for development applications in the study area to be considered in their unique multijurisdictional context. The Context Study was then endorsed as part of the work plan for the OCP Review and has led to the preparation of a Local Area Plan and Design Guidelines to be considered as part of an amended OCP.

District of West Vancouver28
One of the most prominent features visible from the Lions Gate Bridge is Klahanie Park, which provides a strong landscaped contrast to the town centres which flank the park. A sense of arrival is enhanced by the foreshore water and the entry of the Capilano River. The natural systems are notable features in the landscape.
Reinforcing the direction for gateways in the OCP, clusters of taller buildings currently mark the centres. These nodes also provide services, amenities, and housing. Both east and west sub-areas contain unique architectural forms that can be seen from numerous vantage points. Park Royal Towers and West Royal Towers (west) and International Plaza (east) establish an existing scale and form of development that reinforce the urban centres concept.
Observation Theme: Natural features Observation Theme: Built form

Marine Drive Local Area Plan and Design Guidelines Background Report 29
3
Smaller, human-scale blocks make pedestrians feel comfortable. A porous block structure, extending outward to connect natural and recreational opportunities along the Capilano River, will reinforce a pleasant walking experience for all. Supporting this is a transportation network that includes frequent transit service that connects key nodes throughout the area.
Observations Theme: Transportation and Mobility
Figure3.1.FiguresfromSystemsAnalyses

District of West Vancouver30
The public consultation program for the Context Study was conducted between September and October of 2016 and included a range of opportunities for public participation including a web portal, roundtable discussions, open houses and a survey.
The website received over 1,100 views while the public consultation program was underway and notices about the public events and surveys were sent to over 600 citizens. The Context Study webpage was the second most viewed “Council Priorities” webpage and accounted for over 50% of all “Council Priorities” page views while the public engagement process was underway.
The two roundtable discussions were fully subscribed, with 46 participants in attendance. Each session featured facilitated table discussions that were recorded by a transcriber on a flip chart. The two open houses were attended by over 125 residents and featured interactive and “dotmocracy” boards that allowed attendees to comment directly on the Context Study. 125 different sticky-note comments were provided and included in the analysis. The survey received 329 total responses, making it the fourth most responded to survey on westvancouverITE.
The public consultation events were formatted around the three key components of the Context Study: planning context, Planning Objectives and Design Principles and directions for DWV sites. Feedback was consistent between the different modes of public engagement for each Context Study component. Transportation concerns were the most frequently cited at all events.
Comments on the contextual factors focused on transportation for all modes including traffic congestion, access and egress from the plan area, the need for additional transportation plans and the need for improvements to transit service and active transportation infrastructure.
The survey confirmed support for the Planning Objectives and Design Principles as most received between 60% – 80% support. Two Planning Objectives received less than 60% support with “Respond to context of the two Town Centres (49% agreement) and “Reinforce Park Royal and Lions Gate Town Centres” (with 53% agreement). Both of these planning principles were mainly concerned with the form of development and building height. All Design Principles were supported by over 50% of respondents. The only two objectives with less than 60% support (“Distinct Centres with clusters of taller buildings” with 52% agreement and “Hierarchy of buildings with transitions between scales” with 59% agreement) echo the results of the Planning Objectives, as these were again related to building height.
3.2 Public Engagement
Figure3.2-ImagesfromPublicConsultationEventsSeptember-October2016

Marine Drive Local Area Plan and Design Guidelines Background Report 31
Each engagement stream also asked participants to identify any other Objectives and Principles they felt should be added to the Context Study. The most frequent suggestions were related to transportation. Other frequently cited potential objectives included support for reducing building height and additional opportunities for local employment.
The third section of the survey focused on the Planning and Urban Design Directions, asking participants whether they agreed with the proposed directions of the active development applications. The responses ranged from between 40% - 50% agreement/disagreement for each active application.
Participants were also asked if they had additional comments regarding the development sites, and again there was consistency for each engagement stream and site with comments focused on
3
transportation (traffic congestion, public transit service and active transportation) and the form of development, including concerns regarding building height.
The public consultation program confirmed support for the Planning Objectives and Design Principles, and some support for the directions for the developments sites. It also indicated additional contextual information on transportation was required and that the directions for each site may need to be more responsive to concerns regarding the form of development, particularly building height. This required additional research, planning analysis and urban design to expand the Context Study through the addition of new transportation information and to reconfigure the directions for each site to ensure the optimal expression of the Planning Objectives and Urban Design Principles.
Figure3.3-SurveyResultsillustratingagreementwithPlanning Objectives and Design Principles
0 10 20 30 40 50 60 70 80 90 100
Respond to context of the two Town CentresReinforce Park Royal and Lions Gate Town Centres
Meet housing objectivesMinimize trip generation
Secure appropriate amenitiesPreserve views from the Lions Gate Bridge
Connect to Park Royal MallEngage with the Natural Environment
Pedestrian improvements along Marine Drive
Planning Objectives
Agree Disagree Not sure
0 10 20 30 40 50 60 70 80 90 100
Distinct Centres with clusters of taller buildingsHierarchy of buildings with transitions between scales
Distinct Context that responds to the two Town CentresRespond to the Capilano River
Express the Gateway with high quality designTransit Supportive Development to reduce vehicle trips
Sustainable Design with high performance buildingsComplete Communities with space to live, work and play
Public Space, Public Life through increased public spacesPedestrian Continuity reinforces key walking connections
Design Principles
Agree Disagree Not sure
District of West Vancouver32
3.3 Revised Context Study
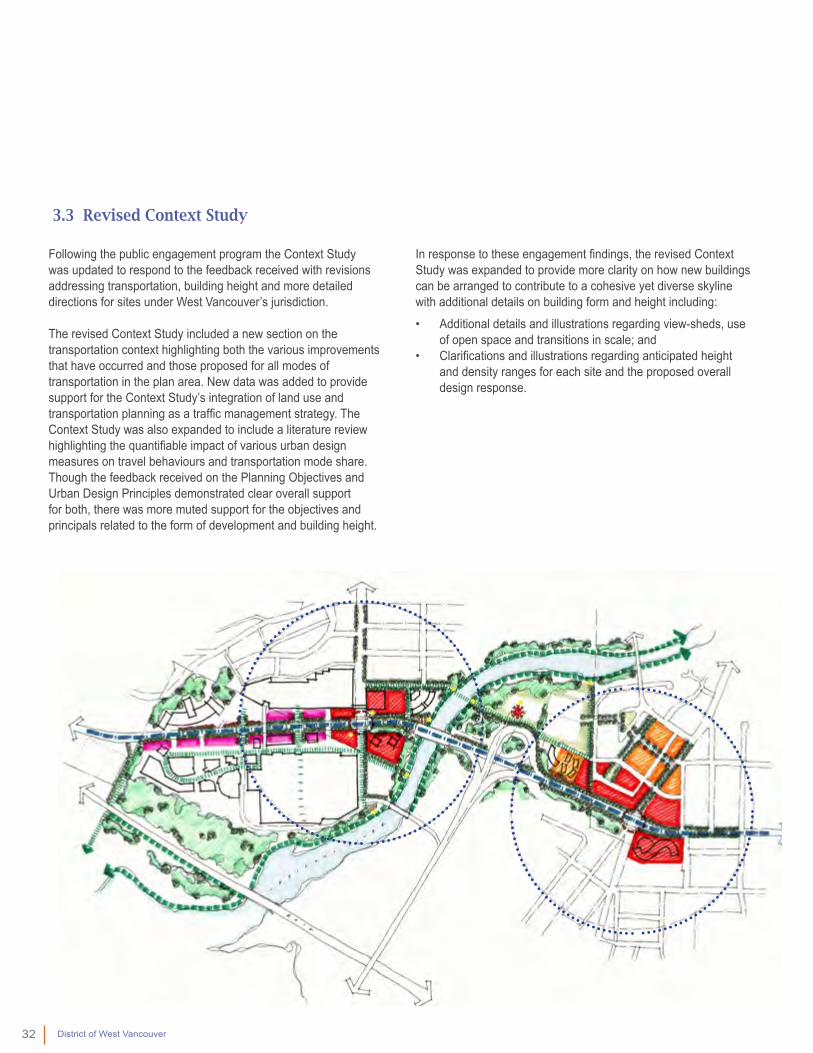
Following the public engagement program the Context Study was updated to respond to the feedback received with revisions addressing transportation, building height and more detailed directions for sites under West Vancouver’s jurisdiction.
The revised Context Study included a new section on the transportation context highlighting both the various improvements that have occurred and those proposed for all modes of transportation in the plan area. New data was added to provide support for the Context Study’s integration of land use and transportation planning as a traffic management strategy. The Context Study was also expanded to include a literature review highlighting the quantifiable impact of various urban design measures on travel behaviours and transportation mode share. Though the feedback received on the Planning Objectives and Urban Design Principles demonstrated clear overall support for both, there was more muted support for the objectives and principals related to the form of development and building height.
In response to these engagement findings, the revised Context Study was expanded to provide more clarity on how new buildings can be arranged to contribute to a cohesive yet diverse skyline with additional details on building form and height including:• Additional details and illustrations regarding view-sheds, use
of open space and transitions in scale; and• Clarifications and illustrations regarding anticipated height
and density ranges for each site and the proposed overall design response.
Marine Drive Local Area Plan and Design Guidelines Background Report 33
3
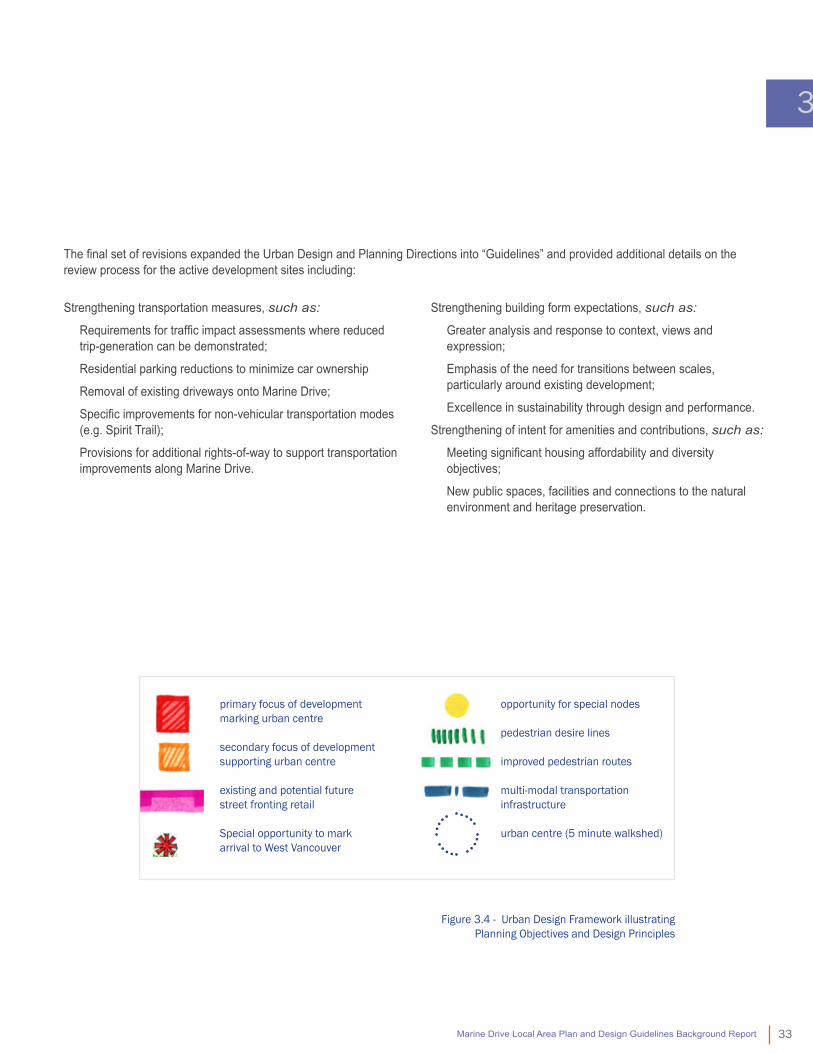
Strengthening transportation measures, such as:
Requirements for traffic impact assessments where reduced trip-generation can be demonstrated;
Residential parking reductions to minimize car ownership
Removal of existing driveways onto Marine Drive;
Specific improvements for non-vehicular transportation modes (e.g. Spirit Trail);
Provisions for additional rights-of-way to support transportation improvements along Marine Drive.
Strengthening building form expectations, such as:
Greater analysis and response to context, views and expression;
Emphasis of the need for transitions between scales, particularly around existing development;
Excellence in sustainability through design and performance.
Strengthening of intent for amenities and contributions, such as:
Meeting significant housing affordability and diversity objectives;
New public spaces, facilities and connections to the natural environment and heritage preservation.
The final set of revisions expanded the Urban Design and Planning Directions into “Guidelines” and provided additional details on the review process for the active development sites including:
Figure3.4-UrbanDesignFrameworkillustratingPlanning Objectives and Design Principles
primaryfocusofdevelopmentmarkingurbancentre
secondaryfocusofdevelopmentsupporting urban centre
existing and potential future street fronting retail
Specialopportunitytomarkarrival to West Vancouver
opportunity for special nodes
pedestrian desire lines
improvedpedestrianroutes
multi-modaltransportationinfrastructure
urbancentre(5minutewalkshed)

District of West Vancouver34
3.3 Preparing the Local Area Plan and Design Guidelines
Council direction on the revised Context Study led to its clarification as a Local Area Plan and Design Guidelines that will be included as part of the Official Community Plan. The LAP includes land use policies, built form and public realm guidelines, and directions on amenities, transportation and streetscape design for all DWV sites within the study area. These sections incorporate policy directions from the 2004 OCP, along with more detailed statements intended to provide additional clarity about the types of land uses, building designs and public realm treatments appropriate for the plan area’s vision of two distinct, vibrant, mixed-use centres.
In order to provide the Council requested clarification and specificity on appropriate parameters for development, additional planning and urban design analysis was required. The analysis built on the Planning Objectives and Urban Design Principles and input from the public consultation, which though generally supportive of both had more muted support for those related to building height. Additional view shed analyses were conducted to look at potential impacts caused by building height changes and to determine how these changes could still support cohesive skylines that respond to the contexts of each sub-area.
Lions Gate - Klahanie Sub-AreaThe policies, guidelines and directions for the Lions Gate - Klahanie sub-area remain consistent with the Context Study and 2004 OCP Policy, with additional details provided on density, built form (including floorplate, siting, transitions and architectural expression), public realm, transportation improvements, parking ratio, and amenities, including affordable housing. The organizing principle for West Vancouver sites in this centre remains consistent with the ‘bookend skyline’ approach to both building scale and hierarchy that responds to existing and planned developments within the study area.
Figure 3.5 - Marine Drive viewshed within the Lions Gate - Taylor Way Sub-Area

Marine Drive Local Area Plan and Design Guidelines Background Report 35
3
Figure3.6-DiagrammaticelevationalongMarineDriveillustratingthehierarchy of buildings anticipated for Lions Gate Town Centre and taller
buildingsactingas‘bookends’
CAPI
LANO
RD
1
12
3 34
MARINE DR eastwest
International Plaza303 Marine

District of West Vancouver36
The LAP has been prepared as an amending bylaw to the current OCP and its approval process will be consistent with that of an OCP amendment, which will include consideration by Council following a public hearing as required by the LGA.
Park Royal - Clyde Avenue Sub-AreaThe Park Royal - Clyde Avenue sub-area includes a number of changes to the directions first proposed by the Context Study. The planning and design analysis required to provide additional clarity and specificity for sites within this sub-area created the opportunity to further address feedback received during public consultation around building height, while remaining consistent with the Planning Objectives and Urban Design Principles and the District’s housing and sustainability objectives. The majority of these changes flow from the reconfiguration of the skyline around the Marine Drive/Taylor Way intersection, which now features building heights that step down considerably on either side of the existing West Royal Towers, currently the dominant buildings in this sub-area. This change reduces building height at this intersection while still creating a dynamic skyline and a prominent gateway into the District that enhances the public viewshed from Keith Road to the Lions Gate Bridge.
Figure3.7-DiagrammaticelevationalongMarineDriveillustratingthe hierarchy of buildings anticipated for the Park Royal - Clyde Avenue sub-area - and the evolution of the skyline around the
Marine Drive/Taylor Way intersection.
Context Study Local Area Plan and Design Guidelines

Marine Drive Local Area Plan and Design Guidelines Background Report 37
3
Figure3.8-ViewfromKeithRoadoftheParkRoyal-ClydeAvenuesub-area illustrating how building heights have been reduced in the
Local Area Plan and Design Guidelines to enhance public views to the Lions Gate Bridge
Figure 3.9 - View along Marine Drive of the Park Royal - Clyde Avenue sub-area illustrating how building heights have been
reduced in the Local Area Plan and Design Guidelines to respond to theexistingcontextandtheshiftintheMarineDrivealignment.
Context Study Local Area Plan and Design Guidelines
Context Study Local Area Plan and Design Guidelines