Embed Size (px)
Citation preview

Marine Ecosystem and Environment in the Tokyo Bay
–Past and Current-
Naho HORIMOTODepartment of Ocean Sciences
Faculty of Marie ScienceTokyo University of Marine Science and Technology

Clams digging to tidal flatHANEDA in 1930sA small fisheries village
HANEDA PresentA Famous conger fisheries Large Landfills - The Haneda airport and artificial islands -
Tokyo Bay is a pitiful sea. It has never been subjected for environmental conservation, so far.
Makoto Shimizu Professor emeritus at the University of Tokyo

Tidal flat around 1900
136km2 10km2
1986
Tidal flatReclamation ― 1945 ― 1975 ― 1985Since 1986
Change of the Tokyo BayReclamation - Loss of organisms and function of water purification in tidal flat-
Japanese hard clam (Meretrix lusoria)
Sandborer(Sillago japonica)
extinct species
Increased Population around the Bay- Eutrophication -Changes in the population around Tokyo Bay and COD(Chemical Oxygen Demand) and nutrient load
Total nutrient load
Population:Tokyo Metro., Kanagawa, Chiba and Saitama Pref.
COD load
Total phosphate load
(t/d) (x1000)

Sta. F3 (35°30′N,139°49′E)Off Haneda Airport Effect by the Tamagawa River
Sta. F6 (35°25′N,139°47′E)Almost Center of Tokyo Bay
Sta. 06 (35°11′N,139°44′E)Bay Entrance (in the Uraga Channel)Front of Tokyo Bay and Coastal Water
Sta. 11 (35°02′N,139°39′E)Adjust area to Sagami BayEffected by Open Water
Surface Salinity on April 2004
(PSU)
Our Routine Observation in the Tokyo Bay
10km
TUMSAT

Seiyo Maru II< Undergraduate Education >・Freshman’s seminar “First SEA-GOING Cruise”・Training in Navigation and Fishing for the sea-training course(sophomore student for obtaining the certificate of the course )・ Training in Oceanographic Observations (senior student)
< Oceanographic Research around Tokyo Bay and Sagami Bay >
Gross Tone 170t
Length 35.5m
Complement 14 Crews25 Student

丸 鷹 青SEIYO MARU
ADCPInlet Pump
AD convert
PC
・GPS・Water Temperature・Salinity・In vivo Chlorophyll Fluorescence
In the LAB
LAB
Underway Observation(every a minute data )
GPSMeteorological Observation → on the compass deck・Wind speed and direction・Air Pressure・Air temperature
In the Bridge
GPS
Seawater
TS sensor
Fluorometer
ADCP(Acoustic Doppler Current Profiler)
Observation equipments #1
Sea Surface丸 鷹 青
SEIYO MARU
Sea Bottom
ORI Net
IONESS
Sledge NetDredge
CTD with Niskin Water
Sampler
Multiple Core Sampler
SecchiDisk
Van DornWater Sampler
NORPACNet
Larvae Net
Smith&McIntyreSampler
Observation equipments #2
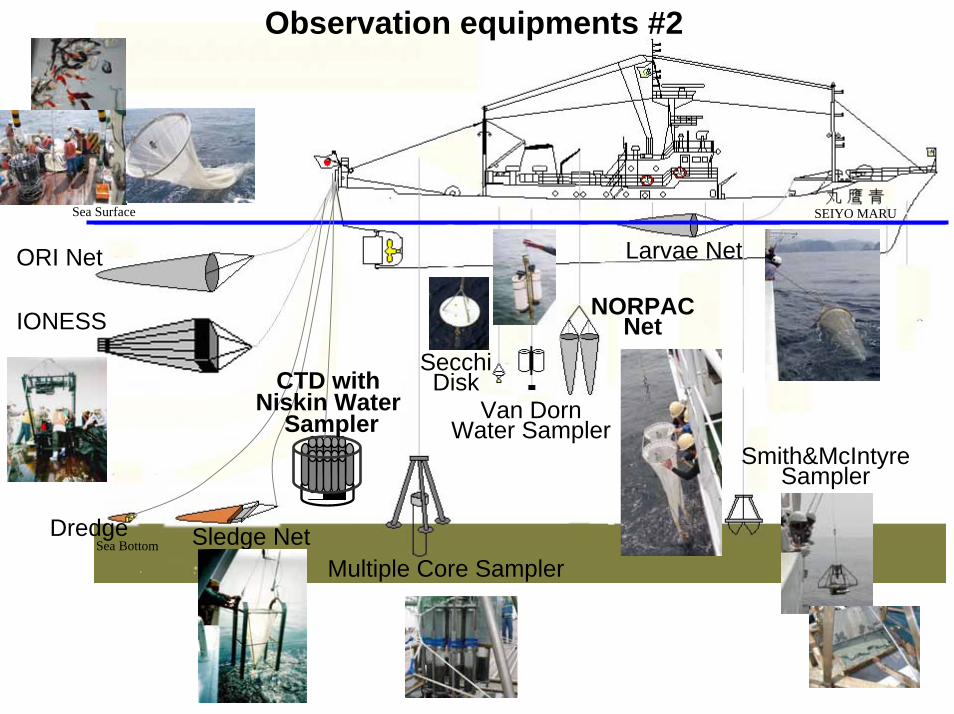
Mooring operation and recoveryReal time measurement of Primary Productivity in Sagami Bay
(SORST - JST)Depth, Temperature, Salinity, In situ PAR,
Chlorophyll fluorescence, Primary Productivity by Fast Reputation Rate of Fluorescence
Underwater winch is designed that Buoy moves up and down with Kevlar rope in accordance with a time-table user programmed.Profiling Data is send to the Lab by email

CTD SYSTEM(Conductivity=salinity, Temperature and Depth)
Slip ring
CTD Cast Winch Control
Steel Wire Armored Cable
Deck Unit PC Operation
Water Sampling

Temperature
Conductivity(Salinity)
Dissolved Oxygen
Light Attenuation Coefficient(Turbidimeter)
Chlorophyll Fluorometer
light quantum(Irradiance)
Pressure(Depth)
Main Body
Cradle for Niskin Bottle
Sampler
CTD Sensors

CTD Vertical Profile in 20th December 2005 at Sagami Bay
Temperature(oC)
Salinity (Practical Salinity Unit)
Dissolved Oxygen (ml/l)
Turbidimeter (%)
In vivo Chlorophyll (ug/l)
light quantum (uE/m3/s)
Pres
sure
(Dep
th, m
)
Temperature
Dissolved Oxygen
Salinity
ChlorophyllTurbidimeter
light quantum

Routine Sampling in the Tokyo Bay (Sta.F3 and F6)
Sampling depths0, 5,10,15,20m
CTD-Niskin sampler
100ml
250ml
Nutrientmeasurementsautomated analysis
by Bran-Luebbe
Chl a analysisfiltered onto GF/F glass-fiber filters
extracted indimethyl formamide
(Suzuki and Ishimaru 1990)
determined by thefluorometoric method
NO2 :Naphthyl-ethylenediamine MethodNO3 : Naphthyl-ethylenediamine Method
(Reduction by Copper- Cadmium column)NH4 :OPP Method (Kanda, 1995)PO4 :Molybdenum Blue Color Comparison MethodSiO2 :Molybdenum Blue Color Comparison Method
AACS III
Model 10
Spike with a NaH13CO3
Photosynthetic 13C incorporation
Incubate for 3-4 hours in an on-deck incubator
Only use a surface water
The irradiance simulated at the 100-1% relative light levels by use of various combinations of neutral-density filters
filtered onto precombusted GF/F glass-fiber filters
Measured by Infrared absorption spectrometry (JASCO, EX130S)
calculated primary productivity (Hama et al. 1983)
F6F3
35˚ 40’
139˚ 40’ 140˚ 00’35˚ 10’
35˚ 20’
35˚ 30’
100 50 25 12.5 6 3 1%
250ml

Non-phosphatedetergent
Improvement in sewerage treatment
NH₄‐N
NO₃‐N
PO₄‐P
After In Tokyo Bay –Its Environmental Changes (in Japanese)
Changes in surface nutrient concentrations

0.4
0.6
0.8
1.0
1.2
1.4
1.6
1990 1991 1992 1993 1994 1995 1996 1997 19981989
2530354045505560657075
10
20
30
40
50
DIN
(µM
)Si
(OH
) 4-S
i (µM
)PO
4-P
(µM
)F3F6
Cocks-Start TestTrends of decrease
(a=0.05)
Result from Mastumura et al. (2001)
Changes in surface nutrient concentrations at Sta.F3 and F6

After Kawabe and Kawabe (1997)(Chemical Oxygen Demand)
Variation of surface COD and DIN, and solar radiation

10
20
30
40
253035404550556065707511
11
12
12
13
13
14
1989 19911990 1993 1994 1995 1996 1997 19981992
Result from Mastumura et al. (2001)F3F6
F3F6
Chl
a(µ
g/l)
Sola
r rad
iatio
n (M
J/m
2 )D
IN (µ
M)
Variation of Chl a, solar radiation, and DIN at Sta. F3 and F6

0
2
4
6
8
10
12
14
16
1 2 3 4 5 6 7 8 9 10 11 12
1963年
1972年
1988年
2000以降平均
gC m-2 day-1
-2005 Average
J F M A M J J A S O N D
Ichimura, 1967Yamaguchi & Ichimura, 1976Yamaguchi et al., 1991
Seasonal variation and transition of Primary Production and Chl a at Sta. F3
0
100
200
300
4001963年
1972年
1988年
2000以降平均
mg Chl a m-2

μM
0
10
20
30
40
50
60
70
80
63 72 88 89 90 91 92 93 94 95 96 97 98 99 00 01 02 03 04
0
1
2
3
4
5
6表層DIN濃度 (uM)
表層Chl a 濃度(ug L-1)
生産力 (gC m-2 day-1)
~ ~
μg L-1 gC m-2 day-1
surface DIN
surface Chl a Production
Transition of surface DIN and Chl a, water column production at Sta. F3
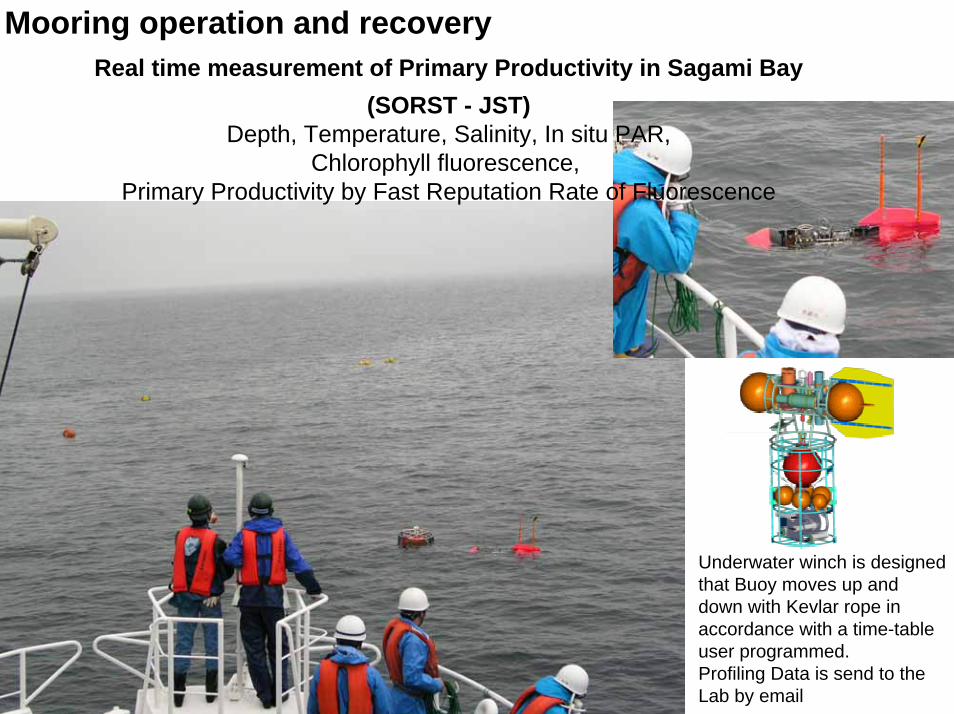
Red Tide (a decade AV)
Blue Tide (a decade AV)
Red TideBlue Tide
1950-1970s 1980-1990s
Occ
urre
nce
Tim
es
Ceratium
Gonyaulax
Skeletonema
Chaetoceros
Prorocentrum
Heterosigma
Before 1950s
Occurrences of red tide and blue tide

P N
Red Tide and Blue Tidegreatly increased amounts of phosphorus or nitrogen entering an aquatic ecosystem from either sewage systems or agricultural fertilizers
Phytoplankton are microscopic, single-celled plants.Phytoplankton is a primary producer in the ocean.
Bottom anoxia and extinction of benthos
Red tide andEnd of bloom, phytoplankton accumulate on the sea bottom and microbes consume large amount of oxygen to decompose them.
Southern wind cause upwelling
Sulfur was educed due to oxidation of hydrogen sulfide, that color is light blue and tint smells of sulfur

Change in the major copepod species at Sta.F6 (Nomura, 1993)
References
Observed yearMethod of a
sampling (times)NET/
WATER
References
Observed yearMethod of a
sampling (times)NET/
WATER
Suda et al
Kurashige
Tokyo Metro.Fish. Fujitani
Yamazi Marumo&Murano
Marumo&Murano
Anakubo&Murano Nomura
●:Dominated,○:Appeared
Oithona davisae
Acartia omorii
Oithona similis
Microsetella norvegica

Polluted condition have never been changed.Organic load from land decreasedOnly slight decrease in nutrient load Organic matter is produced in the bay causing pollution
Environmental monitoring have intensively conducted, but no counter measure
What should we do now?
Summary Environment of Tokyo Bay have been deteriorated by reclamation and population increase Extinction of animals in tidal flat Eutrophication with population increase Red tide, blue tide and bottom anoxia
Low diversity

Dissolved organic carbon
Trophic transfer of carbon
Classic food chainMicrobial loop
PICO MICRONANO0.2µm 2µm 20µm 200µm MACROsize
Diagram of a marine food chain

0.1Chl a
(µg L-1)0.5 1 10Composite image of chlorophyll
concentration in the ocean(source SEAWIFS project)
Annual mean nitrate at the surface (source World Ocean Atlas @ NODC)
<1 10 20 >30(µM)
nutrients
Small
Open Ocean
Large
Coastal + Upwelling area
Chl aHL
How does phytoplankton biomass and species composition vary ?What size dominates within each area?


![Approx. 65 minutes 7 round trips/day SASEBO OJIKAtravel.sasebo99.com/en/wp-content/.../pdf_brochure/... · Arita IC Sasebo City Tokyo [Haneda] Tokyo [Narita] Nagoya [Chubu] Osaka](https://img.pdfslide.net/doc/110x75/5ec6b37f63a53b6c3429a0c4/approx-65-minutes-7-round-tripsday-sasebo-arita-ic-sasebo-city-tokyo-haneda.jpg)


![THE HOKKOKU BANK, LTD. · Narita Naha Taipei Fukuoka Shanghai Seoul Luxembourg (Freight) Azerbaijan (Freight) Tokyo (Haneda) [Legend] International Route Domestic Route (As of April](https://img.pdfslide.net/doc/110x75/6008e6b12746a0189e478193/the-hokkoku-bank-ltd-narita-naha-taipei-fukuoka-shanghai-seoul-luxembourg-freight.jpg)