Embed Size (px)
Citation preview
4 DOUGLAS WARTZOK AND DARLENE R. KETTEN
Marine Mammal Sensory Systems
Sensory systems evolved to allow animals to receive andprocess information from their surroundings. To under
stand how sensory systems operate in any given environment, we must understand how the physical characteristicsofthat environment affect the available information and its
propagation and reception. In a very real sense we need tolook at both the medium and the message (McLuhan andFiore 1967). Signals in the marine environment can be substantially different from those in air, and the oceanic medium
itselfchanges the message in a number ofways.When their evolutionary paths took them into the
oceans, marine mammals had to adapt sensory systems thathad evolved in air into ones that were able to detect and
process Signals in water. The sensory systems of marine. mammals are functionally similar to those of terrestrialmammals in that they act as highly selective filters. If everyenvironmental cue available received equal attention, the
brain would be barraged by sensory inputs. Instead, sensoryorgans are filters, selecting and attending to signals that, evolutionarily, proved to be important. Consider how predatorand prey are driven to be both similar and different sensori
ally. Because their activities intersect in place and time, theyneed to have similar visual sensitivities, but different fieldsof view. The predator usually has binocular overlap that
provides a precise judgment of distance to the prey. The
prey may forego binocular vision and accurate visual depthjudgments in favor ofgreater lateral visual fields to detect a
predator. Thus, two species may have overlapping sensoryranges, but no two have identical sensory capacities. Consequently, each animal's perceived world is only a subset ofthereal phYSical world, that is, it is a species-specific model, con
structed from the blocks ofdata its senses can capture.In animal behavior, this concept is called the Umwelt (von
UexkU1l1934). As a technical term, Umwelt means an animal's perceptually limited construct of the world. In com
mon usage, it simply means the environment. This dualmeaning reflects the complex interaction ofsensory adaptations and habitat. Senses are tuned to relevant stimuliby evolution but are limited by the physical parameters ofthe habi
tat. For example, human sensory systems are geared todiurnal, airborne cues. Humans are highly developed visually, with 38 times more optic nerve fibers than auditorynerve fibers, and a hearing range (20 to 20,000 Hz) that is narrower than that ofmany other animals. By observingspecies
adapted to different habitats and analyzing their sensory biology, we can learn how they detect and use phYSical cuesthat are normally imperceptible to us. Ifwe develop technology that translates those cues into our sensory ranges, we
can glimpse at the world as other species perceive it. Marinemammals offer us a very special glimpse. In aquatic environ-
117
In: Biology ofMarine Mammals. J. Reynolds and S. Rommel (eds.), Smithsonian Institution Press, 1999, pp. 117-175.
118 DOUGLAS WARTZOK AND DARLENE R. KETTEN
ments, our air-adapted senses are out of their element andare effectively detuned. By studying marine mammal sensory systems and abilities, we can understand how land
mammal senses were evolutionarily retuned to operate inwater. From that knowledge, we gain a valuable windowinto the oceans, the most extensive and unexplored environ
ment on earth.In this chapter, we discuss marine mammal audition, vi
sion, chemoreception, tactile sensation, and magnetic detec
tion. We begin with an overview of the basic aspects ofsensory receptor systems, and then, for specific sensory systems, examine how water versus air affects the parametersand propagation ofrelated Signals and discuss how air-based
receptors were adapted to function effectively in an aquaticenvironment. Different sensory systems and different marine mammal groups (sirenians, cetaceans, pinnipeds, fis
sipeds, ursids) are discussed in varying detail based on theextent ofdata available for each.
Generally, the term sensory system refers to the peripheral, as opposed to the brain, or central, components an
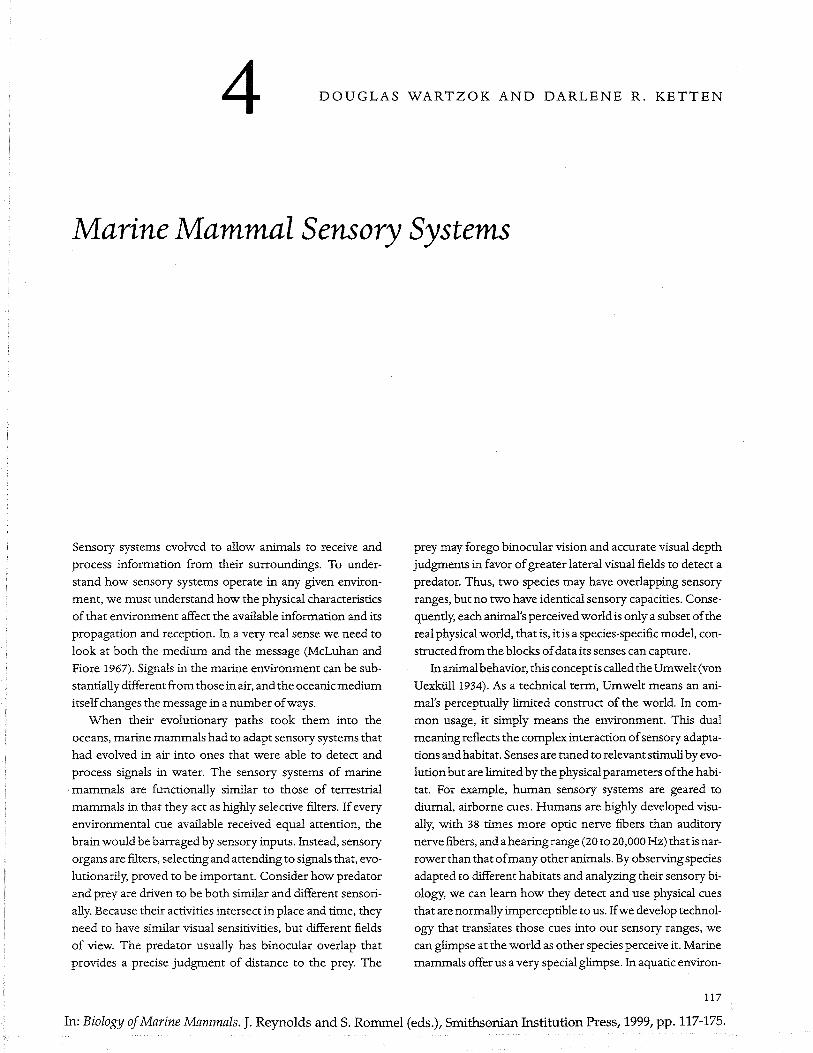
animal uses to detect and analyze a signal. There are four essential functions for any sensory system: (1) capture an envi
ronmental signal, (2) filter it, (3) transduce it to a neuralimpulse, and (4) send processed information to the centralnervous system. Each function may involve more than one
form ofreceptor orperipheral processor. The block diagramin Figure 4-1 compares a generic sensory receptor systemwith equivalent stages for mammalian eyes and ears. In vision, the first step, signal capture, is accomplished by the re-
fraction oflight at the cornea and the pupil's ability to control
the light intensity entering the eye. Second, the lens focuseslight on the retina while also acting as a first-stage filter, passing only some portions of the full spectrum of light. Thetapetum, a reflective layerbehind the retina, reflects the pho
tons not captured on the first passage through the retina backthrough for a second chance at absorption. Third, pigments
within the rod and cone receptor cells absorb each wavelength with a different efficiency. Fourth, the rods or conespass a chemical signal to horizontal orbipolar cells that modify and transmit the Signal to amacrine or ganglion cells. Ax
ons ofganglion cells make up the optic nerve, which passessignals to midbrain structures and ultimately to the cortex.In hearing, the first step is the capture ofsound by the external ear. The external ear and the ear canal act as first-stage
filters, attenuating some sounds based on their direction(pinnal shadowing) and amplifying others according to theresonance characteristics ofthe outer ear and canal. Second,
the middle ear components act as second stage filters. Themiddle ear bones mechanically transmit vibrations of theeardrum, or tympanic membrane, to the oval window,
which is the acoustic entrance to the fluid-filled inner ear.Thisbony chain acts as a series oflevers that provides a nearly
4o-dB boost to the incoming signal, which compensates forthe loss ofacoustic power that would normally occur from asimple transmission of sound in air into flUid. The mass,stiffuess, and shape ofthe middle ear cavity and ofthe middle
ear ossicular chain also influence the efficiency with whichdifferent frequencies are transmitted to the inner ear. Third,
Conditoning&
Transmission
Figure 4-1. A generic sen
sory system is shown with
parallel stages for mammalian
visual and auditory systems.
Optic nerve
Lens focusing& TapetalReflection
Middle earOssicular
ImpedanceMatch
& Amp6fication
Marine Mammal Sensory Systems 119
but no terrestrial habitat is without sound, and no knownvertebrate is naturally profoundly deaf.
Mechanistically, hearing is a relatively simple chain of
events: sound energy is converted by biomechanical transducers (middle and inner ear) into electrical signals (neuralimpulses) that provide a central processor (brain) withacoustic data. Mammalian ears are elegant structures, pack
ing more than 75,000 mechanical and electrochemical components into an average volume of 1 cm'. Variations in thestructure and numberofthese components account for most
ofthe hearing capacity differences among mammals (for anoverview, see Webster et al. 1992).
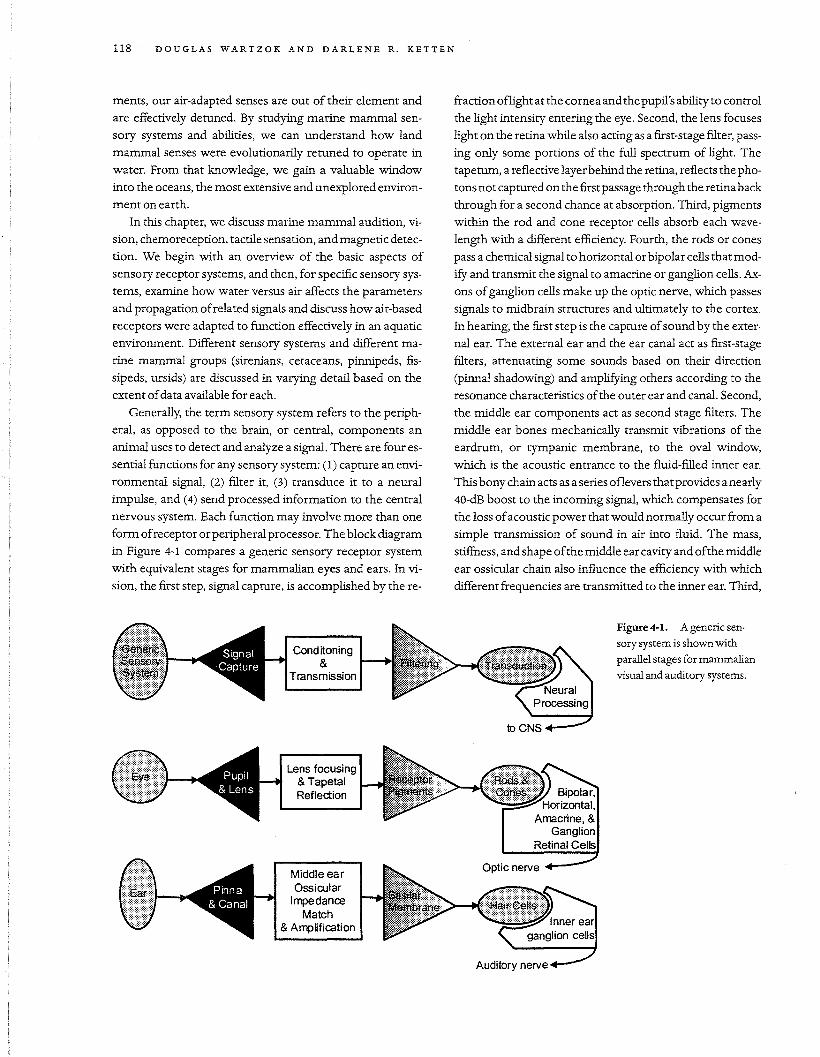
Normal functional hearing ranges and the sensitivity at
each audible frequency (threshold, or minimum intensityrequired to hear a given frequency) vary widely by species(Fig. 4-2). "Functional" hearing refers to the range of fre
quencies a species hears without entraining nonacousticmechanisms. In land mammals, the functional range is gen
erally considered to be those frequencies that canbe heard atthresholds below 60 dB SPL. (dB SPL refers to a decibel measure of sound pressure level. The basis for this measure and
how it differs in air and water are explained in detail in thenext section.) For example, a healthy human ear has a poten
tial maximum frequency range of0.02 to 20 kHz, butthe normal functional hearing range in an adult is closer to 0.04 to 16kHz. 1 In humans, best sensitivity (lowest thresholds) occursbetween 500 Hz and 4 kHz, which is also where most ofthe
acoustic energy in speech occurs (Fig. 4-2; Schuknecht 1993;
Yost 1994). To hear frequencies at the extreme ends of any
animal's total range generally requires intensities that areuncomfortable, and some frequencies are simply unde-
at the level of the inner ear, the basilar membrane acts as abank of filters that determine the range of frequencies thebrain will ultimately process. The detectable sound or "hear
ing" range is dictated by the stiffness and mass characteristicsof this membrane. Fourth, when sensory cells with flexiblecilia, the hair cells, are bent through the motion ofthe basilar
membrane, a chemical signal is transmitted via the auditoryafferent (inward) fibers to the brainstem. Thus, in both theeye and ear, the'signal goes through a minimum ofthree andas many as five layers ofsignal processing before it is trans
formed into a neural impulse.For both sensory systems, there is extensive central pro
cessing as well as efferent (outward) feedback signals fromthe central nervous system that affect the responses at thereceptor. Depending on the stimulus, the behavioral and
physiologic state of the animal, and the type of receptor, astimulus can be perceived but elicit no action, or it canprompt a set of signals to be sent to an effector that modulates the stimulus intensity, as in withdrawal from pain,
pupillary contraction in bright light, or rotation ofthe heador pinna to enhance detection ofa particular sound. Nowweturn to a more detailed look at individual sensory systems.
Audition
Hearing is simply the detection of sound. "Sound" is thepropagation ofa mechanical disturbance through a medium.In elastic media, such as air and water, that disturbance takes
the form of acoustic waves. The adaptive significance of
sound cues is underscored by the ubiquity ofhearing. Thereare lightless habitats on earth with naturally blind animals,
100
80
-...JC. 60CJ)
In"0-'''0 40'0.c:UICI)... 20.c:I-
0
.... human
...... owl monkey
-e- rat-0- cow.... elephant
-0- dog...... opossum
.... bat
Figure 4-2. Audiograms ofrepresentative
terrestrial mammals. Note that the ordinate
is labeled dB SPL and therefore, thresholds
are atornearO dB in the regions ofbest
sensitivity for most species (data compiled
from Fay 1988). The human curve ends
abruptly near 100 Hz at its low-frequency
end because most human hearingsmdies
have focused on speech perception and
subjects are not tested over the full human
hearing range. Compare these audiograms
for land mammals in air with the underwater
audiograms for cetaceans and pinnipeds in
Figure 4-5, taking into consideration the
effect that differing reference pressures have
on reported threshold values.
100101.1-20 +-~~~.,.--~~~.---~~~r--~~.........,..,r---~
.01
Frequency (kHz)
120 DOUGLAS WAR TZOK AND DARLENE R. KETTEN
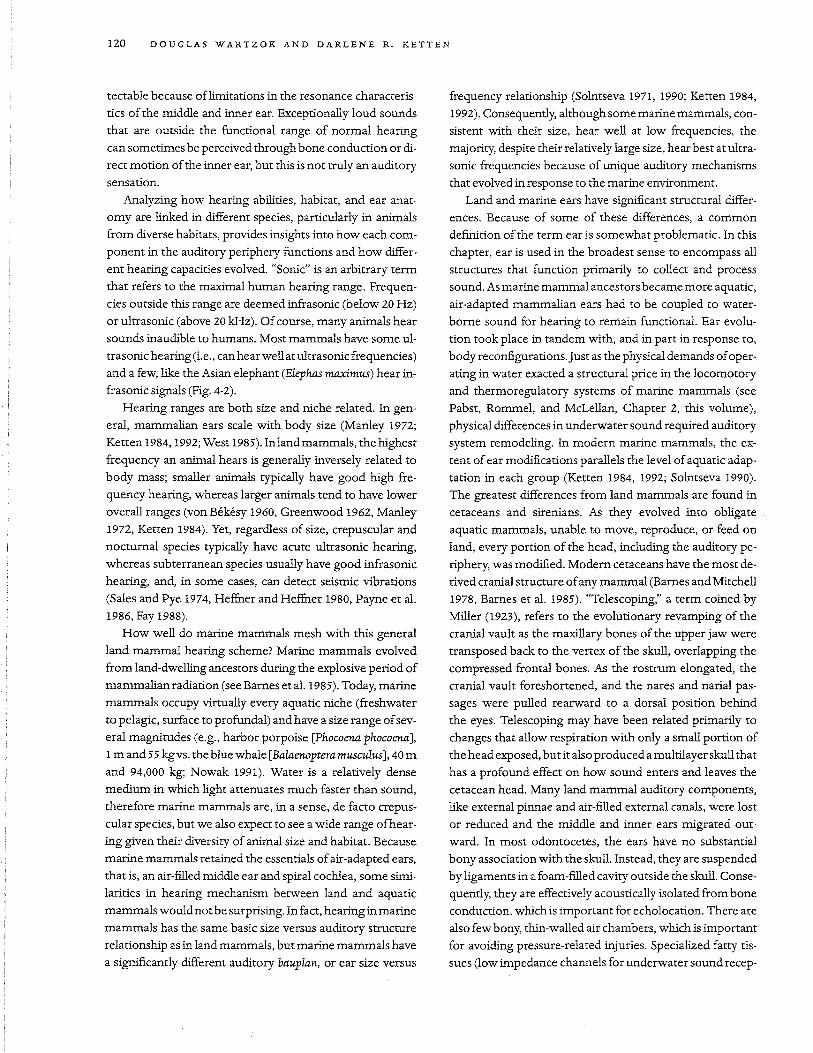
teetable because oflimitations in the resonance characteristics of the middle and inner ear. Exceptionally loud soundsthat are outside the functional range of normal hearing
can sometimes be perceived through bone conduction or direct motion ofthe inner ear, but this is not truly an auditorysensation.
Analyzing how hearing abilities, habitat, and ear anatomy are linked in different species, particularly in animalsfrom diverse habitats, provides insights into how each com
ponent in the auditory periphery functions and how different hearing capacities evolved. "Sonic" is an arbitrary termthat refers to the maximal human hearing range. Frequen
cies outside this range are deemed infrasonic (below 20 Hz)or ultrasonic (above 20 kHz). Ofcourse, many animals hearsounds inaudible to humans. Most mammals have some ultrasonic hearing (Le., canhearwell at ultrasonic frequencies)
and a few, like the Asian elephant (Elephas maximus) hear infrasonic signals (Fig. 4-2).
Hearing ranges are both size and niche related. In general, mammalian ears scale with body size (Manley 1972;
Ketten 1984, 1992; West 1985). Inland mammals, the highest
frequency an animal hears is generally inversely related tobody mass; smaller animals typically have good high frequency hearing, whereas larger animals tend to have loweroverall ranges (von Bekesy 1960, Greenwood 1962, Manley
1972, Ketten 1984). Yet, regardless of size, crepuscular andnocturnal species typically have acute ultrasonic hearing,
whereas subterranean species usually have good infrasonichearing, and, in some cases, can detect seismic vibrations(Sales and Pye 1974, Heffner and Heffner 1980, Payne et al.1986, Fay 1988).
How well do marine mammals mesh with this generalland mammal hearing scheme? Marine mammals evolvedfrom land-dwelling ancestors during the explosive period ofmammalian radiation (see Barnes et al. 1985). Today, marine
mammals occupy Virtually every aquatiC niche (freshwaterto pelagic, surface to profundal) and have a size range ofseveral magnitudes (e.g., harbor porpoise [Phocoena phocoena],
1 m and 55 kgvs. the blue whale [Balaenoptera musculus], 40 mand 94,000 kg; Nowak 1991). Water is a relatively densemedium in which light attenuates much faster than sound,therefore marine mammals are, in a sense, de facto crepus
cular species, but we also expect to see a wide range ofhearing given their diversity of animal size and habitat. Becausemarine mammals retained the essentials ofair-adapted ears,that is, an air-filled middle ear and spiral cochlea, some simi
larities in hearing mechanism between land and aquaticmammals would notbe surprising. In fact, hearing in marinemammals has the same basic size versus auditory structure
relationship as in land mammals, but marine mammals havea significantly different auditory bauplan, or ear size versus
frequency relationship (Solntseva 1971, 1990; Ketten 1984,
1992). Consequently, although some marine mammals, consistent with their size, hear well at low frequencies, the
majority, despite their relatively large size, hear best at ultrasonic frequencies because of unique auditory mechanismsthat evolved in response to the marine environment.
Land and marine ears have significant structural differ
ences. Because of some of these differences, a commondefinition of the term ear is somewhat problematiC. In thischapter, ear is used in the broadest sense to encompass all
structures that function primarily to collect and processsound. As marine mammal ancestors became more aquatic,air-adapted mammalian ears had to be coupled to waterborne sound for hearing to remain functional. Ear evolu
tion took place in tandem with, and in part in response to,
body reconfigurations.Just as the physical demands ofoperating in water exacted a structural price in the locomotoryand thermoregulatory systems of marine mammals (seePabst, Rommel, and McLellan, Chapter 2, this volume),physical differences in underwater sound required auditorysystem remodeling. In modern marine mammals, the ex
tent ofear modifications parallels the level ofaquatic adaptation in each group (Ketten 1984, 1992; Solntseva 1990).
The greatest differences from land mammals are found incetaceans and sirenians. As they evolved into obligateaquatic mammals, unable to move, reproduce, or feed on
land, every portion of the head, including the auditory periphery, was modified. Modern cetaceans have the most derived cranial structure ofany mammal (Barnes and Mitchell
1978, Barnes et al. 1985). "Telescoping," a term coined byMiller (1923), refers to the evolutionary revamping of thecranial vault as the maxillary bones of the upper jaw were
transposed back to the vertex of the skull, overlapping thecompressed frontal bones. As the rostrum elongated, thecranial vault foreshortened, and the nares and narial pas
sages were pulled rearward to a dorsal position behindthe eyes. Telescoping may have been related primarily tochanges that allow respiration with only a small portion ofthe head exposed, but it also produced a multilayer skull thathas a profound effect on how sound enters and leaves the
cetacean head. Many land mammal auditory components,like external pinnae and air-filled external canals, were lostor reduced and the middle and inner ears migrated out
ward. In most odontocetes, the ears have no substantialbony association with the skull. Instead, they are suspendedby ligaments in a foam-filled cavity outside the skull. Consequently, they are effectively acoustically isolated from boneconduction, which is important for echolocation. There are
also few bony, thin-walled air chambers, which is importantfor avoiding pressure-related injuries. Specialized fatty tissues (low impedance channels for underwater sound recep-
Marine Mammal Sensory Systems 121
Sound in Air Versus Water
In analyzingmarine mammal hearing, it is important to consider how the physical aspects of sound in air versus wateraffect acoustic cues. Basic measures ofsound are frequency,
speed, wavelength, and intensity. Frequency if), measuredin cycles Isec or hertz (Hz), is defined as:
tion) evolved that appear to function in lieu ofexternal airfilled canals.
Mysticete ears are also specializedbut they appearto havebeen shaped more by size adaptations than by special hearing functions. Sirenian ears are not as well understood, but
they too appear to have many highly derived adaptations forunderwater sound reception. Today, cetacean and sirenian
ears are so specialized for waterborne sound perception thatthey may no longer be able to detect or interpret airbornesound at normal ambient levels. On the other hand, ears ofsea otters (Enhyra lutris) and some otariids have very fewanatomical differences from those of terrestrial mammals,
and it is possible these ears represent a kind of amphibiouscompromise or even that they continue to be primarily airadapted.
Thatbrings us to three major auditoryquestions: (1) Howdo marine and terrestrial ears and hearing differ?; (2) How dothese differences relate to underwater sound perception?;
and (3) How do amphibious species manage hearing in bothdomains? To address these questions requires collating awide variety of data. Behavioral and electrophysiological
measures are available for some odontocetes and pinnipeds,but there are no published hearing curves for any mysticete,sirenian, or marine fissiped. Anatomical correlates of hear
ing are fairly well established (Greenwood 1961,1962,1990;Manley 1972; for reviews, see Fay 1988,1992; Echteler et al.1994). Anatomical data are available on some aspects ofthe
auditory system for approximately one-third of all marinemammal species, including nearly half of the larger, noncaptive species. Therefore, to give the broadest view ofcur
rent marine mammal hearing data, both audiometric andanatomical data are discussed. An outline ofphysical measures ofsound in air versus water and ofthe basic mechanisms
of mammalian hearing are given first as background forthese discussions.
lair =p21(0.0013 glcm3)(340 m/sec)
=p2 I (0.442 g-m/sec-cm3)
Iwater =p21(1.03 glcm3)(1530 m/sec)
=p21(1575 g-m/sec-cm3)
(equation 3)
(equation 2)I= Pia =Pvla =pv
I=pv= p(plpc) =p2/pc
For a traveling spherical wave, the velocity componentbecomes particle velocity (u), which in terms of effective
sound pressure can be defined as pI pc where p is the densityofthe medium. The product pc is called the charateristic im
pedance ofthe medium.We can then redefine intensity (equation 2) for an instan
taneous sound pressure for an outward traveling plane wavein terms ofpressure, sound speed, and denSity:
Recall that for air c =340 m/sec and for seawater c =1530
m/sec; for air, p =0.0013 glcm3; for seawater, p = 1.03
glcm3• The follOwing calculations using the intensity-pres
sure-impedance relation expressed in equation 3 show howthe differences in the physical properties ofwater versus air
influence intensity and acoustic pressure values:
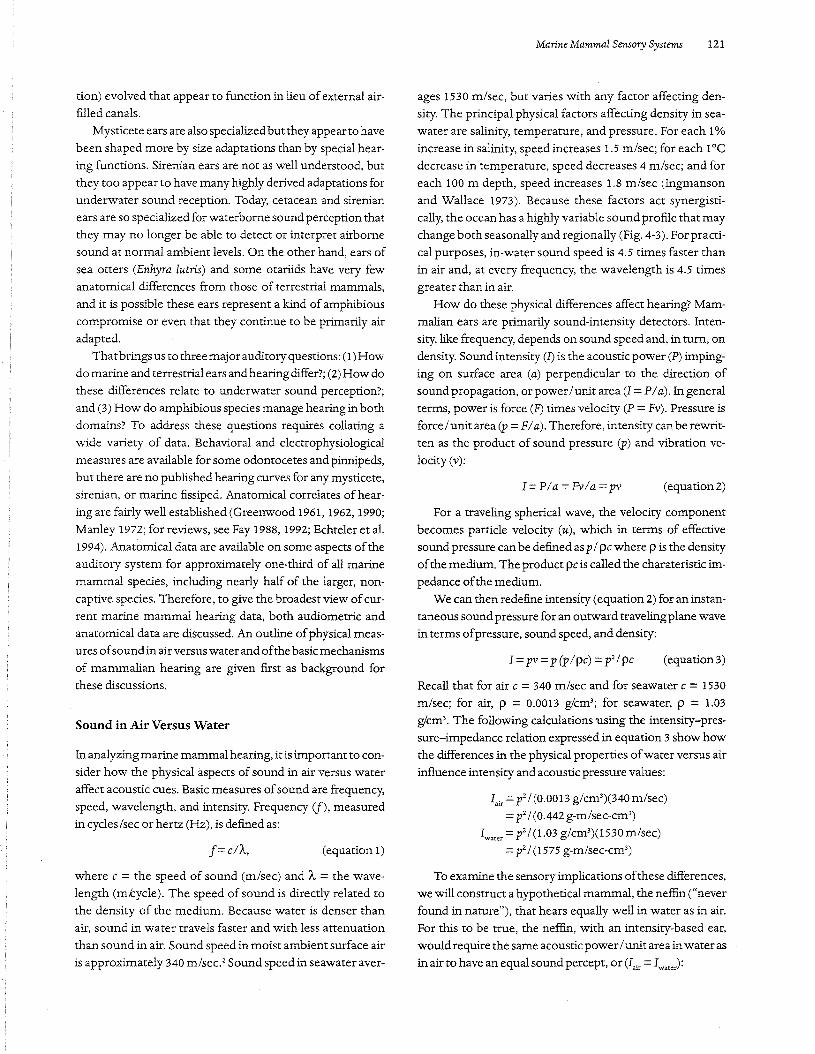
ages 1530 m/sec, but varies with any factor affecting density. The principal physical factors affecting density in sea
water are salinity, temperature, and pressure. For each 1%
increase in salinity, speed increases 1.5 m/sec; for each 1°Cdecrease in temperature, speed decreases 4 m/sec; and for
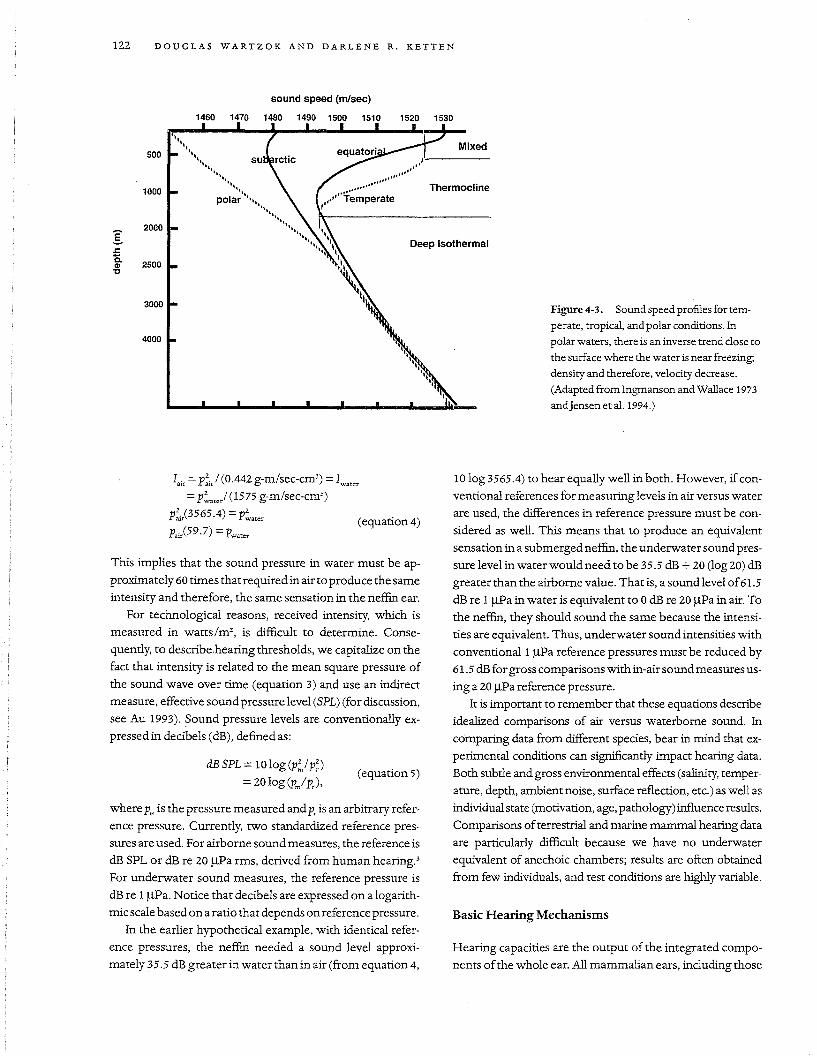
each 100 m depth, speed increases 1.8 m/sec (Ingmansonand Wallace 1973). Because these factors act synergistically, the ocean has a highly variable sound profile that maychange both seasonally and regionally (Fig. 4-3). For practi
cal purposes, in-water sound speed is 4.5 times faster thanin air and, at every frequency, the wavelength is 4.5 timesgreater than in air.
How do these physical differences affect hearing? Mammalian ears are primarily sound-intensity detectors. Intensity, like frequency, depends on sound speed and, in turn, on
denSity. Sound intensity (1) is the acoustic power (P) impinging on surface area (a) perpendicular to the direction ofsound propagation, or power/ unit area (I =Pia). In generalterms, power is force (F) times velocity (P =Pv). Pressure is
force I unit area (p =Pia). Therefore, intensity can be rewritten as the product of sound pressure (p) and vibration velocity (v):
(equation 1)f=c/'A,
where c =the speed of sound (m/sec) and 'A =the wavelength (mkycle). The speed of sound is directly related tothe density of the medium. Because water is denser thanair, sound in water travels faster and with less attenuation
than sound in air. Sound speed in moist ambient surface airis approximately 340 m/sec. 2 Sound speed in seawater aver-
To examine the sensory implications ofthese differences,we will construct a hypothetical mammal, the neffin ("neverfound in nature"), that hears equally well in water as in air.For this to be trUe, the neffin, with an intenSity-based ear,
would require the same acoustic power/ unit area in water as
in air to have an equal sound percept, or (Iair =IwateJ
122 DOUGLAS WARTZOK AND DARLENE R. KETTEN
sound speed (mlsec)
1460 1470 1480 1490 1500 1510 1520 1530
500
1000
g 2000
.cis. 2500Ql"tl
4000
Mixed
Thermocline
Deep Isothermal
Figure 4-3. Sound speed profiles fortem
perate, tropical, and polar conditions. In
polar waters, there is an inverse trend close ro
the surface where the water is near freezing;
density and therefore, velOCity decrease.
(Adapted from Ingmanson and Wallace 1973
andJensen et aI. 1994.)
Basic Hearing Mechanisms
10 log 3565.4) to hear equally well in both. However, ifconventional references for measuring levels in air versus waterare used, the differences in reference pressure must be con
sidered as well. This means that to produce an equivalentsensation in a submerged neffin, the underwater soundpressure level in water would need to be 35.5 dB + 20 (log 20) dB
greater than the airborne value. That is, a sound level of61.5
dB re 1 J..l.Pa in water is equivalent to 0 dB re 20 J..l.Pa in air. Tothe neffin, they should sound the same because the intensi
ties are equivalent. Thus, underwater sound intensities withconventional 1 J..l.Pa reference pressures must be reduced by61.5 dB for gross comparisons with in-air soundmeasures us
ing a 20 J..l.Pa reference pressure.It is important to remember that these equations describe
idealized comparisons of air versus waterborne sound. In
comparing data from different species, bear in mind that experimental conditions can significantly impact hearing data.Both subtle and gross environmental effects (salinity, temperature, depth, ambient noise, surface reflection, etc.) as well asindividualstate (motivation, age, pathology) influence results.
Comparisons ofterrestrial and marine mammal hearing dataare particularly difficult because we have no underwaterequivalent of anechoic chambers; results are often obtainedfrom few individuals, and test conditions are highly variable.
Hearing capacities are the output of the integrated compo
nents ofthe whole ear. All mammalian ears, including those
(equation 4)
(equation 5)dBSPL= 10logcp~/p;)
=20 log CPm/Pr)'
lair = P;i) (0.442 g-m/sec-cm3) = Iwater
=P~,",e/ (1575 g-m/sec-cm3)
p;iP565.4) =P~ater
Pa;/59.7) =Pwarer
This implies that the sound pressure in water must be ap
proximately 60 times that required in air to produce the sameintensity and therefore, the same sensation in the neffin ear.
For technological reasons, received intensity, which is
measured in watts1m2, is difficult to determine. Conse
quently, to describe .hearing thresholds, we capitalize on thefact that intensity is related to the mean square pressure of
the sound wave over time (equation 3) and use an indirectmeasure, effective soundpressure level (SPL) (for discussion,see Au 1993). Sound pressure levels are conventionally expressed in decibels (dB), defined as:
where Pm is the pressure measured and Pr is an arbitrary reference pressure. Currently, two standardized reference pres
sures are used. For airborne sound measures, the reference isdB SPL or dB re 20 J..l.Pa rms, derived from human hearing. 3
For underwater sound measures, the reference pressure is
dB re 1 J..l.Pa. Notice that decibels are expressed on a logarithmic scale based on a ratio that depends on reference pressure.
In the earlier hypothetical example, with identical reference pressures, the neffin needed a sound level approxi
mately 35.5 dB greater in water than in air (from equation 4,
ofmarine mammals, have three basic divisions: (1) an outerear, (2) an air-filled middle ear with bony levers and membranes, and (3) a fluid-filled inner ear with mechanical res
onators and sensory cells. The outer ear acts as a sound collector. The middle ear transforms acoustic components into
mechanical ones detectable by the inner ear. The inner earacts as a band-pass filter and mechanochemical transducer ofsound into neural impulses.
The outer ear is subdivided conventionally into apinna or
ear flap that assists in localization and the ear canal. The sizeand shape of each component in each species is extraordinarily diverse, which makes any generalized statement
about the function ofthe outer ear debatable. In most mammals, the pinnal flaps are distinct flanges that may be mobile.These flanges act as sound diffractors that aid in localization,
primarily by acting as a funnel that selectively admits soundsalong the pinnal axis (Heffuer and Heffuer 1992).
The middle ear is commonly described as an impedancematching device or transformer that counteracts the ap
proximately 36-dB loss from the impedance differences between air and the fluid-filled inner ear, an auditory remnant
of the original vertebrate move from water onto land. Thisgain is achieved by the mechanical advantage provided bydifferences in the middle ear membrane areas (large tym
panic vs. small oval window) and by the lever effect ofthe ossicular chain that creates a pressure gain and a reduction inparticle velocity at the inner ear.
Improving the efficiency of power transfer to the innerear may not, however, be the only function for the middleear. Recent studies on land mammals have led to a com
peting (but not mutually exclusive) theory called the peripheral filter-isopower function, in which the middle ear has a"tuning" role (for comprehensive discussions, see Zwislocki 1981, Rosowski 1994, Yost 1994). The middle ear varies
widely among species in volume, stiffuess (K), and mass (M).
Each species has a characteristic middle ear resonance basedon the combined chain of impedances, which, in turn, de
pends on the mechanical properties ofits middle ear components. For any animal, the sum ofimpedances is lowest (i.e.,middle ear admittance is greatest and energy transmissionmost efficient), atthe middle ear's resonant frequency (f). As
expected, this frequency also tends to be at or near the frequency with the lowest threshold (best sensitivity) for that
species (Fay 1992).Stiffuess and mass have inverse effects on frequency in a
resonant system:
f= Gn) )K/ M. (equation 6)
Put another way, mass-dominated systems have a lower res
onant frequency than stiffuess-dominated systems. Increasing stiffuess in any ear component (membranes, ossicles,
Marine Mammal Sensory Systems 123
cavity) improves the efficiency of transmission of high frequencies. Addingmass to the system (e.g., by increasing cav
ity volume or increasing ossicular chain mass) favors lowfrequencies. Consequently, in addition to impedance match
ing, middle ears may be evolutionarily tuned by differentcombinations ofmass or stiffening agents in each species. Ultrasonic species, like microchiropteran bats and dolphins,have ossicular chains stiffened with bony struts and fused articulations (Reysenbach de Haan 1956, Pye 1972, Sales and
Pye 1974, Ketten andWartzok 1990). Low frequency species,like heteromyid desert rodents, mole rats, elephants, andmysticetes, have large middle ears with flaccid tympanicmembranes (Webster 1962; Hinchcliffe and Pye 1969; Web
ster and Webster 1975; Fleischer 1978; Ketten 1992, 1994).Inner ears are similarly tuned, in that inner ear stiffuess
and mass characteristics are major determinants ofspecies
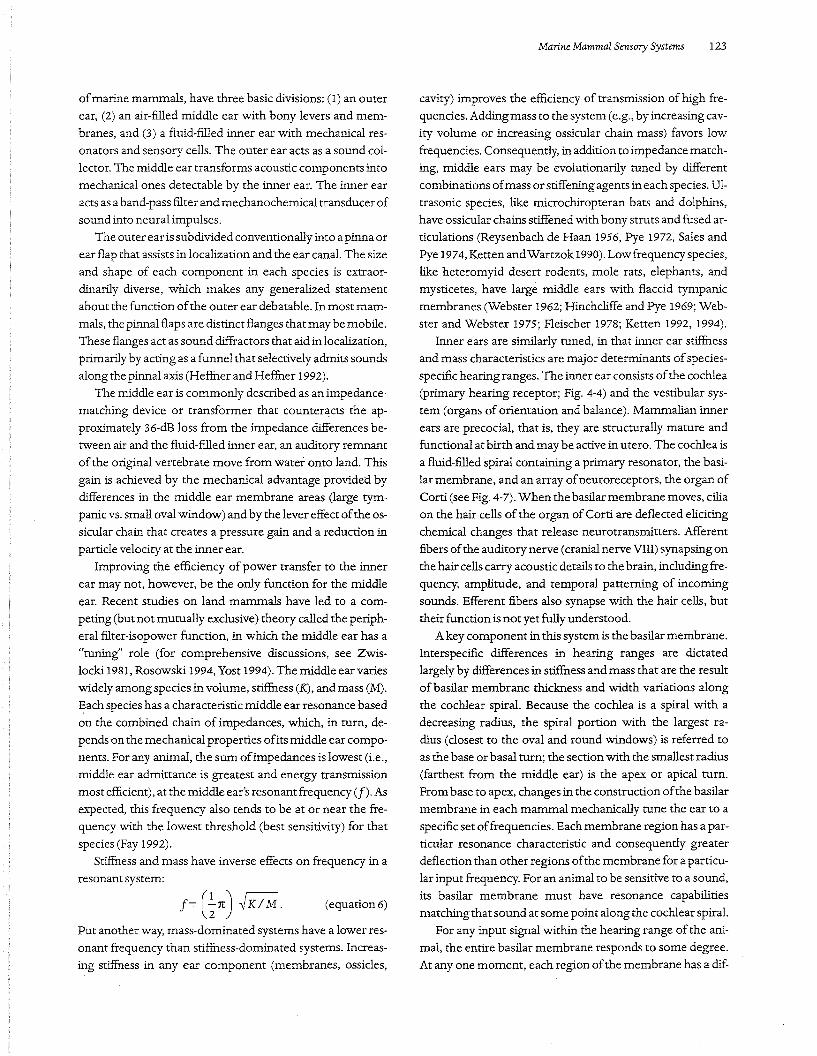
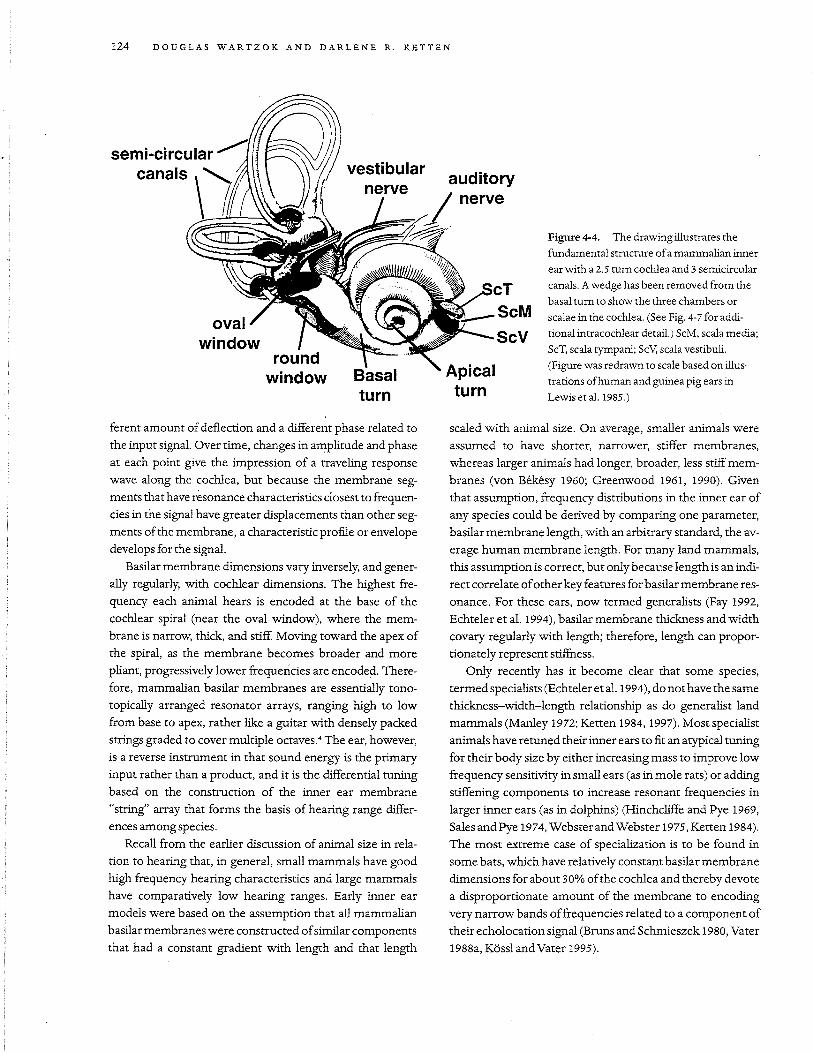
specific hearing ranges. The inner ear consists ofthe cochlea(primary hearing receptor; Fig. 4-4) and the vestibular system (organs of orientation and balance). Mammalian inner
ears are precocial, that is, they are structurally mature andfunctional at birth and may be active in utero. The cochlea isa fluid-filled spiral containing a primary resonator, the basi
lar membrane, and an array ofneuroreceptors, the organ ofCorti (see Fig. 4-7). When the basilar membrane moves, ciliaon the hair cells of the organ ofCorti are deflected elicitingchemical changes that release neurotransmitters. Afferent
fibers ofthe auditory nerve (cranial nerve VIII) synapsing onthe hair cells carry acoustic details to the brain, including fre
quency, amplitude, and temporal patterning of incomingsounds. Efferent fibers also synapse with the hair cells, buttheir function is not yet fully understood.
A key component in this system is the basilar membrane.Interspecific differences in hearing ranges are dictatedlargely by differences in stiffuess and mass that are the resultof basilar membrane thickness and width variations along
the cochlear spiral. Because the cochlea is a spiral with adecreasing radius, the spiral portion with the largest radius (closest to the oval and round windows) is referred toas the base or basal turn; the section with the smallest radius
(farthest from the middle ear) is the apex or apical turn.From base to apex, changes in the construction ofthe basilarmembrane in each mammal mechanically tune the ear to aspecific set offrequencies. Each membrane region has a par
ticular resonance characteristic and consequently greaterdeflection than other regions ofthe membrane for a particular input frequency. For an animal to be sensitive to a sound,its basilar membrane must have resonance capabilities
matching that sound at some pOint along the cochlear spiral.For any input signal within the hearing range of the ani
mal, the entire basilar membrane responds to some degree.At anyone moment, each region ofthe membrane has a dif-
124 DOUGLAS WAR TZOK AND DARLENE R. KETTEN
semi-circular ........-Icanals auditory:I nerve
~:=;~"X'~'Figure 4-4. The drawing illustrates rhe
fundamental structure ofa mammalian inner
ear with a 2.5 turn cochlea and 3 semicircular
canals. A wedge has been removed from the
basal turn to show rhe rhree chambers or
scalae in rhe cochlea. (See Fig. 4-7 for addi
tionalintracochlear detail.) ScM, scala media;
SeT, scala tympani; ScV; scala vestibuli.
(Figure was redrawn to scale based on illus
trations ofhuman and guinea pig ears in
Lewis et al. 1985.)
ferent amount of deflection and a different phase related tothe input signal. Over time, changes in amplitude and phase
at each point give the impression of a traveling responsewave along the cochlea, but because the membrane segments that have resonance characteristics closest to frequen
cies in the signal have greater displacements than other segments ofthe membrane, a characteristic profile or envelopedevelops for the signal.
Basilar membrane dimensions vary inversely, and generally regularly, with cochlear dimensions. The highest frequency each animal hears is encoded at the base of thecochlear spiral (near the oval window), where the mem
brane is narrow, thick, and stiff. Moving toward the apex ofthe spiral, as the membrane becomes broader and more
pliant, progressively lower frequencies are encoded. Therefore, mammalian basilar membranes are essentially tonotopically arranged resonator arrays, ranging high to lowfrom base to apex, rather like a guitar with densely packed
strings graded to cover multiple octaves.4 The ear, however,is a reverse instrument in that sound energy is the primaryinput rather than a product, and it is the differential tuningbased on the construction of the inner ear membrane
"string" array that forms the basis of hearing range differences among species.
Recall from the earlier discussion of animal size in relation to hearing that, in general, small mammals have good
high frequency hearing characteristics and large mammalshave comparatively low hearing ranges. Early inner earmodels were based on the assumption that all mammalian
basilar membranes were constructed ofsimilar componentsthat had a constant gradient with length and that length
scaled with animal size. On average, smaller animals wereassumed to have shorter, narrower, stiffer membranes,
whereas larger animals had longer, broader, less stiff membral1es (von Bekesy 1960; Greenwood 1961, 1990). Giventhat assumption, frequency distributions in the inner ear of
any species could be derived by comparing one parameter,basilar membrane length, with an arbitrary standard, the av·
erage human membrane length. For many land mammals,this assumption is correct, but only because length is an indirect correlate ofother key features for basilar membrane res
onance. For these ears, now termed generalists (Fay 1992,Echteler et al. 1994), basilar membrane thickness and widthcovary regularly with length; therefore, length can propor
tionately represent sti.ffuess.Only recently has it become clear that some species,
termed specialists (Echteler et al. 1994), do nothave the samethickness-width-length relationship as do generalist landmammals (Manley 1972; Ketten 1984,1997). Most specialist
animals have retuned their inner ears to fit an atypical tuningfor their body size by either increasing mass to improve low
frequency sensitivity in small ears (as in mole rats) or addingstiffening components to increase resonant frequencies inlarger inner ears (as in dolphins) (Hinchcliffe and Pye 1969,Sales and Pye 1974, Webster and Webster 1975, Ketten 1984).The most extreme case of specialization is to be found insome bats, which have relatively constant basilar membrane
dimensions for about 30% ofthe cochlea and thereby devotea disproportionate amount of the membrane to encodingvery narrow bands offrequenCies related to a component of
their echolocation signal (Bruns and Schmieszek 1980, Vater1988a, K6ssl and Vater 1995).
Marine mammal ears fall into both categories and somespecies have amix ofgeneralist and specialist traits. Like landmammals, pinnipeds and cetaceans have basilar membranes
that scale with animal size. Consequently, because marinemammals are relatively large, most have basilar membraneslonger than the human average. Ifmarine mammal ears fol
lowed the generalist land mammal pattern, mostwould haverelatively poor ultrasonic hearing. For example, standardland mammal length-derived hearing models (Greenwood
1961, 1990; Fay 1992) predict an upper limit ofhearing ofapproximately 16 kHz for bottlenose dolphins (Tursiops trunca
tus), which actually have a functional high frequency hearinglimit of 160 kHz (Au 1993). Before the discovery of dolphin
echolocation, it was assumed that these large animals hadpredominately low functional hearing ranges similar tocows. Hearing is not constrained to low frequencies in ma
rine mammals, because they have radically different innerear thickness-width gradients than generalist land mammals. In odontocetes, very high ultrasonic hearing is related
also to the presence ofextensive stiffening additions to the inner ear. These features, discussed in detail later, demonstratethe usefulness of comparative audiometric and anatomical
studies for teasing apart sensory mechanisms. In fact, oneimportant outgrowth of marine mammal hearing studieshas been the development of multifeature hearing models
that are better predictors of hearing characteristics for allmammals than traditional, single-dimension models (Ketten 1994).
Marine Mammal Sound Production
Recordings of naturally produced sounds are available formost marine mammal species (Watkins and Wartzok 1985),and they proVide the broadest acoustic framework for hear
ing comparisons. Sound production data obtained in a widevariety ofbackground noise conditions cannot be used to infer hearing thresholds because it is likely that producedsound levels are elevated over minimum audible levels to
override background noise. Forexample, some recordings ofodontocete and mysticete sounds have source levels esti
mated to be as high as 180 to 230 dB re 11lPa (Richardson etal. 1991, Au 1993, Wtirsig and Clark 1993). However, because
mammalian vocalizations typically have peak spectra at ornear the best frequency for that species, they are generallygood indirect indicators offrequencies the animal normallyhears well (Sales and Pye 1974, Popper 1980, Watkins and
Wartzok 1985, Henson et al. 1990, Ketten andWartzok 1990,Popov and Supin 1990a). Aclassic example is the discovery ofultrasonic signal use by dolphins (Kellogg 1959, Norris et al.
1961), whichprompted several decades ofinvestigations into
Marine Mammal Sensory Systems 125
echolocation and ultrasonic hearing abilities in marinemammals.
Cetaceans
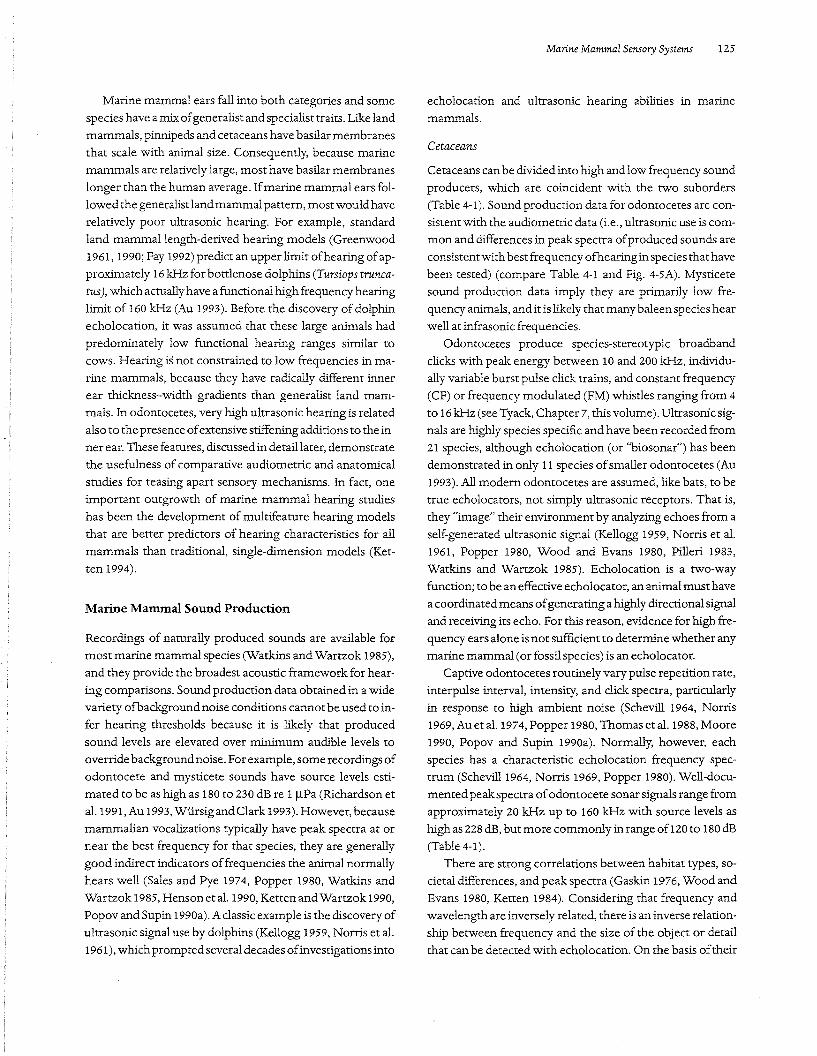
Cetaceans can be divided into high and low frequency sound
producers, which are coincident with the two suborders(Table 4-1). Sound production data for odontocetes are consistent with the audiometric data (Le., ultrasonic use is common and differences in peak spectra ofproduced sounds are
consistentwithbest frequency ofhearing in species that havebeen tested) (compare Table 4-1 and Fig. 4-5A). Mysticetesound production data imply they are primarily low fre
quency animals, and it is likely that many baleen species hearwell at infrasonic frequencies.
Odontocetes produce species-stereotypic broadbandclicks with peak energy between 10 and 200 kHz, individu
ally variable burst pulse click trains, and constant frequency(CF) or frequency modulated (FM) whistles ranging from 4to 16 kHz (see Tyack, Chapter 7, this volume). Ultrasonic sig
nals are highly species specific and have been recorded from21 species, although echolocation (or 'biosonar") has beendemonstrated in only 11 species ofsmaller odontocetes (Au
1993). All modern odontocetes are assumed, like bats, to betrue echolocators, not simply ultrasonic receptors. That is,they "image" their environment by analyzing echoes from a
self-generated ultrasonic signal (Kellogg 1959, Norris et al.1961, Popper 1980, Wood and Evans 1980, Pilleri 1983,Watkins and Wartzok 1985). Echolocation is a two-way
function; to be an effective echolocator, an animal must havea coordinated means ofgenerating a highly directional signaland receiving its echo. For this reason, evidence for high fre
quency ears alone is not sufficient to determine whether anymarine mammal (or fossil species) is an echolocator.
Captive odontocetes routinely vary pulse repetition rate,
interpulse interval, intensity, and click spectra, particularlyin response to high ambient noise (Schevill 1964, Norris1969,Auetal.1974,Popper 1980, Thomas et al. 1988,Moore1990, Popov and Supin 1990a). Normally, however, eachspecies has a characteristic echolocation frequency spec
trum (Schevill1964, Norris 1969, Popper 1980). Well-documented peakspectra ofodontocete sonar signals range fromapproximately 20 kHz up to 160 kHz with source levels ashigh as 228 dB, but more commonly in range of120 to 180 dB
(Table 4-1).There are strong correlations between habitat types, so
cietal differences, and peak spectra (Gaskin 1976, Wood andEvans 1980, Ketten 1984). Considering that frequency and
wavelength are inversely related, there is an inverse relationship between frequency and the size of the object or detailthat can be detected with echolocation. On the basis oftheir
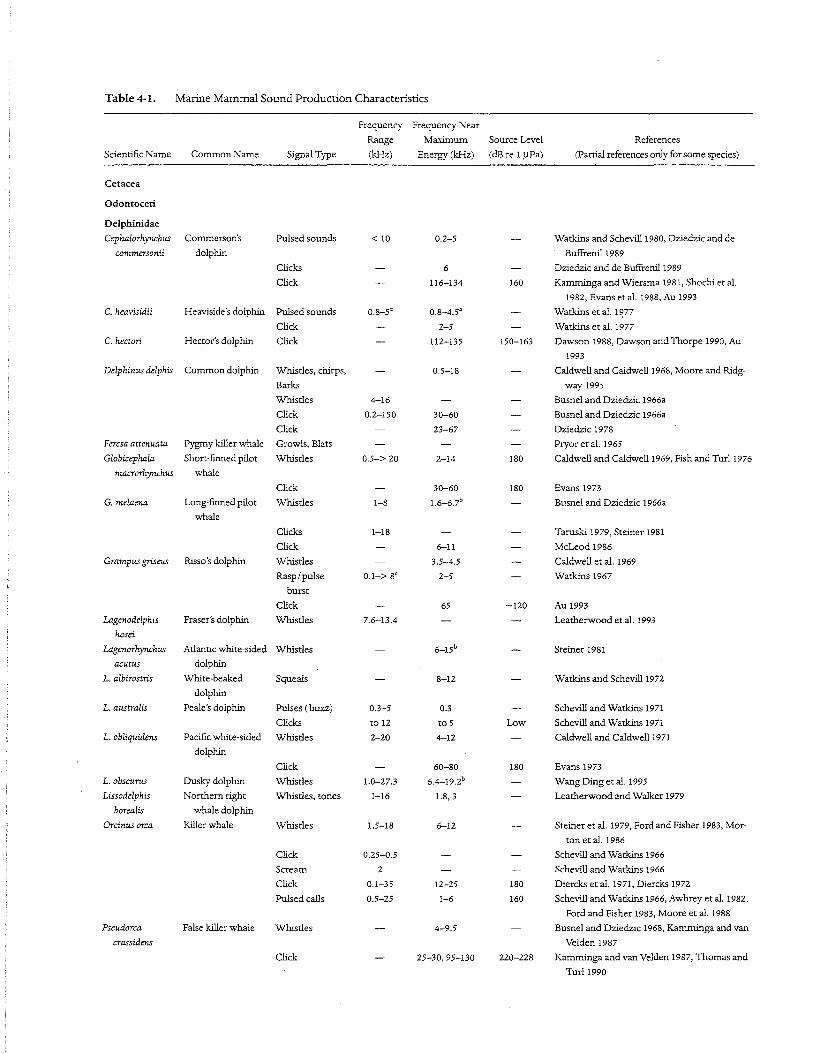
Table 4-1. Marine Mammal Sound Production Characteristics
Frequency Frequency Near
Range Maximum Source Level References
Scientific Name Common Name Signal Type (kHz) Energy (kHz) (dBre 1 J.lPa) (Partial references only for some species)
Cetacea
Odontoceti
Delphinidae
Cephalorhynchus Commerson's Pulsed sounds < 10 0.2-5 Watkins and Schevill1980, Dziedzic and de
commersonii dolphin Buffrenil1989
Clicks 6 Dziedzic and de Buffrenil1989
Click 116-134 160 Kamminga and Wiersma 1981, Shochi et al.
1982, Evans et al. 1988, Au 1993
C. heavisidii Heaviside's dolphin Pulsed sounds 0.8-5' 0.8-4.5' Watkins et al. 1~77
Click 2-5 Watkins et al. 1977
C. heetori Hector's dolphin Click 112-135 150-163 Dawson 1988, Dawson and Thorpe 1990, Au
1993
Delphinus delphis Common dolphin Whistles, chirps, 0.5-18 Caldwell and Caldwell 1968, Moore and Ridg-
Barks way 1995
Whistles 4-16 Busnel and Dziedzic 1966a
Click 0.2-150 30-60 Busnel and Dziedzic 1966a
Click 23-67 Dziedzic 1978
Feresa attenuata Pygmy killer whale Growls, Blats Pryor et al. 1965
Globicephala Short-finned pilot Whistles 0.5-> 20 2-14 180 Caldwell and Caldwell 1969, Fish and Turl1976
macrorhynchus whale
Click 30-60 180 Evans 1973
G. melaena Long-finned pilot Whistles 1-8 1.6-6.7b Busnel and Dziedzic 1966a
whale
Clicks 1-18 Taruski 1979, Steiner 1981
Click 6-11 McLeod 1986
Grampus griseus Risso's dolphin Whistles 3.5-4.5 Caldwell et al. 1969
Rasp/pulse 0.1-> 8' 2-5 Watkins 1967
burst
Click 65 -120 Au 1993
Lagenodelphis Fraser's dolphin Whistles 7.6-13.4 Leatherwood et al. 1993
hosei
Lagenorhynchus Atlantic white-sided Whistles 6-15b Steiner 1981
acutus dolphin
L. albirostris White-beaked Squeals 8-12 Watkins and Schevill1972
dolphin
L. australis Peale's dolphin Pulses (buzz) 0.3-5 0.3 Schevill and Watkins 1971
Clicks to 12 to 5 Low Schevill and Watkins 1971
L. obliquidens Pacific white-sided Whistles 2-20 4-12 Caldwell and Caldwell 1971
dolphin
Click 60-80 180 Evans 1973
L. obscurus Dusky dolphin Whistles 1.0-27.3 6.4-19.2b Wang Ding et al. 1995
Lissodelphis Northern right Whistles, tones 1-16 1.8,3 Leatherwood and Walker 1979
borealis whale dolphin
Orcinus orca Killer whale Whistles 1.5-18 6-12 Steiner et al. 1979, Ford and Fisher 1983, Mor-
ton et al. 1986
Click 0.25-0.5 Schevill and Watkins 1966
Scream 2 Schevill and Watkins 1966
Click 0.1-35 12-25 180 Diercks et al. 1971, Diercks 1972
Pulsed calls 0.5-25 1-6 160 Schevill and Watkins 1966, Awbrey et al. 1982,
Ford and Fisher 1983, Moore et al. 1988
Pseudorca False killer whale Whistles 4-9.5 Busnel and Dziedzic 1968, Kamminga and van
crassidens Velden 1987
Click 25-30,95-130 220-228 Kamminga and van Velden 1987, Thomas and
Turl1990
Table 4-1 continued
Frequency Frequency Near
Range Maximum Source Level References
Scientific Name Common Name Signal Type (kHz) Energy (kHz) (dB re 1 flPa) (Partial references only for some species)
Sotalia flUviatilis Tucuxi Whistles 3.6-23.9 7.1-18.5b Wang Ding et al. 1995
Click 80-100 High Caldwell and Caldwell 1970, Norris et al. 1972,
Kamminga et al. 1993
Sousa chinensis Humpback dolphin Whistles 1.2->16 Schultz and Corkeron 1994
Stenella attenuata Spotted dolphin Whistles 3.1-21.4 6.7-17.8b Wang Ding et al. 1995
Whistles Evans 1967
Pulse to 150 Diercks 1972
S. clymene Clymene dolphin Whistles 6.3-19.2 Mullin et al. 1994
S. coernleoalba Spinner dolphin Whistles 1-22.5 6.8-16.9b 109-125 Watkins and Schevill1974, Steiner 1981, Norris
et al. 1994, Wang Ding et al. 1995
Pulse bursts Wide band 5-60 108-115 Watkins and Schevill1974, Norris et al. 1994
Screams Norris et al. 1994
S. longirostris Long-snouted Pulse 1-160 5-60 Brownlee 1983
spinner dolphin
Whistle 1-20 8-12 Brownlee 1983
Click low-65 Watkins and Schevilll974, Norris et al. 1994
Click 1-160 60 Ketten 1984
S. plagiodon Spotted dolphin Whistles 5.0-19.8 6.7-17.9b Caldwell et al. 1973, Steiner 1981
Clicks 1-8 Caldwell and Caldwell 1971b
Squawks, barks, 0.1-8 Caldwell et al. 1973
growls, chirps
S. styx Gray's porpOise Whistles 6->24 8-12.5 Busnel et al. 1968
Steno bredanensis Rough-toothed Whistles 4-7 Busnel and Dziedzic 1966b
dolphin
Click 5-32 Norris and Evans 1967
Tursiops trum:atus Bottlenosed Whistles 0.8-24 3.5-14.5b 125-173 Lilly and Miller 1961, Tyack 1985, Caldwell
dolphin et al. 1990, Schultz and Corkeron 1994,
Wang Ding et al. 1995
Rasp, grate, mew, Wood 1953
bark, yelp
Click 0.2-150 30-60 Diercks et al. 1971, Evans 1973
Bark 0.2-16 Evans and Prescott 1962
Whistle 4-20 Caldwell and Caldwell 1967, Evans and Prescott
1962
Clickd 110-130 218-228 Au et al. 1974, Au 1993
Monodontidae
Delphinapterns Beluga Whistles 0.26-20 2-5.9 Schevill and Lawrence 1949, Sjare and Smith
leucas 1986a,b
Pulsed tones 0.4-12 1-8 Schevill and Lawrence 1949, Sjare and Smith
1986a,b
Noisy 0.5-16 4.2-8.3 Schevill and Lawrence 1949, Sjare and Smith
vocalizations 1986a,b
Echolocation 40-60, 100-120 206-225 Au et al. 1985, 1987, Au 1993
click
Monodon Narwhal Pulsed tones 0.5-5 Ford and Fisher 1978
monoceros
Whistles 0.3-18 0.3-10 Ford and Fisher 1978
Click 40 218 M0hl et al. 1990
Phocoenidae
Neophocaena Finless porpOise Clicks 1.6-2.2 2 Pilleri et al. 1980
phocaenoides
Click 128 Kamminga et al. 1986, Kamminga 1988
Continued on next page
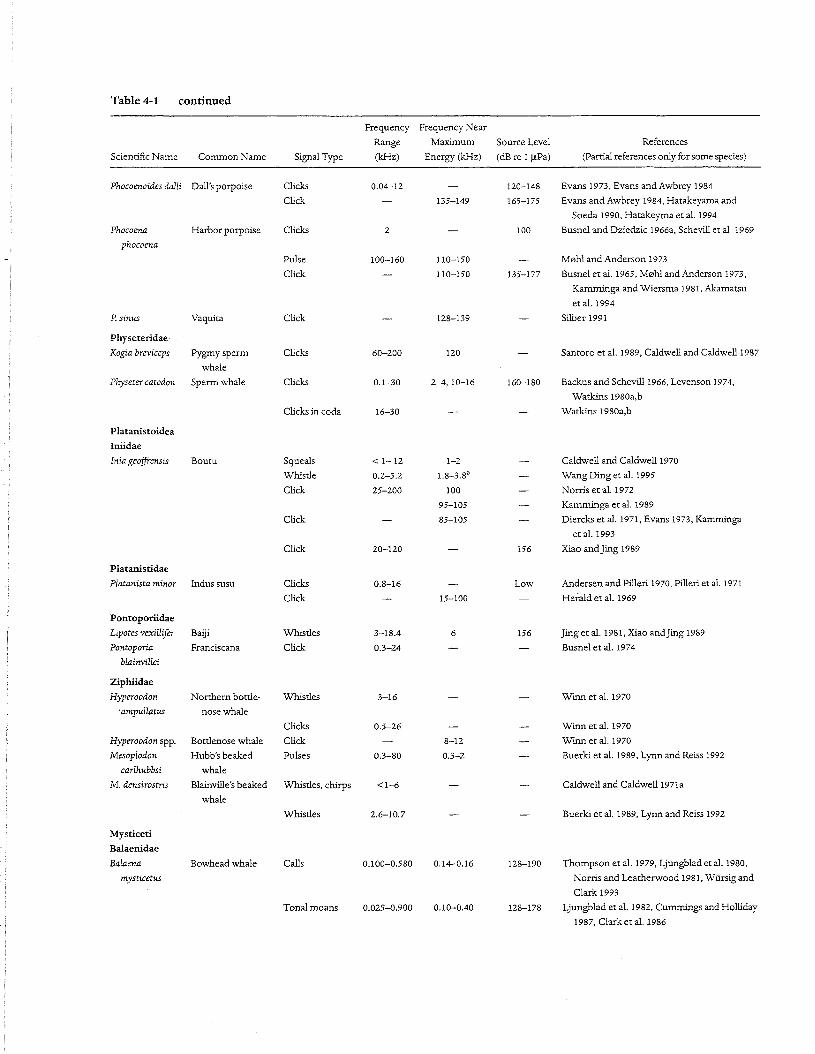
Table 4-1 continued
Frequency Frequency Near
Range Maximum Source Level References
Scientific Name Common Name Signal Type (kHz) Energy (kHz) (dBre 1 ~Pa) (Partial references only for some species)
Phocoenoides dalli Dall's porpoise Clicks 0.04-12 120-148 Evans 1973, Evans and Awbrey 1984
Click 135-149 165-175 Evans and Awbrey 1984, Hatakeyama and
Soeda 1990, Hatakeyma et al. 1994
Phocoena Harbor porpoise Clicks 2 100 Busnel and Dziedzic 1966a, Schevill et al. 1969
phocoena
Pulse 100-160 110-150 M0hl and Anderson 1973
Click 110-150 135-177 Busnel er al. 1965, M0hl and Anderson 1973,
Kamminga and Wiersma 1981, Akamatsu
et al. 1994
P. sinus Vaquita Click 128-139 Silber 1991
Physeteridae·
Kogia breviceps Pygmy sperm Clicks 60-200 120 Santoro et al. 1989, Caldwell and Caldwell 1987
whale
Physeter catodon Sperm whale Clicks 0.1-30 2-4,10-16 160-180 Backus and Schevilll966, Levenson 1974,
Watkins 1980a,b
Clicks in coda 16-30 Watkins 1980a,b
Platanistoidea
lniidae
Inia geoffiensis Bourn Squeals < 1-12 1-2 Caldwell and Caldwell 1970
Whistle 0.2-5.2 l.8-3.8b Wang Ding et al. 1995
Click 25-200 100 Norris et al. 1972
95-105 Kamminga et al. 1989
Click 85-105 Diercks et al. 1971, Evans 1973, Kamminga
et al. 1993
Click 20-120 156 Xiao andJing 1989
Platanistidae
Platanista minor Indus susu Clicks 0.8-16 Low Andersen and Plieri 1970, Plieri et aI. 1971
Click 15-100 Herald et al. 1969
Pontoporiidae
Lipotes vexillifer Baiji Whistles 3-1804 6 156 Jing et al. 1981, Xiao andJing 1989
Pontoporia Franciscana Click 0.3-24 Busnel et al. 1974
blainvillei
Ziphiidae
Hyperoodon Northern bottle- Whistles 3-16 Winn et al. 1970
'ampullatus nose whale
Clicks 0.5-26 Winn et al. 1970
Hyperoodon spp. Bottlenose whale Click 8-12 Wmn et al. 1970
Mesoplodon Hubb's beaked Pulses 0.3-80 0.3-2 Buerki et al. 1989, Lynn and Reiss 1992
carlhubbsi whale
M. densirostris Blainville's beaked Whistles, chirps <1-6 Caldwell and Caldwell 1971a
whale
Whistles 2.6-10.7 Buerki et al. 1989, Lynn and Reiss 1992
Mysticeti
Balaenidae
Balaena Bowhead whale Calls 0.100-0.580 0.14-0.16 128-190 Thompson et al. 1979, Ljungblad et al. 1980,
mysticetus Norris and Leatherwood 1981, Wiirsigand
Clark 1993
Tonal moans 0.025-0.900 0.10-0040 128-178 Ljungblad et al. 1982, Cummings and Holliday
1987, Clark et al. 1986
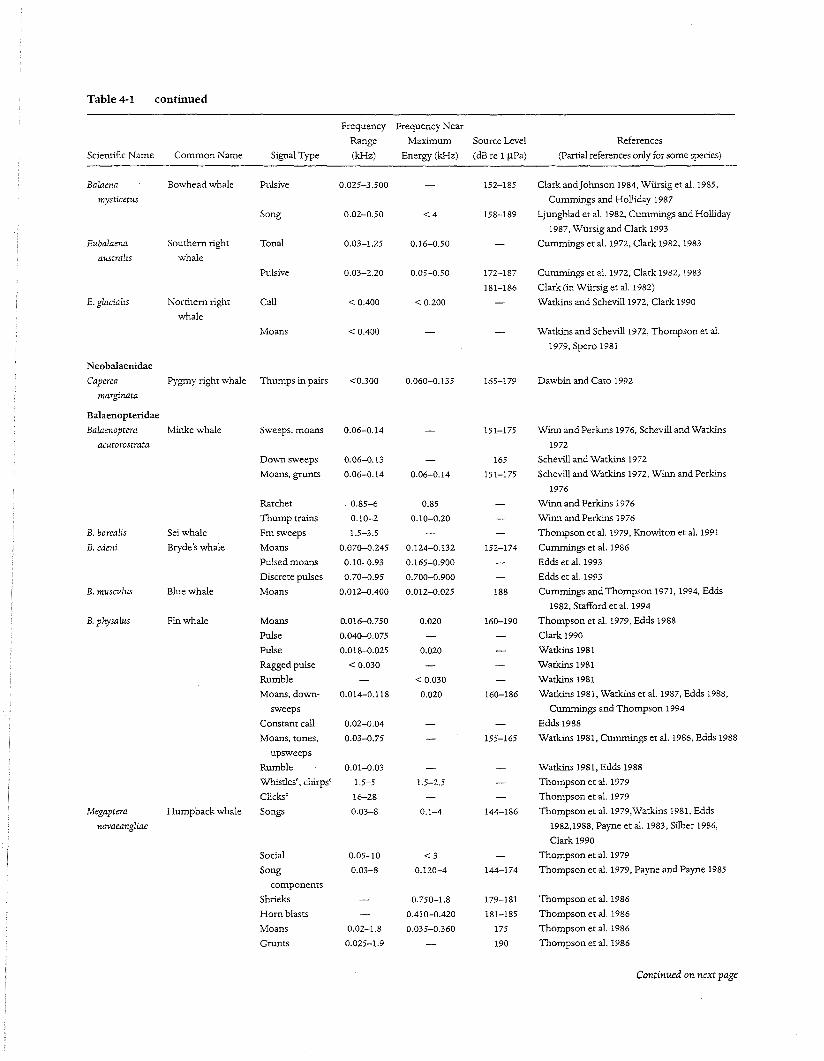
Table 4-1 continued
Frequency Frequency Near
Range Maximum Source Level References
Scientific Name Common Name Signal Type (kHz) Energy (kHz) (dB re 11lPa) (Partial references only for some species)
Balaena Bowhead whale Pulsive 0.025-3.500 152-185 Clark andJohnson 1984, Wiirsig et al. 1985,
mysticetus Cummings and Holliday 1987
Song 0.02-0.50 <4 158-189 Ljungblad et al. 1982, Cummings and Holliday
1987, Wiirsig and Clark 1993
Eubalaena Southern right Tonal 0.03-1.25 0.16-0.50 Cummings et al. 1972, Clark 1982, 1983
australis whale
Pulsive 0.03-2.20 0.05-0.50 172-187 Cummings et al. 1972, Clark 1982, 1983
181-186 Clark (in Wiirsig et al. 1982)
E. glacialis Northern right Call < 00400 < 0.200 Watkins and Schevill1972, Clark 1990
whale
Moans < 00400 Watkins and Schevill1972, Thompson et al.
1979, Spero 1981
Neobalaenidae
Caperea Pygmy right whale Thumps in pairs <0.300 0.060-0.135 165-179 Dawbin and Cato 1992
rnarginata
Balaenopteridae
BaLaenoptera Minke whale Sweeps, moans 0.06-0.14 151-175 Winn and Perkins 1976, Schevill and Watkins
acutorostrata 1972
Down sweeps 0.06-0.13 165 Schevill and Watkins 1972
Moans, grunts 0.06-0.14 0.06-0.14 151-175 Schevill and Watkins 1972, Winn and Perkins
1976
Ratchet . 0.85-6 0.85 Winn and Perkins 1976
Thump trains 0.10-2 0.10-0.20 Winn and Perkins 1976
B. borealis Sei whale Fmsweeps 1.5-3.5 Thompson et al. 1979, Knowlton et al. 1991
B. edeni Bryde's whale Moans 0.070-0.245 0.124-0.132 152-174 Cummings et al. 1986
Pulsed moans 0.10-0.93 0.165-0.900 Edds et al. 1993
Discrete pulses 0.70-0.95 0.700-0.900 Edds et al. 1993
B. musculus Blue whale Moans 0.012-00400 0.012-0.025 188 Cummings and Thompson 1971, 1994, Edds
1982, Stafford et al. 1994
B. physalus Fin whale Moans 0.016-0.750 0.020 160-190 Thompson et al. 1979, Edds 1988
Pulse 0.040-0.075 Clark 1990
Pulse 0.018-0.025 0.020 Watkins 1981
Ragged pulse < 0.030 Watkins 1981
Rumble < 0.030 Watkins 1981
Moans, down- 0.014-0.118 0.020 160-186 Watkins 1981, Watkins et al. 1987, Edds 1988,
sweeps Cummings and Thompson 1994
Constant call 0.02-0.04 Edds 1988
Moans, tones, 0.03-0.75 155-165 Watkins 1981, Cummings et al. 1986, Edds 1988
upsweeps
Rumble 0.01-0.03 Watkins 1981, Edds 1988
Whistles', chirps' 1.5-5 1.5-2.5 Thompson et al. 1979
Clicks' 16-28 Thompson et al. 1979
Megaptera Humpback whale Songs 0.03-8 0.1-4 144-186 Thompson et al. 1979,Watkins 1981, Edds
novaeangliae 1982,1988, Payne et al. 1983, Silber 1986,
Clark 1990
Social 0.05-10 <3 Thompson et al. 1979
Song 0.03-8 0.120-4 144-174 Thompson et al. 1979, Payne and Payne 1985
components
Shrieks 0.750-1.8 179-181 Thompson et al. 1986
Horn blasts 00410-00420 181-185 Thompson et al. 1986
Moans 0.02-1.8 0.035-0.360 175 Thompson et al. 1986
Grunts 0.025-1.9 190 Thompson et al. 1986
Continu.ed on next page
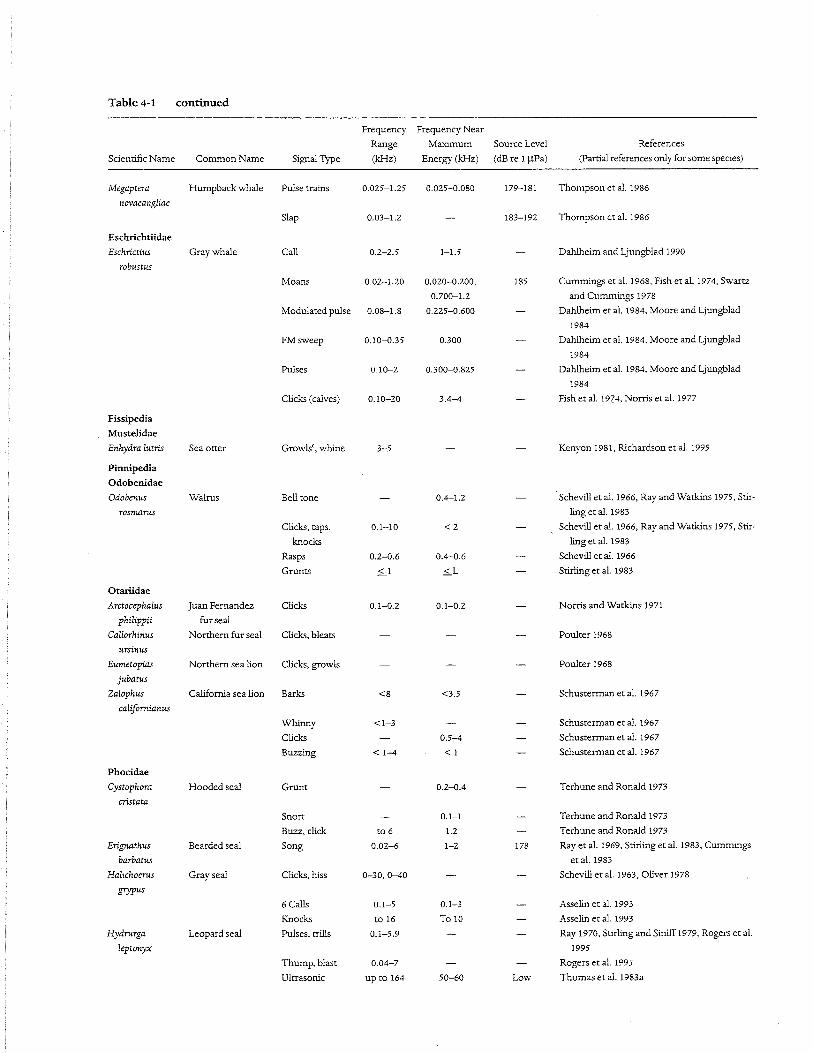
Table 4-1 continued
Frequency Frequency Near
Range Maximum Source Level References
Scientific Name Common Name Signal Type (kHz) Energy (kHz) (dB re 1 JlPa) (Partial references only for some species)
Megaptera Humpback whale Pulse trains 0.025-1.25 0.025-0.080 179-181 Thompson et al. 1986
novaeangliae
Slap 0.03-1.2 183-192 Thompson et al. 1986
Eschrichtiidae
Eschrictius Gray whale Call 0.2-2.5 1-1.5 Dahlheim and Ljungblad 1990
robustus
Moans 0.02-1.20 0.020-0.200, 185 Cummings et al. 1968, Fish et al. 1974, Swartz
0.700-1.2 and Cummings 1978
Modulated pulse 0.08-1.8 0.225-0.600 Dahlheim et al. 1984, Moore and Ljungblad
1984
FMsweep 0.10-0.35 0.300 Dahlheim et al. 1984, Moore and Ljungblad
1984
Pulses 0.10-2 0.300-0.825 Dahlheim et al. 1984, Moore and Ljungblad
1984
Clicks (calves) 0.10-20 3.4-4 Fish et al. 19::'4, Norris et al. 1977
Fissipedia
Mustelidae
Enhydra lutris Sea otter Growls', whine 3-5 Kenyon 1981, Richardson et al. 1995
Pinnipedia
Odobenidae
Odobenus Walrus Bell tone 0.4-1.2 Schevill et al. 1966, Ray and Watkins 1975, Stir-
rosmarus ling et al. 1983
Clicks, taps, 0.1-10 <2 Schevill et al. 1966, Ray and Watkins 1975, Stir-
knocks ling et al. 1983
Rasps 0.2-0.6 0.4-0.6 Schevill et al. 1966
Grunts ~1 ~L Stirling et al. 1983
Otariidae
Arctocephalus Juan Fernandez Clicks 0.1-0.2 0.1-0.2 Norris and Watkins 1971
philippii fur seal
Callorhinus Northern fur seal Clicks, bleats Poulter 1968
ursinus
Eumetopias Northern sea lion Clicks, growls Poulter 1968
jubatus
Zalophus California sea lion Barks <8 <3.5 Schusterman et al. 1967
californianus
Whinny <1-3 Schusterman et al. 1967
Clicks 0.5-4 Schusterman et al. 1967
Buzzing < 1-4 < 1 Schusterman et al. 1967
Phocidae
Cystophora Hooded seal Grunt 0.2-0.4 Terhune and Ronald 1973
cristata
Snort 0.1-1 Terhune and Ronald 1973
Buzz, click t06 1.2 Terhune and Ronald 1973
Erignathus Bearded seal Song 0.02-6 1-2 178 Ray et al. 1969, Stirling et al. 1983, Cummings
barbatus et al. 1983
Halichoerus Gray seal Clicks, hiss 0-30,0-40 Schevill et al. 1963, Oliver 1978
grypus
6 Calls 0.1-5 0.1-3 Asselin et al. 1993
Knocks to 16 To 10 Asselin et al. 1993
Hydrurga Leopard seal Pulses, trills 0.1-5.9 Ray 1970, Stirling and Siniff1979, Rogers et al.
leptonyx 1995
Thump, blast 0.04-7 Rogers et al. 1995
Ultrasonic up to 164 50-60 Low Thomas et al. 1983a
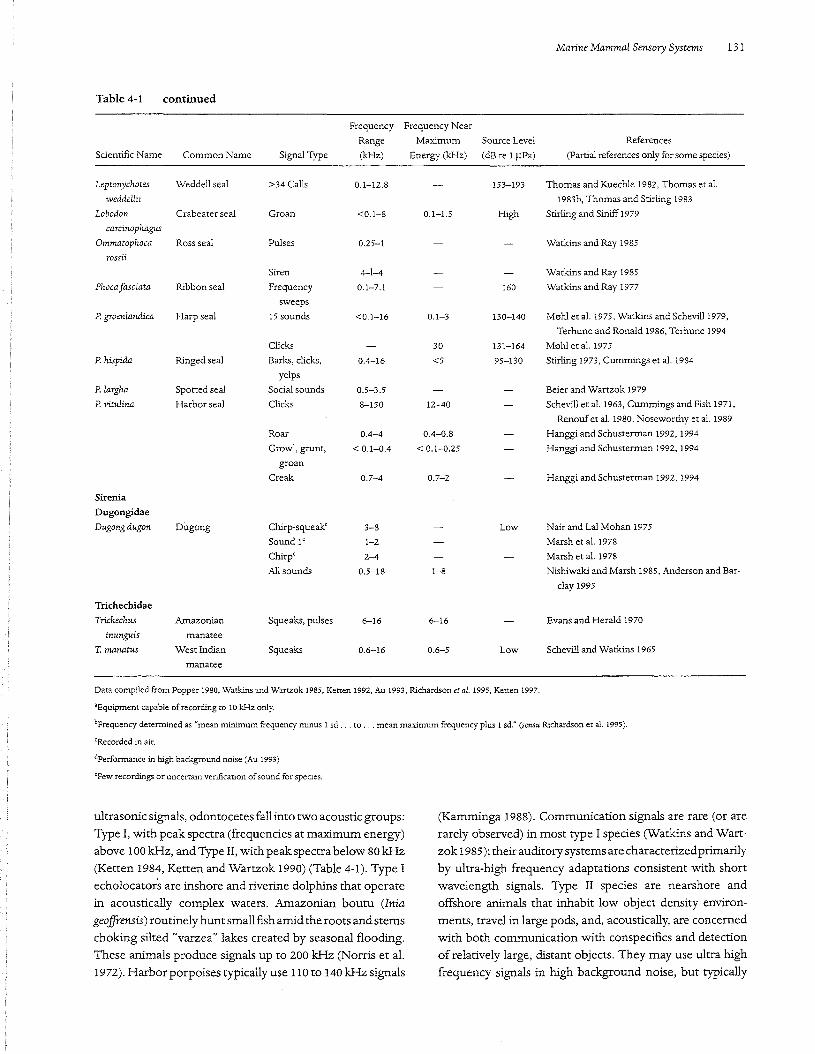
Table 4-1 continued
Marine Mamma! Sensory Systems 131
Frequency Frequency Near
Range Maximum Source Level References
Scientific Name Common Name Signal Type (kHz) Energy (kHz) (dB re 1 llPa) (Partial references only for some species)
Leptonychotes Weddell seal >34 Calls 0.1-12.8 153-193 Thomas and Kuech!e 1982, Thomas et al.
weddellii 1983b, Thomas and Stirling 1983
Lobodon Crabeater sea! Groan <0.1-8 0.1-1.5 High Stirling and Siniff 1979
carcinophagus
Ommatophoca Ross seal Pulses 0.25-1 Watkins and Ray 1985
rossii
Siren 4-1-4 Watkins and Ray 1985
Phoca fasciata Ribbon seal Frequency 0.1-7.1 160 Watkins and Ray 1977
sweeps
P. groenlandica Harp sea! 15 sounds <0.1-16 0.1-3 130-140 Moh! et al. 1975, Watkins and Schevill1979,
Terhune and Ronald 1986, Terhune 1994
Clicks 30 131-164 Moh! et al. 1975
P. hispida Ringed seal Barks, clicks, 0.4-16 <5 95-130 Stirling 1973, Cummings et al. 1984
yelps
P.largha Spotted seal Social sounds 0.5-3.5 Beier and Wartzok 1979
P. vitulina Harbor seal Clicks 8-150 12-40 Schevill et al. 1963, Cummings and Fish 1971,
Renoufet al. 1980, Noseworthy et al. 1989
Roar 0.4-4 0.4-0.8 Hanggi and Schusterman 1992, 1994
Growl, grunt, < 0.1-0.4 < 0.1-0.25 Hanggi and Schusterman 1992, 1994
groan
Creak 0.7-4 0.7-2 Hanggi and Schusterman 1992, 1994
Sirenia
Dugongidae
Dugong dugon Dugong Chirp-squeak' 3-8 Low Nair and La! Mohan 1975
Sound l' 1-2 Marsh et al. 1978
Chirp' 2-4 Marsh et al. 1978
Al!sounds 0.5-18 1-8 Nishiwaki and Marsh 1985, Anderson and Bar-
clay 1995
Trichechidae
Trichechus Amazonian Squeaks, pulses 6-16 6-16 Evans and Herald 1970
inunguis manatee
T.manatus West Indian Squeaks 0.6-16 0.6-5 Low Schevill and Watkins 1965
manatee
Data compiled from Popper 1980, Watkins and Wartzok 1985, Ketten 1992, Au 1993, Richardson etal. 1995, Ketten 1997.
'Equipment capable of recording to 10 kHz only.
bFrequency determined as '"mean minimum frequency minus 1 sd ... to ... mean maximum frequency plus 1 sd:' (sensu Richatdson et aI. 1995).
cRecorded in air.
dperformance in high background noise (Au 1993)
epew recordings or uncertain verification of sound for species.
ultrasonic signals, odontocetes fall into two acoustic groups:Type I, with peak spectra (frequencies at maximum energy)
above 100 kHz, and Type II, with peak spectra below 80 kHz(Ketten 1984, Ketten and Wartzok 1990) (Table 4-1). Type Iecholocators are inshore and riverine dolphins that operatein acoustically complex waters. Amazonian boutu (Inia
geoffrensis) routinely hunt small fish amid the roots and stemschoking silted "varzea" lakes created by seasonal flooding.These animals produce Signals up to 200 kHz (Norris et aL
1972). Harbor porpoises typically use 110 to 140 kHz signals
(Kamminga 1988). Communication signals are rare (or are
rarely observed) in most type I species (Watkins and Wartzok 1985); their auditory systems are characterizedprimarilyby ultra-high frequency adaptations consistent with shortwavelength Signals. Type II species are nearshore andoffshore animals that inhabit low object density environ
ments, travel in large pods, and, acoustically, are concernedwith both communication with conspecifics and detectionof relatively large, distant objects. They may use ultra high
frequency Signals in high background noise, but typically
132 DOUGLAS WARTZOK AND DARLENE R. KETTEN
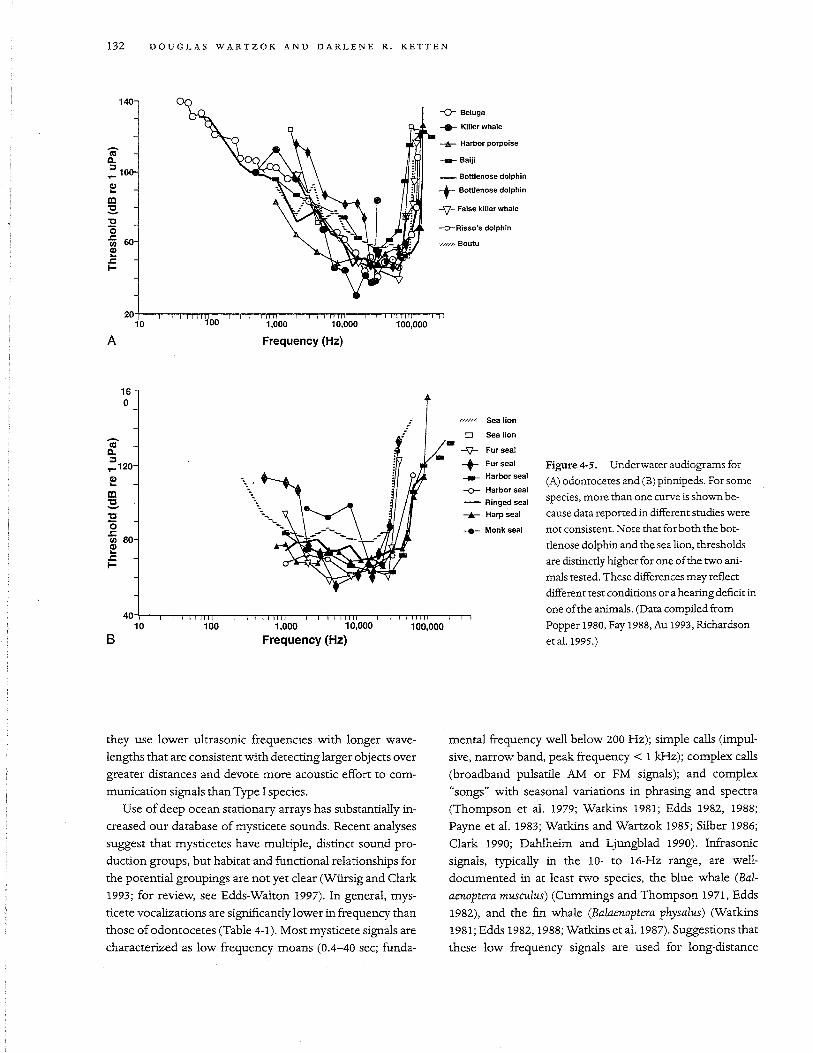
140-0-- Beluga
..... Klllerwhale
....- Harbor porpoise
___ Balji
_ Bottlenose dolphin+ Bottlenose dolphin
y False killer whale
-0-Risso's dolphin
'N""/" Boutu
100,00010,00020'-\--'--"""""'nTT-.,......,....,...,..n,TTr-.,-,...,-nT1T,---r--r-TTrrrn--.,....,-,
10 100 1,000
A Frequency (Hz)
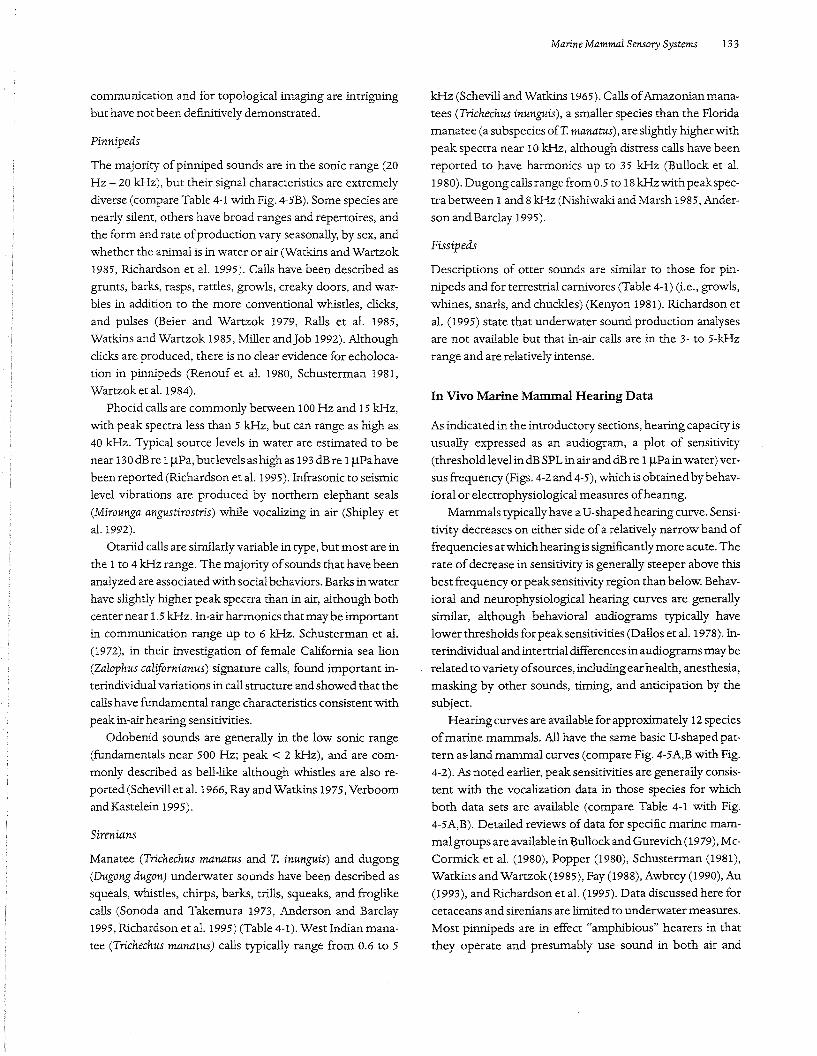
Figure 4-5. Underwater audiograms for(A) odontocetes and (B) pinnipeds. For somespecies, more than one curve is shown because data reported in different studies werenot consistent. Note that for both the bottlenose dolphin and the sea lion, thresholdsare distinctly higher for one ofthe two ani
mals tested. These differences may reflectdifferent test conditions or ahearing deficit in
one ofthe animals. (Data compiled fromPopper 1980, Fay 1988, Au 1993, Richardsoneta!. 1995.)
Sea lion
o Sea lion
..s::r Fur seal
+ Fur seal___ Harbor seal
-0- Harbor seal
- Ringed seal
-.- Harp seal
-.- Monk seal
•
100,0001.000 10,000
Frequency (Hz)100
40-r---r--r-n,.,..,-.,.,.--r-r-r-TnTTT"-.,.-r-r..,...,-rrrr-"'-"T--r'TTTTTT-""--r-110
16o
Cil0.::J... 120
~III~'t:l(5J:III 80~J:I-
B
they use lower ultrasonic frequencies with longer wave
lengths that are consistent with detecting larger objects over
greater distances and devote more acoustic effort to com
munication signals than Type I species.
Use of deep ocean stationary arrays has substantially in
creased our database of mysticete sounds. Recent analyses
suggest that mysticetes have multiple, distinct sound pro
duction groups, but habitat and functional relationships for
the potential groupings are not yet clear (Wiirsig and Clark
1993; for review, see Edds-Walton 1997). In general, mys
ticete vocalizations are Significantly lower in frequency than
those ofodontocetes (Table 4-1). Most mysticete signals are
characterized as low frequency moans (0.4-40 sec; funda-
mental frequency well below 200 Hz); Simple calls (impul
sive, narrow band, peak frequency < 1 kHz); complex calls
(broadband pulsatile AM or FM signals); and complex
"songs" with seasonal variations in phrasing and spectra
(Thompson et al. 1979; Watkins 1981; Edds 1982, 1988;
Payne et al. 1983; Watkins and Wartzok 1985; Silber 1986;
Clark 1990; Dahlheim and Ljungblad 1990). Infrasonic
Signals, typically in the 10- to 16-Hz range, are well
documented in at least two species, the blue whale (Bal
aenoptera musculus) (Cummings and Thompson 1971, Edds
1982), and the fin whale (Balaenoptera physalus) (Watkins
1981; Edds 1982, 1988; Watkins et al. 1987). Suggestions that
these low frequency signals are used for long-distance
communication and for topological imaging are intriguingbut have not been definitively demonstrated.
Pinnipeds
The majority of pinniped sounds are in the sonic range (20Hz - 20 kHz), but their signal characteristics are extremelydiverse (compare Table 4-1 with Fig. 4-5B). Some species arenearly silent, others have broad ranges and repertoires, and
the form and rate ofproduction vary seasonally, by sex, andwhether the animal is in water or air (Watkins and Wartzok1985, Richardson et al. 1995). Calls have been described as
grunts, barks, rasps, rattles, growls, creaky doors, and warbles in addition to the more conventional whistles, clicks,
and pulses (Beier and Wartzok 1979, Ralls et al. 1985,Watkins and Wartzok 1985, Miller andJob 1992). Althoughclicks are produced, there is no clear evidence for echoloca
tion in pinnipeds (Renouf et al. 1980, Schusterman 1981,Wartzok et al. 1984).
Phocid calls are commonly between 100 Hz and 15 kHz,with peak spectra less than 5 kHz, but can range as high as
40 kHz. Typical source levels in water are estimated to benear 130dBre IIlPa, butlevels as high as 193 dBre IIlPahavebeen reported (Richardson et al. 1995). Infrasonic to seismic
level vibrations are produced by northern elephant seals(Mirounga angustirostris) while vocalizing in air (Shipley etal. 1992).
Otariid calls are similarly variable in type, but most are in
the 1 to 4 kHz range. The majority ofsounds that have beenanalyzed are associated with social behaviors. Barks in waterhave slightly higher peak spectra than in air, although bothcenter near 1.5 kHz. In-air harmonics that may be important
in communication range up to 6 kHz. Schusterman et al.(1972), in their investigation of female California sea lion(Zalophus californianus) signature calls, found important interindividual variations in call structure and showed that the
calls have fundamental range characteristics consistent withpeak in-air hearing sensitivities.
Odobenid sounds are generally in the low sonic range(fundamentals near 500 Hz; peak < 2 kHz), and are commonly described as bell-like although whistles are also reported (Schevill et al. 1966, Ray and Watkins 1975, Verboomand Kastelein 1995).
Sirenians
Manatee (Trichechus manatus and T. inunguis) and dugong
(Dugong dugonj underwater sounds have been described assqueals, whistles, chirps, barks, trills, squeaks, and froglikecalls (Sonoda and Takemura 1973, Anderson and Barclay1995, Richardson et al. 1995) (Table 4-1). West Indian mana
tee (Trichechus manatus) calls typically range from 0.6 to 5
Marine Mammal Sensory Systems 133
kHz (Schevill and Watkins 1965). Calls ofAmazonian manatees (Trichechus inunguis), a smaller species than the Floridamanatee (a subspecies ofT. manatus), are slightly higher with
peak spectra near 10 kHz, although distress calls have beenreported to have harmonics up to 35 kHz (Bullock et al.1980). Dugongcalls range from 0.5 to 18 kHz with peakspec
tra between 1and 8 kHz (Nishiwaki and Marsh 1985, Anderson and Barclay 1995).
Fissipeds
Descriptions of otter sounds are similar to those for pinnipeds and forterrestrial carnivores (Table 4-1) (Le., growls,whines, snarls, and chuckles) (Kenyon 1981). Richardson et
al. (1995) state that underwater sound production analysesare not available but that in-air calls are in the 3- to 5-kHz
range and are relatively intense.
In Vivo Marine Mammal Hearing Data
As indicated in the introductory sections, hearing capacity isusually expressed as an audiogram, a plot of sensitivity(threshold level in dB SPL in air and dB re 11lPa in water) versus frequency (Figs. 4-2 and 4-5), which is obtained by behav
ioral or electrophysiological measures ofhearing.Mammals typically have a U-shaped hearing curve. Sensi
tivity decreases on either side ofa relatively narrow band offrequencies at which hearing is significantly more acute. Therate ofdecrease in sensitivity is generally steeper above this
best frequency or peak senSitivity region than below. Behavioral and neurophysiological hearing curves are generallysimilar, although behavioral audiograms typically havelower thresholds for peak sensitivities (Dallos et al. 1978). In
terindividual and intertrial differences in audiograms may berelated to variety ofsources, includingearhealth, anesthesia,masking by other sounds, timing, and anticipation by the
subject.Hearing curves are available for approximately 12 species
ofmarine mammals. All have the same basic V-shaped pattern as· land mammal curves (compare Fig. 4-5A,B with Fig.
4-2). As noted earlier, peak sensitivities are generally consistent with the vocalization data in those species for whichboth data sets are available (compare Table 4-1 with Fig.4-5A,B). Detailed reviews of data for specific marine mammal groups are available in Bullockand Gurevich (1979), Mc
Cormick et al. (1980), Popper (1980), Schusterrnan (1981),Watkins and Wartzok (1985), Fay (1988), Awbrey (1990), Au(1993), and Richardson et al. (1995). Data discussed here forcetaceans and sirenians are limited to underwater measures.
Most pinnipeds are in effect "amphibious" hearers in that
they operate and presumably use sound in both air and
134 DOUGLAS WARTZOK AND DARLENE R. KETTEN
(Fletcher 1940, Fay 1992). This implies that the target
strength is at least equal to that ofthe noise; however, there
are exceptions. Although uncommon, negative CRs, mean
ing the Signal is detected at levels below the noise, have been
reported for human detection of speech signals' and for
some bats near their echolocation frequencies (Schuknecht
1993, Kossl and Vater 1995). Critical bands are thought to de
pend on stiffuess variations in the inner ear. In generalist
ears, the critical bandwidths are relatively constant at about
0.25 to 0.35 octaves/mm ofbasilar membrane (Ketten 1984,
1992; West 1985; Allen and Neeley 1992). Although hearing
ranges vary widely in terms of frequency, most mammals
have a hearing range of 8 to 9 octaves, which- is consistent
with earlier findings that the number of CBs was approxi
mately equal to basilar membrane length in millimeters
(Pickles 1982, Greenwood 1990).
Based on CR and CB data, odontocetes are better than
most mammals at detecting signals in noise. Odontocetes
have more CBs and the CRs are generally smaller than in
humans. Furthermore, odontocete critical bandwidths ap-
are on average better than those for bottlenose dolphins
(Popper 1980).
An important aspect ofany sensory system for survival is
the ability to detect relevant signals amidst background
noise. Critical bands and critical ratios are two measures of
the ability to detect signals embedded in noise. In hearing
studies, the term masking refers to the phenomenon in
which one sound eliminates or degrades the perception of
another (for a detailed discussion, see Yost 1994). To measure
a critical band, a test signal, the target (usually a pure tone),
and a competing Signal, the masker, are presented simulta
neously. Fletcher (1940) showed that as the bandwidth ofthe
masker narrows, the target suddenly becomes easier to de
tect. The critical band (CB) is the bandwidth at that point
expressed as a percent ofthe center frequency. Ifthe ear's fre
quency resolution is relatively poor, there is a broad skirt of
frequencies around the target tone that can mask it, and the
CB is large. If the ear has relatively good frequency resolu
tion, the CB is relatively narrow. Critical ratios (CR) are a
comparison ofthe signal power required for target detection
versus noise power, and are simply calculated as the thresh
old level ofthe target in noise (in dB) minus the masker level
(dB). Critical bands tend to be a constant function ofthe CRs
throughout an animal's functional hearing range. Conse
quently, CR measures with white noise, which are easier to
obtain than CBs, have been used to calculate masking band
widths based on the assumption that the noise power inte
grated over the critical band equals the power ofthe target at
its detection threshold, or,
water; therefore, data are included from both media where
available. No published audiometric data are available for
mysticetes, marine otters (Lutra ftlina and Enhydra lutris), or
polar bears (Ursus maritimus).
Cetaceans
Electrophysiological and behavioral audiograms are avail
able for seven odontocete species (Au 1993), most ofwhich
are Type II delphinids with peak sensitivity in the 40- to 80
kHz range. Data, generally from one individual, are available
also for beluga whales (Delphinapterus leucas), boutu, and
harbor porpoise. There are no published audiograms for
adult physeterids or ziphiids, or any mysticete. The available
data indicate that odontocetes tend to have at least a 10
octave functional hearing range, compared with 8 to 9 oc
taves in the majority of mammals. Best sensitivities range
from 12 kHz in killer whales (Schevill and Watkins 1966, Hall
andJohnson 1971) to more than 100 kHz inboutu and harbor
porpoise (M0hl and Andersen 1973, Voronov and Stosman
1977, Supin and Popov 1990).
Until recently, most odontocete audiometric work was
directed at understanding echolocation abilities rather than
underwater hearing per se. Therefore, much of what is
known about odontocete hearing is related to ultrasonic
abilities. Acuity measures commonly used in these studies
include operational Signal strength, angular resolution, and
difference limens. The first two are selfexplanatory. Differ
ence limens (DL) are a measure offrequency discrimination
based on the ability to differentiate between two frequen
cies or whether a single frequency is modulated. Difference
limens are usually reported simply in terms ofHz or as rela
tive difference limens (rdl) , which are calculated as a percent
equal to 100 times the DL in Hz/ frequency. Au (1990) found
that echolocation performance in bottlenose dolphins was 6
to 8 dB poorer than that expected from an optimal receiver.
Target detection thresholds as small as 5 cm at 5 m have
been reported, implying an auditory angular resolution
ability of0.5°, although most data suggest 1° to 4° for hori
zontal and vertical resolutions are more common (Bullock
and Gurevich 1979, Popper 1980, Au 1990). Minimal inten
sity discrimination in bottlenose dolphins (1 dB) is equal to
human values; temporal discrimination("-"8% ofsignal dura
tion) is superior to human abilities. Frequency discrimina
tion in bottlenose dolphins varies from 0.28% to 1.4% rdl for
frequencies between 1 and 140 kHz; best values are found
between 5 and 60 kHz (Popper 1980). These values are sim
ilar to those of microchiropteran bats and superior to the
human average (Grinnell 1963, Simmons 1973, Sales and
Pye 1974, Long 1980, Pollack 1980, Popper 1980, Watkins
and Wartzok 1985). Frequency discrimination and angular
resolutions in harbor porpoises (0.1 % to 0.2% rdl; 0.5° to 1°)
CB (in Hz) =lO(CR/lO) (equation 7)
proach zero and are not a constant factor ofthe critical ratioat different frequencies. The bottlenose dolphin has 40 CBs,
which vary from 10 times the CR at 30 kHz to 8 times the CRat 120 kHz Uohnson 1968, 1971; Moore and Au 1983;Watkins and Wartzok 1985; Thomasetal. 1988, 1990b). Crit
ical ratios for bottlenose dolphins (20 to 40 dB) are, however,generally higher than in other odontocetes measured. Thebest CRs to date (8 to 40 dB) are for the false killer whale(Pseudorca crassidens) (Thomas et al. 1990b), which is also the
species that has performed best in echolocation discrimination tasks (Nachtigall et al. 1996).
Sound localization is an important aspect of hearing in
which the medium has a profound effect. In land mammals,two cues are important for localizing sound: differences inarrival time (interaural time) and in sound level (interaural
intensity). Binaural hearingstudies are relatively rare for marine mammals, butthe consensus from research on both pinnipeds and odontocetes is that binaural cues are importantfor underwater localization (Dudok van Heel 1962, Gentry
1967, Renaud and Popper 1975, Moore et al. 1995); however,because of sound speed differences, small or absent pinna,and ear canal adaptations in marine mammals, localization
mechanisms may be somewhat different from those oflandmammals.
In mammals, the high frequency limit offunctional hearing in each species is correlated with its interaural time distance (IATD =the distance sound travels from one ear to the
other divided by the speed ofsound; Heffner and Masterton1990). The narrower the head, the smaller the IATD, thehigher the frequency an animal mustperceivewith goodsen
sitivity to detect arrival time through phase differences. Forexample, consider a pure tone, which has the form ofa sinewave, arriving at the head. Ifthe sound is directly in front ofthe head, the sound will arrive at the same time and with the
same phase at each ear. As the animal's head turns awayftomthe s~)Urce,each ear receives a different phase, given that theinter-ear distance is different from an even multiple of the
wavelength of the sound. Therefore, IATD cues involvecomparing time of arrival versus phase differences at different frequencies in each ear. Phase cues are useful primarily at
frequencies below the functional limit; however, the higherthe frequency an animal can hear, the more likely it is to havegood sensitivity at the upper end of frequency range forphase cues.
Clearly, IATDs depend on the sound conduction path inthe animal and the media through which sound travels. Forterrestrial species, the normal sound path is through air,
around the head, pinna to pinna. The key entry point for localization cues is the external auditory meatus, and thereforethe IATD is the intermeatal (1M) distance measured aroundthe head divided by the speed ofsound in air. In aquatic ani-
Marine Mammal Sensory Systems 135
mals, sound can travel in a straight line, by tissue conduction,through the head given that tissue impedances are similar tothe impedance of seawater. Experiments with delphinidssuggest that intercochlear (IC) or interjaw distances are the
most appropriate measure for calculating IATD values inodontocetes (Dudok van Heel 1962, Renaud and Popper1975, Moore et al. 1995). The Ie distances of dolphins are
acoustically equivalent to a rat or bat 1M distance in air because of the increased speed of sound in water. Supin andPopov (1993) proposed that marine mammals without pinnae were incapable of using IATD cues, given the small in
terreceptor distances implied by the inner ear as the alternative underwater receptor site. Recently, however, Moore etal. (1995) demonstrated that the bottlenose dolphin has an
IATD on the order of7llsec, which is better than the averagehuman value (10 Ilsec) and well below that of most landmammals tested. IfIM distances are used for land mammalsand otariids in air and IC distances are used for cetaceans andunderwaterphocid data, marine mammal and landmammal
data for IATD versus high frequency limits follow similartrends.
Intensity differences can be detected monaurally or binaurally, but binaural cues are most important for localizinghigh frequencies. In land mammals, intensity discriminationthresholds (IDT) tend to decrease with increasing sound lev
els and are generally better in larger animals (Fay 1992,Heffner and Heffner 1992). Humans and macaques com
monly detect intensity differences of0.5 to 2 dB throughouttheir functional hearing range; gerbils and chinchillas, 2.5 to8 dB. Behavioral and evoked potential data show intensitydifferences are detectable by odontocetes at levels equal to
those of land mammals and that the detection thresholds,like those ofland mammals, decline with increasing soundlevel. Binaural behavioral studies ,and evoked potential
recordings for bottlenose dolphin indicate an approximateIDT limit ofl to 2 dB (Bullocket al. 1968, Moore et al. 1995).Inharbor porpoise, IDTs range 0.5 to 3 dB (Popov et al. 1986).Thresholds in boutu range from 3 to 5 dB (Supin and Popov1993), but again, because of small sample size and method
ological differences, it is unclear whether these numbers represent true species differences. Fay (1992) points out that theIDT data for land mammals do not fit Weber's Law, which
would predict a flat curve for IDT (Le., intensity discrimination in dB should be nearly constant). Rather, the IDTsdecrease with increasing level and increase slightly with
frequency.In the past decade, auditory evoked potential (AEP) or
auditory brainstem response (ABR) procedures have beenestablished for odontocetes (Popov and Supin 1990a, Dolphin 1995). These techniques are highly suitable for studies
with marine mammals for the same reasons they are Widely
136 DOUGLAS WARTZOK AND DARLENE R. KETTEN
used for measuring hearing in infants or debilitated humans-namely, they are rapid, minimally invasive, and re
quire no training or active response by the subject. An
acoustic stimulus is presented by ear or jaw phones and theevoked neural responses are recorded from surface electrodes' or mini-electrodes inserted under the skin. The sig
nals recorded reflect synchronous discharges oflarge populations ofauditory neurons. The ABRs consist ofa series of5to 7 peaks or waves that occur within the first 10 msec after
presentation ofclick or brief tone burst stimuli. Most mammals have similar ABR patterns, bur there are clear speciesspecific differences in both latencies and amplitudes ofeach
wave Uewett 1970, Dallos et al. 1978, Achor and Starr 1980,Dolan et al. 1985, Shaw 1990). The delay and pattern ofthewaves are related to the source ofthe response. For example,
wave I in most mammals is thought to derive from synchronous discharges ofthe auditory nerve; wave II from the auditory nerve or cochlear nucleus. The ABRs from dolphins
show clear species dependence. Typical ABRs from harborporpoise and bottlenose dolphin have three positive peakswith increasing amplitudes, but those in harbor porpoise
have longer latencies (Bullock et al. 1968, Ridgway et al.r981, Bibikov 1992).
Recent work using continuous amplitude modulated
stimuli (AMS) at low frequencies in bottlenose dolphins andfalse killer whales suggest odontocetes can extract envelopefeatures at higher modulation frequencies than other mam
mals (Kuwada et al. 1986, Dolphin and Mountain 1992, Dolphin 1995). Supin and Popov (1993) also showed that enve
lope following responses (EFR) are better measures of lowfrequency auditory activity than ABR. The anatomical correlates ofEFRs have not been identified, but the data suggest
auditory central nervous system adaptations in dolphinsmay include regions specialized for low as well as highfrequencies.
Pinnipeds
Pinnipeds are particularly interesting because they are facedwith two acoustic environments. Different ways for sensoryinformation to be received and processed are required for
equivalent air and water hearing in their amphibious lifestyle. One pOSSibility is that pinnipeds have dual systems, op
erating independently for aquatic and airborne stimuli. Ifthis is the case, hearingmightbe expected to be equally acutebut possibly have different frequency ranges related to behaviors in each medium (e.g., feeding in water vs. the location ofa pup on land). An alternative to the neffinlike dual
but equal hearing is that pinnipeds are adapted primarily forone environment and have a "compromised" facility in theother. Renouf (1992) argued that there is an "a priorijustifi-
cation for expecting otariids and phocids" to operate withdifferent sensory emphases, given that phocids are more
wholly aquatic. This question cannot be definitively resolveduntil more pinniped species have been tested. As withcetaceans, present data are limited to a few individuals from
mostly smaller species. However, the most recent data suggest there are significant differences among pinnipeds inboth their primary frequency adaptations and in their adaptations to air versus water to warrant more Widespread
species research.Underwater behavioral audiograms for phocids are
somewhat atypical in that the low frequency tail is relativelyflat compared to othermammalian hearingcurves (compareFigs. 4-2 and 4-5A with Fig. 4-5B; see also Fay 1988 or Yost1994 for additional comparisons). In the phocids tested (har
bor seal [Phoca vitulina], harp seal [Phocagroenlandica], ringedseal [Phoca hispida], and Hawaiian monk seal [Monachus
schauinslandi]), peak sensitivities ranged between 10 and 30
kHz, with a functional high frequency limit ofabout 60 kHz,except for the monk seal which had a high frequency limit of30 kHz (Schusterman 1981, Fay 1988, Thomas et al. 1990a).
Low frequency functional limits are not yet well establishedfor phocids, and it is likely that some ofthe apparent flatness
will disappear as more animals are tested below 1kHz. However, the fact that all phocid plots have remarkably little decrease in overall sensitivity below peak frequency is notable.
Currently available data from an on-going study comparingharbor seal and northern elephant seal hearing suggest thatthe elephant seal has Significantly better underwater low fre
quency hearing thresholds than other pinnipeds tested todate (KastakandSchusterman 1995, 1996).
In-air audiograms for phocids have more conventional
shapes with peak sensitivities at slightly lower frequencies (3to 10 kHz) (Fay 1988; Kastak and Schusterman 1995, 1996).In-air evoked potential data on these species are consistentwith behavioral results (Bullock et al. 1971, Dallos et al.
1978). In-air and underwater audiograms cannot be compared directly; however, when the data are converted to intensity measures, the thresholds for airborne sounds arepoorer, on average (Richardson et al. 1995), implying that
phocids are primarily adapted for underwater hearing.Underwater audiograms and aerial audiograms are avail
able for two species of otariids. Underwater hearing curvesfor California sea lions and northern fur seals (Callorhinus
ursinus) have standard mammalian shapes. Functional underwater high frequency hearing limits for both species arebetween 35 and 40 kHz with peak sensitivities from 15 to 30
kHz (Fay 1988, Richardson et al. 1995). As with phocids,otariid peak sensitivities in air are shifted to lower frequen
cies « 10 kHz; functional limit near 25 kHz), but there is rel-