Embed Size (px)
Citation preview

MARINE PROTECTED AREA REVIEW
A REVIEW OF THE BENEFITS OF MARINE PROTECTED AREAS, WITH A FOCUS ON HOW VICTORIA IS TRACKING TOWARDS INTERNATIONAL BENCHMARKS.
J U N E 2 0 1 9

Marine Protected Area Review | PAGE 2
TABLE OF CONTENTS
Scope and methods 3
Executive Summary 4-5
Recommendations 5
SECTION 1 - Marine Protected Areas – an introduction
What is a marine protected area 6
Why are MPAs established 6
All MPAs are not equal 6-7
SECTION 2 – Benefits of Marine Protected AreasBenefits of Marine Protected Areas 8Biodiversity protection 9-10
Threatened species conservation 10-11
Ecosystem resilience and climate change 11-12
Spillover benefits 12
SECTION 3 – Global targets: how is Australia and Victoria tracking
International benchmarks 13
The global coverage of MPAs in 2018 13-15MPAs in Australia 15-16
Highly and partially protected MPAs in Victoria 17-20
Marine v terrestrial protected areas 20
The debate around whether MPAs work 21
Reasons for MPAs not achieving their objectives 22Developing MPAs that work 22
References 23-25
Above: Marine invasive species monitoring, Wilsons Promontory, Victoria. Photo by Parks Victoria.
Cover image: Weedy Seadragon, Victoria's marine emblem. Photo by Jack Breedon.
Back cover image: Great Victorian Fish Count. Photo by Kade Mills.
A Victorian National Parks Association report,
with John Ford, an independent consultant with
a background in marine and fisheries ecology, as the main contributing author.
Victorian National Parks Association The Victorian National Parks Association (VNPA) is Victoria’s leading nature conservation organisation. VNPA is an independent, non-profit, membership-based group, which exists to protect Victoria’s unique natural environment and biodiversity through the establishment and effective management of national parks, including marine national parks, conservation reserves and other measures. We achieve our vision by facilitating strategic campaigns and education programs, developing policies, through hands-on conservation work, and by running bushwalking and outdoor activity programs which promote the care and enjoyment of Victoria’s natural heritage. Published by the Victorian National Parks Association.
Victorian National Parks Association
Level 3, 60 Leicester Street, Carlton, Victoria, 3053 Phone: 03 9347 5188 | Fax: 03 9347 5199 Website: www.vnpa.org.au | Email: [email protected]
Marine Protected Area Review | PAGE 3
ScopeThis report provides an overview of marine protected areas (history plus global, national and local Victorian context), reviews their scientifically reported conservation benefits, and briefly discusses the criteria that make for an effective marine protected area. It does so by analysing the scientific literature on marine protected areas in a conservation context, not their cultural, social or economic benefits. The report’s emphasis is on Victoria’s marine protected area network, but its 24 marine national parks and sanctuaries and six partially protected areas are Victoria’s contribution to the National Representative System of Marine Protected Areas (NRSMPA), which was agreed to by all Australian governments in 1998.
MethodsThe scientific literature search for this report was not as thorough as a full systematic review, however it initially considered over 1600 scientific, government and NGO reports. To identify relevant scientific literature, searches were conducted on Web of Science, Science Direct and Google Scholar database for scientific research articles, reviews and short communications containing “Marine Protected Area” or “Marine Park” or “Marine Reserve” in the title, published between 2009 and 2018 (up to Aug 2018). Papers were filtered to include only studies that explicitly considered or evaluated the conservation benefits or success of MPAs. This process removed all studies which were either a) purely observational science (no comparison to non-MPAs), b) methodological only, c) attitudinal or focused on perceptions of MPAs, d) social or economic impacts e) management and enforcement, and f) purely theoretical. The most relevant 85 of these articles are referenced here.
Statistics for the global coverage of MPAs were sourced from two main sources: Protected Planet marine database (UNEP-WCMC and IUCN 2018) for total MPA area, and Atlas of Marine Protection (Marine Conservation Institute 2018) for highly protected (i.e. no-take) MPA statistics. Australian MPA area statistics were sourced from the CAPAD 2016 database Australian Government Department of the Environment and Energy (2017) and supplemented by calculations from GIS maps of the 2018 Commonwealth MPA revisions Australian Government Department of the Environment and Energy (2018).
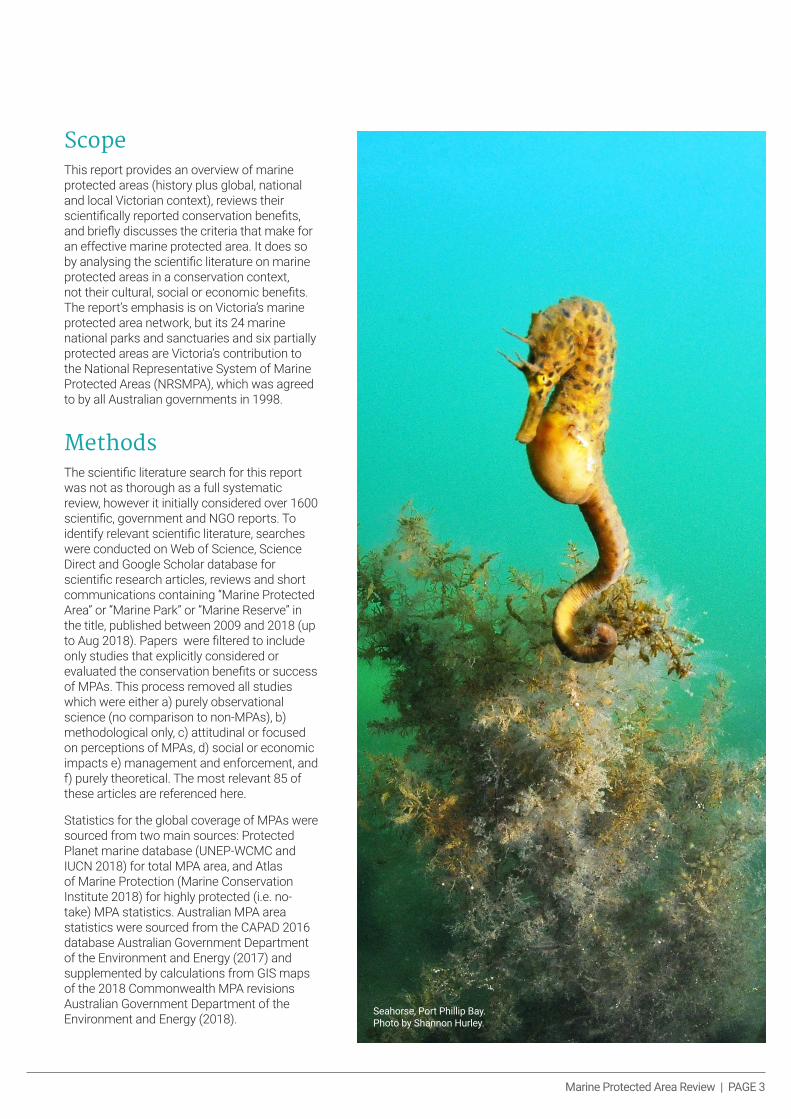
Seahorse, Port Phillip Bay. Photo by Shannon Hurley.
Marine Protected Area Review | PAGE 4
Executive Summary
(1,060km2) are contained within MPAs, half of this figure relies on the inclusion of six partially protected MPAs in South Gippsland that lack goals, objectives, management plans and systematic monitoring. When the 10% figure is further analysed, most is within the Victorian Embayments (Corner Inlet and Nooramunga marine and coastal parks) and Flinders (Wilsons Promontory marine national park, marine park and marine reserve) marine bioregions. The Otway, Central and Twofold Shelf marine bioregions have MPA coverage ranging from 4-6%, mostly no-take.
A 2010 review of Victoria’s MPAs found that they did not meet the NRSMPA’s key principles of comprehensiveness, adequacy and representativeness, while the Victorian Environment Assessment Council in 2017 concluded that the “existing system of no-take marine protected areas has some gaps in representation, and individual marine protected areas may not meet the adequacy criterion”. And both the 2013 and 2018 Victorian State of the Environment reports highlighted the limited protection afforded by the current MPAs.
Marine Protected Areas (MPAs) are a powerful spatial planning tool that aim to conserve marine biodiversity, ecosystems and ecological processes. The accepted international definition of a MPA is very broad, and MPAs can vary massively in scale, the level of protection, and the conservation benefits they provide.
Australia is a world leader in MPA establishment, beginning with the Great Barrier Reef Marine Park in 1975 and continuing with the declaration of new MPAs across Commonwealth, state and Northern Territory waters, all now part of the National Representative System of Marine Protected Areas (NRSMPA). Together the MPAs cover approximately 36% of our territorial waters and, on the surface, meet the lowest international benchmark, Aichi Target 11, of 10% (other targets urge at least 30% that would eventually become no-take). But the biodiversity conservation outcomes are mixed, with the location of MPAs often skewed away from key habitats in favour of areas that have little or no commercial interests (Devillers et al. 2014).
It is now 17 years since Victoria established what was the world’s first highly protected network of marine national parks and sanctuaries. But as the years have passed it has become recognised as inadequate and other Australian jurisdictions have surpassed it.
Although the Northern Territory continue to struggle with marine conservation and trails Victoria, the Australian Government and states of Western Australia, South Australia and Queensland are well ahead, and even New South Wales has covered more of its waters in MPAs.
Internationally, the UN’s Sustainable Development Goal 14, ‘Conserve and sustainably use the oceans, seas, and marine resources’ has set the bare minimum for high-level protection at 10% of marine habitats, double the Victorian percentage, while the long-term aspiration of the IUCN is for at least 30% in no-take.
In Victoria, a mere 5.3% of coastal waters are protected in no-take areas. Although 10.6% of coastal waters
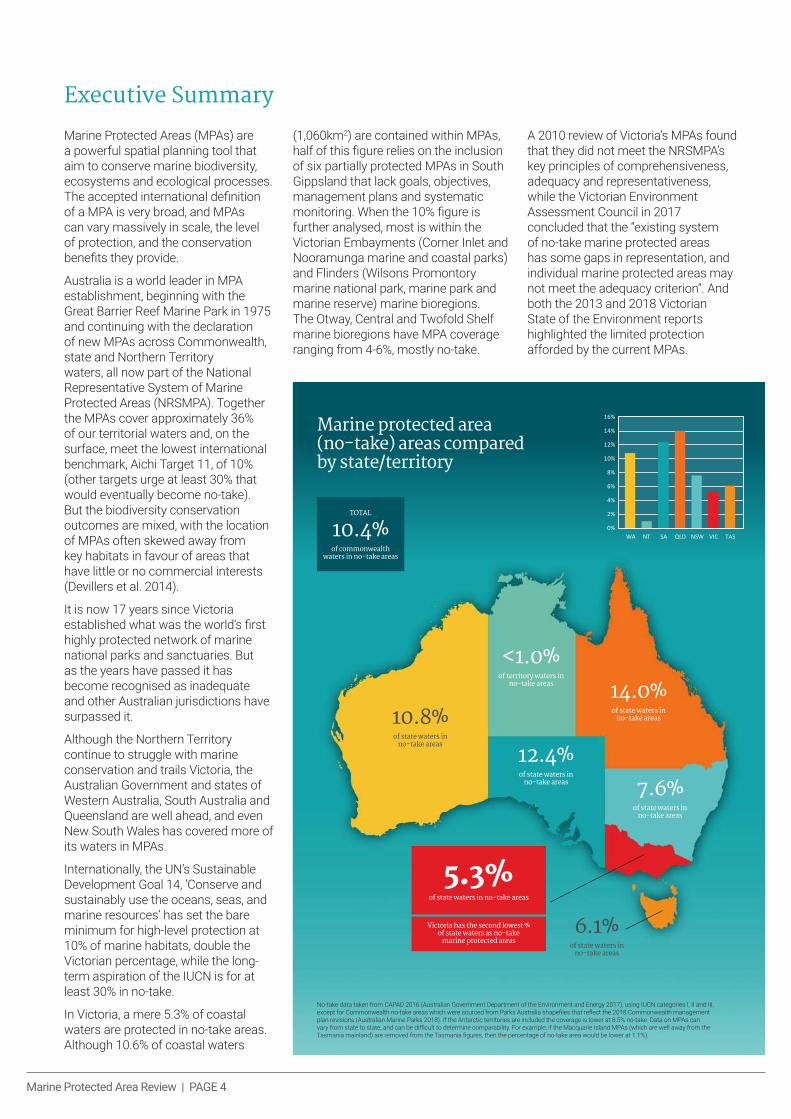
Marine protected area (no-take) areas compared by state/territory
<1.0%of territory waters in
no-take areas
12.4%of state waters in
no-take areas 7.6%of state waters in
no-take areas
10.8%of state waters in
no-take areas
14.0%of state waters in
no-take areas
6.1%of state waters in
no-take areas
No-take data taken from CAPAD 2016 (Australian Government Department of the Environment and Energy 2017), using IUCN categories I, II and III, except for Commonwealth no-take areas which were sourced from Parks Australia shapefiles that reflect the 2018 Commonwealth management plan revisions (Australian Marine Parks 2018). If the Antarctic territories are included the coverage is lower at 8.5% no-take. Data on MPAs can vary from state to state, and can be difficult to determine comparability. For example, if the Macquarie Island MPAs (which are well away from the Tasmania mainland) are removed from the Tasmania figures, then the percentage of no-take area would be lower at 1.1%).
TOTAL
10.4%of commonwealth
waters in no-take areas
5.3%of state waters in no-take areas
Victoria has the second lowest % of state waters as no-take
marine protected areas
0%
2%
4%
6%
8%
10%
12%
14%
16%
WA NT SA QLD NSW VIC TAS

Marine Protected Area Review | PAGE 5
The primary goal of Victoria’s MPAs is to maintain biodiversity and ecological processes, yet Victoria has the smallest area of MPAs of all states and territories, and the second smallest area of no-take reserves behind the Northern Territory.
This report has identified the following key benefits of MPAs:
1. MPAs are effective in stopping direct habitat destruction caused by mining, coastal development, dredging, and some fishing activities
2. Well-managed no-take MPAs maintain higher adult abundances and larger sizes of some exploited organisms compared to areas open to exploitation
3. A large, well-established, well-enforced, no-take MPA with surrounding heavily fished or unregulated areas are likely to provide spill over benefits for exploited species
4. MPAs deliver positive benefits to threatened species populations when the threatened species is at risk from activities that the MPA can regulate
5. The biodiversity and habitat protection benefits provided by MPAs can increase the resistance (the capacity to withstand impacts) and resilience (the capacity to recover from impacts) to human-induced threats
6. MPAs have the potential to be a conservation tool for climate change by: preventing carbon emissions from marine habitat loss, sequestering carbon through habitat repair, affect climatic interactions, conserving ecosystem integrity to resist invasive species favoured by climate change and provide a refuge for species and habitats
However, many MPAs globally do not provide the benefits listed above due to a number of key factors: regulations do not address threats, threats are external and cannot be regulated within the MPA, inadequate staffing and resources, lack of political support, lack of stakeholder support, non-compliance with regulations or the MPA is too small, poorly designed
and in the wrong places. Stemming from these widely-recognized constraints on many global MPAs, several recent studies have identified the key criteria necessary for an MPA to meet key conservation objectives. These key criteria are:
• Legislated with regulations that address actual threats
• Sufficient funding and staffing to manage and enforce regulations
• Supported by government, community and users
• External threats are addressed through broader marine spatial planning
• Part of a network that has representation and replication of habitats
• Old (>10yrs), large (>100km2) and completely protects local habitat extent
• No-take (if conservation objective relates to exploited species)
No-take MPAs are the most effective means of achieving the highest level of conservation benefits – the reason for their establishment – but they should be used within a suite of conservation and marine management measures, including marine spatial planning. In Victoria, barely 5% of its coastal waters are contained within MPAs that have clear conservation plans and objectives, leaving 95% of those waters without comprehensive
planning and management. A holistic marine spatial planning framework for managing cumulative threats, where MPAs are a key conservation pillar, will be the most effective approach to conserving marine environments on a local, regional and global scale.
Recommendations 1. Victoria’s MPAs be considered as
a key conservation pillar in the current Victorian process of marine spatial planning
2. An independent review, of current Victorian MPAs against the NRSMPA’s key principles of comprehensiveness, adequacy and representativeness, as recommended by the Victorian Environmental Assessment Council’s Statewide Assessment of Public Land Assessment, 2017.
3. Review of the criteria for key factors in MPA success (as listed in Table 7) using most recent literature, to better manage expectations around conservation benefits and outcomes, for use in Victorian MPAs.a. Scoping for new MPAs in
Victoria be underpinned by the above criteria and involve a review of previous scoping work conducted by VNPA to identify the gaps in marine protection.
Biscuit Star, Port Phillip Bay. Photo by Shannon Hurley.

Marine Protected Area Review | PAGE 6
SECTION ONE
Marine Protected Areas – an introduction
development), the management goals are often much narrower. It is this breadth of management objectives and aspirations that make MPAs such potentially powerful conservation tools but can also place unrealistic expectations on what MPAs can achieve in each unique context.
Why are MPAs established?
In recent decades there has been a growing recognition of the need to better protect our oceans from human-induced threats. In the coastal zone, pressure from increasing population, coastal development, catchment runoff, shipping, invasive species and recreational activities has put unprecedented stress on marine ecosystems. In the open ocean, improving technology of fishing and mining has brought resource exploitation to even the deepest and most remote locations. New tools were required to conserve the world’s oceans. Hence over the past twenty years we have seen the global coverage of MPAs increase from below 0.7% of the world’s oceans in 2000, to 7.44% today (UNEP-WCMC and IUCN 2018).
Whilst the driving reasons behind the creation of each MPA is unique to the environmental, cultural and economic context, the core goals are based around:
• Conservation of biodiversity• Protection of threatened or
endangered species or ecosystems
• Conservation of ecosystem processes and services
Many secondary objectives arise from these core goals, most associated with the economic and cultural values of conservation. The key secondary objectives include:
• increase fish stocks or fish productivity (an ecosystem service)
• increase tourism (and ecosystem service or outcome of charismatic species protection)
• strengthen cultural connection and opportunity, and
• reference areas for scientific research
However, clear goals and objectives for many MPAs are not clearly set out, even after they have been enshrined in law (Zupan et al. 2018). This has often led to unrealistic public and political expectations of the performance of MPAs, particularly around the secondary benefits such as fisheries productivity (Agardy et al. 2016). This issue is further explored below.
All MPAs are not equal
Each MPA can differ significantly in the rules and regulations in place to achieve marine conservation. The IUCN has created seven categories which describe the level of protection, or conservation objectives, within an MPA (Day et al. 2012). Categories I-III are the most highly protected and no extractive use of living or dead material is allowable, hence they often referred to as “no-take” or “highly protected” MPAs (Table 1). Category IV is aimed at protecting some, but not all, species or habitats. Hence there may be strict restrictions
“They (MPAs) are a necessary and fundamental step in arresting what is clearly an unsustainable trend in exploitation”
T I M W I NT O N, A U T H O R A N D C O N S E R VAT I O N I S T
What is a marine protected area?
Marine Protected Areas (MPAs) are a conservation tool based on spatial planning and regulation of coastal and oceanic waters. Rules and regulations determine what activities can occur within zones of a MPA, and management plans address threats to the key values such as biodiversity, threatened species, ecosystem processes and services, and cultural and social values.
An internationally accepted definition was created by the International Union for Conservation of Nature in 2008; A MPA is a “clearly defined geographical space, recognised, dedicated and managed, through legal or other effective means, to achieve long-term conservation of nature with associated ecosystem services and cultural values” (Dudley 2008).
The broad goal “to achieve long-term conservation of nature” is what sets MPAs apart from other marine spatial management tools which focus on protecting ecosystem services or cultural values. For example, a fisheries habitat or spawning ground closure aims to conserve fish productivity, an ecosystem service, as the primary outcome. Similarly, a shipwreck preservation zone aims to conserve the cultural and historical value associated with the shipwreck. Whilst the effective rules and regulations of these types of spatial management zones may be very similar to MPAs (e.g. prohibition of fisheries, mining and coastal

Marine Protected Area Review | PAGE 7
on certain activities (e.g. allows line fishing but not trawling) or allows the extraction of certain species and not others. Categories V-VI aim to preserve the established sustainable human interactions with the marine environment, for example allowing artisan fishing but not industrial activities or mining.
An MPA can consist of a single category or consist of many separate zonings each with a different category. For example, many of Victoria’s MPAs are zoned only as Category II National Parks, while the Great Barrier Reef Marine Park consists of eight protection categories spread over scores of different parts of the park. Ninety-four percent of global MPAs allow fishing of some kind in some areas (Costello and Ballantine 2015), and many do not have no-take zones at all. For example, whilst Brazil’s MPAs cover 25% of their waters there are no areas that prevent fishing altogether (Giglio et al. 2018). Less than 1% of the famed Galapagos Marine Park is no-take (Moity 2018). Therefore, the level of conservation benefits begins with the zoning regime, with higher levels of protection against identified threats offering greater benefits.
Regardless of classification, however, for an MPA to be an effective conservation tool, rules and regulations must be enforced and management plans acted on (Agardy et al. 2011). There is currently much conjecture over the effectiveness of many MPAs globally, which exist only as lines on the map, without regulation or action on the water (Watson et al. 2014). For example, a 2012 report found that only 1% of MPAs in the Coral Triangle (SE Asia) were effectively managed (Burke et al. 2012), and hence could enforce regulations and address threats. MPAs with adequate staff capacity have 2.9 times the ecological impact, highlighting the need for adequate investment in MPAs beyond their initial establishment (Gill et al. 2017). Mere lines on a map will not result in marine conservation.
Table 1. IUCN MPA protection categories summarised from Day et al. (2012).
IUCN MPA Description DefinitionCategory
Ia Strict Nature
Reserve
Ib Wilderness
Area
II National Park
III National
Monument
IV Habitat/species
management area
V Protected
seascape
VI Protected area
with sustainable
resource use
Strictly protected areas set aside to protect biodiversity and also possibly geological/ geomorphological features, where human visitation, use and impacts are strictly controlled
Large unmodified or slightly modified areas, retaining their natural character and influence, without permanent or significant human habitation, which are protected and managed so as to preserve their natural condition
Large natural or near natural areas set aside to protect large-scale ecological processes, along with the complement of species and ecosystems, which also provide a foundation for environmentally and culturally compatible spiritual, scientific, educational, recreational and visitor opportunities
Areas set aside to protect a specific natural monument, which can be a landform, sea mount, submarine caverns, geological feature such as caves or even a living feature such as an ancient grove. They are generally quite small protected areas and often have high visitor value
Areas to protect particular species or habitats
Areas safeguarded to conserve with significant ecological, biological, cultural and scenic value
Protected area with sustainable resource use Areas that conserve ecosystems and habitats together with associated cultural values and traditional natural resource management systems
Barwon Bluff Marine Sanctuary, Great Victorian Fish Count. Photo by Parks Victoria.

Marine Protected Area Review | PAGE 8
SECTION TWO
Benefits of Marine Protected Areas
Table 2. The four key benefits of MPAs, their components, and the mechanisms behind them.
“MPAs are not a panacea. They're not going to solve everything. But they're a powerful and underutilized tool.”
J A N E LU B C H E N C O, F O R M E R H E A D O F N O A A
The reasons for establishing marine parks are many and varied, and each jurisdiction employs their own underlying goals and purposes to the MPA network. The benefits can be broadly placed into three different categories – conservation, economic and social. This report focuses on the conservation benefits of marine parks, although there is brief discussion of the fisheries benefits, a subject that crosses the boundaries between the three categories.
Conservation benefits of MPAs can be put broadly into four different categories: Biodiversity protection (including habitats), threatened species conservation, ecosystem and climate change resilience and spillover benefits (Table 2).
To put this into context in terms of the worthiness and potential benefits of Victoria's marine environment protected in MPAs, according to the Environment Conservation Council’s 1999 report, there is nowhere in Australia where there is ‘such a rich diversity of flora and fauna, and cultural sites and landscapes, along such a compact and easily accessible coastline’. This diversity includes intertidal, subtidal and deep reefs, seagrass beds, sheltered intertidal mudflats, mangroves and beaches, subtidal soft substrates and pelagic (open water) environments and are contained within five marine bioregions:
MPA Benefit Mechanism Key study
Biodiversity protection
• Prevent habitat destruction
• Prevent depletion of populations
• Exclude major destructive activities (e.g. mining, coastal development, destructive fishing)
• Exclude minor destructive activities (e.g. human trampling, scuba diving)
• Exclude harvesting of living organisms such as fishing
Gaines et al. 2010
Edgar et al. 2014
Threatened species conservation
• Prevent population decline of threatened species
• Facilitate recovery of populations
• Prevent disturbance to critical behaviour
• Exclude harvesting (legal and illegal)• Prevent incidental harm by restricting
boating and recreational activity (e.g. ship-strikes, habitat disturbance)
• Protection of critical habitat
• Exclusion of harmful activities from breeding ground
• Reduce noise impacts by restricting boating
• Exclude seismic testing activities
• Regulate human tourism interactions
Afonso et al. 2011
Williams et al. 2015
Filby et al. 2017
Ecosystem resilience
• Increased capacity to resist and recover from disturbance
• Recover from climate and weather events
• Increase resilience to climate-driven ecosystem shifts
• Increase resilience to invasive species
• Reduce incidence of biological invasions
• Mitigate climate change
• Higher genetic diversity in MPAs
• MPAs support larger populations and maintain trophic diversity
• MPAs maintain ecosystem integrity and stability
• Presence of higher trophic levels in MPAs resists invasion of climate-driven invasive species
• Restricting human interaction with the ecosystem e.g. reducing boat traffic
• Preservation of natural habitats locks up carbon. Recovery of habitats sequesters carbon
Munguia-Vega et al. 2015
Emslie et al. 2016
Ling et al. 2009
Ling and Johnson 2012
Hopkins et al. 2016
Spillover Benefits
• Contribute to population growth in areas adjacent to MPA
• Increase numbers of exploited species in areas adjacent to MPA
• Larval transport from MPA to surrounding areas
• Movement of individuals into adjacent areas due to density-dependence
Harrison et al. 2012
Diaz et al. 2016
• Otway: South Australian border to Cape Otway
• Central Victoria: Cape Otway to Cape Liptrap
• Flinders: Cape Liptrap to the western end of Ninety-mile Beach (and including Wilsons Promontory)
• Twofold Shelf: Ninety-mile Beach to the NSW border
• Victorian Embayments: Port Phillip Bay, Western Port, Corner Inlet
Recently these have been divided further into biounits (refer to pages 17-18 for more information on biounits).

Marine Protected Area Review | PAGE 9
Monitoring effort and the publication of scientific literature does not show an even spread across the many benefits of MPAs. Instead we see a clear focus on assessing the effectiveness of MPAs relative to fish assemblages and species of interest to fisheries. This often occurs even when these indicators are not relevant to the initial reasons those MPAs were established. The focus on fish is due to both practical reasons of fish being easier to count than the plethora of benthic and cryptic species, and driven by the rewards of contributing to the ongoing polarising debate around fisheries benefits of MPAs. The benefits of biodiversity and ecosystem protection are widely accepted and not often explored, while the areas of threatened species conservation (mostly megafauna that are not resident in MPAs), climate change and resistance to invasive species are difficult to quantify.
Furthermore, most studies evaluate changes to marine life resulting from the restriction of harvesting, in most cases fishing. There is little to no literature on the role MPAs have played in restricting mining or petroleum activities, port construction or coastal fringe development. As highlighted previously, MPAs provide major benefits in restricting devastating activities that involve the wholesale destruction of marine habitats. The value of such protection cannot be easily quantified, as they involve preventing activities that are yet to, or may now never, be undertaken. This is of particular importance in the developing world, which are often more reliant economically on resource extraction and lack other forms of regulation (Marinesque et al. 2012). It is important not to lose sight of such critical benefits, when public debate is focused on secondary benefits such as fisheries productivity.
The four key benefits are explored in further detail here:
Biodiversity protection
The evidence is compelling for the effectiveness of well-managed no-take reserves in maintaining higher
adult abundances and larger sizes
of exploited organisms compared to areas open to exploitation (Lester et al. 2009, Fenberg et al. 2012, Edgar et al. 2014). Recent studies supporting MPA benefits to exploited species from the past 10 years (2009-2018) include:
• 2x large fish species, 5x more large fish biomass and 14x more shark biomass in large, isolated, well-enforced, well-established, no-take MPAs compared to non-MPAs in a global study (Edgar et al. 2014)
• 71% of over 218 MPAs studied across the globe positively influenced fish populations, increasing fish biomass by 60%, across all geographies and habitats (Gill et al. 2017)
• Abundance and biomass of adult commercial fish species in Spanish MPAs positively affected by MPA protection, but not juveniles or larval stages (Felix-Hackradt 2018)
• Higher fish abundance and size in Azores MPAs, but only for species with larger maximum size and lower mobility, and only in reserves with high compliance levels (Afonso et al. 2018)
• 12x number grey reef sharks after eight years MPA protection on Ashmore reef, and a shift to more apex predators (Speed et al. 2018)
• Re-establishment of natural population dynamics of lobster in a Spanish MPA after 25 years, with significantly greater size , biomass and fecundity than fished areas (Diaz et al. 2016)
• Greater size, adult abundancy and occupancy rates for exploited fish species in no-take Florida MPAs ten years after implementation (Ault et al. 2013)
• Significantly high abundance and larger sizes of four exploited species in a NSW MPA after 14 years compared to outside, but no difference for non-exploited fish species (Malcolm et al. 2018)
• Higher abundances of five exploited fish families after 10 years protection in two NSW MPAs, however the difference was only significant in one of the MPAs (Harasti et al. 2018)
• Significantly greater abundance of exploited kingfish in no-take marine reserves in NSW, but only on their favoured habitat of high complexity reefs (Rees et al. 2018)
• Two exploited reef fish had significant higher abundances in a small NSW MPA that restricted spearfishing after 12.5 years (Curley et al. 2013)
• Only no-take areas of a Mexican MPA had higher abundances of reef fish after 15 years (Rife et al. 2013)
• Higher species diversity and more larger individuals of commercially targeted fish inside Philippines MPAs (Muallil et al. 2015)
• Significantly higher biomass and abundance of coral trout species in an 11 year old no-take MPA in Malaysia (Chen Chung et al. 2017)
• Higher abundances of heavily exploited fish inside Belize MPAs, but lower abundances of other fishes and corals (Karnauskas and Babcock 2014)
• Higher abundance of exploited limpets in MPAs in Italy (Marra et al. 2017)

There are examples of where benefits to exploited organisms have not been observed, and these are related to specific management failings such as poor enforcement (Pieraccini et al. 2017), economic traits such as high value species that encourage illegal poaching, and for low-productivity species that are not given enough time to recover (Ban et al. 2017). Highly mobile species that spend only a small part of their time within the boundaries of MPAs are also not likely to receive much benefit of MPA protection (Pilyugin et al. 2016), unless there is regional cooperation in designing reserves (Breen et al. 2015). However, very large and old MPAs such as the Galapagos MPA (created 20 years ago), have increased tuna fisheries productivity for migratory yellowfin and skipjack tuna (Bucaram et al. 2018).
The benefits of MPAs to non-exploited organisms, or non-targeted life stages of exploited organisms is context dependent. Not all species will benefit from no-take reserve protection, such as algae and slow-growing stony corals (Lester et al. 2009), or prey of heavily exploited species (Harasti et al. 2014). However, given the large benefits provided to exploited organisms the overall benefit of MPAs can still be evident when considering all species within an ecosystem. The following studies investigated species and communities beyond those exploited:
• A comprehensive review of 149 studies of 124 different MPAs across 29 countries found that total average organism biomass was 446% greater, density 166% higher, size 28% bigger and species richness 21% greater (Lester et al. 2009). The benefits were consistently higher for exploited organisms and highest for fishes and invertebrates, in particular lobsters, crabs and intertidal molluscs (Lester et al. 2009).
• A review focused on the benefits of MPAs to primary producers and herbivores found mixed results stemming from complex interactions within each ecosystem (Gilby and Stevens 2014). The clear majority of coral reef MPAs had less algae and urchins, however no differences were detected in kelp/algal MPAs.
• More complex habitats and higher abundance of associated fauna (macroalgae, sponges, hydroids, featherstars and others) detected in MPAs in the UK compared to surrounding fishing grounds (Howarth et al. 2015), attributed to reduced disturbance from fishing. However, there were no differences in mobile fauna such as crabs and starfish between MPAs and fished areas.
In addition to the important biodiversity benefits in protecting ecosystems from destructive activities such as coastal development and mining, MPAs can also protect habitats from minor human impacts such as trampling or scuba diving. Both seagrass beds (Travaille et al. 2015) and intertidal algae (Addison et al. 2015) can be significantly impacted by trampling, and MPAs can regulate to reduce these impacts.
Threatened species conservation
MPAs deliver positive benefits to threatened species populations when
the threatened species is at risk from activities that the MPA can regulate. For example, a small MPA in Portugal effectively conserved populations of endangered dusky groper that was at risk from illegal fishing (Afonso et al. 2011). Most listed endangered marine species are megafauna, however, with very large migratory and foraging ranges. This presents a significant issue in adequately protecting enough of their range to be effective (Hays et al. 2016). MPAs are therefore targeted on areas of intense threats or necessary for critical life stages, e.g. breeding grounds (Lascelles et al. 2012). Very large MPAs could be based around migratory routes which are often similar for many species (Pendoley et al. 2014).
Lonsdale Wall, in Port Phillip Heads Marine National park. Photo by Shannon Hurley.

Marine Protected Area Review | PAGE 11
Megafauna such as dolphins, seals, whales and seabirds, can be negatively affected by intensive interactions with human tourism which disrupt natural behaviours (Ashe et al. 2009, Velando and Munilla 2011). MPAs can exclude tourism vessels in critical feeding or social areas, such as those proposed by scientists for the Burranan dolphins in Port Phillip Bay (Filby et al. 2017). Restrictions on boating in MPAs also has the potential to reduce boat strikes on threatened species such as turtles (Denkinger et al. 2013). At present few MPAs restrict recreational boating, however this could be an effective strategy for turtle foraging sites in places like the Galapagos (Dekinger et al. 2013).
MPAs have the potential to be “noise refuges” for organisms that rely on acoustic cues to communicate and navigate (Williams et al. 2015). By reducing or excluding ship traffic in MPAs, noise can be mitigated, and stress reduced on threatened or protected species such as whales, dolphins and seals. Seismic testing is also a threat to many megafauna that rely on acoustic signalling (Thompson et al. 2013), with MPAs potentially providing clear benefits in reducing mining and oil exploration activities (Gomez et al. 2017).
Protection from fishing under MPAs can, however, have unintended negative consequences for some protected species through trophic cascades. Abundance of the protected White’s seahorse in NSW MPAs were lower than outside, attributed to the higher abundance of predators in the MPAs (Harasti et al. 2014). Protection had resulted in the increase in exploited species, but not in non-exploited species that are threatened by external pressures that MPAs cannot effectively mitigate. Similar negative effects of protection were observed in an Indonesian MPA, where over-abundant turtles caused loss of seagrass habitat through overgrazing (Christianen et al. 2014), however this effect may be facilitated by the failure to curb threats on turtle predators. These results do not discredit MPAs however, they instead enforce the call for MPAs to be used in tandem with other approaches to achieve effective marine conservation.
Ecosystem resilience and climate change
The biodiversity and habitat protection benefits provided by MPAs can increase the resistance
(the capacity to withstand impacts) and resilience (the capacity to recover from impacts) to many human-induced threats (Hopkins et al. 2016). In preserving natural food webs and trophic balance, MPAs can also help resist disturbances such as biological invasion. In the Bahamas, high abundances of exploited grouper in MPAs better excluded the invasive lionfish and acted as an effective natural bio-predator (Mumby et al. 2011). However, despite these specific examples there is also evidence that many invasive species do equally well or better within marine reserves (Burfeind et al. 2013). MPA management plans can also trigger on-ground management options such as the physical removal of invasive species. This approach has been
effective for removing invasive kelp in small Tasmanian MPAs (Hewitt et al. 2005) and is currently being undertaken in Victoria’s MPAs (Ricketts Point and Nooramunga Marine and Coastal Park) to remove a native pest sea urchin species (French 2018).
Marine reserves can foster high genetic diversity than fished areas (Munguia-Vega et al. 2015), resulting in greater tolerance within the population to disturbance, and ability to recover under a variety of changed conditions (Almany et al. 2009). This includes the threat of climate change and the critical ability of marine ecosystems to resist and recover from the effects (McLeod et al. 2009). Larger population sizes and species diversity can result in greater genetic tolerance within those groups to extreme heat or pH associated with ocean warming and acidification. Preserving the genetic diversity will promote the resilience of the ecosystems, the ability to bounce back after the heat or acid intolerant individuals have been lost (e.g. for corals: Baskett et al. 2009, Palumbi et al. 2014).
Burrunan dolphin (Tursiops Australis), endemic to Southern Australian waters, primarily from Port Phillip Bay and Gippsland Lakes. Photo taken by Nicole Filby at the southern end of Port Phillip Bay.

Marine Protected Area Review | PAGE 12
The ubiquitous impact of a changing global climate proposes a significant conservation challenge for MPA management. Climate change impacts in MPAs are predicted to be greater than those for land-based impacts and ocean impacts combined (Mach et al. 2017 ). MPAs can be a conservation tool for climate change resilience in a number of different ways: 1) Preventing carbon emissions from marine habitat loss, 2) sequestering carbon through habitat repair, 3) affect climatic interactions, 4) conserving ecosystem integrity to resist invasive species favoured by climate change and 5) provide a refuge for habitats that alter distribution in response to climate change (Hopkins et al. 2016).
Traditional MPAs can only contribute in a small way to reduce the direct impacts of climate change, such as ocean warming, acidification and rising seas level (Keller et al. 2009) and therefore needs to be paired with significant emissions reductions. Such change is occurring on a global scale that must be addressed via significant emissions reductions. However, MPAs can play a role in this, by ensuring carbon is not further released into the atmosphere by preventing habitat change, and in sequestering carbon through the natural cycles of vegetative growth and burial in ecosystems such as mangroves, saltmarsh and seagrass (Hopkins et al. 2016).
Examples of MPAs providing greater resistance and resilience to climate change include the following studies from the past ten years:
• By fostering larger individuals than outside, MPAs can better resist climate-driven mass mortality events, such as observed in Mexico where abalone in MPAs survived a hypoxia event because of their larger size and better health (Micheli et al. 2012). These large individuals also had greater egg producing capacity, and could replenish surrounding non-MPA areas after the mortality event
• In the Great Barrier Reef, while MPAs could not protect against the coral habitat destruction caused by a severe tropical cyclone, exploited coral trout fish populations in MPAs did not decline compared to significant declines in unprotected areas (Emslie et al. 2016)
• MPAs in eastern Tasmania supported greater abundances of large exploited lobsters, which could prey on and control the invasive sea urchin, which is extending its range southward via climate change (Ling et al. 2009, Ling and Johnston 2012)
MPAs also have the potential to reduce the likelihood of invasive species invasion by limiting the human interactions with the ecosystem. Recreational boating and commercial shipping are the key vectors of introduction (Murray et al. 2011), and hence excluding fishing boat traffic or removing shipping lanes will reduce the incidence of invasion.
Spillover benefitsSpillover is broadly defined as the net movement of organisms from MPAs into areas where they benefit humans, most often through fishing (Di Lorenzo et al. 2016). For spillover to occur, the MPA firstly must be effective in rebuilding and supporting large fecund populations of organisms which, through density-dependence (i.e. higher numbers inside than outside), can transport offspring or adults to surrounding areas. In a review of 85 studies investigating spillover effects of MPAs, 80% were found to show a spillover benefit (Di Lorenzo et al. 2016). Without further study, this result cannot be generalised to all MPAs. All but one study reported a recovery of populations inside the MPA, meaning that these MPAs likely met the criteria (identified in Section Three) that make an effective MPA.
Given that the majority of MPAs globally are not no-take (Costello and Ballantine 2015), many are likely not supporting significantly higher population densities and biomass of exploited organisms, and spillover may not be as common as scientific literature would suggest (Di Lorenzo et al. 2016).
A large, old, well-enforced, no-take MPA with surrounding heavily fished areas are very likely to provide spillover benefits for exploited species. A 25 year old no-take reserve in Spain demonstrated spillover of small adult lobsters to adjacent fished areas, as lobsters grew much larger in the MPA and are territorial (Diaz et al. 2016). Spillover can also occur through larval transport from MPAs, as demonstrated on the Great Barrier Reef, where 83% of coral trout and 55% of stripey snapper in fished areas were sourced from MPAs, despite MPAs only accounting for 28% of the total reef area (Harrison et al. 2012). However, spillover does not work for all species with a larval stage, as demonstrated by the absence of spillover benefits for mussels in South African MPAs, despite high adult abundance and larval production in MPAs (Cole et al. 2011).
Bio-economic modelling studies have demonstrated the potential for spillover fisheries benefits of MPAs in the medium to long term (Cuervo-Sanchez et al. 2018), however there is evidence to show that this can only occur in areas of poor fisheries management and overexploited stocks (Buxton et al. 2014). Biophysical modelling studies have predicted that spill-over would occur for species that receive protection and benefit from MPAs, but only at a small scale up to 800m away from the MPA (Halpern et al. 2010a). Similar local-scale benefits are predicted using ecosystem models (Colleter et al 2014), however the spillover was predicted to around the same as that lost from not fishing in the MPAs.

Marine Protected Area Review | PAGE 13
SECTION THREE
Global targets: how is Australia and Victoria tracking?
International benchmarks
Global targets for MPA coverage have been in place since 2006, when the Convention on Biological Diversity called for MPAs on 10% of the world’s oceans by 2012. However, this target was not met and by 2012 only 2.3% of the global ocean was designated MPAs (Spalding and Hale 2016). A revision of the approach led to the development of the “Aichi Target 11” in 2010:
“By 2020, at least 17 per cent of terrestrial and inland water areas and 10 per cent of coastal and marine areas, especially areas of particular importance for biodiversity and ecosystem services, are conserved through effectively and equitably managed, ecologically representative and well-connected systems of protected areas and other effective area-based conservation measures, and integrated into the wider landscape and seascape” (Convention on Biological Diversity)
This extended the 10% target until 2020 and broadened the definition of what could be considered an MPA to include other types of spatial management and conservation measures.
This loosening of the definition of what constitutes an MPA led to widespread backlash amongst many scientists, some calling for the term MPA to be abandoned (Costello and Ballantine 2015), and others proposing more ambitious targets focused on no-take areas. The 2014 World Parks Congress called for 30% of the world’s oceans to be managed
as no-take MPAs, but set no deadline to achieve the target, instead seeing it as an ambitious end-goal (WPC 2014), similar to the IUCN World Conservation Congress in Hawaii (2016), which recommended at least 30% in MPAs with a long-term ambition that it be all no-take.
While the Aichi Target 11 could be considered a softening of the definition and dilution of protection targets, the decision brings to the fore the importance of a broader marine spatial management system which includes traditional MPAs (Spalding and Hale 2016). The most highly protected MPA may be ineffective if major threats external to the MPA boundaries go unaddressed (Agardy et al. 2011, Kearney et al. 2012, Stafford et al. 2016). Pressures such as sedimentation and nutrients from land runoff, and invasive species and pollution stemming from shipping and ports are better addressed at the
regional scale rather than the scale of single MPAs (Mach et al. 2017).
In recent research by O’Leary et. Al, (2016) , the authors analysed 144 studies to determine whether international targets for marine conservation were ‘adequate to achieve, maximize, or optimize six environmental and/or socioeconomic objectives’. They concluded that: ‘Results consistently indicate that protecting several tens-of-percent of the sea is required to meet goals1 (average 37%, median 35%, modal group 21–30%), greatly exceeding the 2.18% currently protected and the 10% target. ‘The objectives we examined were met in 3% of studies with ≤10% MPA coverage, 44% with ≤30% coverage, and 81% with more than half the sea protected. The UN’s 10% target appears insufficient to protect biodiversity, preserve ecosystem services, and achieve socioeconomic priorities’.
1 The six goals are: (1) protect biodiversity; (2) ensure population connectivity among MPAs; (3) minimize the risk of fisheries/population collapse and ensure population persistence; (4) mitigate the adverse evolutionary effects of fishing; (5) maximize or optimize fisheries value or yield; and (6) satisfy multiple stakeholders (i.e., studies contain analyses designed to identify the required percentage coverage to minimize trade-offs between stakeholders and maximize value.
Seagrasses are one of the most rapidly declining
ecosystems on Earth. They provide one of the highest values of non-commercial
ecosystem services by Victoria’s coastal habitats,
but are not adequately protected in Victoria’s marine
protected areas network. Photo: Shannon Hurley,
Seagrass meadow in Ricketts Point
Marine Sanctuary.

Marine Protected Area Review | PAGE 14
The global coverage of MPAs in 2018
The official August 2018 United Nations figure for the global coverage of MPAs that fall under the Aichi 11 definition is 29,945,395km2, or 7.44% of the world’s oceans, spread across 15,334 MPAs (UNEP-WCMC and IUCN 2018). However, accurately calculating the area of the global ocean meaningfully protected by MPAs (i.e. not “paper parks”) is a difficult exercise and several differing figures exist. Differences arise by alternative interpretations of a minimum acceptable protection level, and in differentiating the implemented and “working” MPAs from those that are only designated or proposed. The current UN and IUCN figures are thought to be over-optimistic and do include many proposed but not yet functioning MPAs (MCI 2018). An internationally recognised
There is great disparity in the size of MPAs globally. More than half of the world’s MPAs are less than 10km2 in size, and the 20 largest comprise 60% of total area (MCI 2018). These large MPAs are mostly in isolated areas and are widely criticised (Singleton and Roberts 2014) for being declared in the overseas territories of developed countries to deflect attention from MPAs at home (Jones and De Santo 2016) and to quickly meet their contribution to the global target. Whilst large remote MPAs do protect vast areas of lightly impacted “wilderness” areas (Graham and McLanahan 2013), they do not necessarily provide a good representation of ecosystems, habitats, climates and levels of human interaction (Spalding and Hale 2016). Whilst the Aichi 11 targets aims for good representation of bioregions and species coverage in MPAs, there is an over-representation of coral reef systems in the tropics and rocky reef systems in temperate areas. In 2013, only 32% of coastal and shelf bioregions and 5% of the pelagic bioregions achieved the target 10% MPA coverage (Butchart et al. 2015). Species protection was significantly skewed towards stony corals (78% of species have 10% of their range in MPAs) and bony fishes (47% of species have 10% range in MPAs), with no other group having greater than 25% of species meeting the Aichi target (Butchart et al. 2015).
Barr et (2011) found that ‘73% of countries have inequitably protected their biodiversity and that common measures of protected area coverage do not adequately reveal this bias…leaving many vulnerable species and habitats with little or no formal protection’ . For MPAs to be successful, and after reviewing 87 across the globe, Edgar et al (2014) found that they had to be no take, well enforced, old, large and isolated.
No-take
MPAs
Other
MPAs
Designated MPAs
Proposed
MPAsTOTAL
Percentage of Global ocean protected
2.0 1.7 1.8 2.0 7.44
Table 3: Percentage of the global ocean protected by MPAs. Designated MPAs are those that are gazetted but do not have functioning management plans. Data taken from the Atlas of Marine Protection (MCI 2018).
independent source, the Atlas of Marine Protection maintained by the Marine Conservation Institute (MCI 2018), instead calculates total MPA coverage at 3.7% of the global ocean and only 2% which is strongly protected (defined as no-take or heavily restricted take, effectively IUCN categories I-III). The remaining 3.7% of the UN-IUCN figure is made up of legally designated but unimplemented MPAs and proposed MPAs (Table 3).
Most MPAs exist in national waters, with 17.3 % of waters under the jurisdiction of individual countries either currently or proposed to be protected. By comparison, only 1.2% of the high seas, or international waters, are protected (UNEP and IUCN 2018). Closing the gap on high seas protection represents the biggest challenge for meeting the global Aichi 11 target (Spalding and Hale 2016), as it requires international agreement at the level of the UN or regional fisheries management groups.
Blue Devil Fish, Port Phillip Heads Marine National Park. Photo by Shannon Hurley.

Marine Protected Area Review | PAGE 15
MPAs in Australia
Thirty-six percent of Australia’s total territorial waters are designated an MPA with some level of protection. If the Antarctic territories are not considered, this figure is 40%. This is one of the highest representations in the world and well exceeds the global Aichi target. Data from the World Bank places Australia ninth globally in percentage coverage (sixth if nations with extremely small marine area are excluded) and third in total area behind USA and France (World Bank 2018). However when looking at “highly protected” MPAs, the figure drops to 10% of Australia’s jurisdiction.
The Atlas for Marine Protection (MCI 2018) considers less than a third of Australia’s designated MPAs to meet the criteria for effective protection. This is likely due to the recent upheaval of the Commonwealth MPA Management Plans, which were suspended and reviewed between 2014 and 2018, significantly altering the internal boundaries and protection levels (reduced from 14% to 10% no-take). Hence most Commonwealth MPAs were considered “Paper parks” during this period. The new management plans came into force on July 1st 2018 and as of August 2018 figures from the Atlas for Marine Protection have not been updated to include the new protection levels. Devillers et al (2014) argue that the new Commonwealth marine parks
Country Total Area
MPAs
(million km2)
% of jurisdiction
Area of “highly protected”
MPAs
(million km2)
%
Jurisdiction
“highly protected”
MPAs
USA 5.1 42 2.8 23
France 3.4 35 0.1 1
Australia 3.3 36 0.9 10
Great Britain 2.8 41 1.5 23
New Zealand 1.2 28 0.1 1
GLOBAL 29.9 7.4 8.1 2
networks are ‘residual’, that is, located in areas remote from economic interest with fewer conservation benefits than if they were located in exploited areas. This review preceded the recent reductions in no-take zones.
Ninety-eight percent of Australia’s total MPA area lies in Commonwealth Waters (and Commonwealth managed areas of the Great Barrier Reef), with the remainder spread across various state and Northern Territory waters (Table 5). Not all jurisdictions meet the Aichi Target 11 – Northern Territory and Tasmania each have less than 10% of their waters protected in MPAs, and none meets the ambitious 30% no-take target proposed by the World Parks Congress and IUCN, with Qld having the highest no-take representation at 14% of territorial waters. Northern Territory lags all other states and territories in having only two MPAs, one with a no-take zone while the other awaits a management plan and the assignment of zones (as of August 2018)
Australia has good representation of its bioregions meeting the 10% Aichi target (Roberts et al. 2018). Only five of the 41 bioregions (12%) had less than 10% MPA coverage, most of these in the South-east. Eight bioregions were extremely well represented with over 50% coverage in MPAs, most of these in the Great Barrier Reef region. The level of protection is not so well distributed, however, with 61% of bioregions having less than 10% of their area in no-take zones (Roberts et al. 2018).
Table 5: Number and area of MPAs as defined under Aichi target 11, by state and territory. Note that there is some overlap in MPAs between jurisdictions the area total for Australia marked with an * is not the direct sum of the figures presented. Total MPA area and no-take data taken from CAPAD 2016 (Australian Government Department of the Environment and Energy 2017), using IUCN categories I, II and III, except for Commonwealth no-take areas which were sourced from Parks Australia shapefiles that reflect the 2018 Commonwealth management plan revisions (Australian Marine Parks 2018).** Calculations for total jurisdiction include both Australian national waters and overseas territories (8,148,250km² - Geosciences Australia 2018). If the Antarctic territories are included the total area is totalling 9,081,035km² and the total Australian MPA coverage is lower at 36%, and no-take MPAs 8.5%. Data on MPAs can vary from state to state, and can be difficult to determine comparability. For example, if the Macquarie Island MPAs (which are well away from the Tasmania mainland) are removed from the Tasmania figures, then the percentage of no-take area would be lower at 1.1%)
Jurisdiction
(State/Territory/Common-
wealth)
No. of MPAs
Total MPA
Area (km2)% of jurisdiction
in MPAs
Area of no-take MPA
(km2, IUCN categories I-III)
%
Jurisdiction
no-take
Commonwealth 62 3,177,677 39.0 804,807 10.4
QLD 90 62,772 51.5 17,019 14.0
SA 50 27,130 45.2 7,444 12.4
WA 39 25,197 21.8 12,474 10.8
NSW 18 3,489 39.6 666 7.6
NT 2 2,906 4.1 650 <1.0
TAS 71 1,567 7.0 1,365 6.1
VIC 30 1,060 10.6 531 5.3
TOTAL 362 3,254,350* 35.8** 845,995 9.3**
Table 4: Five countries with the largest areas of current, designated and proposed MPAs globally, and global MPA total. Data for total area derived from UNEP-WCMC and IUCN (2018) and highly protected MPAs from (MCI 2018).

Marine Protected Area Review | PAGE 16
Marine protected area (no-take) areas compared by state/territory
<1.0%of territory waters in
no-take areas
12.4%of state waters in
no-take areas 7.6%of state waters in
no-take areas
10.8%of state waters in
no-take areas
14.0%of state waters in
no-take areas
6.1%of state waters in
no-take areas
TOTAL
10.4%of commonwealth
waters in no-take areas
5.3%of state waters in no-take areas
Victoria has the second lowest % of state waters as no-take
marine protected areas
Table 5: No-take data taken from CAPAD 2016 (Australian Government Department of the Environment and Energy 2017), using IUCN categories I, II and III, except for Commonwealth no-take areas which were sourced from Parks Australia shapefiles that reflect the 2018 Commonwealth management plan revisions (Australian Marine Parks 2018). If the Antarctic territories are included the coverage is lower at 8.5% no-take. Data on MPAs can vary from state to state, and can be difficult to determine comparability. For example, if the Macquarie Island MPAs (which are well away from the Tasmania mainland) are removed from the Tasmania figures, then the percentage of no-take area would be lower at 1.1%).
0%
2%
4%
6%
8%
10%
12%
14%
16%
WA NT SA QLD NSW VIC TAS
Marine Protected Area Review | PAGE 17
Highly and partially protected MPAs in Victoria
It is now 17 years since Victoria established what was the world’s first highly protected network of marine national parks and sanctuaries. But as the years have passed it has become recognised as inadequate and other Australian jurisdictions have surpassed it.
Although the Northern Territory continue to struggle with marine conservation and trails Victoria, the Australian Government and states of Western Australia, South Australia and Queensland are well ahead, and even New South Wales has covered more of its waters in MPAs.
Australia’s state jurisdictions have opted for creating multi-zoned marine parks but with core areas given high-level protection (IUCN I, IA, II and III). Western Australia has a network of MPAs that covers 40% of its waters with almost 11% in no-take, Queensland 50% with 14% no-take, and South Australia 45% with 12.4% as no-take. With the proclamation of the Australian Marine Parks Network in 2012, 40% of Commonwealth waters are now covered by MPAs with 10% no-take. By comparison, Victoria has only 12% of its waters in its MPA network and just 5.3% as no-take.
Internationally, the UN’s Sustainable Development Goal 14, ‘Conserve and sustainably use the oceans, seas, and marine resources’ has set the bare minimum for high-level protection at 10% of marine habitats, double the Victorian percentage, while the long-term aspiration of the IUCN is for at least 30% in no-take.
There are 30 MPAs in Victoria’s coastal waters, comprising 24 highly protected or no-take marine national parks and sanctuaries, along with six marine parks, marine and coastal parks and one marine reserve that are partially protected. All Victorian no-take Marine National Parks (IUCN II) and Marine Sanctuaries (IUCN III) were declared at the same time in November 2002 after recommendations contained in the
NRSMPA’s key principles of comprehensiveness, adequacy and representativeness. Conducted for the VNPA’s 2014 Nature conservation review, in summary Edmunds et al. (2010) found for each marine bioregion:
Otway: the bioregion’s four marine protected areas were representative of consolidated and unconsolidated substrata but neither adequate nor comprehensive due to limited areas of intertidal, subtidal and deep reef in Discovery Bay MNP and subtidal reefs in Merri MS, and the absence of seagrass habitats in the parks.
Central Victoria: considered representative of consolidated and unconsolidated substrata, and comprehensive for four of five biounits (deep reefs and offshore sediments off Mornington Peninsula were largely missing, along with Western Port entrance seagrass and shallow reef habitats). The assessment of adequacy was mixed, with the entirety of some habitats included, such as in Point Addis MNP and Port Phillip Heads MNP, while others were missing, such as subtidal reefs in Marengo MS, and some patchy as at Eagle Rock MS.
Flinders: the four marine protected areas comprehensively covered the two Wilsons Promontory biounits but not the offshore biounit and were not considered representative. The level of protection afforded by the three multiple use areas, and thus their adequacy, was unclear.
Twofold Shelf: data limitations for the Ninety-mile Beach MNP prevented a full assessment across the region and one of the four biounits (isolated islands and deep shelf) was not included in a park. The other three MNPs were assessed as representative and adequate.
Environment Conservation Council’s 1999 marine investigation, while the other six MPAs (IUCN VI) followed recommendations of the Land Conservation Council’s 1982 South Gippsland investigation in 1986 and 1991.
In total, the state’s 30 MPAs cover 1061 km2 of Victorian coastal waters, the smallest area of any state or territory in Australia. Victoria also has the second-smallest area of no-take MPAs (after the Northern Territory (Table 5), and the second-smallest area of coastal waters (after NSW).
Table 6 lists Victoria’s 24 highly protected and six partially protected MPAs, along with their area and percentage coverage. The highly protected network covers 530 km2 or roughly 5.3% of coastal waters. When the terrestrial components of Shallow Inlet (20% terrestrial), Corner Inlet (10%) and Nooramunga (40%) marine and coastal parks are excluded, the six partially protected MPAs cover 530.8 km2 or roughly 5.3% of coastal waters. Together, the two MPA groups cover 10.6% of coastal waters.
The six partially protected MPAs in South Gippsland, lack goals, objectives, management plans and systematic monitoring. Although they are assigned IUCN VI, which qualifies them as MPAs under the lowest global benchmark, the Aichi Target 11 of 10%, they allow recreational and commercial fishing and it could be argued that they are parks in name only or ‘paper parks’.
When the 10.6% figure is further analysed, most are within the Victorian Embayments (Corner Inlet and Nooramunga marine and coastal parks) and Flinders (Wilsons Promontory marine national park, marine park and marine reserve) marine bioregions. The Otway, Central and Twofold Shelf marine bioregions have MPA coverage ranging from 4-6%, mostly no-take. They fail to meet the lowest international benchmark, Aichi Target 11.
A 2010 review of Victoria’s MPAs found that they did not meet the

Marine Protected Area Review | PAGE 18
Victorian Embayments: contains 10 marine protected areas and six biounits, two of which have no park coverage (King, which includes the Gippsland lakes, and Minor Inlets, which include Mallacoota Inlet). Not assessed as comprehensive, adequate nor representative due to the exclusion of some habitats, such as channels, seagrasses, sponge clump communities, brachiopods (lampshells or ‘living fossils’), Barrallier Island and Crawfish Rock, and some boundaries bisecting habitats rather than including them entirely, with continued use of the habitat outside the boundary exerting pressure on the portion inside the boundary.
Most recently, the biounits referred to above have been refined by Edmunds et al. (2018) and include 21 across state waters. Future reviews against the NRSMPA’s key principles should be based on these 21 biounits.
The Victorian Environment Assessment Council (VEAC) in 2017 concluded that the “existing system of no-take marine protected areas has some gaps in representation, and individual marine protected areas may not meet the adequacy criterion”. VEAC’s recommendation to the Victorian Government was for “Victoria’s marine environment be reviewed for the comprehensiveness, adequacy and representativeness of its marine protected areas when current work on marine habitat mapping and classification is completed and available.”
The government’s response claims to accept this recommendation, yet waters it down to merely a values assessment of the broader marine environment, and says it is not to include any recommendations for new area of marine protection.
“The government accepts this recommendation. The government acknowledges that information from this review will support better policy and planning decisions for the marine environment. This review could form part of a broader assessment of
values in the marine environment to assist in the development of any future spatial planning for the marine environment. The review will not include recommendations to expand Victoria’s marine protected area system. It is current government policy that no new
marine national parks will be created. VEAC will be requested to undertake this assessment.”
Furthermore, both the 2013 and 2018 Victorian State of the Environment reports highlighted the limited protection afforded by the current MPAs.
Park Name Total Area
(km2)No-take area
(km2, IUCN categories II-III)
Area low-level
protection
(km2, IUCN category VI)
Marine National parks and sanctuaries (no-take)
Barwon Bluff MS 0.16 0.16 0
Beware Reef MS 2.2 2.2 0
Bunurong MNP 20.5 20.5 0
Cape Howe MNP 40.5 40.5 0
Churchill Island MNP 6.7 6.7 0
Corner Inlet MNP 14.1 14.1 0
Discovery Bay MNP 28.3 28.3 0
Eagle Rock MS 0.2 0.2 0
French Island MNP 29.8 29.8 0
Jawbone MS 0.3 0.3 0
Marengo Reefs MS 0.1 0.1 0
Merri MS 0.3 0.3 0
Mushroom Reef MS 0.6 0.6 0
Ninety Mile Beach MNP 26.5 26.5 0
Pt Addis MNP 44.1 44.1 0
Pt Cooke MS 2.9 2.9 0
Pt Danger MS 0.2 0.2 0
Pt Hicks MNP 38 38 0
Port Phillip Heads 34.7 34.7 0
Ricketts Pt MS 1.2 1.2 0
The Arches MS 0.5 0.5 0
Twelve Apostles MNP 75.1 75.1 0
Wilsons Promontory MNP 155.9 155.9 0
Yaringa MNP 7.8 7.8 0
TOTAL 530.8 530.8 0
Marine parks, marine and coastal parks and marine reserve (partial protection)
Bunurong MP1 2.6 0 12.6
Corner Inlet M&CP 257.1* 0 257.1
Nooramunga M&CP 182.9** 0 183
Wilsons Promontory MP 55.6 0 55.6
Wilsons Promontory MR 6.3 0 6.3
Shallow Inlet M&CP 15.8*** 0 15.8
TOTAL 530.3 0 530.3
GRAND TOTAL 1,060.1 530.8 530.3
Table 6: Details of Victorian Marine Protected Areas
*/**/***Less terrestrial component (10% Corner Inlet; 20% Shallow Inlet; 40% Nooramunga (see VEAC marine investigation)

Marine Protected Area Review | PAGE 19
Apollo Bay
Portland
Anglesea
Melbourne
Wonthaggi
Seaspray
Lakes Entrance
Mallacoota
Geelong
SOUTHERN
OCEANBASS
STRAIT
TASMAN
SEAPort Campbell
Warrnambool
Cape Howe Marine National ParkWhere many species from warmer northern waters reach their southern limits
Wilsons Promontory Marine National ParkUnderwater caves and sponge gardens
Ninety Mile Beach Marine National ParkVast underwater plains rich in sea life
Beware Reef Marine SanctuaryTremendous biodiveristy of fish, corals species
Discovery Bay Marine National Park Whale nursery ground
Point Addis Marine National ParkHaunt of the mysterious Weedy Sea Dragon
Twelve Apostles Marine National ParkRugged cliffs and spectacular rock stacks
Corner Inlet Marine National ParksThe only extensive beds of Posidonia seagrass in Victoria
Merri Marine SanctuaryLittle Penguins roost and breed on the islands within
The Arches Marine SanctuarySpectacular underwater limestone formations
Marengo Reefs Marine SanctuaryTwo small reefs featuring seaweed gardens and sponge gardens
Eagle Rock Marine SanctuaryKelp forests with a variety of seastars, crabs and sea anemones
Point Danger Marine SanctuaryLimestone reef filled high diversity of weird and wonderful critters
Barwon Bluff Marine SanctuaryLava flow formed basalt reefs with bull kelp and schooling fish
Point Cooke Marine SanctuaryDiversity of sponges, sea-urchins, crustaceans, sharks and skates
Jawbone Marine SanctuaryThe largest occurrence of mangroves in Port Phillip Bay
Ricketts Point Marine SanctuaryRockpool and snorkelers wonderland
Mushroom Reef Marine SanctuaryDiverse intertidal rocky reef communities
Yaringa National ParkMangroves and mudflats important for migratory birds and juvenile fish
French Island Marine National ParkPart of Western Ports significant Ramsar-listed wetlands
Churchill Island Marine National ParkSignificant roosting and breeding sites for migratory birds
Point Hicks Marine National ParkSpectacular sub-tidal reef
Bunurong Marine National ParkExploration of intertidal platforms and rock pools
Port Phillip Heads Marine National ParkInternationally recognised dive and snorkel sites, made up of six separate marine areas
1
2
3
5
4
6
8
7
9
10
11
12
13
16
17
15
14
18
19
20
21
23
2224
24
12
3 4
5
67
89
10
1112
13
14 15
1617
18
19
20
21
22 23
MARINE NATIONAL PARKS
MARINE SANCTUARIES
Marine National Parks and Sanctuaries in Victoria
Composite image: Eastern Blue Groper,
photo by Sarah Speight; Baitfish at Rye Pier,
photo by David Bryant.

Marine Protected Area Review | PAGE 20
A major investigation into the performance of Victoria’s MPAs was conducted by the Victorian Environmental Assessment Council in 2014 (VEAC 2014). The report clarifies a number of key points regarding Victoria’s MPAs, including:
• Primary purpose of Victoria’s no-take MPAs is to maintain biodiversity and ecological processes for future generations. The areas were not designed to rehabilitate biodiversity or fish stocks
• There is no legal framework for the multiple use MPAs, hindering effective planning
• Marine pests and oil spills identified as the biggest threats to Victorian MPAs
• Many threats are externals to Victorian MPAs and require co-operation and action of multiple agencies and stakeholders
• The major habitats and ecosystems and natural values within Victorian MPAs have persisted
• A detailed evaluation of the ecological performance of Victorian MPAs cannot be undertaken due to lack of appropriate scientific data
• MPAs have not been completely effective in preventing new marine pests, however they have been successful in preventing oil spills and seabed development
As Edgar et al. pointed out, the level of protection is critical to the success of MPAs. Partial protection, which is the basis of the six MPAs in South Gippsland, is seen as having fewer conservation benefits than no-take protection (Denny and Babcock 2004; Shears et al. 2006; Lester and Halpern 2008; Franco et al. 2009; Sciberras et al. 2015). Sciberras et al. (2015) concluded that: “while [partially protected areas] PPAs significantly enhance density and biomass of fish relative to Open areas, [no-take reserves] NTRs yielded significantly higher biomass of fish within their boundaries relative to PPAs” …and… “MPAs with partial protection confer advantages, such as enhanced density and biomass of fish, compared to areas with no restrictions, although the strongest responses occurred for areas with total exclusion.”
VEAC observed in its 2014 marine investigation “that while there is some evidence of active management in the marine components of the multiple-use areas, these areas are managed in a manner that is indistinguishable from the management of natural values in the surrounding
marine environment”. The report recommended that management plans and research strategies be prepared, and goals and objectives be developed for the partially protected MPAs.
Marine v terrestrial protected areasAlthough it is Australia’s most cleared state, Victoria has a proud record in developing its conservation estate, dating back to 1892 when the first conservation reserve was created at Tower Hill (most of its native vegetation was gone, however), followed by lands set aside for national parks at Wilsons Promontory and Mount Buffalo in 1898. All told there are now 45 national parks covering 12.75% of the state, with another 4.5% in other conservation reserves. Because of its development history, only 37% of Victoria’s terrestrial lands remain in public hands, whereas 100% of its coastal waters are owned by the community. This provides a remarkable opportunity to extend the marine conservation estate, which has lagged well behind terrestrial conservation efforts – the first marine national park was not proclaimed until 110 years after Tower Hill’s reservation.
Wilsons Promontory National Park. One of the first National Parks in Victoria. Photo by Unsplash/Jonny Clow.

Marine Protected Area Review | PAGE 21
The debate around whether MPAs “work”
Fundamental to the question of whether MPAs work is the definition of “work”. Many examples exist globally of high-functioning MPAs that achieve their conservation objectives (Edgar et al. 2014, Lester et al. 2009), however there are also many examples of under-performing MPAs (Gill et al. 2017). Add to the mix the many MPAs that lack solid conservation objectives or fail to properly identify threats (Zupan et al. 2018), and it is easy to see how confusion and disagreement can be perpetuated.
Broadly speaking, an MPA works if it achieves its conservation objectives. These objectives will necessarily vary for each MPA and there is no one-size-fits-all MPA approach (Fox et al. 2012). Objectives are often vague or not well communicated (Gallacher et al. 2016), and in many cases unrealistic expectations have been placed on MPA performance. For example, overwhelmingly the most studied aspect of MPAs performance have been the secondary benefit of fisheries productivity. In many
states of Australia, including Victoria, fisheries benefits are not an explicit objective written into protected-area legislation or management plans because the prime objective of MPAs is biodiversity conservation. Yet the public debate has become “fisheries vs MPAs” and focused on this admittedly tangible and quantifiable potential benefit whether it be positive (e.g. Hough and Poole 2012) or negative (e.g. Sutton 2018). Most recently, however, commercial fishers supported the 2018 passing of management plans for the Commonwealth marine parks in the Australian parliament. (Media release 2018)
Most scientific studies aiming to answer the question of whether MPAs “work” investigate the effects of removing harvesting activities such as fishing. Such studies are based on comparisons of protected natural habitat to unprotected natural habitat. There are no studies, although perhaps sensibly so, that compare marine life in an MPA next to that in an adjacent recent harbour development, reclaimed land, seawall, or seabed mining operation. When placed in this context, well-enforced
MPAs that disallow these activities will almost always “work” in protecting biodiversity from these direct destructive threats, even if they are not no-take reserves. In the short-term these threats may be displaced to other areas, but the existence of MPAs long-term will ensure at least part of the marine environment remains as functioning natural habitats.
Achieving conservation benefits also takes time. If fish are expected to be larger in a no-take MPA, they must be given time to grow, or more fish are expected, they need time to breed. Given the relatively young age of many MPAs (e.g. only 5 years in South Australia), consistent and persuasive benefits cannot be observed. An MPA age of at least 10 years is cited by Edgar et al. (2014) as being one of the five critical criteria for an MPA to be effective in meeting conservation goals associated with fish size and biomass. The remaining four criteria – being no-take, well enforced, large (<100km2) and isolated – are all crucial factors in determining whether a MPA “works” in maintaining or rebuilding biodiversity after a history of exploitation.
Twelve Apostles Marine National Park. Photo by Unsplash/Saiteja Garimella.

Marine Protected Area Review | PAGE 22
Reasons for MPAs not achieving their objectives
The reasons why MPAs might not achieve their objectives are specific to each individual MPA, but there are a few common causes – small area of the park, ineffective regulation (i.e. rules don’t prevent impacts), inadequate enforcement and lack of habitat continuity (Edgar et al. 2014). It therefore become a little more understandable that less than 10% of MPAs globally are considered successful (Edgar et al. 2014).
Some reasons that MPAs fail:• Inadequate staffing and resources
(strongest predictor of conservation impact was staff and budget – Gill et al. 2017)
• Lack of political will for enforcement or effective management (Chuenpadgee et al. 2013, Araujo and Bernard 2016)
• Lack of user engagement and support (Castrejon and Charles 2013, Bennet and Dearnden 2014)
• Non-compliance with regulations (Fish in Italian MPAs – Pieraccini et al. 2017, Lobsters in the Galapagos – Buglass et al. 2018)
• Inability to curb external threats (Stafford et al. 2016)
• Small and isolated (Moffitt et al. 2011)
• Residual (Devillers et al. 2014)
Developing MPAs that “work”Several important studies in the past five years have identified what criteria are necessary for an MPA to adequately conserve the marine environment (Ballantine 2014, Costello 2014, Green et al. 2014, Edgar et al. 2014, Rossiter and Levine 2014, Gill et al. 2017). These criteria cover both the planning and regulation aspects, social, political and management aspects, along with the biological and ecological aspects. These studies are synthesized in Table 7. Further, the three key principles of the NRSMPA, comprehensiveness, adequacy and representativeness, should also be met.
To be truly effective in conserving the marine environment on a regional and continental level, MPAs should be used alongside other forms of ecosystem-based management (Halpern et al. 2010b). As marine spatial management becomes more widely adopted around the world, MPAs need to be a fundamental
part of this process from the outset (Gaines et al. 2010). A holistic framework for managing resource use and cumulative threats, where MPAs are a key conservation pillar, will be the most effective approach to conserving marine environments on a local, regional and global scale.
Table 7: Key factors in determining the conservation success of an MPA
Australiasian Gannet (Morus serrator) pair, Popes Eye, Victoria. Photo by Parks Victoria.
Fur Seal. Wilson’s Promontory Marine National Park. Photo by Shannon Hurley.
Key factors in MPA success Key supporting studies
Biological and ecological aspects
Old (>10yrs) Large (>100km2) No-take Isolated Self-sustaining
Edgar et al. (2014)Edgar et al. (2014)Edgar et al. (2014)Edgar et al. (2014)Ballantine (2014)
Social, political and management aspects
Planning and regulation aspects
Politically supported Rossiter and Levine (2014)
Community supported Bennet and Dearnden (2014)
Properly legislated Chuenpadgee et al. (2013)
Properly staffed and funded Gill et al. (2017)
Proper enforcement Pieraccini et al. 2017
Placed in a regional network of MPAs Gaines et al. (2010)
External threats addressed Stafford et al. (2016)
Integrated into wider marine spatial planning Agardy et al. (2011)
Representation of habitats Ballantine (2014)
Replication of habitats Ballantine (2014)

Marine Protected Area Review | PAGE 23
REFERENCES
Bacaram SJ, Hearn A, Trujillo AM, Rentaria W, Bustamante RH, Moran G, Reck G and Gracia JL (2018). Assessing fishing effect inside and outside an MPA: The impact of the Galapagos MPA on the industrial pelagic tuna fisheries during the first decade of operation. Marine Policy 87: 212-225.
Ban NC, Davies TE, Aguilera SE, Brooks C, Cox M, Epstein G, Evans LS, Maxwell SM and Nenadovic M (2017). Social and ecological effectiveness of large marine protected areas. Global Environmental Change 43: 82-91.
Barr L, Pressey R, Fuller R, Segan D and McDonald-Madden E (2011) ‘A new way to measure the world’s protected area coverage. PLoS ONE 6(9): e24707. doi:10.1371/journal.pone.0024707.
Baskett ML, Gaines SD and Nisbet RM (2009). Symbiont diversity may help coral reefs survive moderate climate change. Ecological Applications 19(1): 3-17.
Bennett NJ and Dearnden P (2014). Why local people do not support conservation: Community perception of MPA livelihood impacts, governance and management in Thailand. Marine Policy 44: 107-116.
Breen P, Posen P and Righton D (2015). Temperate marine protected areas and mobile fish: a review. Ocean and Coastal Management 105: 75-83.
Buglass S, Reyes H, Ramirez-Gonzalez J, Eddy TD, Salinas-de-Leon P and Jarrin JM (2018). Evaluating the effectiveness of coastal no-take zones of the Galapagos Marine reserve for the red spiny lobster. Marine Policy 88: 201-212.
Burfeind D, Pitt K, Conolly R and Byers JE (2013). Performance of non-native species within marine reserves. Biological invasions 15(1): 17-28.
Burke LM, Reytar K, Spalding M. & Perry A (2012). A. Reefs at Risk Revisited in the Coral Triangle. World Resources Institute, 2012.
Butchart SHM, Clarke M, Smith B, Sykes R, Scharlemann JPW et al. (2015). Shortfalls and solutions for meeting national and global conservation area targets. Science 238, 1164-1168.
Buxton CD, Hartmann K, Kearney R and Gardner C (2014). When is spillover from marine reserves likely to benefit fisheries? PLos One 9(9).
Castrejon M and Charles A (2013). Improving fisheries co-management through ecosystem-based spatial management: the Galapagos Marine Reserve. Marine Policy 38: 235-245.
Christianen MJA, Herman PML, Bouma TJ, Lamers LPM, van Katwijk MM, van der Heide T, Mumby PJ, Silliman BR, Engelhard SL, van de Kerk M, Kiswara W and van de Koppel J (2014). Habitat collapse due to overgrazing threatens turtle conservation in MPAS. Proceeding of the Royal Society B 281.
Chung FC, Komilus CF and Mustafa S (2017). Effect of the creation of a MPA on populations of coral trout in the coral triangle region. Regional studies in marine science 10: 1-9.
Chuenpadgee R, Pascual-Fernandez JJ, Szelianszy E, Alegret JL, Fraga J and Jentoft S (2013). Marine protected areas: re-thinking their inception. Marine Policy 39: 234-240.
Cole VJ, McQuaid CD and Nakin MDV (2011). MPAs export larvae of infauna, but not of bioengineering mussels to adjacent areas. Biological Conservation 144: 2088-2096.
Colleter M, Gascuel D, Albouy C, Francour P, de Morais LT, Valls A and Loch FL (2014). Fishing inside or outside? A case study analysis of potential spillover effect from MPAs using food web models. Journal of Marine Systems 139: 383-395.
Convention on Biological Diversity, ‘Quick guide to the Aichi Biodiversity Targets, <https://www.cbd.int/doc/strategic-plan/targets/T11-quick-guide-en.pdf>.
Costello MJ (2014). Long live marine reserves: A review of experiences and benefits. Biological Conservation 176: 289-296.
Costello MJ and Ballantine B (2015). Biodiversity conservation should focus on no-take marine reserves. Trends in Ecology and Evolution 30(9) 507- 509.
Cuervo-Sanchez R, Maldonado JH and Rueda M (2018). Spillover from marine protected areas on the pacific coast in Colombia: A bioeconomic modelling approach for shrimp fisheries. Marine Policy 88: 182-188.
Curley BG, Glasby TM, Curley AJ, Creese RG and Kingsford MJ (2013). Enhanced numbers of two temperate reef fishes in a small, partial-take MPA related to spearfisher exclusion. Biological Conservation 167: 445-445.
Day J., Dudley N., Hockings M., Holmes G., Laffoley D., Stolton S. & S. Wells, (2012). Guidelines for applying the IUCN Protected Area Management Categories to Marine Protected Areas. Gland, Switzerland: IUCN.
Denkinger J, Parra M, Munoz JP, Carrasco C, Murillo JC, Espinosa E, Rubianes F and Kock V (2013). Are boat strikes a threat to sea turtles in the Galapagos Marine Reserve? Ocean and Coastal Management 80” 29-35.
Denny, C M, and R C Babcock. (2004.) “Do Partial Marine Reserves Protect Reef Fish Assemblages?” Biological Conservation 116: 119–29. doi:10.1016/S0006-3207(03)00183-6.
Devillers R et al. 2014, ‘Reinventing residual reserves in the sea: are we favouring ease of establishment over need for protection?’, Aquatic Conservation, vol. 25, pp
Addison PFE, de Bie K and Rumpff L (2015). Setting conservation management thresholds using a novel participatory modelling approach. Conservation Biology 29(5): 1411-1422.
Afonso P, Fontes J and Santos RS (2011). Small marine reserves can offer long term protection to an endangered fish. Biological Conservation 144: 2739-2744.
Afonso P, Schmiing M, Fontes J, Tempera F, Morato T and Santos RS (2018). Effects of marine protected areas on coastal fishes across the Azores archipelago, mid-north Atlantic. Journal of Sea Research 138: 34-47.
Agardy T, di Sciara GN and Christie P (2011). Mind the gap: addressing the shortcomings of MPAs through large scale marine planning. Marine Policy 35(2) 226-232.
Agardy T, Claudet J and Day JC (2016). ‘Dangerous targets’ revisited: Old dangers in new contexts plague MPAs. Aquatic Conservation: Marine and Freshwater Ecosystems 26 (2): 7-23.
Almany GR, Conolly, SR, Heath DD, Hogan JD, Jones GP, McCook LJ, Mills M, Pressey RL and Williamson DH (2009). Connectivity, biodiversity conservation and the design of marine reserves. Coral Reefs 28: 339-351.
Araujo JL and Bernard E (2016). Management effectiveness of a large marine protected area in north-eastern Brazil. Ocean and Coastal Management 130: 43-49.
Ashe E, Noren DP and Williams R (2009). Animal behaviour and marine protected areas: incorporating behavioural data. Animal Conservation13: 196-203.
Ault JS, Smith SG, Bohnsack JA, Luo J, Zurcher N, McClellan DB, Ziegler TA, Hallac DE, Patterson M, Feeley MW, Ruttenberg BI, Hunt J, Kimball D and Causey B (2013). Assessing coral reef fish population and community changes in response to marine reserves in the Dry Tortugas, Florida USA. Fisheries Research 144: 28-37.
Australian Government Department of the Environment and Energy (2018). Australian Marine Parks. Spatial GIS data – shapefiles and layers. File identifier: ecedecba-1a39-4933-868f-a96bb3cf4eed. Accessed online 3rd September 2018 <http://www.environment.gov.au/fed/catalog/search/resource/details.page?uuid=%7BCD8877F3-8C39-4A20-A53F-070FBEE5AF3C%7D>
Australian Government Department of the Environment and Energy (2017). Marine CAPAD 2016 Datasets. Accessed online 3rd September 2018 <http://www.environment.gov.au/land/nrs/science/capad/2016>

Marine Protected Area Review | PAGE 24
Diaz D, Mallol S, Parma A and Goni R (2016). A 25-year marine reserve as proxy for the unfished condition of an exploited species. Biological Conservation 203: 97-107.
Dudley N (2008). Guidelines for Applying Protected Area Management Categories. IUCN, Gland, Switzerland.
Edgar, G et al. (2014). Global conservation outcomes depend on marine protected areas with five key features’, Nature 506: 216-220.
Edmund M et al 2010, ‘VNPA Nature conservation review: marine conservation priorities for Victoria’, Australian Marine Ecology Report 405, Melbourne.
Edmunds M and Flynn A (2018). Victorian
Marine Biogeographical Settings. Report to Department of Environment, Land, Water and Planning. Australian Marine Ecology Report No. 559, Melbourne.
Felix-Hackradt FC, Hackradt CW, Trevino-Oton J, Perez-Ruzafa A and Garcia-Charton JA (2018). Effect of marine protected areas on distinct fish life-history stages. Marine Environmental Research. In press.
Fenberg PB, Caselle JE, Claudet J, Clemence M, Gaines SD, Garcia-Charton JA, Goncalves EL, Grorud-Colvert K, Guidetti P, Jenkins SR, Jones PJS, Lester Sem McAllen R, Moland E, Planes S and Sorensen TK (2012). The science of European marine reserves: Status, efficacy and future needs. Marine Policy 36: 1012-1021.
Filby NE, Stockin KA and Scarpaci C (2017). Can MPAs be developed effectively without baseline data? A case study for Burrunan dolphins. Marine 77: 152-163.
Fox HE, Mascia MB, Basurto X, Costa A, Glew L, Heinemann D, Karrer LB, Lester SE, Lombana AV, Pomeroy RS, Recchia CA, Roberts CM, Sanchiro JN, Pet-Soede L and White AT (2012). Re-examining the science of marine protected areas: linking knowledge to action. Conservation Letters 5: 1-10.
Franco, Antonio Di, Simona Bussotti, and Augusto Navone. 2009. “Evaluating Effects of Total and Partial Restrictions to Fishing on Mediterranean Rocky-Reef Fish Assemblages.” Marine Ecology Progress Series 387: 275–85. doi:10.3354/meps08051.
French R (2018). Sea urchin harvest a win-win for seafood industry and seagrass habitat as fishers deal with spike. ABC News Online < http://www.abc.net.au/news/2018-05-23/sea-urchin-harvesting-a-win-for-industry-and-biodiversity/9790694>. Accessed 16th Sept 2018.
Gaines SD, Lester SE, Grorud-Colvert K, Costello C and Pollnac R (2010). Evolving science of marine reserves: New developments and emerging research frontiers. Proceedings of National Academy of Science 107(43): 18251-18255.
Gallacher J, Simmonds N, Fellowes H, Brown N, Clark W, Biggs C and Rodwell LD (2016). Evaluating the success of a marine protected area: a systematic review approach. Journal of Environmental Management 183: 280-293.
Geosciences Australia (2018). Oceans and Seas – Australian Exclusive Economic Zone (online). http://www.ga.gov.au/scientific-topics/national-location-information/dimensions/oceans-and-seas Accessed 3rd September 2018.
Giglio VJ, Pinheiro HT, Bender MG, Bonaldo RM, Costa-Lotufo LV, Ferreira CEL, Floeter SR, Freire A and 19 others (2018). Large and remote marine protected areas in the Southern Atlantic Ocean are flawed and raise concerns. Marine Policy 96 13-17.
Gilby BL and Stevens T (2014). Meta-analysis indicates habitat-specific alterations to primary producer and herbivore communities in MPAs. Global Ecology and Conservation 2: 289-299.
Gomez C, Lawson J, Kouwenberg a, Moors-Murphy H, Buren A, Fuentes-Yaco C, Marotte E, Wiersma YF and Wimmer T (2017). Predicted distribution of whales at risk: identifying priority areas to enhance cetacean monitoring in the Northwest Atlantic Ocean. Endangered Species Research 32: 437-458.
Graham NAJ and McClanahan TR (2013). The last call for marine wilderness? Bioscience 63, 397-402.
Green AL, Fernandez L, Almany G, Abesamis R, Mcleod E, Alino PM, Whote AT, Salm R, Tanzer J and Pressey R (2014). Designing marine reserves for fisheries management, biodiversity conservation and climate change adaptation. Coastal Management 42(2): 143-159.
Halpern BS, Lester SE and McLeod KL (2010a). Placing marine protected areas onto the ecosystem-based management seascape. Proceedings of the National Academy of Science.
Halpern BS, Lester SE and McLeod KL (2010b). Spillover benefit from marine reserves and the replenishment of fish stocks. Environmental Conservation 36 (4): 268-276.
Harasti D, David TR, Mitchell E, Lindfield S and Smith SDA (2018). A tale of two islands: Decadal change in rocky reef fish assemblages following implementation of no-take MPAs in NSW Australia. Regional Studies in Marine Science 18: 229-236.
Harrison HB, Williamson DH, Evans RD, Almany GR, Thorrold SR, Russ GR, Feldheim KA, van Herwerden L, Planes S, Srinivasan M, Berumen ML and Jones GP (2012). Larval export from Marine reserves and the recruitment benefit for fish and fisheries. Current Biology 22: 1023-1028.
Hays GC, Ferriera LC, Sequira AMM, Meekan MG, Duarte CM, Bailey H, Bailleul F, Bowen WD, Caley MJ, Costa, DP, Eguiluz VM, Fossette S, Friedlander AS, Gales N, Gleiss AC and 26 others (2016). Trends in Ecology and Evolution 31 (6): 463-475.
Hopkins CR, Bailey DM and Potts T (2016). Perceptions of practitioners: Managing marine protected areas for climate change resilience. Ocean and Coastal Management 128: 18-28.
Horta BH, Claudet J, Franco G, Erzini K, Caro A and Goncalves EJ (2016). A regulation-based classification system for marine protected areas. Marine Policy 72: 192-198.
Hough C and Poole L (2012). Think tank says marine parks will help fishermen as well as the environment. ABC News 27th June 2012. Accessed 11th September 2018. <http://www.abc.net.au/news/rural/2012-06-27/think-tank-says-marine-parks-will-help-fishermen/6111068>
Howarth LM, Pickup SE, Evans LE, Cross TJ, Hawkins JP, Roberts CM and Stewart BD (2015). Sessile and mobile components of a benthic ecosystem display mixed trends within a temperate marine reserve. Marine Environmental Research 107: 8-23.
Jones PJS and De Santo EM (2016). Is the race for remote, very large marine protected areas taking us down the wrong track? 73: 231-234.
Karnauskas M and Babcock EA (2014). An analysis of indicators for the detection of effects of marine reserve protection on fish communities. Ecological Indicators 46: 454-465.
Kearney R, Buxton CD and Farebrother G (2012). Australia’s no-take MPAs: Appropriate conservation or inappropriate management of fishing? Marine Policy 36: 1064-1071.
Keller BD, Gleason DF, McLeaod E, Woodley CM, Airame S, Causey BD, Friedlander AM, Grober-Dunsmore R, Johnson JE, Miller SL and Steneck RS (2009). Climate change, coral reef ecosystems and management options for protected areas. Environmental Management 44: 1069-1088.
Lascelles BG, Langham GM, Ronconi RA and Reid JB (2012). From hotspots to site protection identifying MPAs for seabirds around the globe. Biological Conservation 156: 5014.
Lester SE, Halpern BS, Grorud-Colvert K, Lubchenco J, Ruttenberg BI, Gaines S, Airame S and Warner RR (2009). Biological effects within no-take marine reserves: a global synthesis. Marine Ecology Progress Series 384: 33-46.
Lester, S., and B. Halpern. (2008.) “Biological Responses in Marine No-Take Reserves versus Partially Protected Areas.” Marine Ecology Progress Series 367 (September): 49–56. doi:10.3354/meps07599.
Ling SD, Johnson CR, Frusher SD and Ridgway KR (2009). Overfishing reduces resilience of kelp beds to climate-driven catastrophic phase shift. Proceedings of National Academy of Science
Ling SD and Johnson CR (2012). Marine reserves reduce risk of climate-driven phase shift by reinstating size and habitat specific trophic interactions. Ecological Application 22(4): 1232-1245.

Marine Protected Area Review | PAGE 25
Mach ME, Wedding LM, Reiter SM, Micheli F, Fujita RM and Martone RG (2017). Assessment and management of cumulative impacts in California’s network of marine protected areas. Ocean and Coastal Management 137: 1-11.
Malcolm HA, Williams J, Schultz AL, Neilson J, Johnstone N, Knott NA, Harasti D, Coleman MA and Jordan A (2018). Targeted fishes are larger and more abundant in ‘no-take’ areas in a subtropical marine park. Estuarine, Coastal and Shelf Science 212: 118-127.
Marra S, Coppa S, Camedda A, Massaro G and Andrea de Lucia S (2017). The exploitation of limpets in a Mediterranean MPA: assessing the effectiveness of protection in the intertidal zone. Mediterranean Marine Science 18(3) 406-423.
Marine Conservation Institute (2018), MPAtlas [On-line]. Seattle, WA. Available at: <www.mpatlas.org> [Accessed 30/08/2018].
Marinesque S, Kaplan DM and Rodwell LD (2012). Global implementation of marine protected areas: is the developing world being left behind? Marine Policy 36: 727-737.
McCrea-Strub A, Zeller D, Sumaila UR, Nelson J, Balmford A and Pauly D (2011). Understanding the cost of establishing MPAs. Marine Policy 35: 1-9.
Media release 2018, ‘Australian fishers unite to support Commonwealth Marine Park management plans’, https://seafoodindustryaustralia.com.au/2018/08/02/australian-fishers-unite-to-support-commonwealth-marine-park-management-plans/
Micheli F, Saenz-Arroyo A, Greenley A, Vazquez L, Montes JAE, Rossetto M and De Leo GA (2012). Evidence that marine reserves enhance resilience to climatic impacts. PLOS One 7(7).
Moffitt EA, White JW and Botsford LW (2011). The utility and limitations of size and spacing guidelines for designing marine protected area networks. Biological Conservation 144: 306-318.
Moity N (2018). Evaluation of No-take zones in the Galapagos Marine Reserve, zoning plan 2000. Frontiers in Marine Science 5 Article 244.
Muallil RN, Deocadez MR, Martinez RJS, Mamauag SS, Nanola CL and Alino PM (2015). Community assemblages of commercially important coral reef fishes inside and outside MPAs in the Philippines. Regional Studies in Marine Science 1: 47-54
Mumby PJ, Harbone AR and Brumbaugh DR (2011). Grouper as a natural biocontrol of invasive lionfish. PLos One 6(6).
Murray CC, Pakhomov EA and Therriault TW (2011). Recreational boating: a large
unregulated vector transporting marine invasive species. Diversity and Distributions 2011:1-12
O’Leary, B, Winther-Janson M, Bainbridge, J, Aitken J, Hawkins J and Roberts C 2016, ‘Effective coverage targets for ocean protection’, Conservation Letters, doi.org/10.1111/conl.12247, p398.
Palumbi SR, Barshis DJ, Traylor-Knowles N and Bay R (2014). Mechanisms of reef coral resistance to future climate change. Science 344 (6186): 895-989.
Pendoley KL, Scholfield G, Whittock PA, Ierodiaconou D and Hays GC (2014). Protected Species use of a coastal marine migratory corridor: connecting MPAs. Marine Biology 161(6): 1455-1466.
Pieraccini M, Coppa S and De Lucia GA (2017). Beyond marine parks? Regulation theory to assess and address environmental non-compliance. Aquatic Conservation 27 (1) 177-196.
Pilyugin SS, Mellock J and De Leenheer P (2016). The effectiveness of marine protected areas for predator and prey with marrying mobility. Theoretical Population Biology 110: 63-77.
Rife AN, Aburto-Oropeza O, Hastings PA, Erisman B, Ballantyne F, Wielgus J, Sala E and Gerber L(2013). Long-tern effectiveness of a multi-use MPA on reef fish assemblages and fisheries landings
Roberts KE, Valkan RS and Cook CN (2018). Measuring progress in marine protection: A new set of metrics to evaluate the strength of marine protected area networks. Biological Conservation 219: 20-27.
Rossiter JS and Levine A (2014). What makes a “successful” marine protected area? The unique context of Hawaii’s fish replenishment areas. Marine Policy 44: 196-203.
Sciberras, Marija, Stuart R Jenkins, Rebecca Mant, Michel J Kaiser, Stephen J Hawkins, and Andrew S Pullin. (2015.) “Evaluating the Relative Conservation Value of Fully and Partially Protected Marine Areas,” 58–77. doi:10.1111/faf.12044.
Shears, N, R Grace, N Usmar, V Kerr, and R Babcock. 2006. “Long-Term Trends in Lobster Populations in a Partially Protected vs. No-Take Marine Park.” Biological Conservation 132 (October): 222–31. doi:10.1016/j.biocon.”2006.04.001.
Singleton RL and Roberts CM (2014). The contribution of very large MPAs to marine conservation: Giant leaps or smoke and mirrors? Marine Pollution Bulletin 87: 7-10.
Spalding MD and Hale LZ (2016). Marine protected areas: past, present and future – a global perspective. In: Big Bold and Blue; Lessons learned from Australia’s Marine Protected Areas. Eds: Fitzsimmons J and Westcott G. CSIRO Publishing, Australia.
Speed CW, Cappo M and Meekan MG (2018). Evidence for rapid recovery of shark populations within a coral reef marine protected area. Biological Conservation 220: 308-319.
Stafford R, Clitherow TJ, Howlett S, Spiers EKA, Williams RL, Yselga B, Valarezo AZ, Izurieta DFV and Cornejo M (2016). An integrated evaluation of potential management processes on marine reserves in continental Ecuador based on Bayesian belief network model. Ocean and Coastal Management 121: 60-69.
Sutton M (2018). Marine Park controversy continues following five-year review in South Australia. ABC News. 23rd January 2018. Accessed 11th September 2018. <http://www.abc.net.au/news/2018-01-23/sa-marine-parks-fish-stocks-five-year-review/9352074>
Thompson PM, Brookes KL, Graham IM, Barton TR, Needham K, Bradbury G and Merchant ND (2013). Short-term disturbance by a commercial two-dimensional seismic survey does not lead to long-term displacement of harbour porpoises. Proceedings of the Royal Society B 280.
Travaille KL, Salinas P, Bell JJ (2015). Indication of visitor trampling impacts on intertidal seagrass beds in a NZ marine reserve. Ocean and Coastal Management 114: 145-150.
UNEP-WCMC and IUCN (2018) Protected Planet: [Marine Protected Area Database; The World Database on Protected Areas (WDPA)/The Global Database on Protected Areas Management Effectiveness (GD-PAME)] [On-line], [August 2018], Cambridge, UK: UNEP-WCMC and IUCN. Available at: www.protectedplanet.net.
Velando A and Munilla I (2011). Disturbance to a foraging seabird by sea-based tourism: Implications for reserve management in MPAs. Biological Conservation 144: 1167-1174.
Victorian Environmental Assessment Council (2014). Marine Investigation Final Report. April 2014. State of Victoria.
Victorian Environment Assessment Council 2017, ‘Statewide assessment of public land’, Victorian Environment Assessment Council, Melbourne, p.21.
Williams R, Erbe C, Ashe E and Clark CW (2015). Quiet(er) marine protected areas. Marine Pollution Bulletin 100: 154-161.
World Bank (2018). DataBank – Marine Protected Areas (% of territorial waters). Accessed online 30th September 2018. https://data.worldbank.org/indicator/ER.MRN.PTMR.ZS
World Parks Congress (2014). Priorities emerging from the IUCN World Parks Congress 2014. Accessed online 10 September 2018. https://www.worldparkscongress.org/wpc/

Victorian National Parks AssociationLevel 3, 60 Leicester St, Carlton VIC 3053
PH: 03 9341 6500 | EMAIL: [email protected] | WEB: vnpa.org.auAll donations over $2 are tax-deductible. ABN 34 217 717 593