Embed Size (px)
Citation preview

Work Package 2: Standards and best practice
D2.14 Wave data presentation and storage review
Author(s):
Davide Magagna, Daniel Conley Barbara Proenca, Deborah Greaves
PU
Lucia Margheritini AAU
Matthew Finn, John Lawrence EMEC
Jose Ramon Lopez, Yago Torres Enciso
EVE
Brian Holmes UCC-HMRC
Maike Paul LUH
Hannes MacNulty SEAI-OEDU
Helen Smith, Ian Ashton UNEXE
Miguel Lopes, Jose Candido WAVEC
Tom Davey, Ian Bryden UEDIN
Marine Renewables Infrastructure Network
Revision: 03 Date: 03-Sep-2012

D2.14 Wave data presentation and storage review
Rev. 03, 03-Sep-2012 Page 2 of 42
ABOUT MARINET MARINET (Marine Renewables Infrastructure Network for Emerging Energy Technologies) is an EC-funded consortium of 29 partners bringing together a network of 42 specialist marine renewable energy testing facilities. MARINET offers periods of free access to these facilities at no cost to research groups and companies. The network also conducts coordinated research to improve testing capabilities, implements common testing standards and provides training and networking opportunities in order to enhance expertise in the industry. The aim of the MARINET initiative is to accelerate the development of marine renewable energy technology.
Companies and research groups who are interested in availing of access to test facilities free of charge can avail of a range of infrastructures to test devices at any scale in areas such as wave energy, tidal energy and offshore-wind energy or to conduct specific tests on cross-cutting areas such as power take-off systems, grid integration, moorings and environmental data. In total, over 700 weeks of access is available to an estimated 300 projects and 800 external users.
MARINET is consists of five main areas of focus or ‘Work Packages’: Management & Administration, Standardisation & Best Practice, Transnational Access & Networking, Research and Training & Dissemination. The initiative runs for four years until 2015.
Partners
Ireland University College Cork, HMRC (UCC_HMRC)
Coordinator
Sustainable Energy Authority of Ireland (SEAI_OEDU)
Denmark Aalborg Universitet (AAU)
Danmarks Tekniske Universitet (RISOE)
France Ecole Centrale de Nantes (ECN)
Institut Français de Recherche Pour l'Exploitation de la Mer (IFREMER)
United Kingdom National Renewable Energy Centre Ltd. (NAREC)
The University of Exeter (UNEXE)
European Marine Energy Centre Ltd. (EMEC)
University of Strathclyde (UNI_STRATH)
The University of Edinburgh (UEDIN)
Queen’s University Belfast (QUB)
Plymouth University(PU)
Spain Ente Vasco de la Energía (EVE)
Tecnalia Research & Innovation Foundation (TECNALIA)
Belgium 1-Tech (1_TECH)
Netherlands Stichting Tidal Testing Centre (TTC)
Stichting Energieonderzoek Centrum Nederland (ECNeth)
Germany Fraunhofer-Gesellschaft Zur Foerderung Der Angewandten Forschung E.V (Fh_IWES)
Gottfried Wilhelm Leibniz Universität Hannover (LUH)
Universitaet Stuttgart (USTUTT)
Portugal Wave Energy Centre – Centro de Energia das Ondas (WavEC)
Italy Università degli Studi di Firenze (UNIFI-CRIACIV)
Università degli Studi di Firenze (UNIFI-PIN)
Università degli Studi della Tuscia (UNI_TUS)
Consiglio Nazionale delle Ricerche (CNR-INSEAN)
Brazil Instituto de Pesquisas Tecnológicas do Estado de São Paulo S.A. (IPT)
Norway Sintef Energi AS (SINTEF)
Norges Teknisk-Naturvitenskapelige Universitet (NTNU)
Acknowledgements
The research leading to these results has received funding from the European Union Seventh Framework Programme (FP7) under grant agreement no. 262552.
Legal Disclaimer The views expressed, and responsibility for the content of this publication, lie solely with the authors. The European Commission is not liable for any use that may be made of the information contained herein.

D2.14 Wave data presentation and storage review
Rev. 03, 03-Sep-2012 Page 0 of 42
REVISION HISTORY
Rev. Date Description Author Checked by
01 31/07/2012 Information collated DM
02 02/08/2012 DM DCC
03 28/08/2012 Review after partners’ comments DM Deborah Greaves
04 31/10/2012 Final Cameron Johnstone
D2.14 Wave data presentation and storage review
Rev. 03, 03-Sep-2012 Page 1 of 42
EXECUTIVE SUMMARY The research and testing for wave energy devices generates large amounts of experimental data. Recording, processing, presenting and archiving methods vary among the different MaRINET facilities; due to different instrumentation, user requirements and experimental set-up. This document provides a review of the methodologies for wave data storage and presentation techniques at the different facilities allowing the generation of common protocol or the benchmarking of results and presented in a concise format to facilitate comparison of results in a harmonised way. The document identifies, through the use of a questionnaire, storage requirements for wave data collected at eleven MaRINET facilities, both at laboratory and field scale, and reports the most common ways to represent wave data. Discrepancies in data storage amongst the different facilities were noted when the data was collected in proprietary format. A wider agreement among the facilities was found in the ways wave data are represented. In both cases stronger agreement could be reached by following suggested guidelines, existing standards and creating wave data standards for the wave energy industry.

D2.14 Wave data presentation and storage review
Rev. 03, 03-Sep-2012 Page 2 of 42
CONTENTS
1 INTRODUCTION .............................................................................................................................................3
1.1 SCOPE OF THIS DOCUMENT ..................................................................................................................................... 3
2 WAVE DATA STANDARDS ...............................................................................................................................4
3 DATA STORAGE INFORMATION ......................................................................................................................7
3.1 LABORATORY CONDITIONS ..................................................................................................................................... 7 3.2 FIELD CONDITIONS STORAGE INFORMATION ........................................................................................................... 10
4 WAVE DATA REPRESENTATION .................................................................................................................... 13
4.1 LABORATORY CONDITIONS ................................................................................................................................... 16 4.2 FIELD CONDITIONS .............................................................................................................................................. 23
5 CONCLUSIONS AND RECOMMENDATIONS .................................................................................................... 37
6 REFERENCES ................................................................................................................................................ 38
7 APPENDICES ................................................................................................................................................ 39

D2.14 Wave data presentation and storage review
Rev. 03, 03-Sep-2012 Page 3 of 42
1 INTRODUCTION Large datasets are generated while monitoring wave conditions under both laboratory and field conditions. The manner in which this data is processed, presented and stored varies amongst the different MaRINET facilities due to differing methodologies, instrumentation and user requirements. Typically, primary wave buoy data are provided in proprietary format. Subsequently the data given to the final users of the facilities contains standard information such as spectral moments, energy period mean direction etc, which may be prepared in a variety of ways. A review of the methodologies for wave data storage in place at the different MaRINET facilities is presented in this document. This allows for the identification of storage requirements and representation techniques in order to facilitate the generation of common protocols.
1.1 SCOPE OF THIS DOCUMENT The purpose of this document is to review the methodology for storing and presenting wave data at the different MaRINET facilities, in order to allow for normalisation of datasets and to facilitate the cross-comparison of results. A review of wave data presentation format standards is presented in Section 2, data storage information for the different MaRINET facilities is given in Section 3 and Section 4 discusses data presentation. This document considers the following aspects of wave data storage and presentation:
Data storage at laboratory facilities and test centres, including storage requirement and data availability
Wave data representation, including common nomenclature used and graphs developed
This document does not consider:
Experimental setup and methodology employed to gather the wave data
Information on the type of analysis carried out on the wave data to derive graphical representation of wave data.

D2.14 Wave data presentation and storage review
Rev. 03, 03-Sep-2012 Page 4 of 42
2 WAVE DATA STANDARDS Over the past 50 years, measurements of wind generated waves have been collected and used for a variety of coastal applications from coastal protection to shipping (Jensen, Swail, Lee, & Reilly, 2010). In recent years the number of applications for which ocean waves are monitored and the number of sites being monitored has increased. This increase has prompted researchers to look into the creation of standards for the acquisition and presentation of oceanographic data, through the organization of multidisciplinary workshops and organizations, such as:
The Intergovernmental Oceanographic Commission (IOC) established by UNESCO
The Joint WMO-IMO Technical Commission for Oceanographic Marine Methodology (JCOMM,
www.jcomm.info): established for the collaboration of worldwide marine meteorological and oceanographic
communities in order to respond to interdisciplinary requirements for met/ocean observations, data
management and service products. The Alliance for Coastal Technologies (ACT, www.act-us.info), which comprises research institutions,
resource managers, and private sector companies to aid the development and adoption of effective ocean sensors and platforms.
The Ocean Data Standards Pilot Project (ODS, http://www.oceandatastandards.org); aiming to obtain agreement and commitment
The assessment of wave energy resources is one of the newest coastal applications requiring the collection of wave data. It is important to note that one fundamental aspect of the development of the wave energy sector is the testing of the devices at laboratory scale. This requires that similarity is ensured between model scale and field conditions, both in terms of quality of the waves generated and of the post-processing analysis carried out. A set of recommended procedures and guidelines were generated by the International Towing Tank Conference (ITTC) and (http://ittc.sname.org/archive.htm) outlining laboratory procedures for wave measurement and model test experiments. Of particular relevance for the wave energy sectors are the following procedures:
Testing and Extrapolation Methods, Resistance, Uncertainty Analysis Spreadsheet for Wave Profile Measurements (ITTC 7.5-02-02-06, http://ittc.sname.org/2006_recomm_proc/7.5-02-02-06.pdf)(ITTC, 2002)
Testing and Extrapolation Methods Loads and Responses, Ocean Engineering, Laboratory Modelling of Multidirectional Irregular Wave Spectra (ITTC 7.5-02-07-02.1, http://ittc.sname.org/2006_recomm_proc/7.5-02-07-01.1.pdf) (ITTC, 2005a)
Testing and Extrapolation Methods, Loads and Responses, Ocean Engineering Floating Offshore Platform Experiments (ITTC 7.5-02-07-03.1, http://ittc.sname.org/2006_recomm_proc/7.5-02-07-03.1.pdf) (ITTC, 2005b)
Wave Energy Converter Model Test Experiments (ITTC 7.5-02-07-03.7, http://ittc.sname.org/CD%202011/pdf%20Procedures%202011/7.5-02-07-03.7.pdf) (ITTC, 2011)
Unified information for the provision and exchange of wave data were presented by UNESCO (UNESCO, 1987), providing information on the procedures and format to allow the exchange of measured wave data, providing information on the wave parameters that need to be presented and how they should be represented. This consisted in a list of common nomenclature used, as well as information on how to present the data (Figure 1).

D2.14 Wave data presentation and storage review
Rev. 03, 03-Sep-2012 Page 5 of 42
Figure 1: Wave data representation according to (UNESCO, 1987)
These guidelines were amended and updated by the World Meteorological Organization (WMO, 1998) who provided coding for the report of spectral wave information collected from a sea station as well as information on wave analysis and forecast that can be carried out from displacement data obtained from wave buoys and other instrumentation at sea. Similarly, the oil industry has developed standard for the analysis of wave parameters obtained at sea (Tucker, 1993). ACT found that the majority of coastal users collecting wave data, despite different uses, requires the so-called ‘First Five Fourier Parameters’ (Alliance for coastal technologies, 2007), defined as:
1. Directional Spectra E, function of the wave energy density S, of the wave frequency f and of the direction 2. The first Fourier coefficient, Mean direction a1(f) 3. The second Fourier coefficient, Directional spread b1(f) 4. The third Fourier coefficient, Skewness a2(f) 5. The fourth Fourier coefficient, Kurtosis b2(f)
Through these 5 parameters it is possible to express the directional wave spectra E(f, ) as an infinite Fourier series:
)]2sin()2cos()sin()cos()[(),( 2211 babafSfE
The ACT report suggested that wave monitoring instrumentation should be able to provide at least the ‘First 5’ parameters; however, according to the users some equipment may be required to provide further Fourier moments. The directional spectrum is generated from mathematical estimates such as the Maximum Likelihood and the Maximum Entropy Methods. The directional spectra represents therefore an interpretation of nature, rather than an exact observation (Jensen et al., 2010). The spectrum, calculated from time series of vertical displacement of the water surface, is dependent on the configuration of the device, as well as on the sampling frequency and the type of mathematical method employed. Recommendations were made by the ACT to allow for wave data standardization and inter-comparison between different datasets, gathered from different wave instruments such us wave rider buoys, ADCPs or HF radar, as follows:
Standardize data output and sensor/data interoperability, thus ensuring that different wave sensors are measuring and providing the desired values
Standardize the performance of wave sensors. ACT defined as standard instrument a Datawell Waverider MK III wave buoy, calibrated against a fixed test rig equipped with pressure sensors and compass (Alliance for coastal technologies, 2012)
[ 1 ]

D2.14 Wave data presentation and storage review
Rev. 03, 03-Sep-2012 Page 6 of 42
Establishment of a reference data set for the evaluation of the data analysis algorithm (Maximum Entropy or Maximum Likelihood Methods), available at http://cdip.ucsd.edu/documents/index/product_docs/cdiptool/DOWNLOAD/data_sample.txt
Recommendations made from ACT were included in the US National Operation Wave Observation Plan, developed by the US Integrated Ocean Observing System (IOOS) (IOOS, 2009). One of the requirements of the IOOS is for the wave data provider to use a standard metadata format, based on the WMO F291 format (http://www.nodc.noaa.gov/General/NODC-Archive/f291.html). The WMO alphanumeric formats are the standard for distributing real-time data among the government and commercial meteorological community, as well as the wave and ocean modelling communities. The IOOS aim is to work towards the adoption of ISO Certificates (International Organization for Standardization) and the generation of ISO metadata standards. Each data attribute (e.g. unit of measure, reporting convention, precision, and code definition) will be encoded and delivered in valid XML format, whilst real time data are available in ASCII format. The work carried out from IOOS resulted in the generation of the “Wave Instrument Intercomparison Tool” developed by the Coastal Data Information Programme (CDIP, cdip.ucsd.edu) at Scripps Institution of Oceanography. The WaveEVALTOOL (http://cdip.ucsd.edu/documents/index/product_docs/cdiptool/?xitem=documentation) allows for the evaluation of wave data acquired from different instrumentation, through the comparison of spectral components with standard methods (Figure 2).
Figure 2: Spectral energy comparison between two co-located wave buoys in the Pacific Ocean. Biases are expressed as %. Note biases less than 5-percent, (dark blue), from 5- to 10-percent (light blue), 10- to 20-percent (yellow), greater than 20-percent (red). Grey areas with values defined in the boxes indicate NO data from one of the two buoy (Jensen et al., 2010).
The WaveEVALTOOL was developed to be used for a wide range of wave instrumentation presented in the ACT protocol (Alliance for coastal technologies, 2012); and the data presented has to comply with the formats and templates provided by CPID, including Spectral File Format, Header for wave data generated from wave buoy and moored station and metadata form generator (http://cdip.ucsd.edu/themes/user_groups/engineers?d2=p68). Information on the type of instrumentation used, as well as on the sampling frequency and accuracy are needed to ensure effective and accurate comparison. The results of the above collaboration have seen the generation of two ISO protocols for wave data:
ISO8601:2004 – Standard for the Representation of Date and Time in Oceanographic Data Exchange (Ocean Standards, 2010a)

D2.14 Wave data presentation and storage review
Rev. 03, 03-Sep-2012 Page 7 of 42
ISO3166-1 and ISO3166-3 – Recommendation to Adopt ISO 3166-1 and 3166-3 Country Codes as the Standard for Identifying Countries in Oceanographic Data Exchange (Ocean Standards, 2010b)
The development of the wave energy industry requires continuous monitoring of wave conditions at a given wave energy installation. Wave monitoring is required for different applications: evaluating the available resources at a given site and their seasonal variability, to allow for device optimization through the identification and provision of sea-state information to the device developer, to assess changes in the coastal morphology and physical processes as a result of the installation of wave energy converters. Protocols for the assessment of wave energy resources have been produced by the FP7 funded project Equimar (Equimar, 2010) and by EMEC (EMEC, 2012). The latter document has been submitted as the basis for the international standard IEC (International Electro-technical Commission) TS 62600-101 Wave energy resource characterization and assessment, due to be published in 2013. The EMEC report presents guidelines for the storage of wave data collected for wave energy purpose:
Data should have a common structure
Data records should be consolidated in data files containing at least one month’s worth of data.
Data files should contain a series of data and no-data records, and they shall be preceded by a header containing information detailing the sampling configuration, data processing and recording of the data.
In particular, each record should contain the following components (EMEC, 2012):
1. Date and time stamp. 2. Depth in metres. Tidal variations should be included where relevant. 3. A frequency listing containing information about the variance spectrum and its directional characteristics as
well as the power spectrum. 4. A number of derived parameters including the power, mean direction, wave height and period. 5. Quality control flags
The fundamental components required by the EMEC guidelines are similar to those established by JCOMM and CDIP for the comparison and exchange wave data. There is a wealth of information on guidelines and standards that the wave energy industry could use as reference and template for the sharing of wave data.
3 DATA STORAGE INFORMATION In order to prepare efficiently for the collection of wave data, whether these are obtained during a series of laboratory experiments or during monitoring of wave conditions at sea, it is important to have a clear idea of the storage requirements of the data, how these can be accessed and the format in which they are stored. The following sections provide information on wave data storage for the different MaRINET facilities. Section 2.1 provides data storage review of the MaRINET laboratory facilities both in 2D wave tanks and 3D wave basins, while section 2.2 provides data storage information for wave data acquired at field conditions.
3.1 LABORATORY CONDITIONS The following table presents data storage information from the following laboratory facilities:
1. Aalborg University (AAU), Denmark: 2D wave tank and 3D wave basin 2. Leibniz Universität Hannover (LUH), Germany: 2D Wave Flume 3. Hydraulic and Maritime Research Centre (HMRC), University College Cork, Ireland: 2D wave flume and 3D
wave basin

D2.14 Wave data presentation and storage review
Rev. 03, 03-Sep-2012 Page 8 of 42
4. Edinburgh University, United Kingdom: Wave Basin. 5. Plymouth University, United Kingdom: Coast Lab Facilities

D2.14 Wave data presentation and storage review
Rev. 03, 03-Sep-2012 Page 9 of 42
AAU – 2D AAU – 3D LUH - HANNOVER HMRC – 2D HMRC - 3D EDINBURGH PLYMOUTH
Instrument Type & Number
Conductance type wave gauge: 3
Wave Gauges: 9 Resistive / capacity gauge: 17
Conductance type wave gauge (3) Reflective marker & digital camera
Conductance type wave gauge (1)
Calibrated Wave Gauges
Conductance type wave gauge # to be defined
Sampling Frequency
10-50 Hz 10-50 Hz 10-100 Hz 32 Hz (synchronized with wave generation)
32Hz (synchronized with wave generation)
User Defined 128Hz
Data Acquisition Running Time
30 minutes 30 minutes 60 minutes Regular: 64 seconds (2048 samples) Irregular: 256 seconds (8192 samples)
256 seconds (8192 samples)
User Defined To be defined after commissioning of facilities
Software for sampling, processing and storage
Custom software is used for data acquisition, processing and storage. ASCII files can be generated for data sharing
Labview is used for sampling, real time display and initial storing of data. Post processing is routinely done using Matlab and Excel.
Labview is used for sampling, real time display and initial storing of data. Post processing is routinely done using Matlab and Excel.
WaveLab 3 is used for logging data. Data processing is dependent on user preferences. Standard procedures are in place for data acquisition
Labview is used for logging data. Data processing user dependent
Storage Information:
Data stored as txt file in time series of surface elevation. Data format is not proprietary, unrestricted
Text files (csv) of spectrum saved 1 file/spectrum. Filename provides time information which is repeated in comment lines along with spatial location of measurement.
Raw data saved in proprietary binary format. Processed data is saved in colon separated format with 28 header rows providing processing information. ASCII files of raw data can be stored in space separated format with multiple header rows (3 rows providing parameter and units, plus 1 for each selected channel)
Raw data saved in ASCII files. Parametric data usually stored in tab separated format. One metadata header line provides parameter name with units in brackets.
Raw data saved in ASCII files. Parametric data usually stored in tab separated format. One metadata header line provides parameter name with units in brackets.
To be defined after commissioning of facilities
Storage Size Requirements
200 kb per wave channel 200 kb per wave channel 5 kBytes/second (all sensors at 100 Hz)
1MB/hour per channel 500kB/seaway (3 probes @256secs)
1MB/hour per channel 250kB/seaway (1 probe)
Dependent on user specification
To be defined after commissioning of facilities
Storage Mode Raw and processed data Data stored on Data stored on Data is backed up To be defined

D2.14 Wave data presentation and storage review
Rev. 03, 03-Sep-2012 Page 10 of 42
AAU – 2D AAU – 3D LUH - HANNOVER HMRC – 2D HMRC - 3D EDINBURGH PLYMOUTH
(include general use and backup)
are backed up on hard drive and to networked computer for a minimum of 3 years.
laboratory computer and on CD/DVD for distribution. Back up of data is stored on CD/DVD.
laboratory computer and on DVD for distribution. Back up of data is stored on DVD.
and available to the users.
after commissioning of facilities
Storage Access: location
Raw data are available on LAN. Processed data are available upon request to laboratory staff.
Raw and processed data is supplied to client. Raw and processed data is available to HMRC staff subject to confidentiality agreements.
Raw and processed data is supplied to client upon request. Raw and processed data is available to HMRC staff subject to confidentiality agreements.
To be defined after commissioning of facilities
3.2 FIELD CONDITIONS STORAGE INFORMATION The following table presents storage information for 3D irregular wave measurements carried out at the following field locations:
1. European Marine Energy Centre (EMEC), Scotland, United Kingdom: Wave test site and Scale Wave test site 2. Ente Vasco de la Energia (EVE), Basque Country, Spain: Biscay Marine Energy Platform (BIMEP) test centre. 3. Plymouth University, United Kingdom: Monitoring of Wave Hub with directional wave buoy and HF Radar. 4. Sustainable Energy Agency of Ireland (SEAI), Ireland: Monitoring of AMETS test centre 5. University of Exeter (UNEXE), United Kingdom: Monitoring of Wave Hub with directional wave buoy and ADCP 6. Wave Energy Centre (WAVEC), Portugal: Monitoring of Pico Power Plant wave conditions
EMEC EMEC SCALE EVE PU BUOY PU HF RADAR SEAI UNEXE ADCP UNEXE BUOY WAVEC
Instrument Type & Number
Datawell Directional Waverider Buoy
TRIAXYS™ Directional Wave Monitoring Buoy
Directional wavescan buoy
Seawatch Mini II wave buoy (4)
WERA HF radar (2 stations)
Datawell Make III Directional Waverider Buoy
RDI Workhorse Sentinel ADCP, 300 KHz, modified with a 5th vertical beam for surface measurements
Seawatch Mini II wave buoy (4)
Acoustic Doppler Current Meter: 1
Sampling Frequency
3.84Hz 4Hz 2 Hz continuous 1.28 Hz 2 Hz 2 Hz 1 Hz

D2.14 Wave data presentation and storage review
Rev. 03, 03-Sep-2012 Page 11 of 42
EMEC EMEC SCALE EVE PU BUOY PU HF RADAR SEAI UNEXE ADCP UNEXE BUOY WAVEC
Data Acquisition running time (typical duration of experiments)
Indefinite Indefinite 2048 samples per hour of heave roll and pitch
30 minutes sampling of wave conditions carried continuously over the year.
17 min:45 sec 30 minutes Recent deployments: 20 minutes out of every 30 minutes. Previous deployments: Continuous recording.
32 minutes 34.1 minutes
Software (sampling, processing, storage)
Data acquisition and processing by proprietary RfBbuoy /W@ves21 software. Data format in W@ves21 output No special storage arrangements
Data sampling and processing onboard TRIAXYS buoy by custom processor. Data acquisition by TRIAXYS Waveview software. No special storage arrangements
Onboard Time series analysed in time domain and frequency domain to derive all directional wave parameters and spectra. Custom software is utilized for post processing.
Wave Sense III is used for data processing and output generation. Analysis in both time and frequency domain.
Data sampling and processing by system manufacturer WERA, Helzel Messtechnik and post processing by Seaview sensing
Data analysis carried out at HMRC-UCC using MATLAB
RDI’sWavesMon processing software (for wave data) or WinADCP software for current velocities
Fugro Oceanor processing software
Aquadopp - sampling QuickWave - non-graphical wave processing tool (to obtain wave spectra)
Storage Information: Format and type
Raw data in ASCII readable encoded hexadecimal. Parameters and Tables in CSV-like format but with custom headers. Filename provides time information for spectra.
Raw data in ASCII readable encoded hexadecimal. Parameters and Tables in ASCII tables with headers. Filename provides time information
Raw data saved in proprietary binary format. Processed and cleaned time series of heave roll pitch and compass stored in TXT format. Text files of parametric data stored with 2 header lines providing parameter name and units. Text files of spectrum saved 1 file/spectrum.
Raw data stored in .pff proprietary format. Files can be export in txt and tab separated format.
Raw data stored in various binary files that contain information about the chirps, number of antennas and Mode Bits. Parametric data is stored in ascii files. Wave directional spectra information stored in Mysql database
Text files (csv) of spectrum saved 1 file/spectrum. Filename provides time information which is repeated in comment lines along with spatial location of measurement.
Raw wave and current data stored in .000 format (also called .PD0 format)
Raw data stored in binary .pff format
Raw data saved in proprietary binary format. Data processed with Aquadopp saved in .dia format. Data is processed with QuickWave software produced as
.wap - wave parameters
.was -frequency spectra;
.wdr - distributions wave direction;
.wds - full

D2.14 Wave data presentation and storage review
Rev. 03, 03-Sep-2012 Page 12 of 42
EMEC EMEC SCALE EVE PU BUOY PU HF RADAR SEAI UNEXE ADCP UNEXE BUOY WAVEC
(Raw and smoothed spectra) Text files of time domain analysis of heave, saved 1 file/hour.
directional spectra;
.wcf Fourier coefficients;
.wst Time Series
.wbd wave for wind sea and swell
Storage Size Requirements
7 MB/day/buoy 0.25 MB/day/buoy
500 MB/year Radio: 2kB/day Hard drive: 7MB/day/buoy
1 Gb/day 7 MB/day/buoy ~ 3.3MB/hr ~ 1GB/yr 0.65 MB/day, for 34.1 min measurements every 3 hours. Maximum storage: 90 MB
Storage Mode (include general use and backup)
Data available on server. Monthly tape backups maintained.
Data available on server. Monthly tape backups maintained.
Processed data and parametric data are backed up.
Data stored on internal hard drive. Processed data saved on computer and backed up on cloud. 3 Monthly download missions at location are required.
Data stored in each station and backed up to external NAS driver and server at the University.
Raw data currently stored and backed up as .000 files on personal pc. Storage database currently under construction.
Raw data stored as binary .pff files with automated back-up. Storage database currently under construction.
Data is stored in the device’s internal memory. When the maximum storage is reached the data is recovered at location.
Storage Access: location
Data available on application to EMEC.
Data available on application to EMEC.
Data are available upon request to EVE.
Data available to members of research group. Metadata to become publically available.
Raw data is available upon request to members of the research group.
Raw data is available upon request to laboratory staff. Parametric data are available in near real-time on a secure connection.
Data from the campaigns is stored at WavEC and is accessible upon request.

D2.14 Wave data presentation and storage review
Rev. 03, 03-Sep-2012 Page 13 of 42
4 WAVE DATA REPRESENTATION Graphical representation of wave data is often used to present information on the type of sea conditions generated in particular facilities or to determine the dominant sea state at a given test centre. Representations of wave data are used to identify the dominant direction of the incoming waves, as well as providing information on the seasonal variations. This section aims to provide an overview of the methods for wave data presentation with respect to both laboratory and field conditions. An overview of the main wave characteristics is presented in section 4.1. Further details are available in MaRINET Deliverable D2.1.
4.1 IMPORTANT WAVE CHARACTERISTICS
4.1.1 Time domain (Height, period and direction) One of the most important analyses of the surface elevation time histories is that of zero-upcross (ZUC) waves (Tucker, 1993), allowing to determine the main wave characteristics. Time domain (TD) characteristics of waves are determined through a wave by wave analysis of the surface elevation at a given location. Through this type of analysis it is possible to determine both individual and integrated wave parameters.
Significant Wave Height
The significant wave height, normally represented by H1/3 or Hs is defined as the average of the largest 1/3 waves in a record. The determination of H1/3 is based on the zero up-crossing method.
Significant Wave Period
The significant wave period, represented by T1/3 or Ts is defined as the average period of the largest 1/3 waves in a record.
Mean Wave Height
The mean wave height, Hmean, is defined as the average of the wave heights in a record.
Mean Wave Period
The mean wave period, Tz, is defined as the average of the wave periods determined by a zero up-crossing analysis of the time series. Tz. is normally preferred to Ts.
Maximum Wave Height
The maximum wave height, Hmax, represents the maximum value of the wave height measured over a given period of time.
Maximum Wave Period
The maximum wave period, Tmax, represents the maximum value of the discrete wave periods measured.
Wave Steepness
The wave steepness, s, relates to the wave height of the waves with the wavelength (L) associated to its relevant period. It can be determined on a wave by wave base or as Hmean/Lmean.

D2.14 Wave data presentation and storage review
Rev. 03, 03-Sep-2012 Page 14 of 42
4.1.2 Frequency domain (1D spectra) The determination of wave parameters in the frequency domain is obtained through a spectral analysis of the wave records, based on the energy spectrum of the wave records. This relates the spectral density (m2s) with the frequency, as seen in Section 2. The energy spectrum, S, can be represented as a discrete function of the frequency f, discrete spectra; or as a function of global wave parameters, parametric spectra. Parameters are computed through a Fourier analysis of the time series data, with a recommended spectral resolution of 0.05 Hz (Tucker, 1993).
Spectral Moments
The spectral moments are the foundations of the spectral analysis and most wave characteristics can be determined through them. The nth spectral moment can be defined as follows: The most commonly used moments are m-1, m0, m2, and m4 ; with the zero-th spectral moment m0 representing the variance of the elevation time series.
Significant Wave Height
Hm0 is the representation of the significant wave height in the frequency domain. It is determined assuming narrow banded Gaussian wave process. Hm0 is related to m0 as follows:
2/100 4mHm
[ 3 ]
Mean Wave Period
There are two main ways to represent the mean wave in the frequency domain. The mean energy period can be determined through the following relationships:
T01 =m0
m1
[ 4 ]
And
T02 =m0
m2
[ 5 ]
T02 provides an approximation of the time domain mean wave period Tz.
Peak Wave Period
The peak period Tp represents the dominant wave system in a given sea state. Tp is given by the following conditions:
mn = f n0
¥
ò S( f )df [ 2 ]

D2.14 Wave data presentation and storage review
Rev. 03, 03-Sep-2012 Page 15 of 42
)]Max[S(f = )S(f
1/f = p
pp
pT
[ 6 ]
Energy Wave Period
The energy period Te is determined from the spectra and it is used to describe the wave resources for wave energy applications. Te can be considered as a representation of T02, but its value is less influenced by the higher frequency energy. Te is given by the following relation:
Te =m-1
m0
[ 7 ]
Spectral Bandwidth
The spectral bandwidth allows assessment of the wave resource in a given area with higher accuracy. The spectral bandwidth is characterized through a number of dimensionless parameters. However, the use of the narrowness parameter, υ, is recommended to allow for the bandwidth of the sea state process. The spectral bandwidth parameter is somewhat sensitive to the high-frequency contents of the spectrum. The following formulation for υ is suggested as it mitigates higher orders:
u =m0 ×m2
m1
2-1
é
ëê
ù
ûú
1/2
[ 8 ]
Wave Power
The wave power Pw provides an indication of the power available per unit of crest length in an undirectional sea. Pw is given by:
Pw = r ×g S( f ) ×cg dfò
[ 9 ]
where cg represents the wave group velocity. For deep water cases,
Wave Steepness
The wave steepness s is used to characterize a particular sea state. The peak steepness is given by the following relation:
sp =Hm0
Lp
[ 10 ]

D2.14 Wave data presentation and storage review
Rev. 03, 03-Sep-2012 Page 16 of 42
The wavelength Lp is determined through the dispersion coefficient and is associated to Tp.
Fourier Moments The first four Fourier moments, which are used for the definition of the wave energy spectra as presented in Section
2 are determined from the directional spreading function D(,f) as follows:
2
02
2
02
2
01
2
01
,2sin)(
,2cos)(
,sin)(
,cos)(
fDdfb
fDdfa
fDdfb
fDdfa
[ 11 ]
Where a1(f) represents Mean direction (first Fourier coefficient), b1(f) is the directional spread (second Fourier coefficient), a2(f) is the skewness (third Fourier coefficient) and b2(f) represents the kurtosis (fourth Fourier coefficient).
4.2 LABORATORY CONDITIONS The following table displays information on the type of wave data monitored at the different Marinet facilities and the type of outputs generated. AAU – 2D AAU – 3D LUH -
HANNOVER HMRC – 2D HMRC - 3D EDINBURGH PLYMOUTH
Outputs: Parameters
Time domain (TD): number of waves, Hmean, Tmean, Ts, Hs, Hmax, reflection coefficient, incident and reflective wave height. Frequency domain(FD): Hm0, Tp,
TD: number of waves, Hmean, Tmean, Ts, Hs, Hmax, reflection coefficient FD: Hm0, Tp, Wave Power
TD: number of waves, Hmax, Hm, T(Hmax), T(Hm), Tm, reflection coefficient FD:fmin, fmax, Δf, fpeak, Tp,Tm10,Hm0, Incident Wave Height. Reflected Wave Height.
Real time: Time series of water surface elevation for both monochromatic & panchromatic wave conditions. Post processing TD & FD: e.g. no. of waves, H, T, Hmax, Tm, Hs, H1/3, T1/3, Hmax, reflection coefficient, Hmo, Tp, Te incident wave height and reflected wave height
Real time: Time series of water surface elevation Post processing TD & FD: parameters as required by project e.g. no. of waves, Hm, Tm, Hs, H1/3, T1/3, Hmax, reflection coefficient, Hmo, Tp, Te
User defined To be defined after commissioning of facilities
Outputs: Matrix
Joint distribution of wave height and period. Frequency spectra
Directional spectra
Time series of incident and reflected waves, Frequency spectra, summary of output parameters
As required by project: e.g.: Joint distribution of wave height and period. 1D frequency spectra
As required by project: e.g.: Joint distribution of wave height and period. 1D frequency spectra
User defined To be defined after commissioning of facilities
Outputs: Graphics
Wave height distribution, incident and reflected
Wave height distribution, incident and reflected
Time series, frequency spectra Incident and
Incident waves and reflected waves, wave height
Incident waves and reflected waves,
To be defined after commissioning of facilities

D2.14 Wave data presentation and storage review
Rev. 03, 03-Sep-2012 Page 17 of 42
waves, spectral density, directional spectra
waves, spectral density, directional spectra
reflected waves, zero crossings, local maxima and minima
distribution, spectral density, power matrix
wave height distribution, spectral density, power matrix
4.2.1 Example Wave Data Representation Methods
4.2.1.1 Time Series
Time series of wave data are generated representing the surface elevation of the wave on the y-axis of a plot (expressed either in [m] or [mm]) with the x-axis representing the time in [s]. These often are plotted separately as incident and reflected waves. The analysis of the incident and reflected waves is often carried out in post processing of the experimental data sets. Examples of time series are presented in Figure 3 , Figure 4 and Figure 5. Figure 6 presents a time series generated at HRMC including incident and reflected waves in the time domain.
Figure 3: Wave Data Time Series Generated at AAU (x-axis: time [s], y-axis: height [m])
Figure 4: Wave Data time series generated at LUH (x-axis: time [s], y-axis: height [m])

D2.14 Wave data presentation and storage review
Rev. 03, 03-Sep-2012 Page 18 of 42
Figure 5: Typical surface elevation time series generated at HMRC (x-axis: time [s], y-axis: height [mm])
Figure 6: Incident and Reflected regular wave measurement at HMRC (x-axis: time [s], y-axis: height [mm])
4.2.1.2 Wave height distribution
It has been shown (WMO, 1998) that coastal wave records tend to follow the Rayleigh distribution. Wave height distribution diagrams may be used to compare the waves measured in lab conditions with the ideal Rayleigh distribution. Examples are presented in Figure 7 and Figure 8.
-30
-20
-10
0
10
20
30
0 10 20 30 40 50 60 70
Surf
ace
Ele
vati
on
(mm
)
Time (Seconds)
T=1.45s H=40mm
Wave Probe 1
Incident WaveIncident + ReflectedWave

D2.14 Wave data presentation and storage review
Rev. 03, 03-Sep-2012 Page 19 of 42
Figure 7: Wave Height distribution generated at AAU (x-axis: (H/Hm)2 y-axis: probability)
Figure 8: Wave height distribution generated at HMRC for Bretschneider sea states (x-axis: 2H/Hs y-axis: probability)
4.2.1.3 Joint distribution of wave height and period
The joint distribution of wave height and period provides information on the number of waves generated, or measured, with a given wave period T and a given wave height H. Examples of joint distribution of wave height for an irregular wave train generated at lab conditions are shown in Figure 9 and Figure 10.
Figure 9: Joint distribution of wave height and period at AAU. (Value displayed is no per bin)
Wave Height Distribution
Measured Incident Rayleigh Incident
(H/Hm)²
17161514131211109876543210
Exceedence p
rob. [%
]
90
50
20
10
5
2
1
0.5
0.1
0
0.1
0.2
0.3
0.4
0.5
0.6
0.7
0.8
0-0.2 0.21-0.4
0.41-0.6
0.61-0.8
0.81-1.0
1.01-1.2
1.21-1.4
1.41-1.6
1.61-1.8
1.81-2.0
2.01-2.2
2.21-2.4
2.41-2.6
2.61-2.8
2.81-3.0
3.01-3.2
3.21-3.4
3.41-3.6
3.61-3.8
3.81-4.0
P( 2
H/H
s )
2H
Hs
Wave Height Distribution Rayleigh Distribution
Joint Distribution of Wave Height and Period
Wave Period [s]
10
Wave H
eig
ht [m
]
0.065
0.06
0.055
0.05
0.045
0.04
0.035
0.03
0.025
0.02
0.015
0.01
0.005
081
7
93
104
19
40
174
167
84
33
12
4
3
1
1
10
152
242
229
141
78
43
19
19
4
2
1
7
76
130
80
43
11
7
1
18
23
4
1
2
2

D2.14 Wave data presentation and storage review
Rev. 03, 03-Sep-2012 Page 20 of 42
Figure 10: Joint distribution of wave height and period for Hs = 60mm and Tz = 0.15s at HMRC. Value displayed: No. per bin.
4.2.1.4 Spectral Density
The spectral density diagram presents information on the energy present for each wave frequency. Spectral diagrams are generated through a Fast Fourier Transform of the wave elevation time series. Examples of spectral diagrams are presented in Figure 11, Figure 12 and Figure 13.
Figure 11: Spectral Density graph generated at AAU.
Wave Height Wave Period (sec)
mm 0-0.25 0.25-0.5 0.5-0.75 0.75-1.0 1.0-1.25 1.25-1.5 1.5-1.75 1.75-2.0 2.0-2.25
120-130
110-120
100-110 1
90-100 1
80-90 1
70-80 1 2 3 1
60-70 1 3 3
50-60 1 3 8 6 2 1
40-50 4 7 6 9 6
30-40 5 13 4 8 8
20-30 6 17 12 5 2
10-20 9 19 7 3 1
0-10 9 30 4 6 1 1
Variance Spectrum
Incident Reflected Noise/Error
Frequency [Hz]
3210
Spectr
al D
ensity
[m
²·s]
0.000
0.000
0
0

D2.14 Wave data presentation and storage review
Rev. 03, 03-Sep-2012 Page 21 of 42
Figure 12: Spectral density graph generated at LUH.
Figure 13: Spectral density graph generated at HMRC.
4.2.1.5 Directional Spectra
The directional spectra provides information on the energy density of the wave for a given frequency and a given wave direction. It is often approximated by determining the mean direction for each component of the frequency spectrum. Whether a complete spectrum is collected or not can often be hidden by the presentation. An example of directional spectra is presented in Figure 14.

D2.14 Wave data presentation and storage review
Rev. 03, 03-Sep-2012 Page 22 of 42
Figure 14: Directional spectra generated at AAU 3D basin. The spectrum identifies the main direction of the incoming wave
and their frequency component. For the case in example the mean direction is of 60 with F=0.8Hz
4.2.1.6 Min, Max and Zero Crossing
Zero crossing graphs are used to identify the maximum and minimum of the wave components and number of waves, as presented in Figure 15.
Figure 15: Zero crossing analysis carried out at LUH, identifying fully developed waves for TD analysis.

D2.14 Wave data presentation and storage review
Rev. 03, 03-Sep-2012 Page 23 of 42
4.3 FIELD CONDITIONS A broader range of wave data is obtained when monitoring the sea state in field conditions. The table below provides an overview of the wave parameters measured and determined at the different facilities. EMEC EMEC SCALE EVE PU BUOY PU HF RADAR SEAI UNEXE ADCP UNEXE BUOY WAVEC
Outputs: Parameters
Time domain (TD):
Percentage of data with no reception errors [%]
Hmax
Tmax
H1/10
T1/10
H1/3
T1/3
Hav
Tav
Eps (bandwidth parameter)
#Waves Frequency
domain (FD):
Tp
Dirp
Sprp
Tz
Hm0 TI
T1,
Tc
Tdw2
Tdw1
Tpc
nu
eps
QP
Ss Status:
TD:
# of zero crossings
Hav
Tz
Hmax
H1/3
T1/3
H1/10
T1/10
Wave steepness
FD:
Tm (mean period)
Tp (peak period)= 1 / fp
Tp5 (peak period estimate)
Hm0 4*√(m0)
Dir_m (mean direction)
Spr_m (mean spread)
Sea Surface Temperature
TD:
number of waves
Hm
Tm
Ts
Hs
Hrms
H1/3
T1/3
H1/10
T1/10
Hmax
Tmax
H/T of waves
Listed decreasing, length of the groups of waves exceeding Hs
Asymmetry
Variance.
Rayleigh and Normal adjust of temporal series.
FD:
Hm0
Tp
Tm02
Tm01
Te
θp
θm
TD + FD:
Hmax
Hmean
H1/3
Hm0
Tp
Te
Tz
T02
θp
θm
Lambda (spectral width)
Sigmap (spreading at peak)
Hm0 (different freq ranges)
Tp
Complete directional energy spectrum
Data Quality Parameters
TD:
number of waves
Hm
Tm
Ts
Hs
H1/3
T1/3
Hmax FD:
Hm0
T02
Time series of surface elevation and orbital velocities, that can be processed further to obtain spectra and spectral parameters as required.
Time series of heave and east/north displacement. These are the only files stored. From these, spectra and spectral parameters can be calculated as required.
Hs
Tm02
Tz
Tp
Peak direction (DirTp)
Directional spread
Mean direction
Unidirectivity index
Mean Pressure
Current speed
Current direction

D2.14 Wave data presentation and storage review
Rev. 03, 03-Sep-2012 Page 24 of 42
EMEC EMEC SCALE EVE PU BUOY PU HF RADAR SEAI UNEXE ADCP UNEXE BUOY WAVEC
Sea Surface Temperature
m0
m1
m-1
m2
ep1
ep2
Outputs: Matrix
Integral Spectra Directional Spectra
Integral Spectra Directional Spectra Directional Fourier Coefficients
TD: 1800 second time series of
Buoy status
Heave
North
West FD: At each frequency component:
Normalised spectral density
Direction
Spread
Skewness
Kurtosis
2-D and directional spectra calculated via WavesMon software, bi-variate distributions of wave height and period may be produced from spectral parameters
2-D and directional spectra calculated from displacement time series as required, bi-variate distributions of wave height and period may be produced from spectral parameters
Frequency spectra; distributions of mean wave direction per frequency band; full directional spectra
Outputs: Graphics
Spectra and displacement figures from W@ves21. Other figures post processed in MATLAB, EXCEL, etc
Post processed in MATLAB, EXCEL, etc
Frequency Spectra
Not yet produced Time Series Spectral Density Directional spectra
Wave height distribution, incident and reflected; Spectral density, incident and reflected Directional Spectra
No graphical output stored
No graphical output stored

D2.14 Wave data presentation and storage review
Rev. 03, 03-Sep-2012 Page 25 of 42
4.3.1 Example Wave Data Representation Methods
4.3.1.1 Time Series
Time series of wave height or heave motion can be presented continuously or for representative value of H determined over normally a 30 minute interval (Hs or Hm0). Time series of raw (non-process data) are shown in Figure 16 (heave, north and east displacement of the buoy) Figure 17 (heave) and Figure 18 (heave). Parametric time series of processed data are presented in Figure 19, Figure 20 and Figure 21.
Figure 16: Time series of buoy displacement data at EMEC.
Figure 17: Heave time series generated at EVE.
Figure 18: Displacement time series generated at SEAI.

D2.14 Wave data presentation and storage review
Rev. 03, 03-Sep-2012 Page 26 of 42
Figure 19: Time series of Hm0 obtained from the HF Radar at Plymouth University.
Figure 20 Time Series of Hm0 obtained from wave buoy at EMEC

D2.14 Wave data presentation and storage review
Rev. 03, 03-Sep-2012 Page 27 of 42
Figure 21: Parameter time series generated at WAVEC and comparison between ADCM and Wave buoy data.
4.3.1.2 Spectral Density
Spectral diagrams are used to identify the energy content of each frequency component at a given site. These are often coupled with the spectral direction and spreading coefficient to allow for the determination of the frequency spectra. The generation of the graph presented in Figures 19 to 23 depends therefore on the specific instrument used to collect the vertical displacement information and to filters applied in determining the spectral density S(f). Mathematical tools, such as the WAVEVALT tool (available at http://cdip.ucsd.edu/documents/index/product_docs/cdiptool/?xitem=documentation) have been developed to assess the discrepancies between different buoys. Example of spectral density diagrams generated at the difference facilities are presented in Figure 22, Figure 23, Figure 24, Figure 25 andFigure 26.
Figure 22:Example of Spectral density graph generated at EMEC, including direction and spread of the waves

D2.14 Wave data presentation and storage review
Rev. 03, 03-Sep-2012 Page 28 of 42
Figure 23: Spectral density graph generated at EVE.
Figure 24: Spectral density diagram generated at SEAI.

D2.14 Wave data presentation and storage review
Rev. 03, 03-Sep-2012 Page 29 of 42
Figure 25: Spectral density diagram generated by the HF Radar at PU.
Figure 26: Spectral Density diagram generated at WAVEC, including the mean wave direction
4.3.1.3 Directional Spectra
Directional spectra show the directions that individual wave components are travelling (Figure 27). Directional wave information is derived from buoy motions through the analysis of the heave-pitch-roll motions of the buoy as highlighted in Benoit (Benoit, 2011) . The determination of such information is dependent on both the power transfer function and phase responses associated with the buoy. A crucial role in the evaluation of the directional parameters is played by the measurement system installed on the buoy and by the moorings.

D2.14 Wave data presentation and storage review
Rev. 03, 03-Sep-2012 Page 30 of 42
Figure 27: Directional wave spectrum from EMEC wave buoy
4.3.1.4 Scatter Diagram
Scatter diagrams present the possibility of occurrence of a particular sea state identified normally by Tp or Te and Hs or Hm0 at a particular location. A scatter diagram provides useful information on the dominant sea conditions at a given site and help wave energy developers to tune their device to a favourable conditions as well as preparing for extreme case loading. Scatter diagrams can be shown either in graphical form or expressed as a matrix. Figure 28 and Figure 29 present example of scatter diagrams generated at EMEC and SEAI respectively.
Figure 28: Scatter Diagram generated at EMEC.

D2.14 Wave data presentation and storage review
Rev. 03, 03-Sep-2012 Page 31 of 42
Figure 29: Scatter Diagram generated at SEAI.
4.3.1.5 Power Matrix
A power matrix (Figure 30) is used to determine the expected power output of a wave energy converter for a given test site. It is normally derived from the interpolation of the device characteristics with the scatter diagram of the installation location.
Figure 30: Power Matrix generated at EMEC.
4.3.1.6 Wave Rose
A wave rose is an aggregate of measurements of direction and wave height generated typically over a month or a year of observations. Figure 31 and Figure 32 show examples of Wave Roses generated at EMEC and SEAI.

D2.14 Wave data presentation and storage review
Rev. 03, 03-Sep-2012 Page 32 of 42
Figure 31: Wave Rose generated at EMEC.
Figure 32: Wave Rose generated at SEAI.
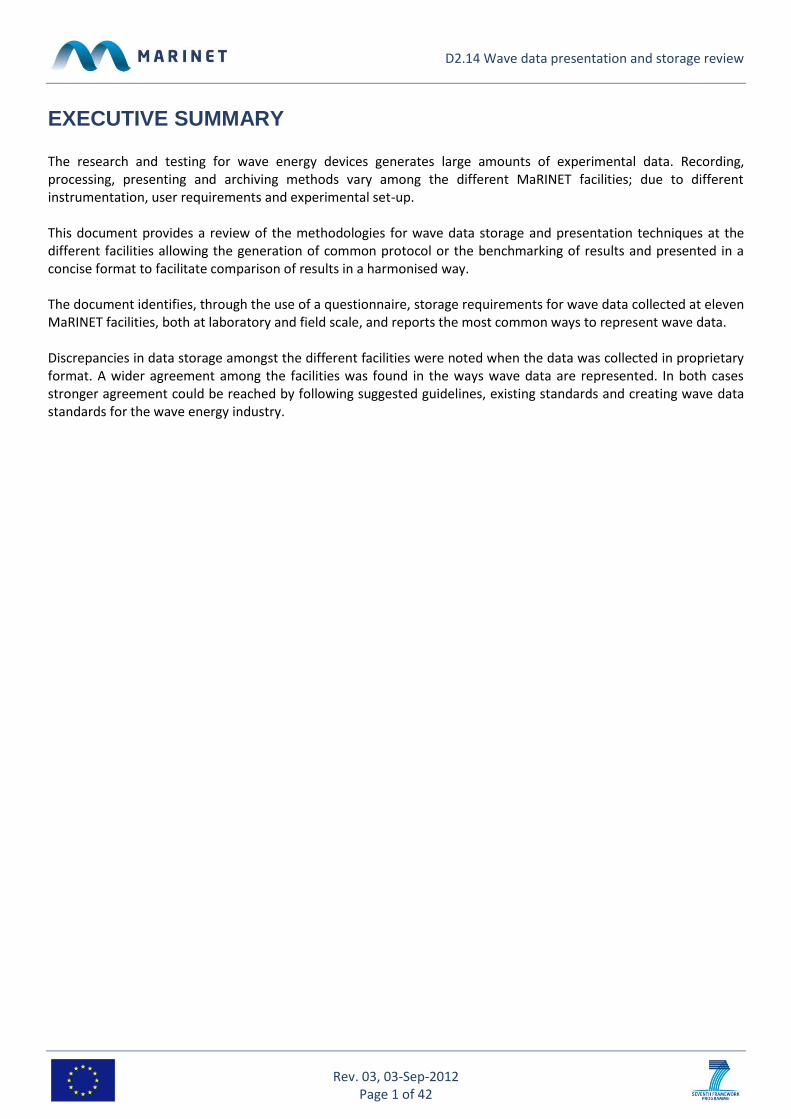
4.3.1.7 Wave Height distribution
Figure 35 and Figure 36 present wave height distribution graph generated at EVE and SEAI, generated according to the methods presented in Section4.2.1.2.
D2.14 Wave data presentation and storage review
Rev. 03, 03-Sep-2012 Page 33 of 42
Figure 33: Wave Height Distribution at EVE (x-axis Hm/Hs; y-axis: probability)
Figure 34: Wave Height distribution generated at SEAI.
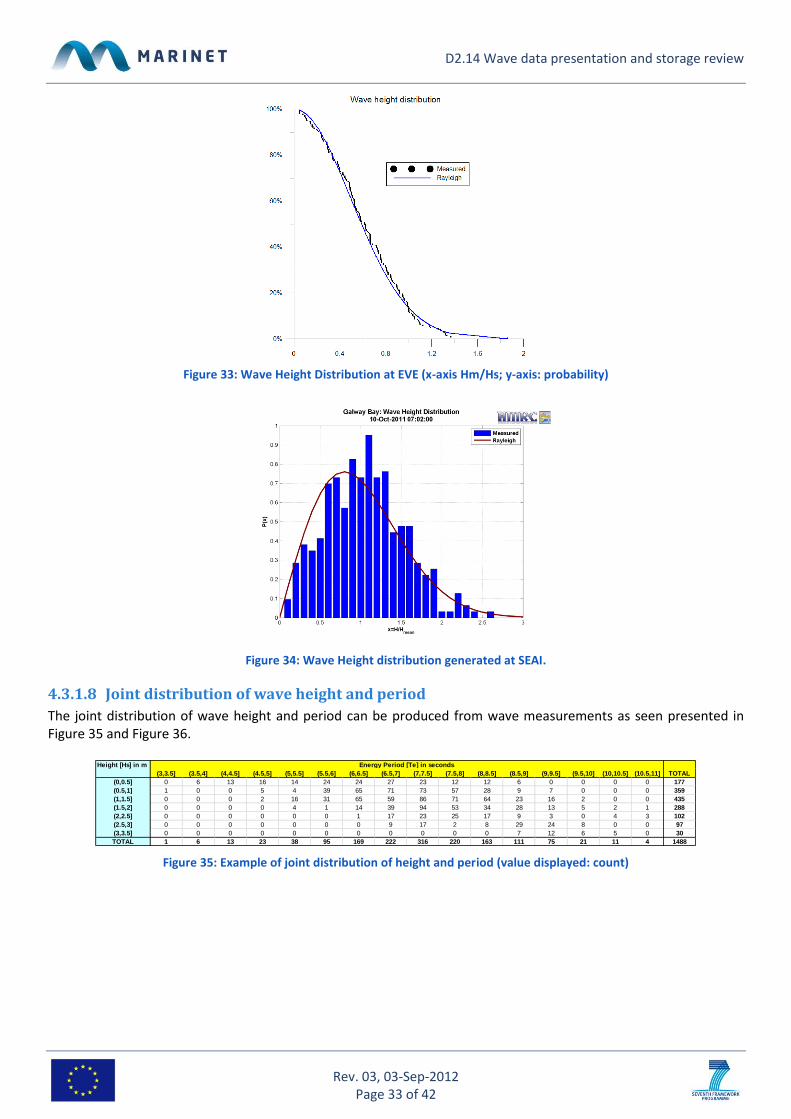
4.3.1.8 Joint distribution of wave height and period
The joint distribution of wave height and period can be produced from wave measurements as seen presented in Figure 35 and Figure 36.
Figure 35: Example of joint distribution of height and period (value displayed: count)
Height [Hs] in m
(3,3.5] (3.5,4] (4,4.5] (4.5,5] (5,5.5] (5.5,6] (6,6.5] (6.5,7] (7,7.5] (7.5,8] (8,8.5] (8.5,9] (9,9.5] (9.5,10] (10,10.5] (10.5,11] TOTAL
(0,0.5] 0 6 13 16 14 24 24 27 23 12 12 6 0 0 0 0 177
(0.5,1] 1 0 0 5 4 39 65 71 73 57 28 9 7 0 0 0 359
(1,1.5] 0 0 0 2 16 31 65 59 86 71 64 23 16 2 0 0 435
(1.5,2] 0 0 0 0 4 1 14 39 94 53 34 28 13 5 2 1 288
(2,2.5] 0 0 0 0 0 0 1 17 23 25 17 9 3 0 4 3 102
(2.5,3] 0 0 0 0 0 0 0 9 17 2 8 29 24 8 0 0 97
(3,3.5] 0 0 0 0 0 0 0 0 0 0 0 7 12 6 5 0 30
TOTAL 1 6 13 23 38 95 169 222 316 220 163 111 75 21 11 4 1488
Energy Period [Te] in seconds

D2.14 Wave data presentation and storage review
Rev. 03, 03-Sep-2012 Page 34 of 42
Figure 36: Joint distribution of significant wave height and peak period for the BIMEP site – generated by EVE
4.3.1.9 Other graphs
Example of distribution by peak direction and wave height
Figure 37: Example of distribution by peak direction and wave height generated at EMEC.
Example of time series of spectra

D2.14 Wave data presentation and storage review
Rev. 03, 03-Sep-2012 Page 35 of 42
Figure 38: Example of time series of spectra generated at EMEC.
Example of half-hourly and monthly best direction
In order to be able to provide an indication of the effect of directionality on the wave spectra, the “best direction” is evaluated. A directional estimate of the net power flux, Pflux, in direction φ is obtained by multiplying the energy of each spectral component resolved in direction φ by the group velocity (Cg):
fffSfCggPflux d))(cos()()()(
Where φ is the directional alignment to the waves and θ is the spectral wave direction. The above calculation is repeated for φ = 0 to 360 degrees in one degree increments, finding the power flux for every direction. Dδ is the best direction (i.e. φ for max {Pflux(φ)}) found by this means. Examples of half-hourly and monthly best direction and of
half-hourly and monthly directionality coefficient generated at EMEC are presented in Figure 39 and Figure 40 respectively.
Figure 39: Example of half-hourly and monthly best direction generated at EMEC.

D2.14 Wave data presentation and storage review
Rev. 03, 03-Sep-2012 Page 36 of 42
Example of half-hourly and monthly directionality coefficient
Figure 40: Example of half-hourly and monthly directionality coefficient generated at EMEC.

D2.14 Wave data presentation and storage review
Rev. 03, 03-Sep-2012 Page 37 of 42
5 CONCLUSIONS AND RECOMMENDATIONS Large amounts of wave data are generated at the different MaRiNET facilities. The purpose of this review is to identify how wave data is stored, accessed and represented and to provide useful information for future use. Despite wave data being dependent on the needs of the final user, the following general points can be concluded from this review:
1. Data Storage: The size of the wave dataset is strongly dependent on the type of measurements being carried out. In the case of laboratory measurements, the data collected is rarely presented in proprietary format. Common procedures amongst partners include storage on hard drive or CD/DVD.
Wave data collected in field conditions normally have a requirement of about 7MB of data per day. However the size of the files is dependent on the parameters monitored, the accuracy of monitoring and the file format that the data is stored in. Most waverider buoys and ADCPs store information in a proprietary format. This generates discrepancies in the nomenclature used, as well as different requirements in terms of storage of the information. The use of common headers for files and the creation of standards at industry level will allow for a more consistent way to storage data and for cross-comparison between the different facilities.
2. Data presentation: Examples of graphical representation for both laboratory and field conditions are reported herein. In general terms, the procedures used in different facilities to give a graphical representation of wave data are very similar. However, discrepancies are often found in the wave parameters used to generate the various diagrams, for example, choice of Hm0 and Te when generating scatter diagrams, power matrixes and joint wave height and period distributions-. Consistency in the use of these parameters as recommended by the Equimar1 guidelines would allow for greater uniformity and for easier benchmarking of the data.
1 Equimar Deliverable 2.2 "Wave and Tidal Resource Characterisation", and Deliverable 2.7 "Protocols for wave and tidal resource assessment".

D2.14 Wave data presentation and storage review
Rev. 03, 03-Sep-2012 Page 38 of 42
6 REFERENCES
Alliance for coastal technologies. (2007). Wave sensor technologies (p. 26).
Alliance for coastal technologies. (2012). WAVES MEASUREMENT SYSTEMS TEST AND EVALUATION PROTOCOLS IN SUPPORT OF NATIONAL OPERATIONAL WAVE.
Benoit, M. (2011). PRACTICAL COMPARATIVE PERFORMANCE SURVEY OF METHODS USED FOR ESTIMATING DIRECTIONAL WAVE SPECTRA FROM HEAVE-PITCH-ROLL DATA. Proceedings of the International Conference on Coastal Engineering; No 23 (1992): Proceedings of 23rd Conference on Coastal Engineering, Venice, Italy, 1992. Retrieved from http://journals.tdl.org/ICCE/article/view/4681/4362
EMEC. (2012). Assessment of Wave Energy Resource (p. 36). Retrieved from Assessment of
Equimar. (2010). Protocols for wave and tidal resource assessment. Retrieved from https://www.wiki.ed.ac.uk/download/attachments/9142387/EquiMar+D2.7+Resource+Assessment+Protocol.pdf?version=1
IOOS. (2009). A National Operational Wave Observation Plan, (March).
ITTC. (2002). Testing and Extrapolation Methods Resistance, Uncertainty Analysis Spreadsheet for Wave Profile Measurements.
ITTC. (2005a). Laboratory Modelling of Multidirectional Irregular Wave Spectra.
ITTC. (2005b). Floating Offshore Platform Experiments.
ITTC. (2011). Wave Energy Converter Model Test Experiments.
Jensen, R., Swail, V., Lee, B., & Reilly, W. A. O. (2010). Wave Measurement Evaluation and Testing. 12th International Workshop on Wave Hindcasting and Forecasting.
Ocean Standards. (2010a). Recommendation to Adopt ISO 8601:2004 as the Standard for the Representation of Date and Time in Oceanographic Data Exchange UNESCO (Vol. 2).
Ocean Standards. (2010b). Manuals and Guides 54 ( 1 ) Recommendation to Adopt ISO 3166-1 and 3166-3 Country Codes as the Standard for Identifying Countries in Oceanographic Data Exchange UNESCO 2010 (Vol. 54).
Tucker, M. J. (1993). Recommended standard for wave data sampling and near-real-time processing. Ocean Engineering, 20(5), 459–474. doi:10.1016/0029-8018(93)90015-A
UNESCO. (1987). User guide for the exchange of measured wave data (p. 82). Retrieved from http://unesdoc.unesco.org/images/0007/000785/078593eo.pdf
WMO. (1998). Guide to wave analysis and forecasting. Retrieved from http://www.jodc.go.jp/info/ioc_doc/JCOMM_Other/WMO702.pdf

D2.14 Wave data presentation and storage review
Rev. 03, 03-Sep-2012 Page 39 of 42
7 APPENDICES Symbol Used Definition
Hs, H1/3 Average of the third highest waves
Hmax Height of the highest wave
Hmean, Hm Average height of individual waves
Hm0 Estimate of Hs , 04 m
Ts Average period of the one third highest waves
Tz Average period of individual waves
Tp Peak period
T02 Mean ZUC period20 /mm
Te Energy period 01 /mm
s Wave steepness
S Spectral density
m0, m1, m2, m4, Moments of the spectrum about the origin
dffSf k )(
θp Peak direction = θp | S(fp,θp) = Max*S(f,θ)+
θm Mean direction = (180/π)*arg*a+i*b+
Λ Spectral bandwidth = m0^2 / ∫S(f)^2*df
σp Peak’s directional spreading
σm Mean directional spreading
Pw Omnidirectional wave power / unit of crest length
Paverage Average power generated
Prob Probability occurrence of a given sea state defined by Hs and Tp
Efficiency of conversion
Pflux(φ ) Directional power flux in direction φ
Dδ Best direction