Embed Size (px)
Citation preview
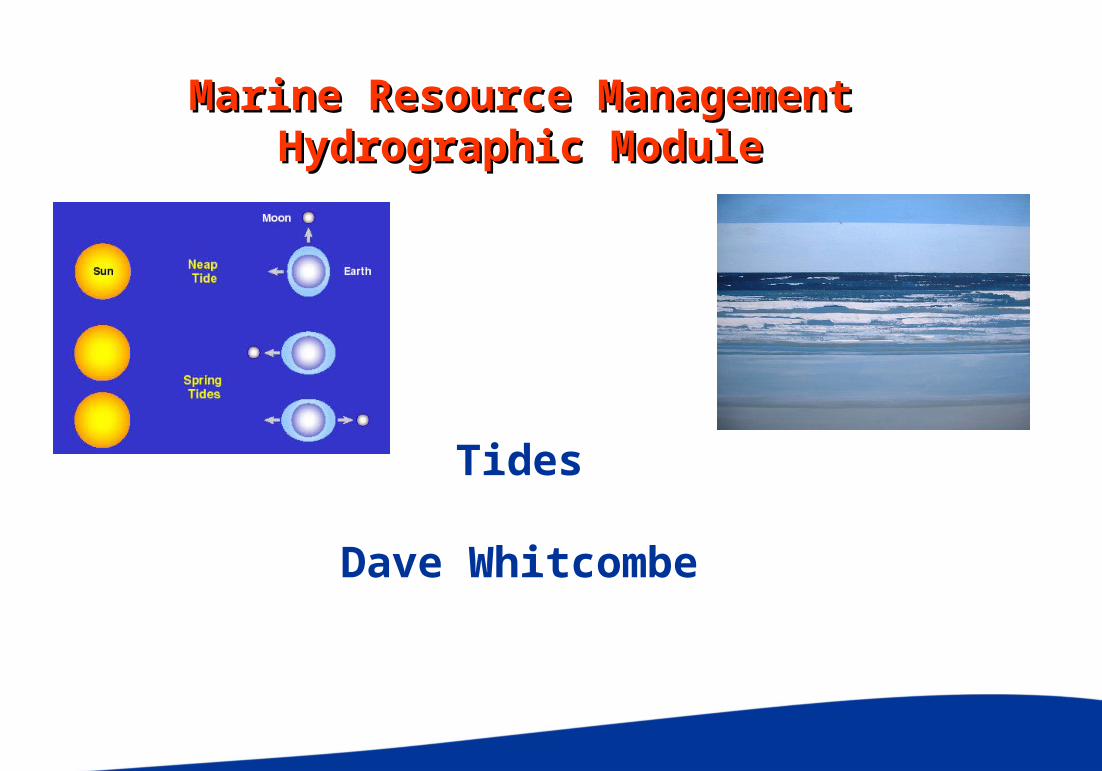
Marine Resource ManagementMarine Resource ManagementHydrographic ModuleHydrographic Module
Tides
Dave Whitcombe

Learning OutcomesLearning Outcomes
•Why do we need to know about
Tides
•Tidal Forces
– How/Why are Tides Generated
•Tide Measurement Methods
•Tidal Levels and Datums
•Tidal Prediction
•Tidal Streams
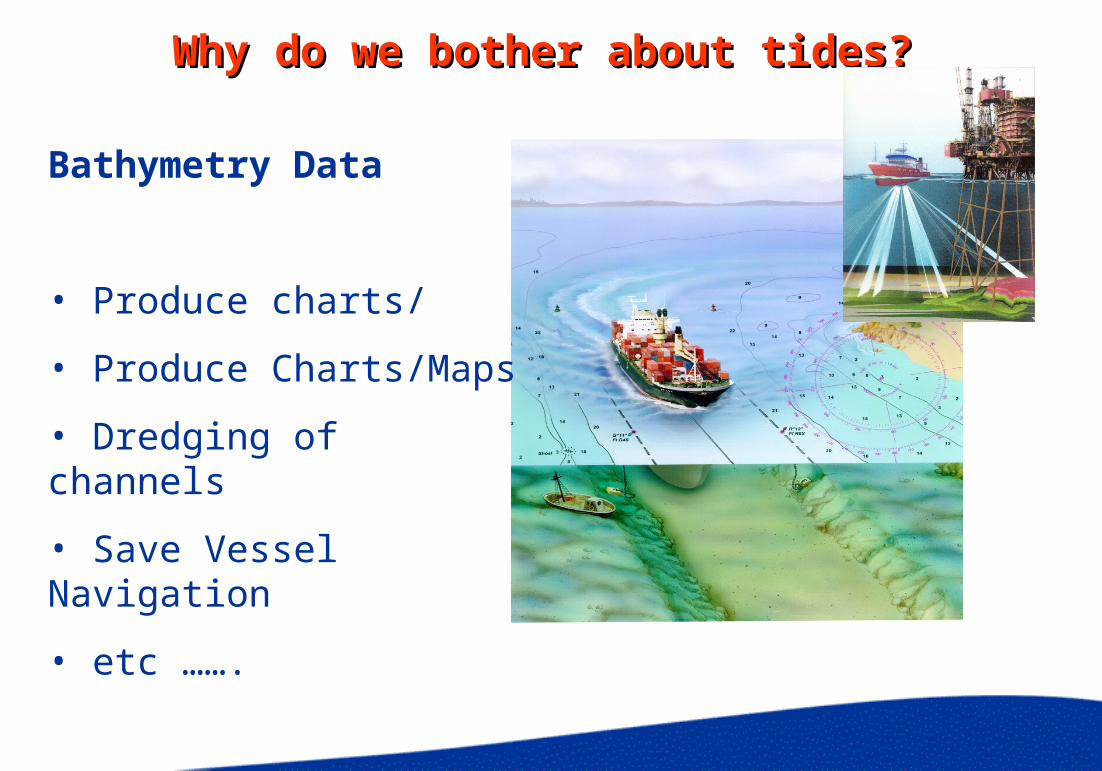
Why do we bother about tides?Why do we bother about tides?
Bathymetry Data
• Produce charts/
• Produce Charts/Maps
• Dredging of channels
• Save Vessel Navigation
• etc …….

The price of getting it wrongThe price of getting it wrong …..
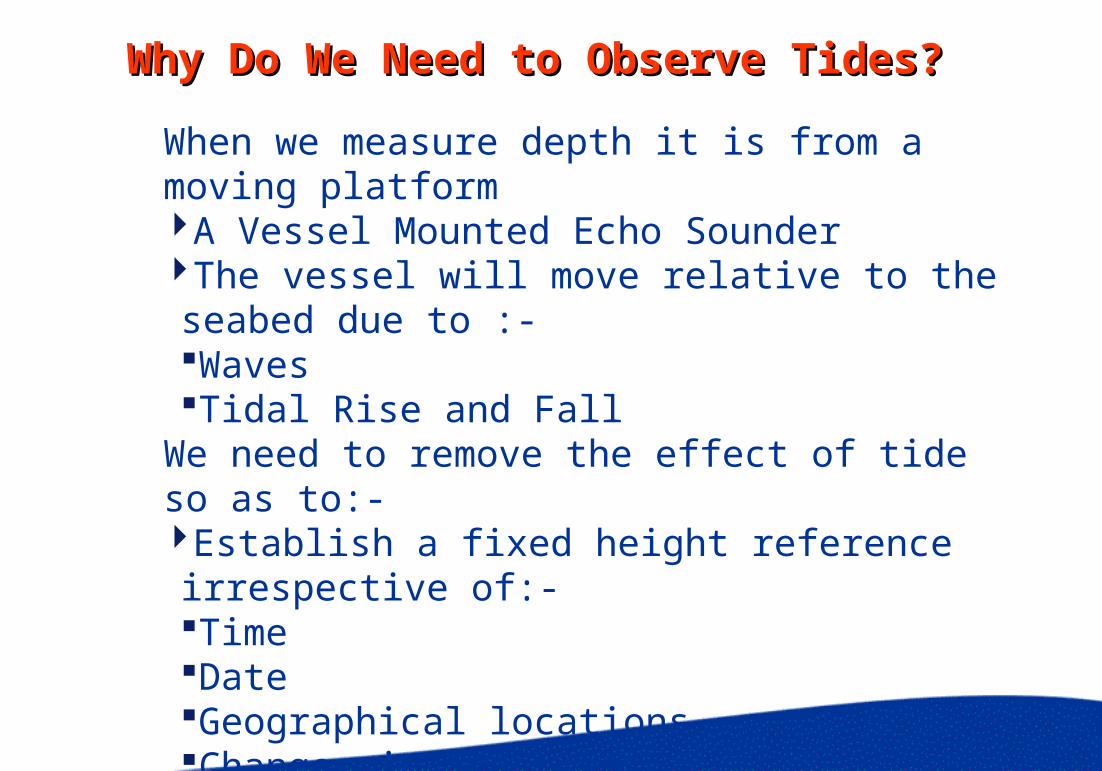
Why Do We Need to Observe Why Do We Need to Observe Tides?Tides?
When we measure depth it is from a moving platformA Vessel Mounted Echo SounderThe vessel will move relative to the seabed due to :-WavesTidal Rise and Fall
We need to remove the effect of tide so as to:-Establish a fixed height reference irrespective of:-TimeDateGeographical locationsChanges in Sea Level
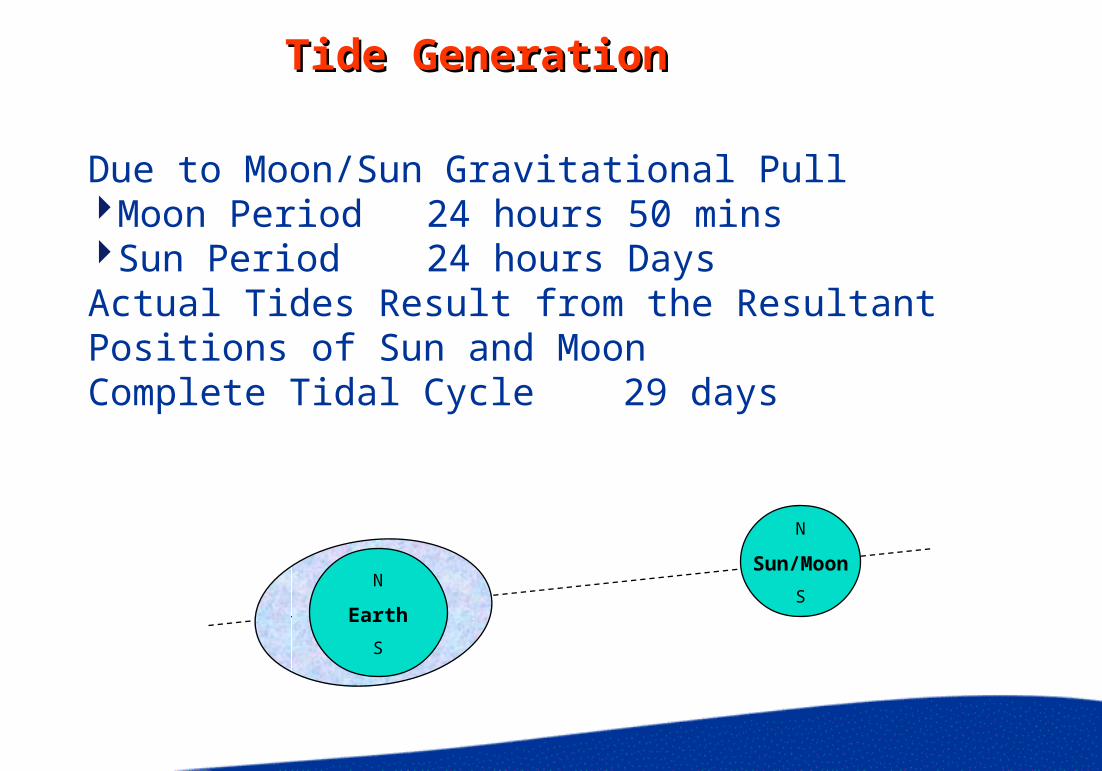
Tide GenerationTide Generation
Due to Moon/Sun Gravitational PullMoon Period 24 hours 50 minsSun Period 24 hours DaysActual Tides Result from the Resultant Positions of Sun and MoonComplete Tidal Cycle 29 days
N
Sun/Moon
SN
Earth
S
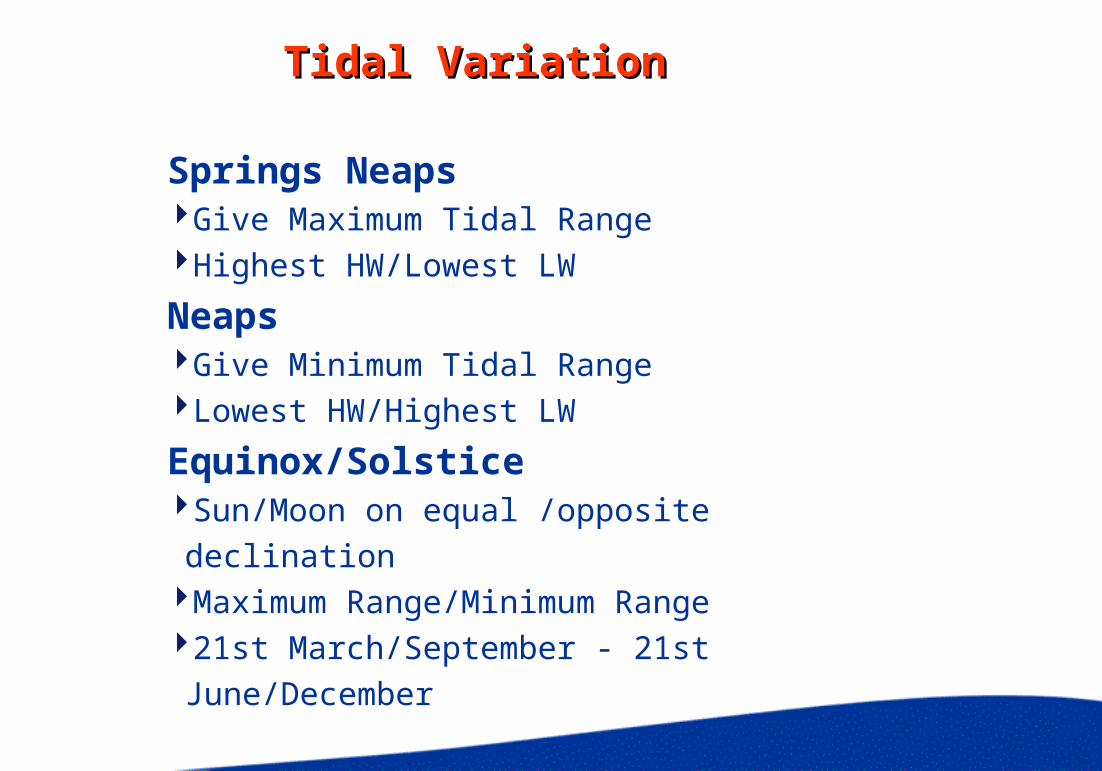
Tidal VariationTidal Variation
Springs NeapsGive Maximum Tidal RangeHighest HW/Lowest LW
NeapsGive Minimum Tidal RangeLowest HW/Highest LW
Equinox/SolsticeSun/Moon on equal /opposite declinationMaximum Range/Minimum Range21st March/September - 21st June/December
N
Earth
S
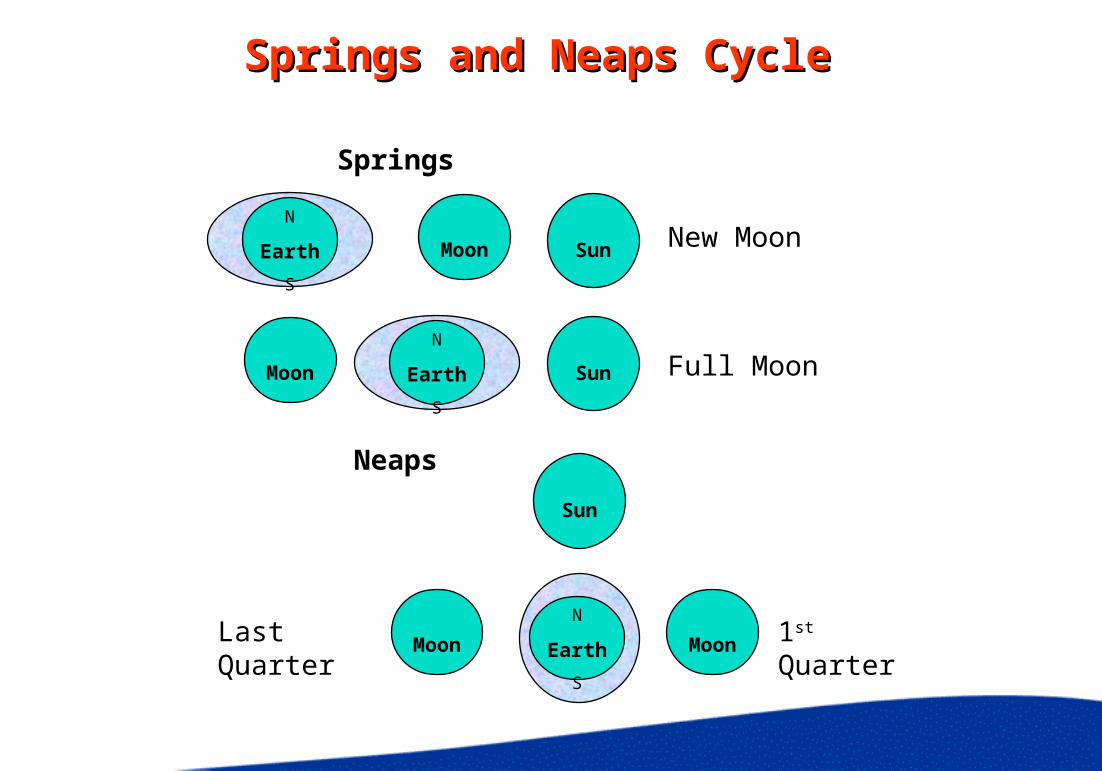
Springs and Neaps CycleSprings and Neaps Cycle
Sun
Springs
Neaps
Moon
N
Earth
S
SunMoon
N
Earth
S
Sun
Moon
New Moon
Full Moon
Moon 1st QuarterLast Quarter
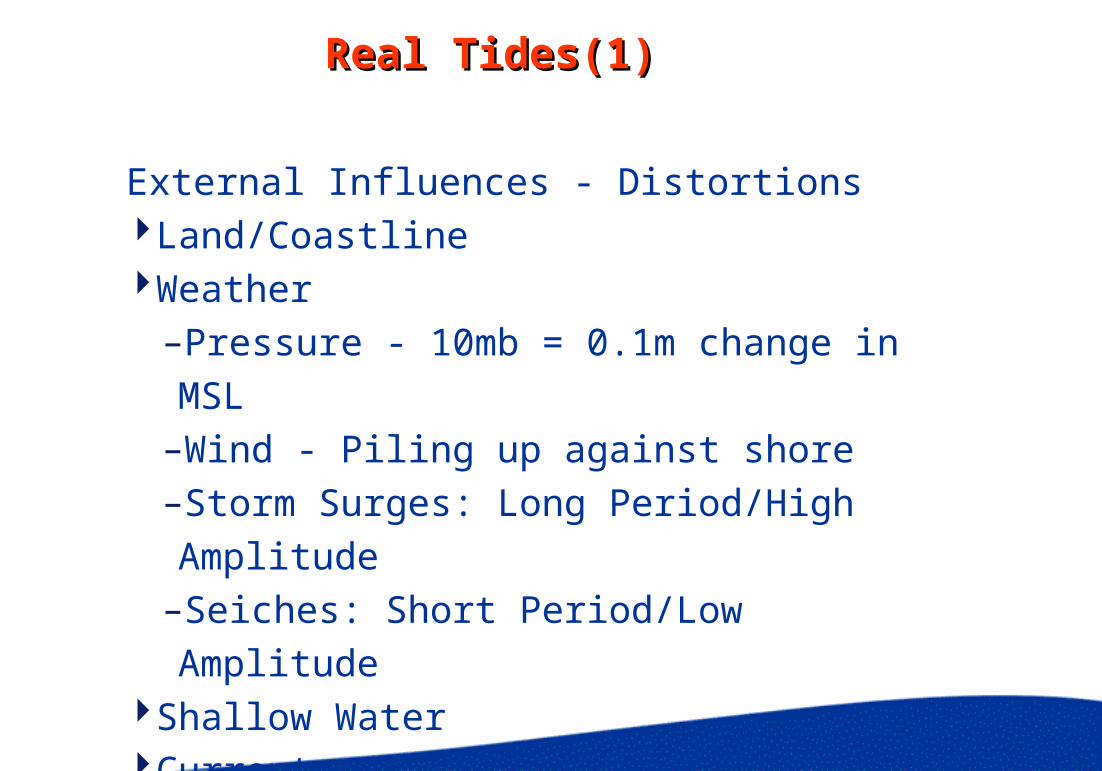
Real Tides(1)Real Tides(1)
External Influences - DistortionsLand/CoastlineWeather
–Pressure - 10mb = 0.1m change in MSL–Wind - Piling up against shore–Storm Surges: Long Period/High Amplitude–Seiches: Short Period/Low Amplitude
Shallow WaterCurrents
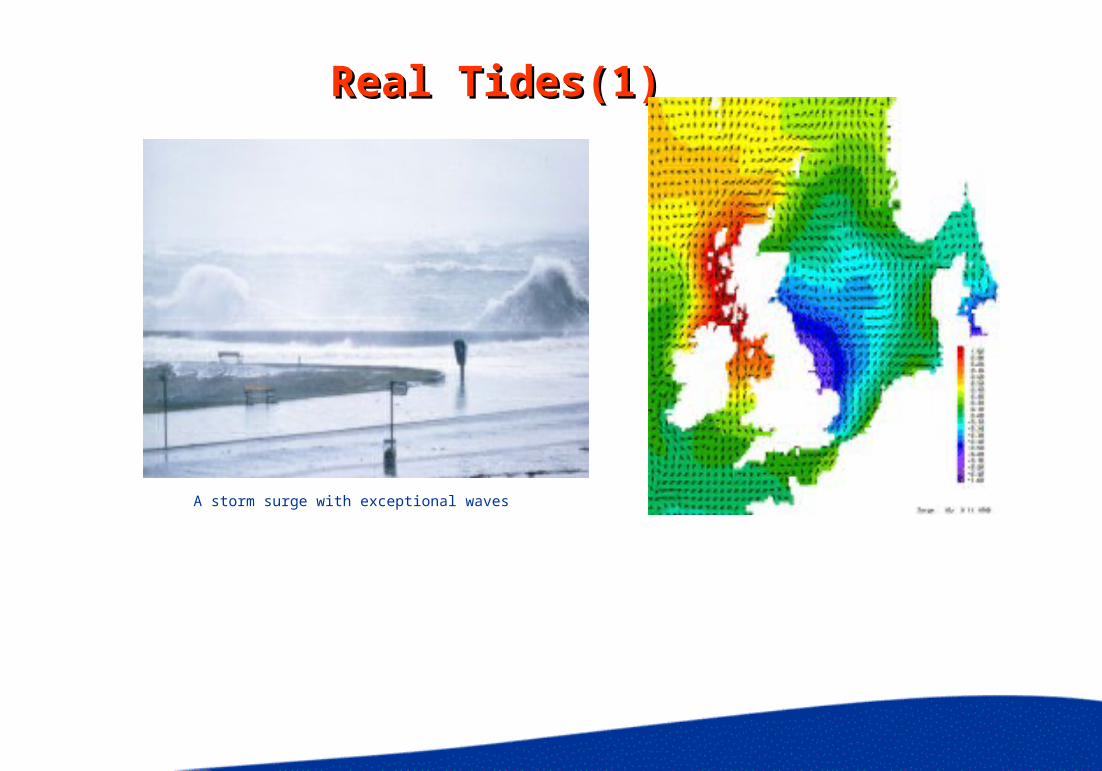
Real Tides(1)Real Tides(1)
A storm surge with exceptional waves

ResonanceResonance
Natural Period of ResonanceCombination of Tidal Cycle + Resonance
Atlantic - 12 hours = Semi-DiurnalPacific - 24 hours = DiurnalN/S of 65o Tides are Diurnal butGulf of Mexico = DiurnalNorth Cape Norway = Semi-Diurnal
Semi-Diurnal 2HW + 2LW per day
Diurnal 1HW + 1LW per day
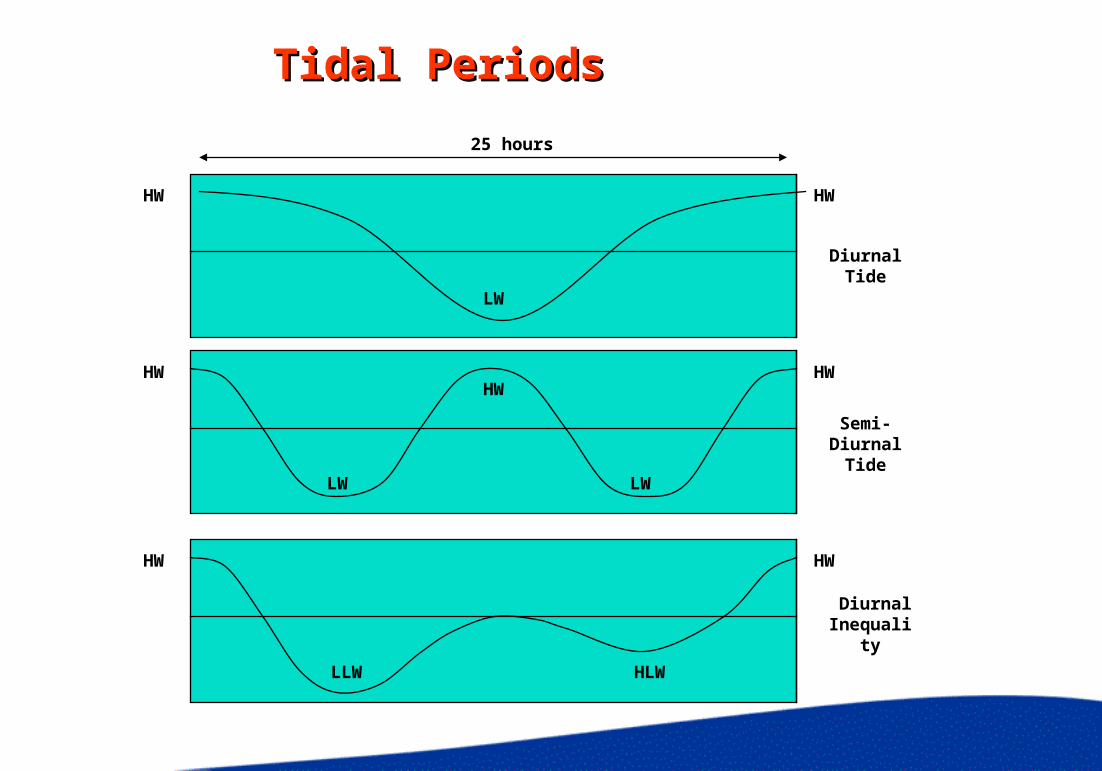
Tidal PeriodsTidal Periods
LW
HW HW
25 hours
HW HW
HW HW
LW
LWLW
HLWLLW
HW
Diurnal Tide
Semi- Diurnal
Tide
Diurnal Inequality
Tide GaugesTide Gauges
To measure Rise and Fall of Tide at a Fixed LocationTide PoleFloat GaugeBubbler GaugeMicrowave/Acoustic Gauge
For Offshore Tide Measurements U/W Pressure Transducer
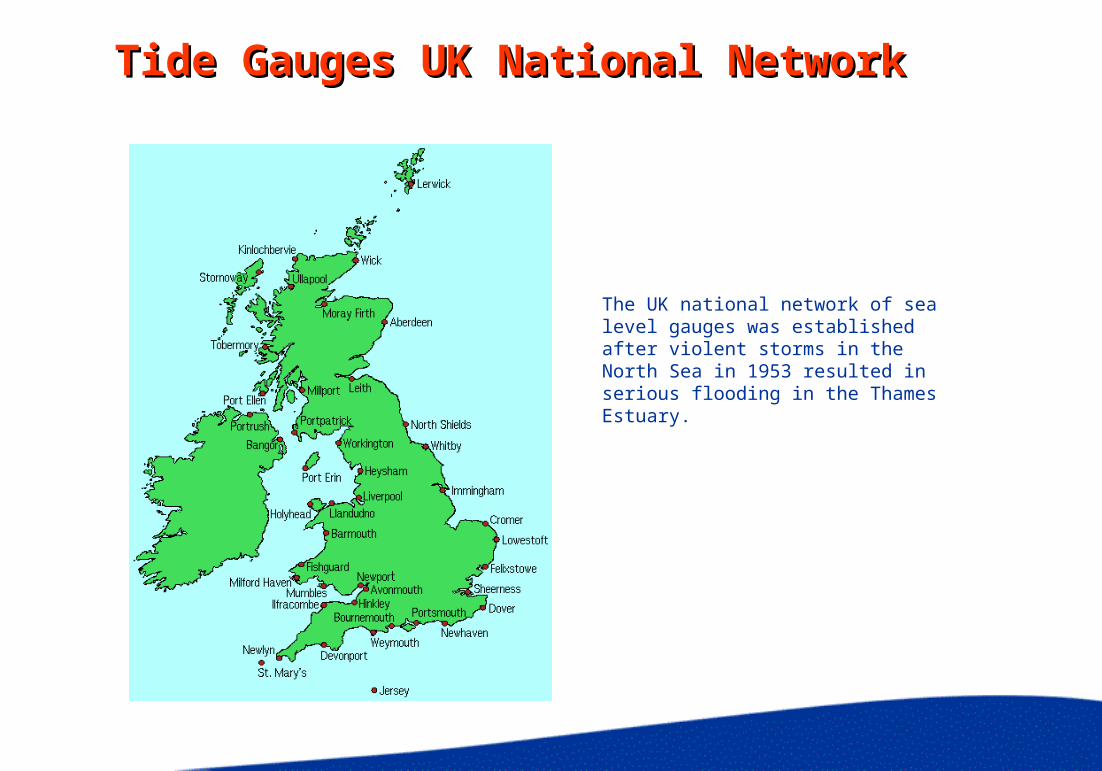
Tide Gauges Tide Gauges UK UK NNational ational NNetworketwork
The UK national network of sea level gauges was established after violent storms in the North Sea in 1953 resulted in serious flooding in the Thames Estuary.

Aberdeen Tide GaugeAberdeen Tide Gauge
The tide gauge is located on the south east corner of Waterloo Quay, Aberdeen Docks

Tidal Levels and DatumsTidal Levels and Datums
Tide Datum Related to Land DatumIn UK = Ordnance Datum NewlynEquivalent to MSL 1915-1921 - Has risen by ~0.15m
MSL- Mean Sea LevelBasic Reference level for all tidal measurements
Obtained by:-Mean of all Tide Readings over a long Periode.g. 30 days to 18.6 years
MTL - Mean Tide LevelNOT = MSLMean of all HW and LW - not all tide readings
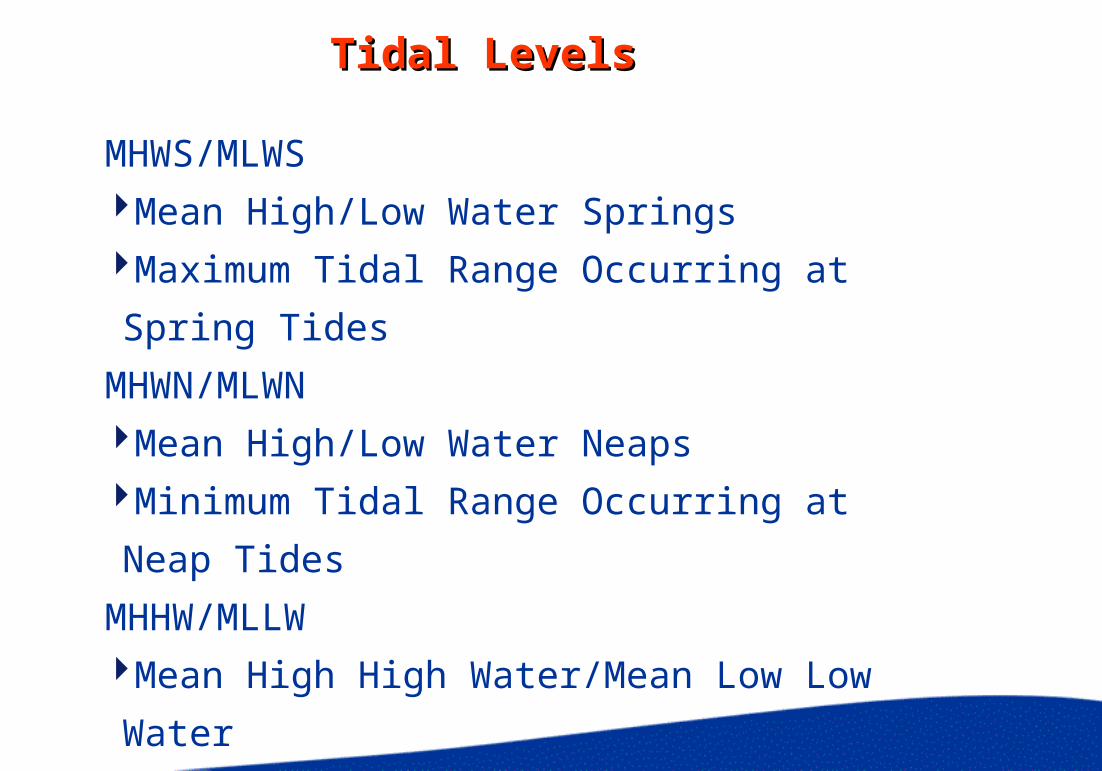
Tidal LevelsTidal Levels
MHWS/MLWSMean High/Low Water SpringsMaximum Tidal Range Occurring at Spring
Tides
MHWN/MLWNMean High/Low Water NeapsMinimum Tidal Range Occurring at Neap
Tides
MHHW/MLLWMean High High Water/Mean Low Low
WaterWhere Tide is Diurnal
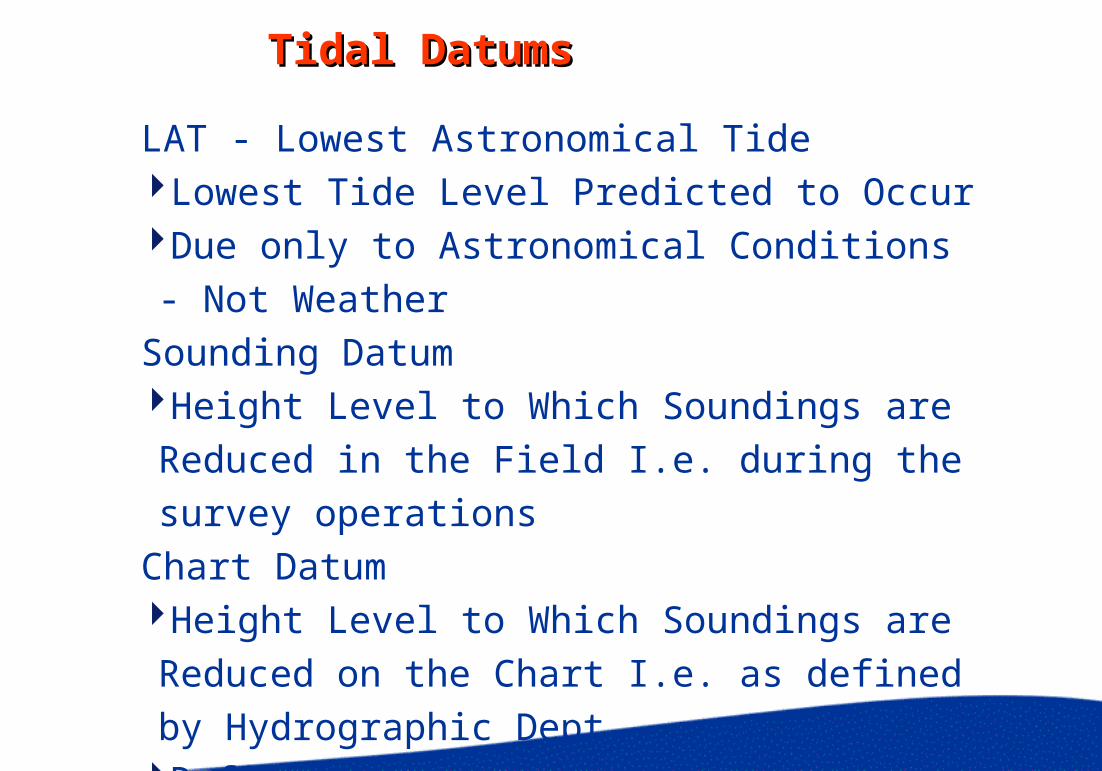
Tidal DatumsTidal Datums
LAT - Lowest Astronomical TideLowest Tide Level Predicted to OccurDue only to Astronomical Conditions - Not Weather
Sounding DatumHeight Level to Which Soundings are Reduced in the Field I.e. during the survey operations
Chart DatumHeight Level to Which Soundings are Reduced on the Chart I.e. as defined by Hydrographic Dept.
Defined as level below which the tide will very seldom fall
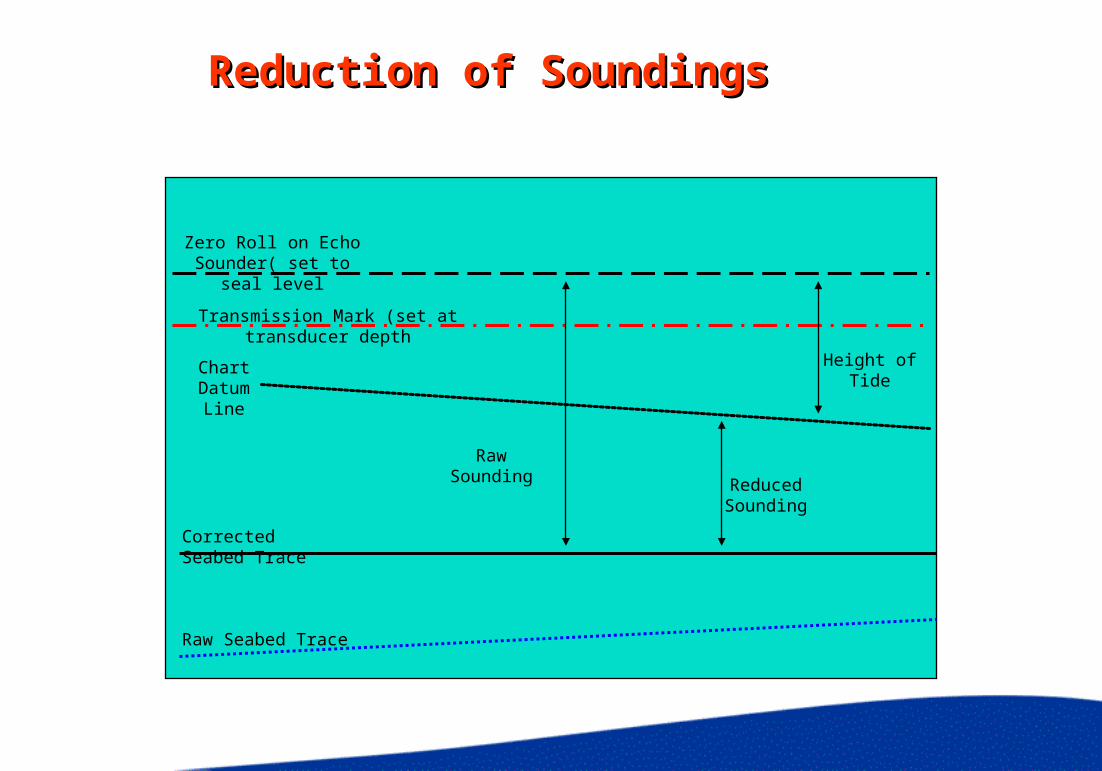
Reduction of SoundingsReduction of Soundings
Raw Seabed Trace
Zero Roll on Echo Sounder( set to seal level
Chart DatumLine
Transmission Mark (set at transducer depth
Corrected Seabed Trace
Raw Sounding
Height of Tide
Reduced Sounding
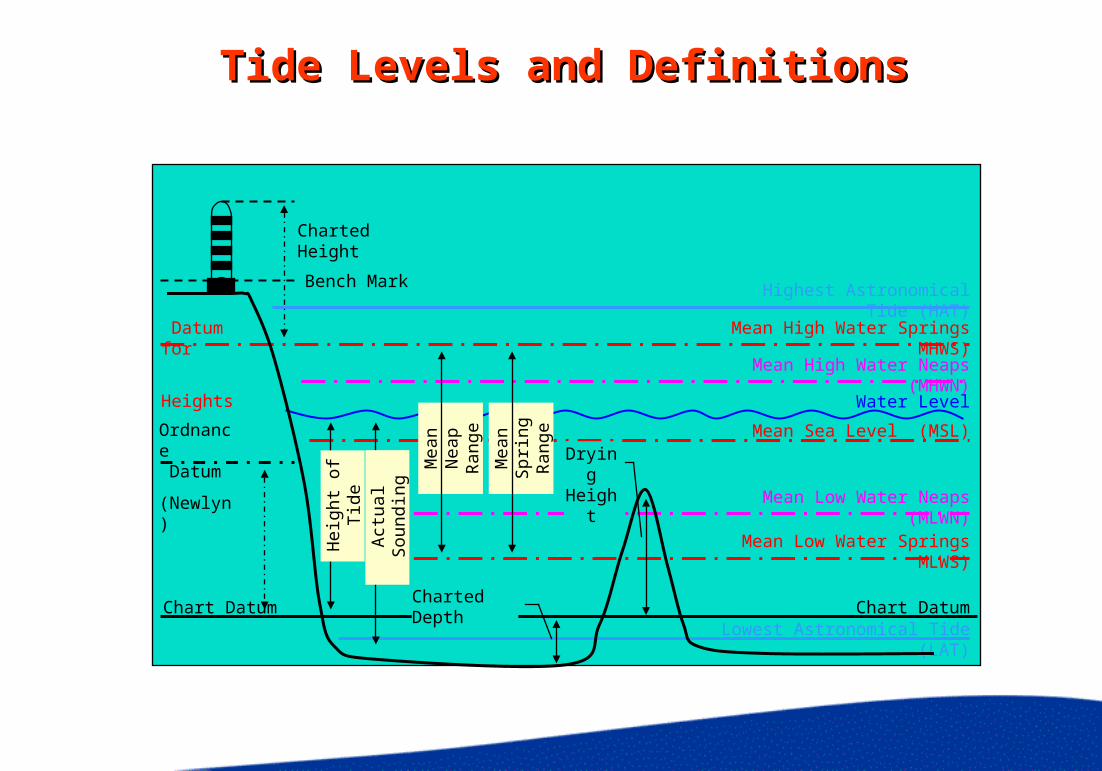
Tide Levels and DefinitionsTide Levels and Definitions
Highest Astronomical Tide (HAT)
Mean High Water Springs MHWS)
Water Level
Mean High Water Neaps (MHWN)
Mean Sea Level (MSL)
Mean Low Water Neaps (MLWN)
Mean Low Water Springs MLWS)
Lowest Astronomical Tide (LAT)Chart DatumChart Datum
Ordnance Datum
(Newlyn)
Datum for
Heights
Bench Mark
Charted Height
Hei
ght o
f T
ide
Act
ual S
ound
ing
Mea
n N
eap
Ran
ge
Mea
n Sp
ring
R
ange
Charted Depth
DryingHeight
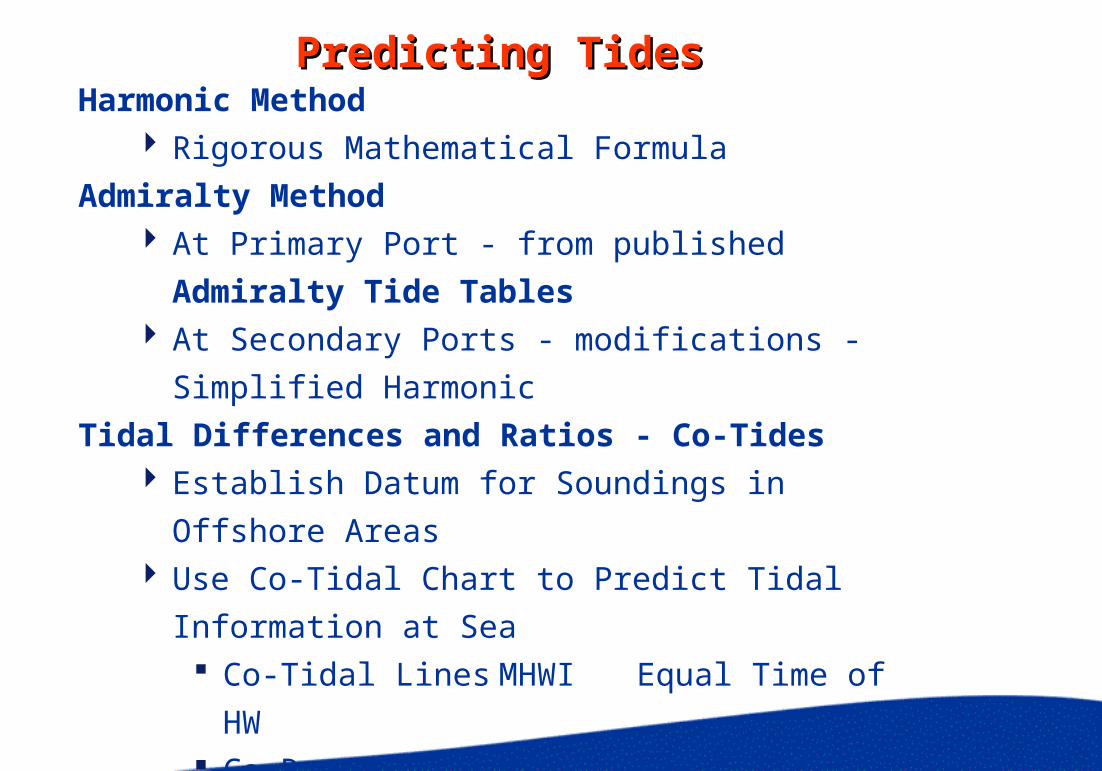
Predicting TidesPredicting TidesHarmonic Method
Rigorous Mathematical Formula
Admiralty Method At Primary Port - from published Admiralty
Tide Tables At Secondary Ports - modifications - Simplified
Harmonic
Tidal Differences and Ratios - Co-Tides Establish Datum for Soundings in Offshore
Areas Use Co-Tidal Chart to Predict Tidal Information
at Sea Co-Tidal Lines MHWI Equal Time of HW Co-Range Lines MSR Equal Tidal Range
Relative to Nearest Standard Port
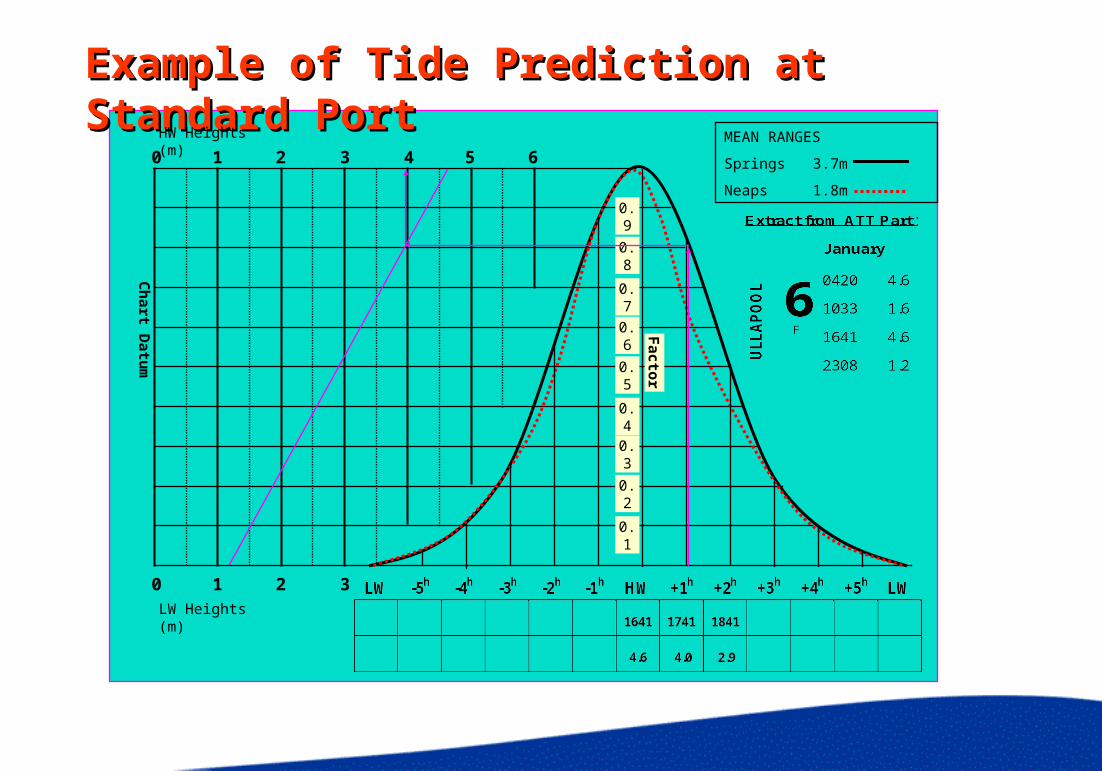
Example of Tide Prediction at Example of Tide Prediction at Standard PortStandard Port
HW Heights (m)
LW Heights (m)
0 1 2 3
0 1 2 3 4 5 6MEAN RANGES
Springs 3.7m
Neaps 1.8m
Ch
art Datu
m
0.9
0.8
0.7
0.6
0.5
0.4
0.3
0.2
0.1
Factor
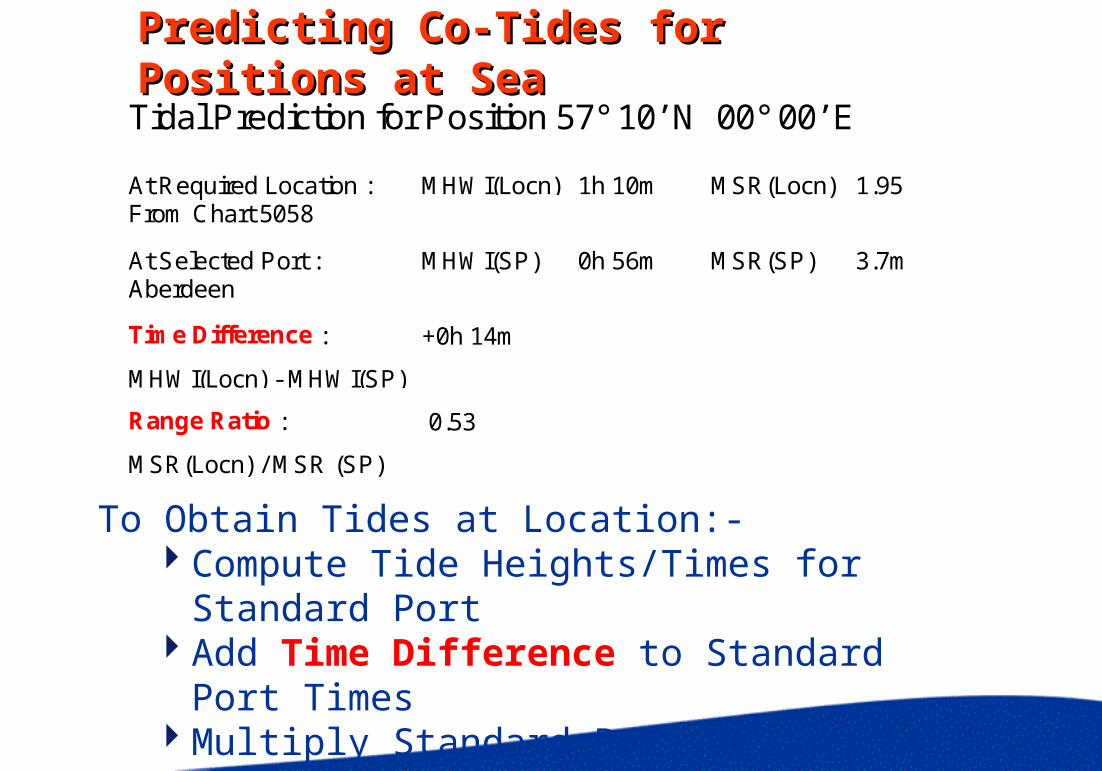
Predicting Co-Tides for Positions Predicting Co-Tides for Positions at Seaat Sea
Tidal Prediction for Position 57° 10’ N 00° 00’ E
At Required Location :From Chart 5058
MHWI(Locn) 1h 10m MSR(Locn) 1.95
At Selected Port :Aberdeen
MHWI(SP) 0h 56m MSR(SP) 3.7m
Time Difference :
MHWI(Locn) - MHWI(SP)
+0h 14m
Range Ratio :
MSR(Locn) / MSR (SP)
0.53
To Obtain Tides at Location:- Compute Tide Heights/Times for
Standard Port Add Time Difference to Standard Port
Times Multiply Standard Port Heights by
Range Ratio
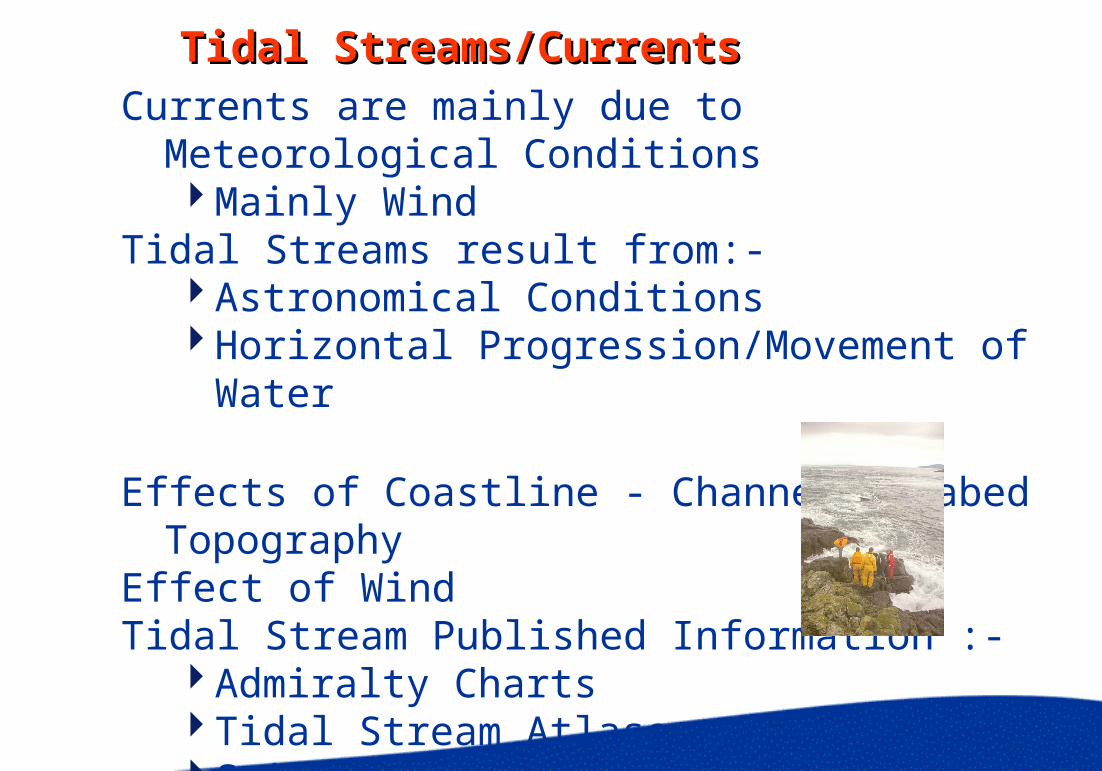
Tidal Streams/CurrentsTidal Streams/CurrentsCurrents are mainly due to Meteorological
ConditionsMainly Wind
Tidal Streams result from:-Astronomical ConditionsHorizontal Progression/Movement of
Water
Effects of Coastline - Channels/Seabed Topography
Effect of WindTidal Stream Published Information :-
Admiralty ChartsTidal Stream AtlasesSailing Directions
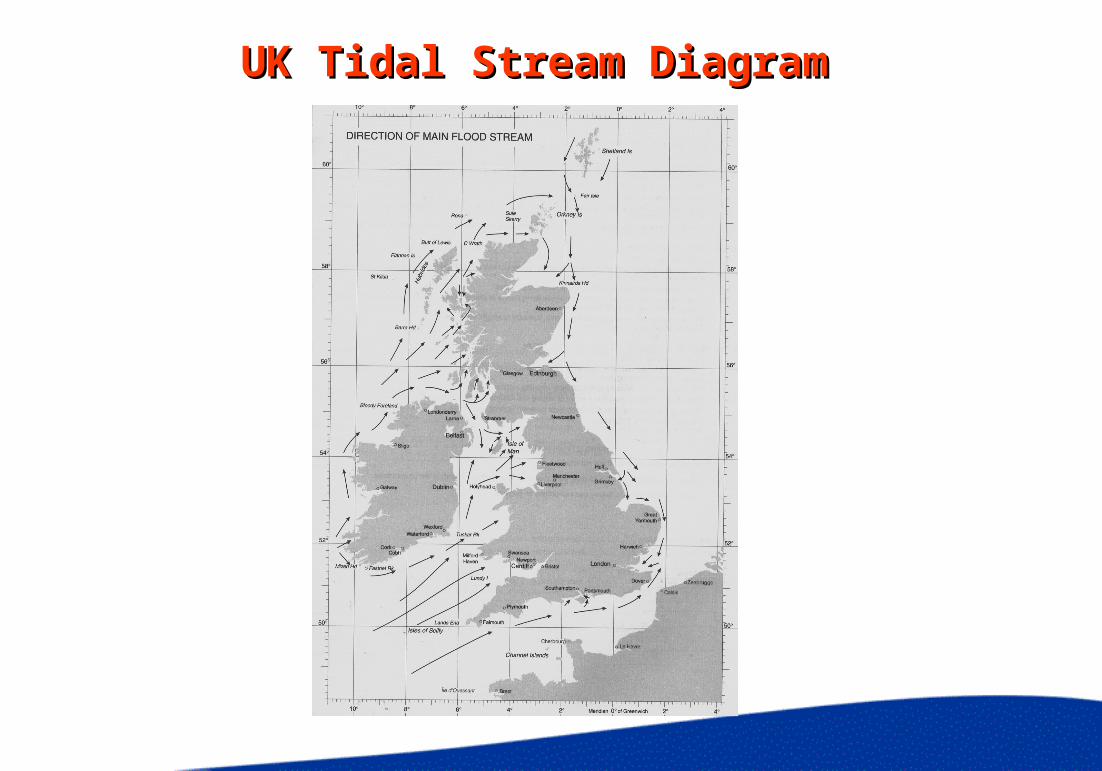
UK Tidal Stream DiagramUK Tidal Stream Diagram
Tidal Stream PredictionTidal Stream Prediction
From Admiralty Tide TablesTide Stream DiamondsTable of Velocities and DirectionsRelated to Time of HW at Local
Standard Port
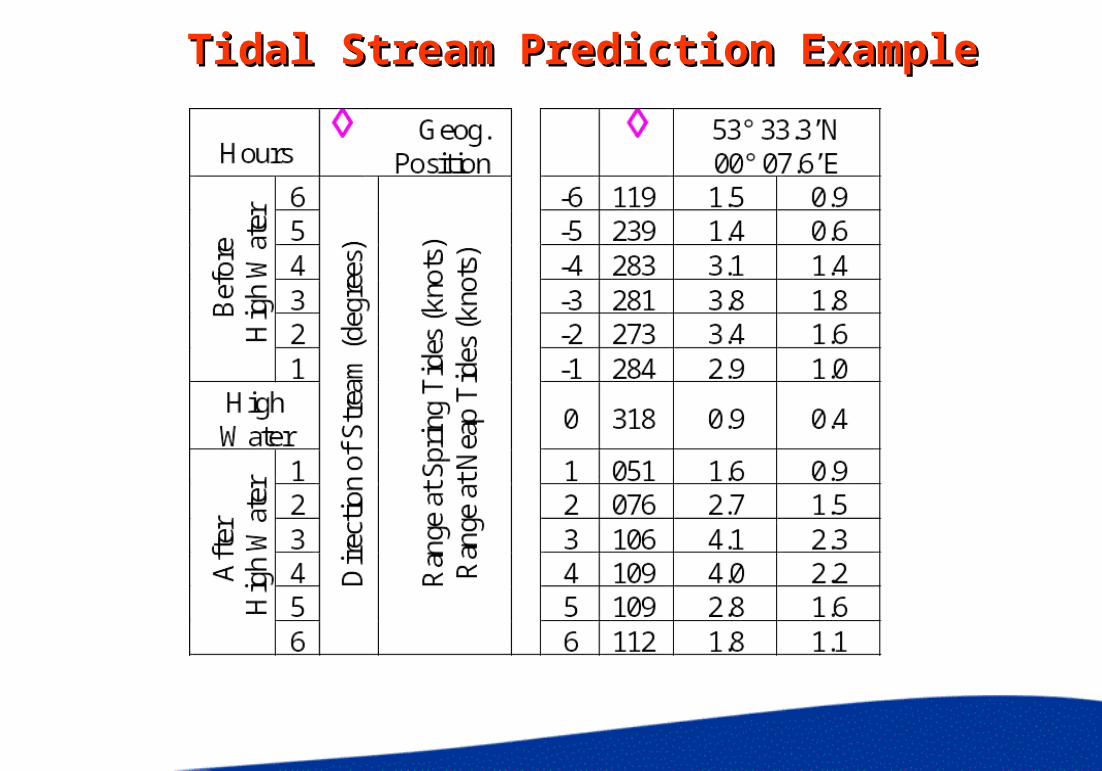
Tidal Stream Prediction ExampleTidal Stream Prediction Example
Tides - More informationTides - More information
www.nbi.ac.uk/home/insight/tidefaq.html
www.nbi.ac.uk/home/insight/tideinfo.html
www.murorum.demon.co.uk/sailing