Embed Size (px)
Citation preview
Marine Transportation System Performance Measures
Executive Summary
U.S. Committee on the Marine Transportation System
Office of the Executive Secretariat
1200 New Jersey Ave SE. Washington, D.C. 20590
Prepared by The CMTS Research and Development Integrated Action Team
Contributors & Editors
M. Kress, N. Mitchell, P. DiJoseph, J.S. Rainey, M. Chambers, J. Hsieh, W.J. Lillycrop, M.
Boatman, N. Comeaux, R. Endorf, P. Mutschler, H. Brohl
Description
This document summarizes the work in the technical report Marine Transportation System Performance
Measures Research published by the U.S. Army Engineer Research and Development Center as well as
ongoing efforts in marine transportation system performance measures research being carried out
through the work of the CMTS Research & Development Integrated Action Team. Full technical report
available at: http://www.erdc.usace.army.mil/Library.aspx
This document should be cited as follows
U.S. Committee on the Marine Transportation System, Research and Development Integrated Action
Team. 2015. Marine Transportation System Performance Measures: Executive Summary. 29 pages.
Washington, D.C. Available at: www.cmts.gov
Contents
Introduction .................................................................................................................................................. 3
Purpose ................................................................................................................................................. 3
MTS Performance Categories and Measures ............................................................................................... 4
Definition of Performance Measure ............................................................................................................. 6
The MTS as Part of the Intermodal Freight System .............................................................................. 7
MTS Performance Measures By Category .................................................................................................... 9
Vessel Travel Time Statistics – Dwell time example ................................................................................... 24
Summary and Recommendations ............................................................................................................... 25
References .................................................................................................................................................. 26
3
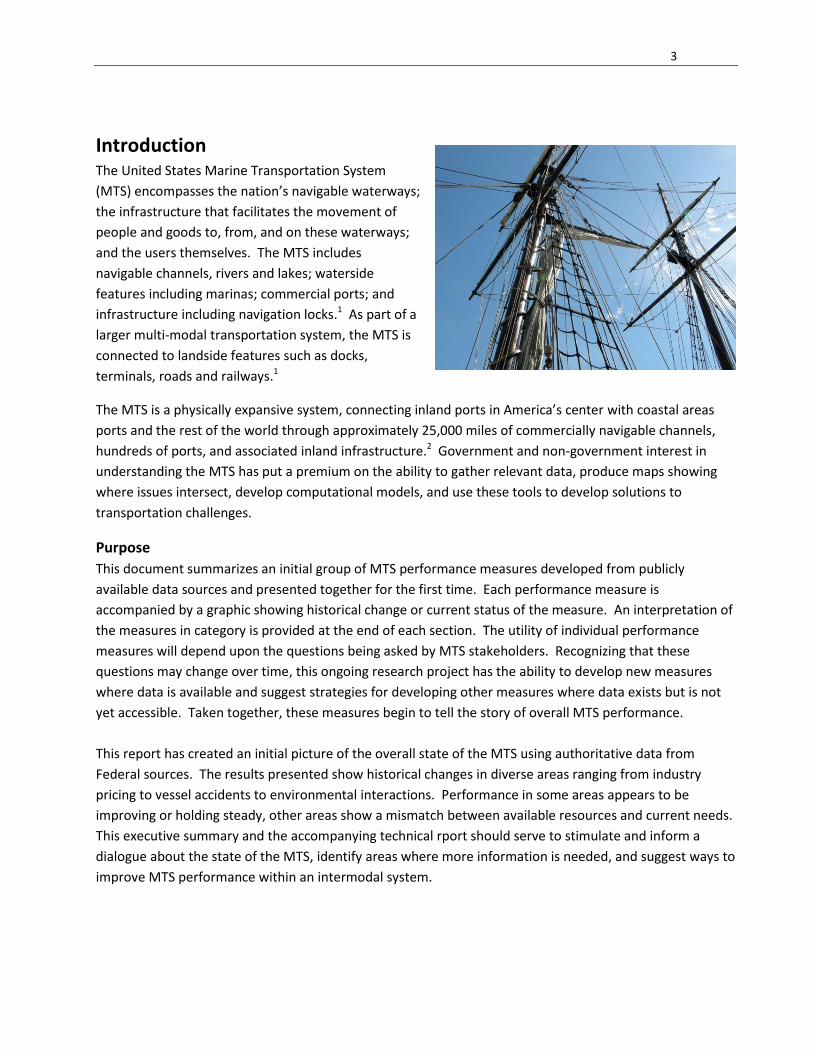
Introduction The United States Marine Transportation System
(MTS) encompasses the nation’s navigable waterways;
the infrastructure that facilitates the movement of
people and goods to, from, and on these waterways;
and the users themselves. The MTS includes
navigable channels, rivers and lakes; waterside
features including marinas; commercial ports; and
infrastructure including navigation locks.1 As part of a
larger multi-modal transportation system, the MTS is
connected to landside features such as docks,
terminals, roads and railways.1
The MTS is a physically expansive system, connecting inland ports in America’s center with coastal areas
ports and the rest of the world through approximately 25,000 miles of commercially navigable channels,
hundreds of ports, and associated inland infrastructure.2 Government and non-government interest in
understanding the MTS has put a premium on the ability to gather relevant data, produce maps showing
where issues intersect, develop computational models, and use these tools to develop solutions to
transportation challenges.
Purpose
This document summarizes an initial group of MTS performance measures developed from publicly
available data sources and presented together for the first time. Each performance measure is
accompanied by a graphic showing historical change or current status of the measure. An interpretation of
the measures in category is provided at the end of each section. The utility of individual performance
measures will depend upon the questions being asked by MTS stakeholders. Recognizing that these
questions may change over time, this ongoing research project has the ability to develop new measures
where data is available and suggest strategies for developing other measures where data exists but is not
yet accessible. Taken together, these measures begin to tell the story of overall MTS performance.
This report has created an initial picture of the overall state of the MTS using authoritative data from
Federal sources. The results presented show historical changes in diverse areas ranging from industry
pricing to vessel accidents to environmental interactions. Performance in some areas appears to be
improving or holding steady, other areas show a mismatch between available resources and current needs.
This executive summary and the accompanying technical rport should serve to stimulate and inform a
dialogue about the state of the MTS, identify areas where more information is needed, and suggest ways to
improve MTS performance within an intermodal system.
4
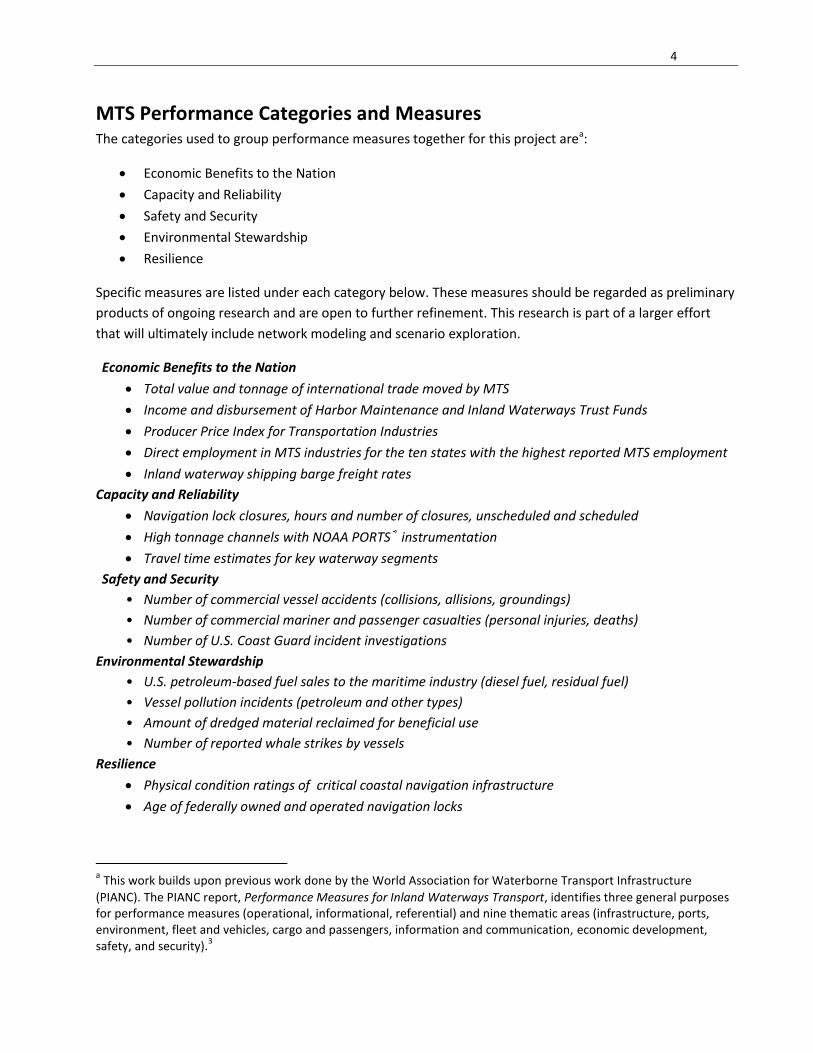
MTS Performance Categories and Measures The categories used to group performance measures together for this project area:
Economic Benefits to the Nation
Capacity and Reliability
Safety and Security
Environmental Stewardship
Resilience
Specific measures are listed under each category below. These measures should be regarded as preliminary
products of ongoing research and are open to further refinement. This research is part of a larger effort
that will ultimately include network modeling and scenario exploration.
Economic Benefits to the Nation
Total value and tonnage of international trade moved by MTS
Income and disbursement of Harbor Maintenance and Inland Waterways Trust Funds
Producer Price Index for Transportation Industries
Direct employment in MTS industries for the ten states with the highest reported MTS employment
Inland waterway shipping barge freight rates
Capacity and Reliability
Navigation lock closures, hours and number of closures, unscheduled and scheduled
High tonnage channels with NOAA PORTS® instrumentation
Travel time estimates for key waterway segments
Safety and Security
• Number of commercial vessel accidents (collisions, allisions, groundings)
• Number of commercial mariner and passenger casualties (personal injuries, deaths)
• Number of U.S. Coast Guard incident investigations
Environmental Stewardship
• U.S. petroleum-based fuel sales to the maritime industry (diesel fuel, residual fuel)
• Vessel pollution incidents (petroleum and other types)
• Amount of dredged material reclaimed for beneficial use
• Number of reported whale strikes by vessels
Resilience
Physical condition ratings of critical coastal navigation infrastructure
Age of federally owned and operated navigation locks
a This work builds upon previous work done by the World Association for Waterborne Transport Infrastructure
(PIANC). The PIANC report, Performance Measures for Inland Waterways Transport, identifies three general purposes for performance measures (operational, informational, referential) and nine thematic areas (infrastructure, ports, environment, fleet and vehicles, cargo and passengers, information and communication, economic development, safety, and security).
3
5
The combination of institutional knowledge along with technologies in real-time and remote monitoring
offers opportunities to identify system inefficiencies and potential improvements and make strategic
investments to enhance MTS performance. Federal agencies, including those that might not see
themselves as ‘basic science’ agencies or producers of basic research, may benefit from the recognizing
that availability of raw material, in the form of extensive data, can place them at the forefront of systems
operation research and/or applications. However, an emphasis on enhanced sharing and inter-operability
of data is essential.
The very act of gathering, synthesizing, and analyzing such information and relating it to
performance should prompt more critical thinking about the scope and effect of Federal
involvement in the MTS.44
- Committee for a Study of the Federal Role in the Marine Transportation System, Transportation
Research Board of the National Academies.
6
Definition of Performance Measure Measures, indicators, metrics – these words are often used
interchangeably, but the desired result is the same, to
understand how elements are functioning within a larger
complex system such as an international supply chainb.
Performance measurement is a process to evaluate the
relationship between inputs and outputs within the structure
of a specific system and subsequently identify areas of
possible improvement. Brydia et al. (2007) stated that well-
designed performance measures should be the following 6:
Reflective of the end result, the measure should help
determine if a goal is being met
Simple, understandable, unambiguous, accepted and
meaningful to the customer
Responsive or sensitive to the data being measured
Appropriate temporal and geographic scales
An ideal MTS performance measure would be collected
locally, using the same method across all areas of
responsibility, so that state, regional, and national summaries
could be easily compiled for comparison.
It is important to distinguish between output measures and
outcome-based measures. Output-based measures identify
information about the use of resources.6 Examples of MTS related output measures could include number
of containers loaded and unloaded at a port, amount of sediment removed from a channel, or vessel
inspections completed by regulators. Outcome-based measures identify how well an organization is
meeting stated goals and objectives; these types of measures are often more relevant to the general
public.6 Examples of MTS outcome-based measures include number of vessel accidents, average tons per
vessel transported (through a channel), and average travel time between two ports. Both output and
outcome-based measures are necessary to evaluate a system; they work in tandem to support analysis of
how a system’s structure is contributing to its functional goals.
b Transport Canada, the Federal Canadian transportation agency, has developed a data-sharing partnership between
the Canadian Government and private sector freight carriers to report transit times for different modal segments
(ocean voyage, port dwell time, drayage, truck transit, rail transit, shipment via inland waterways).4 Performance is
measured as the time it takes a shipping container to complete each pre-defined segment of the journey, known as a
‘fluidity’ measure. These data are being used by Canadian provincial governments to identify specific delay points,
such as on-grade road and rail crossings, for investments to upgrade infrastructure.5
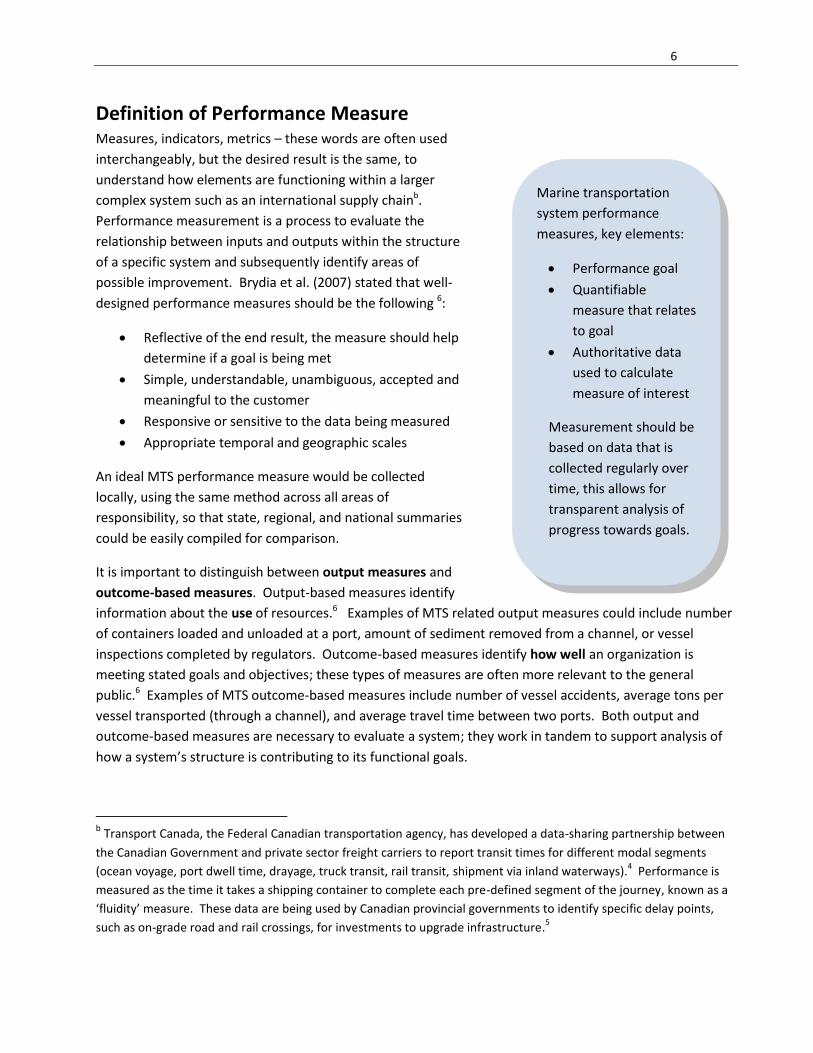
Marine transportation
system performance
measures, key elements:
Performance goal
Quantifiable
measure that relates
to goal
Authoritative data
used to calculate
measure of interest
Measurement should be
based on data that is
collected regularly over
time, this allows for
transparent analysis of
progress towards goals.
7
Output and outcome measures can serve more than one purpose depending on the user group. Measures
that can be used for multiple purposes should take a higher priority. For example, ‘fuel use’ is a single
performance measure with relevance for operations (cost of running equipment), information (air
emissions associated with operationsc), while also serving a reference purposes (tracking demand changes
over time). This example demonstrates how a single measure can be both output-related and outcome-
related depending on the context and question of interest. Performance data for historical and current
operating conditions is key for developing a commonly shared baseline picture of the MTS.
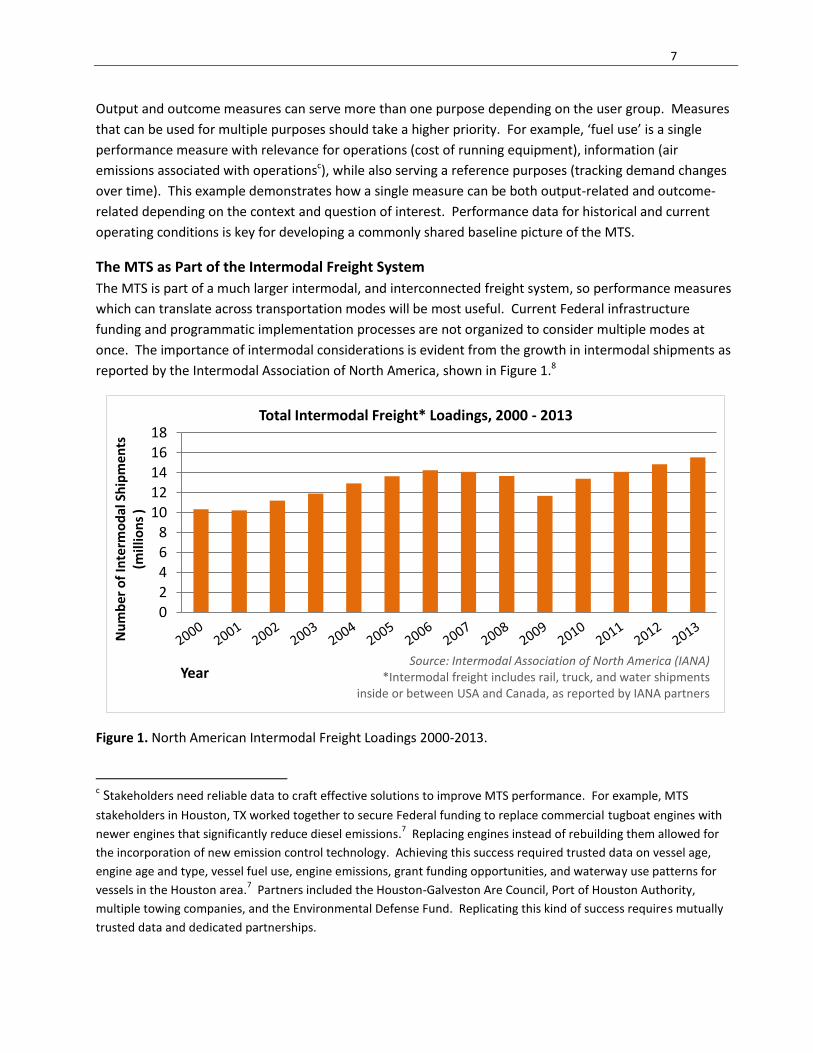
The MTS as Part of the Intermodal Freight System
The MTS is part of a much larger intermodal, and interconnected freight system, so performance measures
which can translate across transportation modes will be most useful. Current Federal infrastructure
funding and programmatic implementation processes are not organized to consider multiple modes at
once. The importance of intermodal considerations is evident from the growth in intermodal shipments as
reported by the Intermodal Association of North America, shown in Figure 1.8
Figure 1. North American Intermodal Freight Loadings 2000-2013.
c Stakeholders need reliable data to craft effective solutions to improve MTS performance. For example, MTS
stakeholders in Houston, TX worked together to secure Federal funding to replace commercial tugboat engines with
newer engines that significantly reduce diesel emissions.7 Replacing engines instead of rebuilding them allowed for
the incorporation of new emission control technology. Achieving this success required trusted data on vessel age,
engine age and type, vessel fuel use, engine emissions, grant funding opportunities, and waterway use patterns for
vessels in the Houston area.7 Partners included the Houston-Galveston Are Council, Port of Houston Authority,
multiple towing companies, and the Environmental Defense Fund. Replicating this kind of success requires mutually
trusted data and dedicated partnerships.
0 2 4 6 8
10 12 14
16 18
Nu
mb
er o
f In
term
od
al S
hip
me
nts
(m
illio
ns
)
Year
Total Intermodal Freight* Loadings, 2000 - 2013
Source: Intermodal Association of North America (IANA) *Intermodal freight includes rail, truck, and water shipments
inside or between USA and Canada, as reported by IANA partners
8
Several high profile supply chain disruptions in 2011 (notably the inland flooding in Thailand and tsunami
with resulting power outages in Japan) focused a spotlight on the complex interdependencies of global
supply chains and the need to improve the resiliency of these supply chains and the associated freight
networks on which global and domestic commerce depends.9; 10 This renewed focus on the intermodal
freight system and the smooth functioning of supply chains lends support for the development of MTS
performance measures.
Performance Measurement Benefits From Open Data
Ready access to data is vital for accurate performance measures across a system as complex as the MTS.
For Federal agencies with a role in the MTS, making data available is simply the first step in contributing to
a truly transparent evaluation process. Presidential Executive Order 13642 released in 2013 directs offices
in the Executive Branch to make open data and machine readable data the new default for government
information.11 ‘Open data’ is the practice of regularly releasing data in widely accessible file formats
through a website. Machine readable data refers to specific computer file formats used in conjunction with
web services. Machine readable data is essential for projects that use automation for processing large
amounts of data. Promoting open and machine readable data across Federal agencies will enhance the
ability to develop targeted performance measures over time. By plugging in to the different streams of
information which will flow into the public domain as a regular part of agency missions, there will be
greater opportunity to combine disparate types of data to increase their informational power.
Performance indicators help participants to understand strengths and weaknesses within their
organizations and institutions. They also help assist in identifying measures that can be
implemented to counteract undesirable developments.
- PIANC Inland Navigation Commission, Working Group 32
9
MTS Performance Measures By Category
Economic Benefits to the Nation
Total Value and Tonnage of International Trade Moved by the MTS
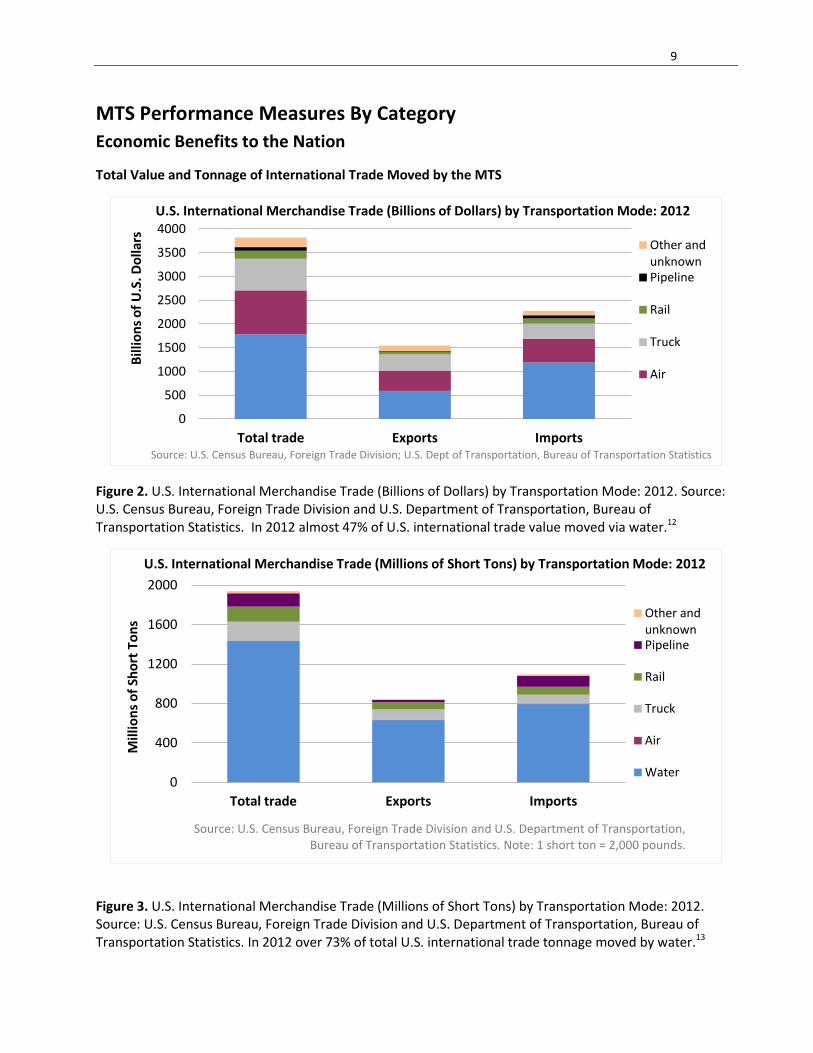
Figure 2. U.S. International Merchandise Trade (Billions of Dollars) by Transportation Mode: 2012. Source: U.S. Census Bureau, Foreign Trade Division and U.S. Department of Transportation, Bureau of Transportation Statistics. In 2012 almost 47% of U.S. international trade value moved via water.12
Figure 3. U.S. International Merchandise Trade (Millions of Short Tons) by Transportation Mode: 2012. Source: U.S. Census Bureau, Foreign Trade Division and U.S. Department of Transportation, Bureau of Transportation Statistics. In 2012 over 73% of total U.S. international trade tonnage moved by water.13
0
500
1000
1500
2000
2500
3000
3500
4000
Total trade Exports Imports
Bill
ion
s o
f U
.S. D
olla
rs
Other and unknown Pipeline
Rail
Truck
Air
U.S. International Merchandise Trade (Billions of Dollars) by Transportation Mode: 2012
Source: U.S. Census Bureau, Foreign Trade Division; U.S. Dept of Transportation, Bureau of Transportation Statistics
0
400
800
1200
1600
2000
Total trade Exports Imports
Mill
ion
s o
f Sh
ort
To
ns
Other and unknown Pipeline
Rail
Truck
Air
Water
U.S. International Merchandise Trade (Millions of Short Tons) by Transportation Mode: 2012
Source: U.S. Census Bureau, Foreign Trade Division and U.S. Department of Transportation, Bureau of Transportation Statistics. Note: 1 short ton = 2,000 pounds.

10
U.S. Export and Import Value Transported via Water: 2007-2013
Figure 4. U.S. Export and Import Value Transported by Vessel: 2007-2013. Source: U.S. Department of Commerce; U.S. Census Bureau. The value of imports and exports moved by water has surpassed pre-recession levels.
U.S. Export and Import Shipping Weight Transported via Water: 2007-2013
Figure 5. U.S. Export and Import Value and Shipping Weight Transported by Vessel: 2007-2013. Source: U.S. Department of Commerce; U.S. Census Bureau; Foreign Trade Division; FT920 - U.S. Merchandise Trade: Selected Highlights (annual issues); tables 1, 4, or 6.14
$0
$200,000
$400,000
$600,000
$800,000
$1,000,000
$1,200,000
$1,400,000
2007 2008 2009 2010 2011 2012 2013
Mill
ion
s o
f U
.S. D
oll
ars
U.S. Export and Import Value Transported via Water: 2007-2013
Exports Imports
Source: U.S. Department of Commerce; U.S. Census Bureau; Foreign Trade Division; FT920 - U.S. Merchandise Trade: Selected Highlights (annual issues); tables 1, 4, or 6.
0
100,000
200,000
300,000
400,000
500,000
600,000
700,000
800,000
900,000
1,000,000
2007 2008 2009 2010 2011 2012 2013
Mill
ion
s o
f K
ilogr
ams
Exports Imports
U.S. Export and Import Shipping Weight Transported via Water: 2007-2013
Source: U.S. Department of Commerce; U.S. Census Bureau; Foreign Trade Division; FT920 - U.S. Merchandise Trade: Selected Highlights (annual issues); tables 1, 4, or 6
11
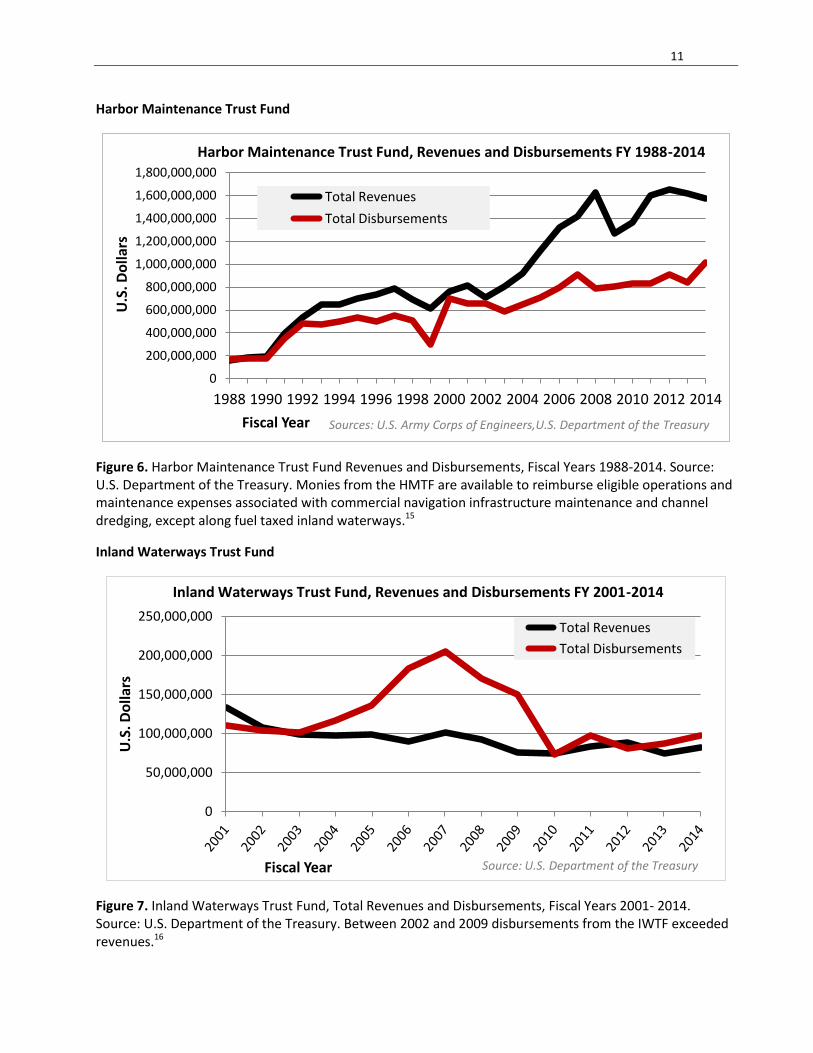
Harbor Maintenance Trust Fund
Figure 6. Harbor Maintenance Trust Fund Revenues and Disbursements, Fiscal Years 1988-2014. Source: U.S. Department of the Treasury. Monies from the HMTF are available to reimburse eligible operations and maintenance expenses associated with commercial navigation infrastructure maintenance and channel dredging, except along fuel taxed inland waterways.15
Inland Waterways Trust Fund
Figure 7. Inland Waterways Trust Fund, Total Revenues and Disbursements, Fiscal Years 2001- 2014. Source: U.S. Department of the Treasury. Between 2002 and 2009 disbursements from the IWTF exceeded revenues.16
0
200,000,000
400,000,000
600,000,000
800,000,000
1,000,000,000
1,200,000,000
1,400,000,000
1,600,000,000
1,800,000,000
1988 1990 1992 1994 1996 1998 2000 2002 2004 2006 2008 2010 2012 2014
U.S
. Do
llar
s
Fiscal Year
Total Revenues
Total Disbursements
Sources: U.S. Army Corps of Engineers,U.S. Department of the Treasury
Harbor Maintenance Trust Fund, Revenues and Disbursements FY 1988-2014
0
50,000,000
100,000,000
150,000,000
200,000,000
250,000,000
U.S
. Do
llars
Fiscal Year
Total Revenues
Total Disbursements
Source: U.S. Department of the Treasury
Inland Waterways Trust Fund, Revenues and Disbursements FY 2001-2014
12
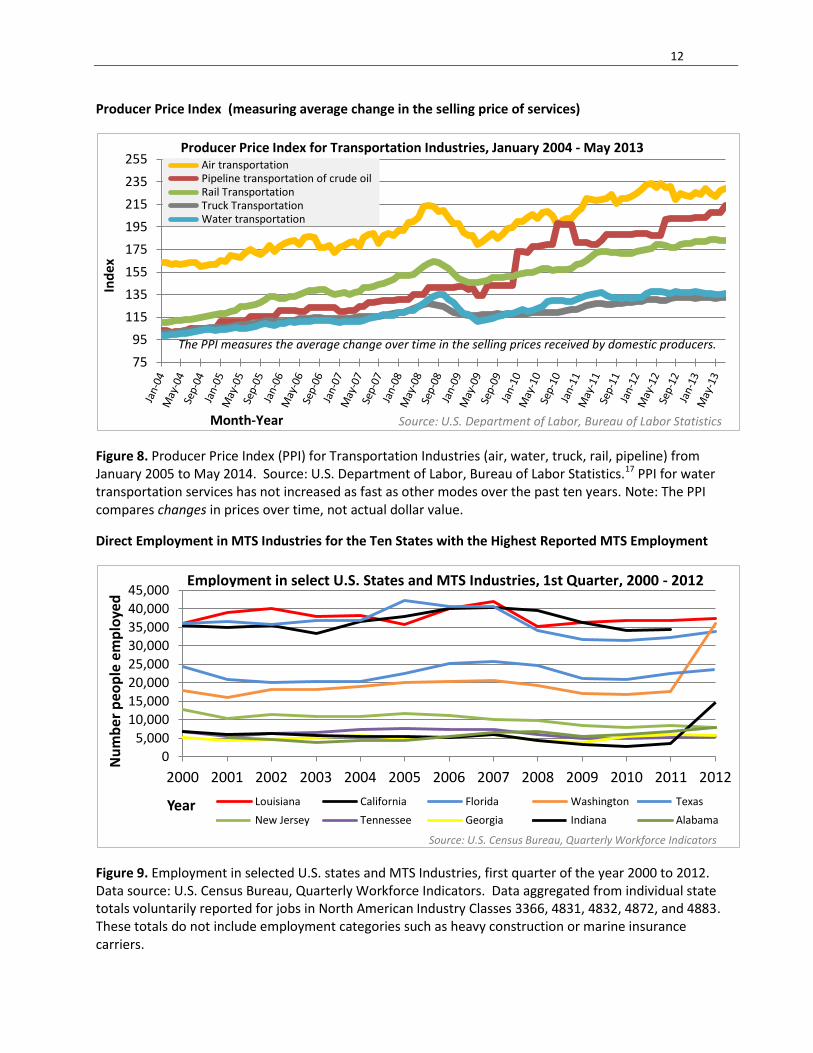
Producer Price Index (measuring average change in the selling price of services)
Figure 8. Producer Price Index (PPI) for Transportation Industries (air, water, truck, rail, pipeline) from January 2005 to May 2014. Source: U.S. Department of Labor, Bureau of Labor Statistics.17 PPI for water transportation services has not increased as fast as other modes over the past ten years. Note: The PPI compares changes in prices over time, not actual dollar value.
Direct Employment in MTS Industries for the Ten States with the Highest Reported MTS Employment
Figure 9. Employment in selected U.S. states and MTS Industries, first quarter of the year 2000 to 2012. Data source: U.S. Census Bureau, Quarterly Workforce Indicators. Data aggregated from individual state totals voluntarily reported for jobs in North American Industry Classes 3366, 4831, 4832, 4872, and 4883. These totals do not include employment categories such as heavy construction or marine insurance carriers.
75
95
115
135
155
175
195
215
235
255
Ind
ex
Month-Year
Air transportation Pipeline transportation of crude oil Rail Transportation Truck Transportation Water transportation
The PPI measures the average change over time in the selling prices received by domestic producers.
Source: U.S. Department of Labor, Bureau of Labor Statistics
Producer Price Index for Transportation Industries, January 2004 - May 2013
0
5,000
10,000
15,000
20,000
25,000
30,000
35,000
40,000
45,000
2000 2001 2002 2003 2004 2005 2006 2007 2008 2009 2010 2011 2012
Nu
mb
er p
eop
le e
mp
loye
d
Year Louisiana California Florida Washington Texas
New Jersey Tennessee Georgia Indiana Alabama
Source: U.S. Census Bureau, Quarterly Workforce Indicators
Employment in select U.S. States and MTS Industries, 1st Quarter, 2000 - 2012
13
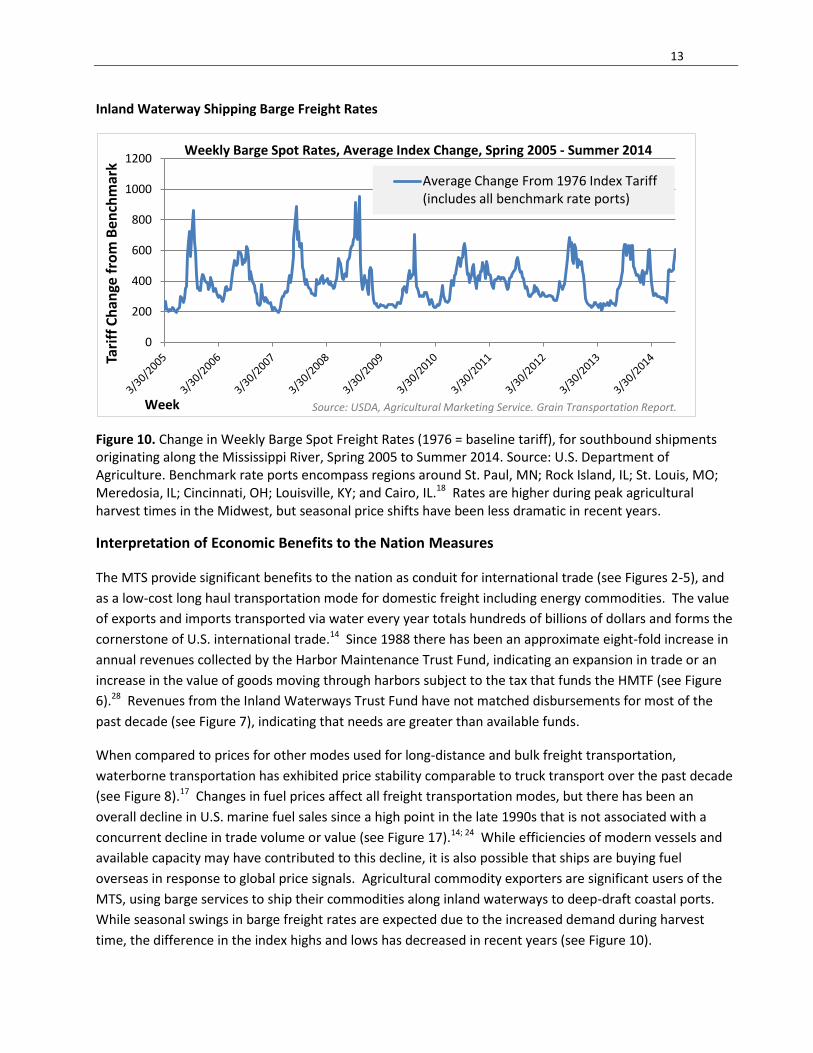
Inland Waterway Shipping Barge Freight Rates
Figure 10. Change in Weekly Barge Spot Freight Rates (1976 = baseline tariff), for southbound shipments originating along the Mississippi River, Spring 2005 to Summer 2014. Source: U.S. Department of Agriculture. Benchmark rate ports encompass regions around St. Paul, MN; Rock Island, IL; St. Louis, MO; Meredosia, IL; Cincinnati, OH; Louisville, KY; and Cairo, IL.18 Rates are higher during peak agricultural harvest times in the Midwest, but seasonal price shifts have been less dramatic in recent years.
Interpretation of Economic Benefits to the Nation Measures
The MTS provide significant benefits to the nation as conduit for international trade (see Figures 2-5), and
as a low-cost long haul transportation mode for domestic freight including energy commodities. The value
of exports and imports transported via water every year totals hundreds of billions of dollars and forms the
cornerstone of U.S. international trade.14 Since 1988 there has been an approximate eight-fold increase in
annual revenues collected by the Harbor Maintenance Trust Fund, indicating an expansion in trade or an
increase in the value of goods moving through harbors subject to the tax that funds the HMTF (see Figure
6).28 Revenues from the Inland Waterways Trust Fund have not matched disbursements for most of the
past decade (see Figure 7), indicating that needs are greater than available funds.
When compared to prices for other modes used for long-distance and bulk freight transportation,
waterborne transportation has exhibited price stability comparable to truck transport over the past decade
(see Figure 8).17 Changes in fuel prices affect all freight transportation modes, but there has been an
overall decline in U.S. marine fuel sales since a high point in the late 1990s that is not associated with a
concurrent decline in trade volume or value (see Figure 17).14; 24 While efficiencies of modern vessels and
available capacity may have contributed to this decline, it is also possible that ships are buying fuel
overseas in response to global price signals. Agricultural commodity exporters are significant users of the
MTS, using barge services to ship their commodities along inland waterways to deep-draft coastal ports.
While seasonal swings in barge freight rates are expected due to the increased demand during harvest
time, the difference in the index highs and lows has decreased in recent years (see Figure 10).
0
200
400
600
800
1000
1200
Tari
ff C
han
ge f
rom
Ben
chm
ark
Week
Average Change From 1976 Index Tariff (includes all benchmark rate ports)
Source: USDA, Agricultural Marketing Service. Grain Transportation Report.
Weekly Barge Spot Rates, Average Index Change, Spring 2005 - Summer 2014
14
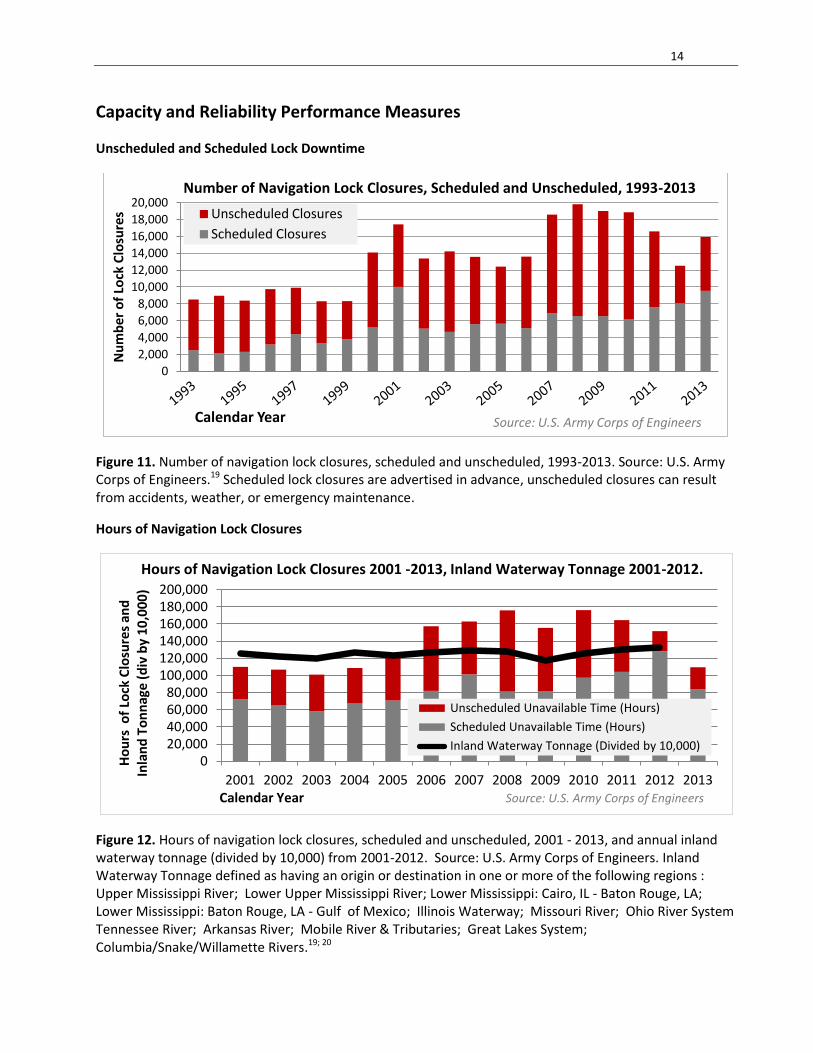
Capacity and Reliability Performance Measures
Unscheduled and Scheduled Lock Downtime
Figure 11. Number of navigation lock closures, scheduled and unscheduled, 1993-2013. Source: U.S. Army Corps of Engineers.19 Scheduled lock closures are advertised in advance, unscheduled closures can result from accidents, weather, or emergency maintenance.
Hours of Navigation Lock Closures
Figure 12. Hours of navigation lock closures, scheduled and unscheduled, 2001 - 2013, and annual inland waterway tonnage (divided by 10,000) from 2001-2012. Source: U.S. Army Corps of Engineers. Inland Waterway Tonnage defined as having an origin or destination in one or more of the following regions : Upper Mississippi River; Lower Upper Mississippi River; Lower Mississippi: Cairo, IL - Baton Rouge, LA; Lower Mississippi: Baton Rouge, LA - Gulf of Mexico; Illinois Waterway; Missouri River; Ohio River System Tennessee River; Arkansas River; Mobile River & Tributaries; Great Lakes System; Columbia/Snake/Willamette Rivers.19; 20
0
2,000
4,000
6,000
8,000
10,000
12,000
14,000
16,000
18,000
20,000
Nu
mb
er o
f Lo
ck C
losu
res
Calendar Year
Unscheduled Closures
Scheduled Closures
Source: U.S. Army Corps of Engineers
Number of Navigation Lock Closures, Scheduled and Unscheduled, 1993-2013
0 20,000 40,000 60,000 80,000
100,000 120,000 140,000 160,000 180,000 200,000
2001 2002 2003 2004 2005 2006 2007 2008 2009 2010 2011 2012 2013 Calendar Year Source: U.S. Army Corps of Engineers
Unscheduled Unavailable Time (Hours)
Scheduled Unavailable Time (Hours)
Inland Waterway Tonnage (Divided by 10,000)
Hours of Navigation Lock Closures 2001 -2013, Inland Waterway Tonnage 2001-2012.
Ho
urs
of
Lock
Clo
sure
s an
d
Inla
nd
To
nn
age
(div
by
10
,00
0)
15
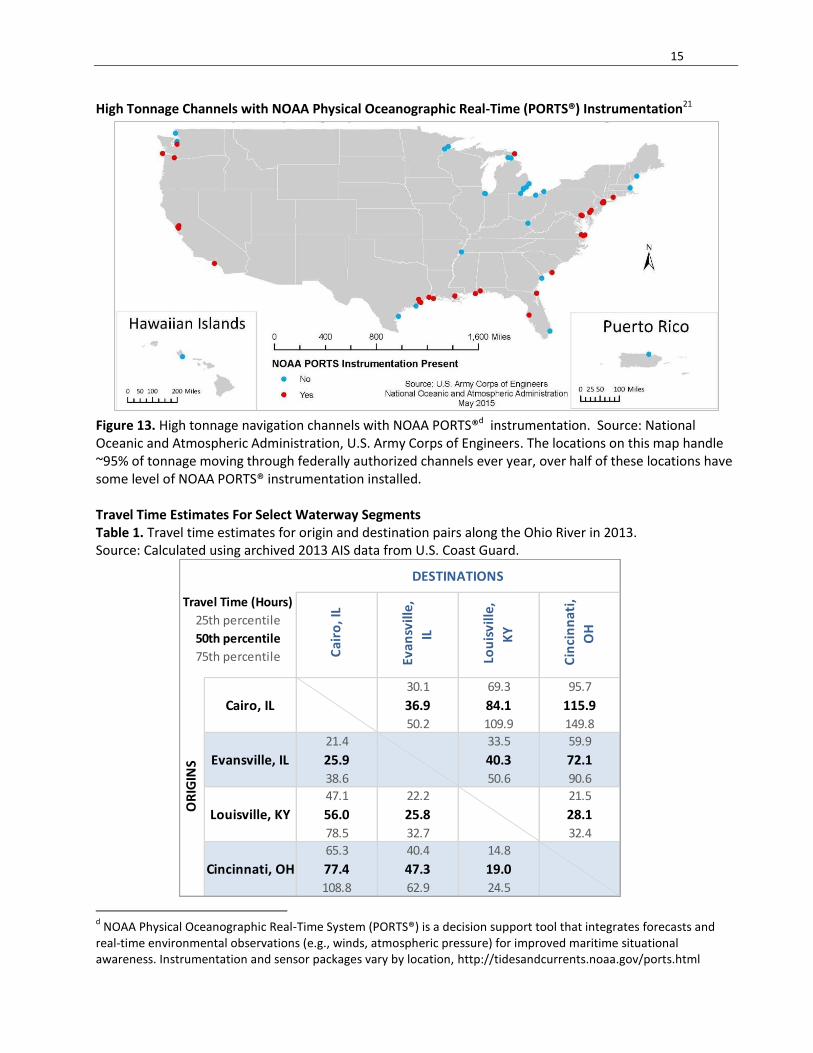
High Tonnage Channels with NOAA Physical Oceanographic Real-Time (PORTS®) Instrumentation21
Figure 13. High tonnage navigation channels with NOAA PORTS®d instrumentation. Source: National Oceanic and Atmospheric Administration, U.S. Army Corps of Engineers. The locations on this map handle ~95% of tonnage moving through federally authorized channels ever year, over half of these locations have some level of NOAA PORTS® instrumentation installed. Travel Time Estimates For Select Waterway Segments Table 1. Travel time estimates for origin and destination pairs along the Ohio River in 2013. Source: Calculated using archived 2013 AIS data from U.S. Coast Guard.
d NOAA Physical Oceanographic Real-Time System (PORTS®) is a decision support tool that integrates forecasts and
real-time environmental observations (e.g., winds, atmospheric pressure) for improved maritime situational awareness. Instrumentation and sensor packages vary by location, http://tidesandcurrents.noaa.gov/ports.html
Cai
ro, I
L
Eva
nsv
ille,
IL
Lo
uis
ville
,
KY
Cin
cin
nat
i,
OH
30.1 69.3 95.7
36.9 84.1 115.950.2 109.9 149.8
21.4 33.5 59.9
25.9 40.3 72.1
38.6 50.6 90.6
47.1 22.2 21.5
56.0 25.8 28.1
78.5 32.7 32.4
65.3 40.4 14.8
77.4 47.3 19.0
108.8 62.9 24.5
Louisville, KY
Cincinnati, OH
DESTINATIONS
Travel Time (Hours)
25th percentile
50th percentile
75th percentile
OR
IGIN
S
Cairo, IL
Evansville, IL
16
Table 1 displays travel time estimates between points of interest, such as port pairs or river locks, in a trip
table format like those used for other transport modes. Work is underway to develop these tables for the
entire MTS, including the inland navigable waterways, the Great Lakes and coastal ports, for multiple years.
Having this historical reference available will assist in the examination of impacts from events (e.g.
drought/flood, unscheduled lock closures) that disrupt commercial traffic movements along major
waterway corridors. Vessel movements in the time around an event can be analyzed to determine their
variation from the expected average travel time, the potential significance of that variation, and long-term
changes in baseline travel times.
Interpretation of Capacity and Reliability Measures
Investments in landside port infrastructure are largely driven by private investors or individual states using
market-based information about current capacity and forecasts of future demand. Public roadway
infrastructure investments made at the state level may affect supply chains that cross state lines. In light of
this interconnectedness, the USDOT is encouraging states to develop freight plans to better incorporate
freight-specific needs into the transportation planning process.29 While there appears to be available
capacity within the maritime side of freight transport, the ability to fully utilize on-water navigation
capacity is tied to existing landside capacities which may be limited at ports or other intermodal exchanges.
In support of navigation safety, which is closely connected to reliability, over half of the 59 high tonnage
areas (port areas that as a group carry 95% of total tonnage) have some type of NOAA PORTS®
instrumentation installed to improve situational awareness for mariners (see Figure 13).21
On inland waterways, the ability of vessels to engage in long-distance transportation is heavily dependent
upon navigation locks; locks which have seen an overall increase in the cumulative duration of closures and
the number of closure events over the past decade (see Figures 11 and 12). Unscheduled closures of
navigation locks are considered more economically disruptive because they reduce or eliminate the
response time available to commercial users. Estimating the immediate cost from a single closure at a
specific lock would depend on multiple factors such as time of year, duration of closure, and number of
shipments delayed. Since 2001 total inland waterway tonnage has varied between 1.2 billion to 1.4 billion
tons per year, indicating a steady demand for this mode of transport.20 There is uncertainty over the scale
of future maintenance needs for inland navigation infrastructure, while the number of lock closures
fluctuates from year to year, any single year from 2000 -2013 had more total closures than any single year
from 1993 – 1999 (see Figure 11), indicating increased maintenance needs. Analysis on the extent and
recurrence of vessel congestion is part of ongoing research in the area of travel time estimates (see Table 1
and Vessel Travel Time Statistics section). Quantifying historical vessel movement patterns can provide
insight into patterns and performance of specific waterway segments, which can be used to plan waterway
maintenance.
17
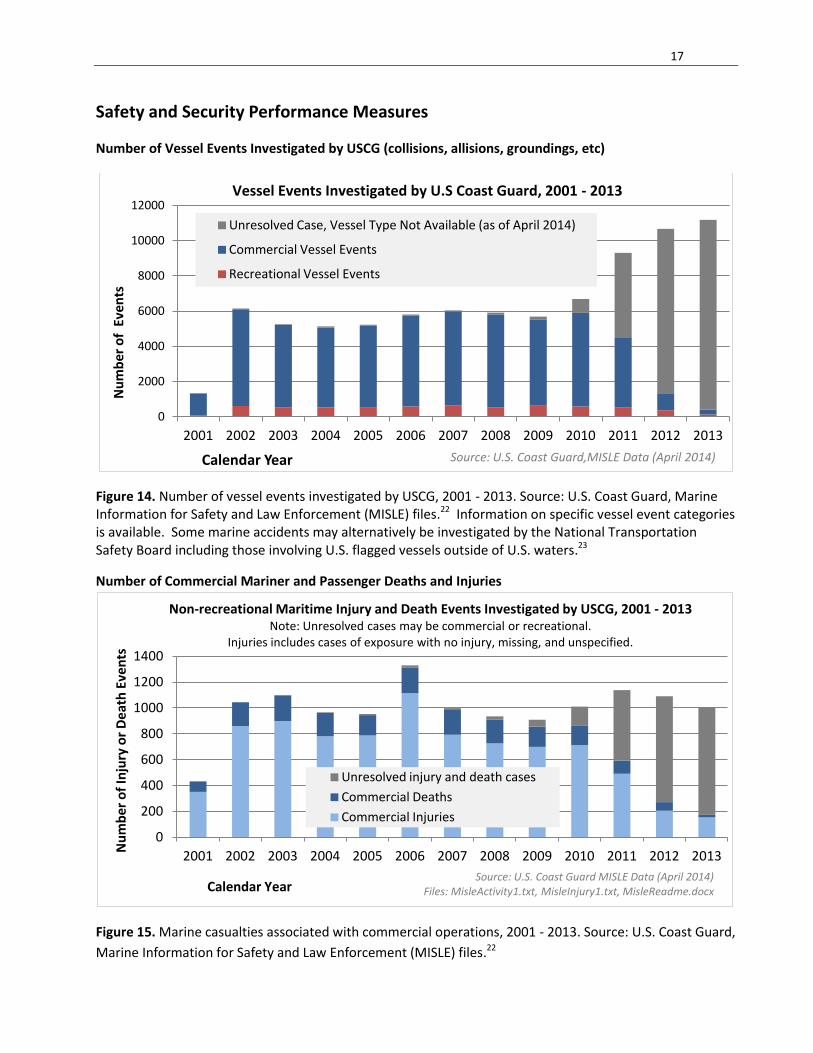
Safety and Security Performance Measures
Number of Vessel Events Investigated by USCG (collisions, allisions, groundings, etc)
Figure 14. Number of vessel events investigated by USCG, 2001 - 2013. Source: U.S. Coast Guard, Marine Information for Safety and Law Enforcement (MISLE) files.22 Information on specific vessel event categories is available. Some marine accidents may alternatively be investigated by the National Transportation Safety Board including those involving U.S. flagged vessels outside of U.S. waters.23
Number of Commercial Mariner and Passenger Deaths and Injuries
Figure 15. Marine casualties associated with commercial operations, 2001 - 2013. Source: U.S. Coast Guard,
Marine Information for Safety and Law Enforcement (MISLE) files.22
0
2000
4000
6000
8000
10000
12000
2001 2002 2003 2004 2005 2006 2007 2008 2009 2010 2011 2012 2013
Calendar Year
Unresolved Case, Vessel Type Not Available (as of April 2014)
Commercial Vessel Events
Recreational Vessel Events
Source: U.S. Coast Guard,MISLE Data (April 2014)
Vessel Events Investigated by U.S Coast Guard, 2001 - 2013
Nu
mb
er o
f E
ven
ts
0
200
400
600
800
1000
1200
1400
2001 2002 2003 2004 2005 2006 2007 2008 2009 2010 2011 2012 2013
Nu
mb
er o
f In
jury
or
De
ath
Eve
nts
Calendar Year
Unresolved injury and death cases
Commercial Deaths
Commercial Injuries
Source: U.S. Coast Guard MISLE Data (April 2014) Files: MisleActivity1.txt, MisleInjury1.txt, MisleReadme.docx
Non-recreational Maritime Injury and Death Events Investigated by USCG, 2001 - 2013 Note: Unresolved cases may be commercial or recreational.
Injuries includes cases of exposure with no injury, missing, and unspecified.
18
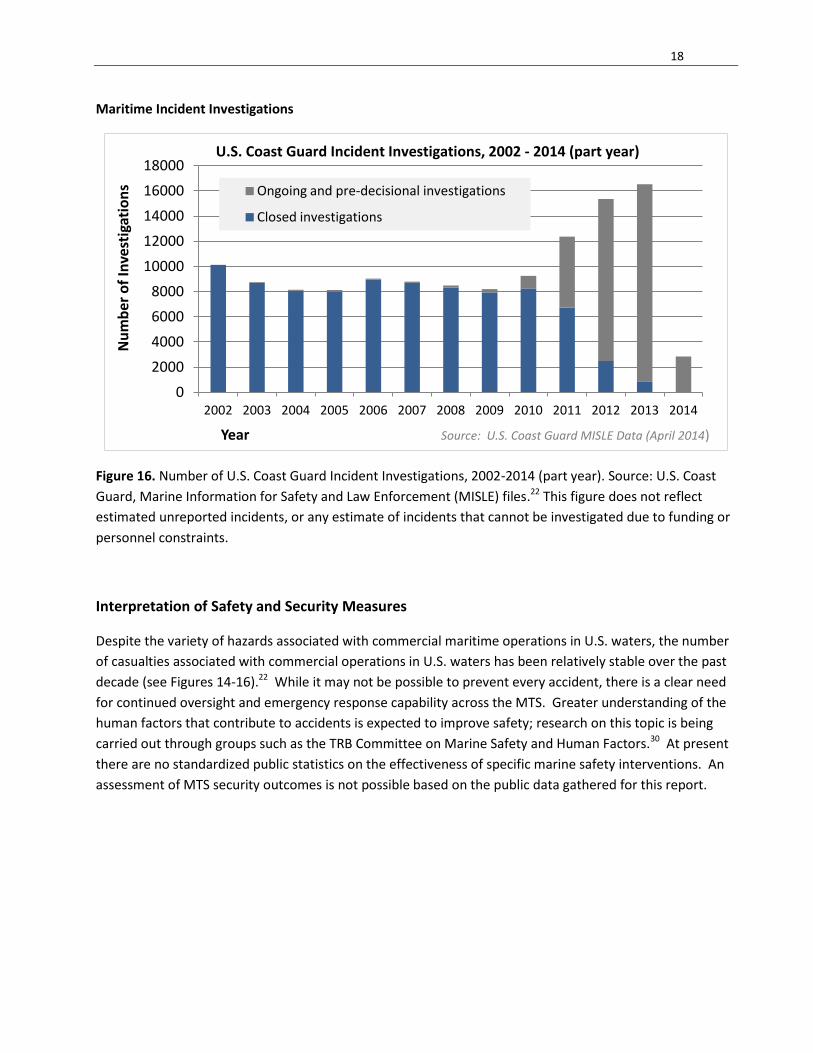
Maritime Incident Investigations
Figure 16. Number of U.S. Coast Guard Incident Investigations, 2002-2014 (part year). Source: U.S. Coast
Guard, Marine Information for Safety and Law Enforcement (MISLE) files.22 This figure does not reflect
estimated unreported incidents, or any estimate of incidents that cannot be investigated due to funding or
personnel constraints.
Interpretation of Safety and Security Measures
Despite the variety of hazards associated with commercial maritime operations in U.S. waters, the number
of casualties associated with commercial operations in U.S. waters has been relatively stable over the past
decade (see Figures 14-16).22 While it may not be possible to prevent every accident, there is a clear need
for continued oversight and emergency response capability across the MTS. Greater understanding of the
human factors that contribute to accidents is expected to improve safety; research on this topic is being
carried out through groups such as the TRB Committee on Marine Safety and Human Factors.30 At present
there are no standardized public statistics on the effectiveness of specific marine safety interventions. An
assessment of MTS security outcomes is not possible based on the public data gathered for this report.
0
2000
4000
6000
8000
10000
12000
14000
16000
18000
2002 2003 2004 2005 2006 2007 2008 2009 2010 2011 2012 2013 2014
Nu
mb
er o
f In
vest
igat
ion
s
Year Source: U.S. Coast Guard MISLE Data (April 2014)
Ongoing and pre-decisional investigations
Closed investigations
U.S. Coast Guard Incident Investigations, 2002 - 2014 (part year)
19
Environmental Stewardship Performance Measures
U.S. Petroleum-Based Fuel Sales to the Maritime Industry
Figure 17. U.S. Distillate Fuel Oil Sales to Vessel Bunkering Consumers, 1984 - 2012. Source: U.S. Department of Energy.24 Annual data on petroleum fuels sales to vessel bunkering consumers is available at the national level, this figure shows a general downward trend in fuel sales since 1998.
Vessel Pollution Incidents (petroleum and other types)
Figure 18. Recorded Vessel Pollution Incidents, 2000 – 2013. Source: U.S. Coast Guard, Marine Information for Safety and Law Enforcement (MISLE) files.22 The vast majority of recorded pollution incidents are associated with oil pollution, but records include chemical, other, and unspecified events. This figure does not include pollution incidents associated with on-shore maritime facilities.
0
500,000
1,000,000
1,500,000
2,000,000
2,500,000
3,000,000
Tho
usa
nd
Gal
lon
s
Year
The vessel bunkering category includes commercial and private boats, such as pleasure craft, fishing boats, tugboats, and ocean-going vessels, including vessels operated by oil companies. U.S. Armed Forces sales excluded.
U.S. Distillate Fuel Oil Sales to Vessel Bunkering Consumers, 1984 - 2012
Source: U.S. Department of Energy, Energy Information Administration
0
500
1000
1500
2000
2500
3000
3500
2000 2001 2002 2003 2004 2005 2006 2007 2008 2009 2010 2011 2012 2013
Nu
mb
er o
f P
ollu
tio
n In
cid
en
ts
Year
Unresolved Investigations (from facilities, vessels, or unknown source)
Commercial Vessels
Recreational Vessels
Source: U.S. Coast Guard MISLE Data (April 2014), MisleVslPoll1.txt, MisleReadme.docx
Recorded Vessel Pollution Incidents, 2000 - 2013
20
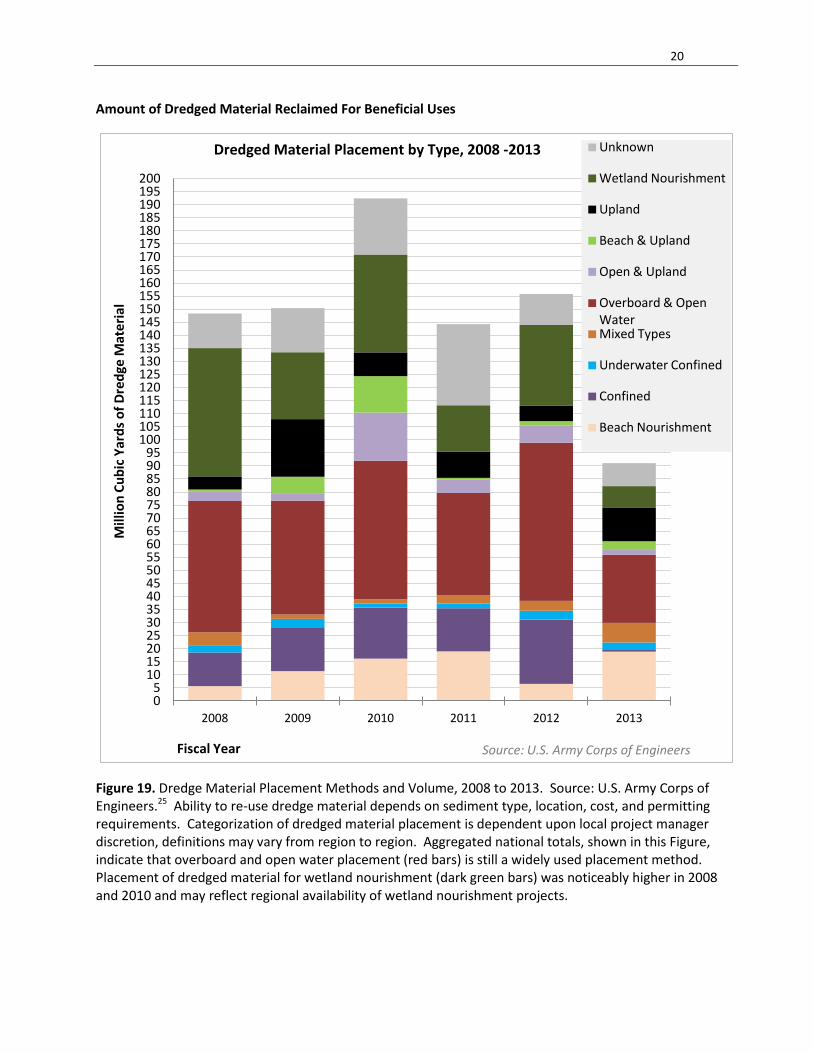
Amount of Dredged Material Reclaimed For Beneficial Uses
Figure 19. Dredge Material Placement Methods and Volume, 2008 to 2013. Source: U.S. Army Corps of Engineers.25 Ability to re-use dredge material depends on sediment type, location, cost, and permitting requirements. Categorization of dredged material placement is dependent upon local project manager discretion, definitions may vary from region to region. Aggregated national totals, shown in this Figure, indicate that overboard and open water placement (red bars) is still a widely used placement method. Placement of dredged material for wetland nourishment (dark green bars) was noticeably higher in 2008 and 2010 and may reflect regional availability of wetland nourishment projects.
0 5
10 15 20 25 30 35 40 45 50 55 60 65 70 75 80 85 90 95
100 105 110 115 120 125 130 135 140 145 150 155 160 165 170 175 180 185 190 195 200
2008 2009 2010 2011 2012 2013
Mill
ion
Cu
bic
Yar
ds
of
Dre
dge
Mat
eri
al
Fiscal Year
Unknown
Wetland Nourishment
Upland
Beach & Upland
Open & Upland
Overboard & Open Water Mixed Types
Underwater Confined
Confined
Beach Nourishment
Source: U.S. Army Corps of Engineers
Dredged Material Placement by Type, 2008 -2013
21
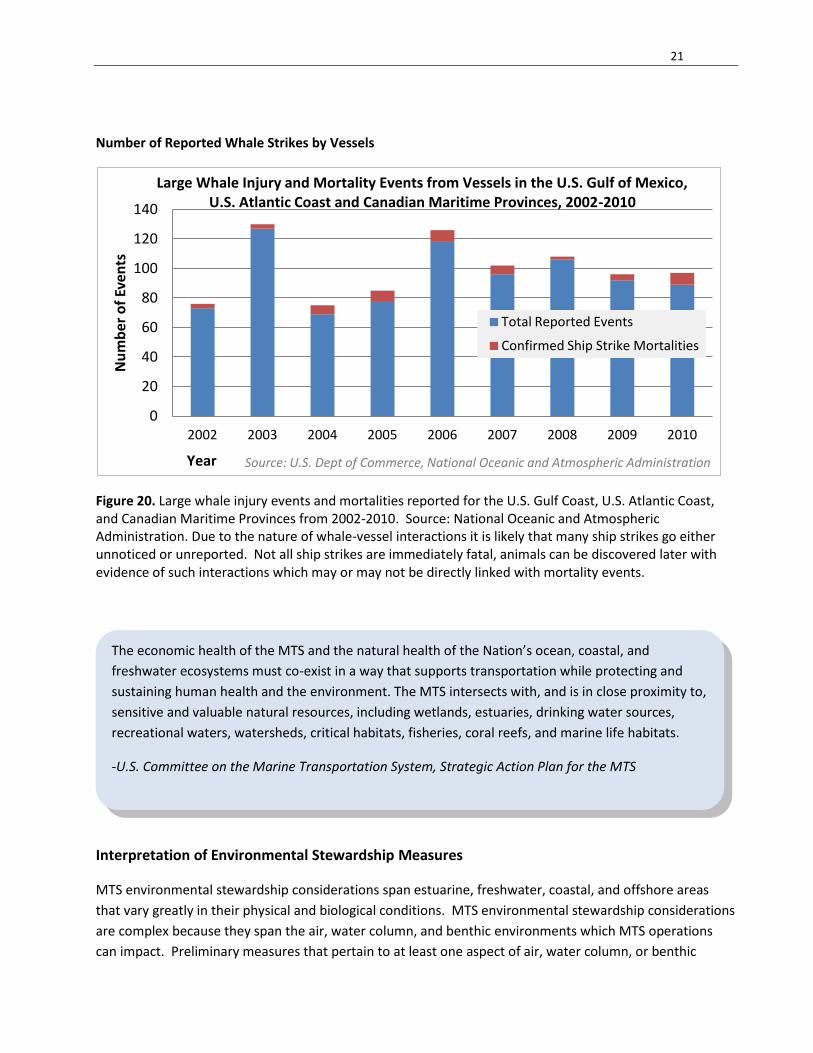
Number of Reported Whale Strikes by Vessels
Figure 20. Large whale injury events and mortalities reported for the U.S. Gulf Coast, U.S. Atlantic Coast, and Canadian Maritime Provinces from 2002-2010. Source: National Oceanic and Atmospheric Administration. Due to the nature of whale-vessel interactions it is likely that many ship strikes go either unnoticed or unreported. Not all ship strikes are immediately fatal, animals can be discovered later with evidence of such interactions which may or may not be directly linked with mortality events.
Interpretation of Environmental Stewardship Measures
MTS environmental stewardship considerations span estuarine, freshwater, coastal, and offshore areas
that vary greatly in their physical and biological conditions. MTS environmental stewardship considerations
are complex because they span the air, water column, and benthic environments which MTS operations
can impact. Preliminary measures that pertain to at least one aspect of air, water column, or benthic
0
20
40
60
80
100
120
140
2002 2003 2004 2005 2006 2007 2008 2009 2010
Nu
mb
er o
f Ev
ents
Total Reported Events
Confirmed Ship Strike Mortalities
Year
Large Whale Injury and Mortality Events from Vessels in the U.S. Gulf of Mexico, U.S. Atlantic Coast and Canadian Maritime Provinces, 2002-2010
Source: U.S. Dept of Commerce, National Oceanic and Atmospheric Administration
The economic health of the MTS and the natural health of the Nation’s ocean, coastal, and
freshwater ecosystems must co-exist in a way that supports transportation while protecting and
sustaining human health and the environment. The MTS intersects with, and is in close proximity to,
sensitive and valuable natural resources, including wetlands, estuaries, drinking water sources,
recreational waters, watersheds, critical habitats, fisheries, coral reefs, and marine life habitats.
-U.S. Committee on the Marine Transportation System, Strategic Action Plan for the MTS
22
environments have been identified. Since air quality is impacted by the burning of fossil fuels, it is possible
that air pollutants from the MTS are declining, as reflected in the overall decline in distillate fuel oil sales to
maritime consumers since a high point in the late 1990s (see Figure 17).24 Lacking at present are emissions
calculations that include contributions from fuel sold in foreign countries but burned by vessels operating
in U.S. waters. The implementation of Emission Control Areas for U.S. coastal waters along with engine
emission standards and fuel sulfur limits is expected to reduce air pollution.31 This is a topic for future
performance measure development. Pollution events continue to be a challenge for the MTS, although
USCG records indicate a slight decline in cases of vessel-based pollution in recent years (see Figure 18).22
Whether this trend continues remains to be seen; reductions in petroleum-based fuel use would be
expected to reduce the overall likelihood of petroleum pollution events.
Federal navigation channel maintenance activities (e.g. jetty reconstruction, dredging, and dredge material
placement) present their own types of environmental stewardship considerations. Short term
environmental considerations are often focused on local benthic and water column environments during
construction. However, longer term environmental stewardship might consider the potential relationship
between these activities and habitat creation or loss. For sediment dredged out of channels by USACE,
there is no distinct trend of increasing beneficial use of this material. Both the percentage and cubic
yardage of dredged materials used for wetland nourishment dropped from 2008 to 2013; however, there
was a general increase in the cubic yardage and percentage of sediments used for beach nourishment over
the same time (see Figure 19).32 One caveat to this interpretation is the limitation on the level of detail
available in dredge material placement records as well as regional discrepancies in defining what qualifies
as beneficial use. It is possible that more refined data categories for dredge material placement would
reveal different trends. More detailed geographical data would be needed to assess the creation of specific
habitat types from beneficially reused sediments. In the water column, interactions between commercial
vessels and species of concern such as marine mammals appear to be stable (see Figure 20), but within the
scientific community there is believed to be vast underreporting of these events and significant regional
variation.33; 34
23
Resilience Performance Measures
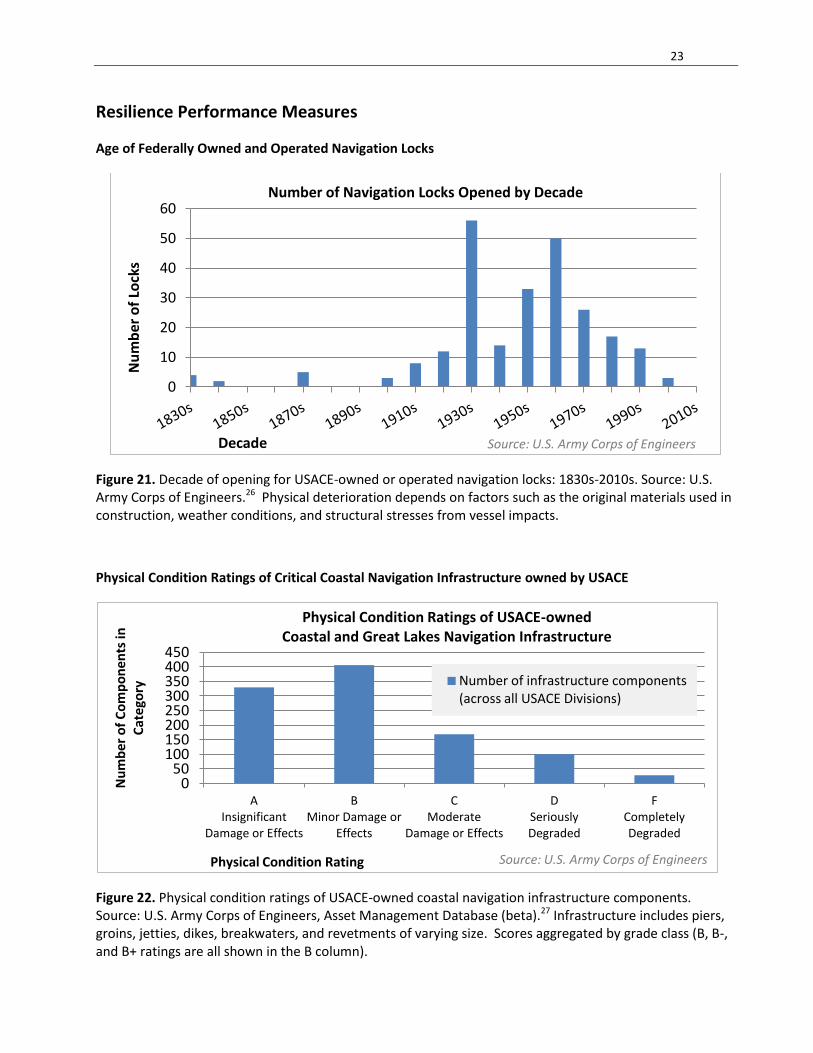
Age of Federally Owned and Operated Navigation Locks
Figure 21. Decade of opening for USACE-owned or operated navigation locks: 1830s-2010s. Source: U.S. Army Corps of Engineers.26 Physical deterioration depends on factors such as the original materials used in construction, weather conditions, and structural stresses from vessel impacts.
Physical Condition Ratings of Critical Coastal Navigation Infrastructure owned by USACE
Figure 22. Physical condition ratings of USACE-owned coastal navigation infrastructure components. Source: U.S. Army Corps of Engineers, Asset Management Database (beta).27 Infrastructure includes piers, groins, jetties, dikes, breakwaters, and revetments of varying size. Scores aggregated by grade class (B, B-, and B+ ratings are all shown in the B column).
0
10
20
30
40
50
60
Nu
mb
er o
f Lo
cks
Decade
Number of Navigation Locks Opened by Decade
Source: U.S. Army Corps of Engineers
0 50
100 150 200 250 300 350 400 450
A Insignificant
Damage or Effects
B Minor Damage or
Effects
C Moderate
Damage or Effects
D Seriously Degraded
F Completely Degraded
Nu
mb
er o
f C
om
po
ne
nts
in
Cat
ego
ry
Physical Condition Rating
Number of infrastructure components (across all USACE Divisions)
Source: U.S. Army Corps of Engineers
Physical Condition Ratings of USACE-owned Coastal and Great Lakes Navigation Infrastructure
24
Interpretation of Resilience Measures
Resilience is defined as “the ability to prepare and plan for, resist, recover from, and more successfully
adapt to the impacts of adverse events.” 35 MTS operations are ultimately inseparable from landside
systems, but defining any system requires drawing logical boundaries. For this research, MTS-specific
physical infrastructure is the initial boundary condition for examining resilience. Along inland waterways,
major public infrastructure in the form of locks, dams, and bridges, continues to age (see Figure 21), with
uncertain effects on future service capabilities and maintenance costs. The present resilience of these
structures within an integrated system might be reflected in historical maintenance needs, but defining
such a relationship requires further study. For critical coastal and Great Lakes navigation infrastructure
(e.g., rubble-mound jetty and breakwater structures) owned by USACE, a potential measure of the capacity
to achieve a desired function could be derived from data on physical rating (an engineering evaluation)
used as an indicator of resilience. Results from a recent evaluation of this portfolio showed the most
common physical rating to be a ‘B’, with grades ranging from ‘A’ (second most common grade) to ‘F’ (see
Figure 22).27 The relationship between physical condition rating and level of service (an operational or
functional evaluation) varies and more detailed information is needed to improve understanding in this
area. The level of resilience for privately owned infrastructure such as container terminals or other port
facilities was not evaluated as part of this research but is an important consideration for all MTS
stakeholders. If standardized metrics applicable to all ports and locations were available they would be
valuable to this research.
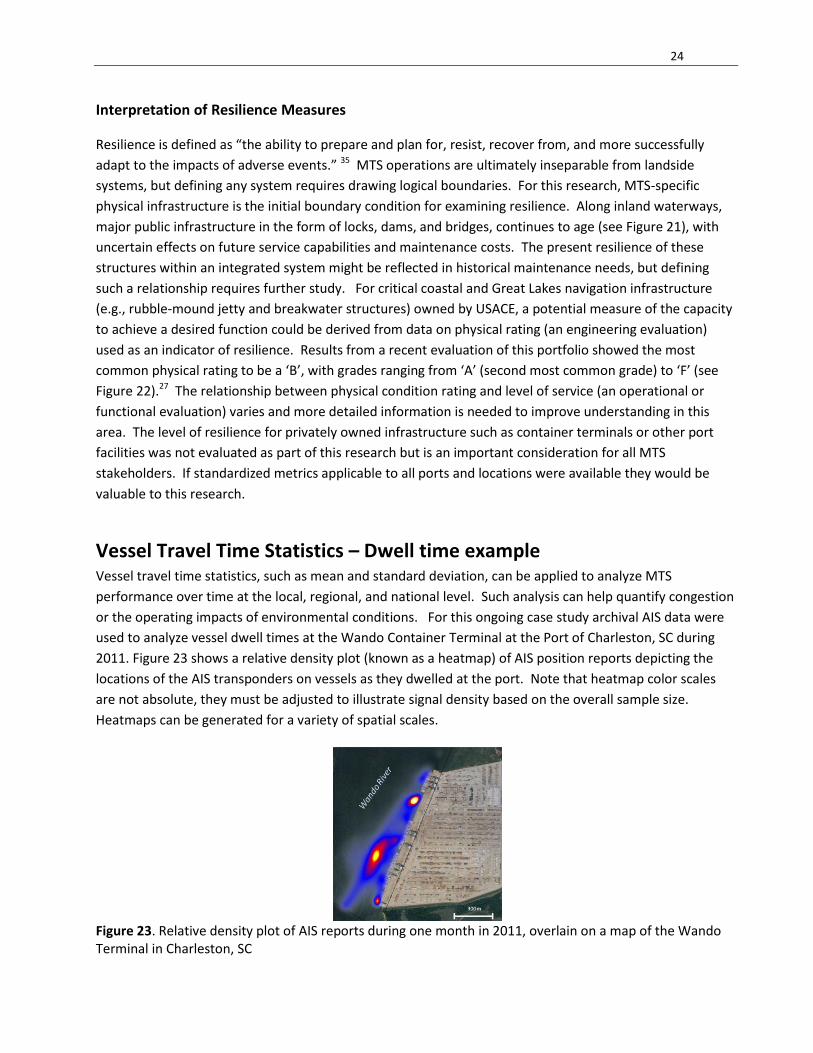
Vessel Travel Time Statistics – Dwell time example Vessel travel time statistics, such as mean and standard deviation, can be applied to analyze MTS
performance over time at the local, regional, and national level. Such analysis can help quantify congestion
or the operating impacts of environmental conditions. For this ongoing case study archival AIS data were
used to analyze vessel dwell times at the Wando Container Terminal at the Port of Charleston, SC during
2011. Figure 23 shows a relative density plot (known as a heatmap) of AIS position reports depicting the
locations of the AIS transponders on vessels as they dwelled at the port. Note that heatmap color scales
are not absolute, they must be adjusted to illustrate signal density based on the overall sample size.
Heatmaps can be generated for a variety of spatial scales.
Figure 23. Relative density plot of AIS reports during one month in 2011, overlain on a map of the Wando Terminal in Charleston, SC
25
Summary and Recommendations These results show that we can use existing data to create a high level overview of MTS performance. We
expect user feedback to identify other critical performance areas while improved data can help sharpen the
focus of all measures. Understanding the state of physical assets will not in and of itself make the MTS
function more efficiently, but has immediate relevance to maintenance and resilience planning efforts.
Possible changes in operational patterns might be more feasible than infrastructure expansion, so regular
performance measurement is needed to support an improved understanding for MTS decision making.
This research directly benefits from robust data collection and publication from sources such as the Bureau
of Labor Statistics, Census Bureau, Army Corps of Engineers, National Oceanic and Atmospheric
Administration, Department of Transportation, Department of Energy, Coast Guard, and the Environmental
Protection Agency.32; 36-41 Initiatives such as Data.gov can improve discoverability of previously obscure
resources. Unlocking these rich collections of data has the potential to improve our understanding of MTS
performance, but research is far from complete especially when the MTS is viewed as part of an intermodal
system. A recent National Academy of Science/National Cooperative Freight Research Program publication
noted “there is a lack of the kind of data needed for developing a model that can support MTS
maintenance investment decision-making by being correlated between the [transportation] modes and
almost no accurate data on origins and destinations (in the case of publicly available data).”42 Reducing
these data gaps to improve system performance analysis capabilities would benefit all MTS stakeholders.
In the absence of national MTS goals the current mixture of stakeholder priorities and mission areas will
continue to drive data collection. Recommendations to improve MTS performance measurement
capabilities are listed below.
1. Continue to develop indicators that identify changes, rates of change, and the state of MTS
performance
2. Develop performance measures that reflect priority outcomes based on national goals.
3. Improve understanding of the underlying drivers of MTS performance indicators.
4. Improve intermodal freight connection, and supply chain corridor, visibility and analytics.
5. Improve research access to historical Automatic Identification System vessel data.
6. Federal agencies should review and update existing policies to reflect emerging research needs,
technical sharing capabilities, and agency requirements for open and machine-readable data to
reduce the need for the repetitive data calls.
7. Improve reporting speed and publishing of environmental data.
8. Improve environmental stewardship performance measure data sourcing.
9. Develop coastal resilience measures, using sources such as shoreline change records provided by
the National Coastal Mapping Program.43
26
References
1. U.S. Department of Transportation, Maritime Administration. 2013. Marine Transportation System (MTS). Washington, D.C., USA: Maritime Administration. http://www.marad.dot.gov/ports_landing_page/marine_transportation_system/MTS.htm
2. U.S. Committee on the Marine Transportation System. 2008. National Strategy for the Marine Transportation System: A Framework for Action. 1-59 pages.
3. PIANC Inland Navigation Commission, Working Group 32, Reinhard Pfliegel, Garhard Gussmagg, et al. 2010. Performance Indicators for Inland Waterways Transport: User Guideline. PIANC Report No. 111. Bruxelles, Belgium: The World Association for Waterborne Transport Infrastructure (PIANC). http://www.pianc.org
4. Transport Canada. 2012. Gateways and Corridors. Canada: Transport Canada, Government of Canada. http://www.tc.gc.ca/eng/policy/anre-menu-3023.htm Accessed 04/22/2014.
5. Tardif, L. 2014. Gateways and Trade Corridors Fluidity Index. In Workshop: Developing Freight Fluidity Performance Measures: A Supply Chain Perspective on Freight System Performance. Washington, D.C., USA: Transportation Research Board.
6. Brydia, R. E., W. H. Schneider, S. P. Mattingly, M. L. Sattler and A. Upayokin. 2007. Operations-Oriented Performance Measures for Freeway Management Systems: Year 1 Report. FHWA/TX-07/0-5292-1. College Station, TX, USA: Texas Transportation Institute. http://d2dtl5nnlpfr0r.cloudfront.net/tti.tamu.edu/documents/0-5292-1.pdf
7. Environmental Defense Fund. 2014. The Houston Barge System: A Brief Review of Operations and Opportunities. New York, N.Y., USA: Environmental Defense Fund. http://www.edf.org/sites/default/files/houston-barge-system.pdf
8. Intermodal Association of North America. 2014. Intermodal Loadings 2000-2013. personal communication.
9. Lohr, S. 2011. Stress Test for the Global Supply Chain. NYT. New York, NY: The New York Times Company. http://www.nytimes.com/2011/03/20/business/20supply.html
10. Fuller, T. 2011. Thailand Flooding Cripples Hard-Drive Suppliers. The New York Times. New York, NY: The New York Times Company. http://www.nytimes.com/2011/11/07/business/global/07iht-floods07.html?_r=0
11. Obama B. 2013. Executive Order 13642-- Making Open and Machine Readable the New Default for Government Information. Fed. Reg. http://www.archives.gov/federal-register/executive-orders/2013.html
12. U.S. Department of Commerce, U.S. Census Bureau. 2014. Foreign Trade: U.S. International Trade in Goods and Services (FT900). Washington, D.C.: U.S. Department of Commerce, U.S. Census Bureau. http://www.census.gov/foreign-trade/Press-Release/current_press_release/ Accessed 03/28/2014.
13. U.S. Department of Transportation. 2014. Freight Facts and Figures 2013. Washington, DC: U.S. Department of Transportation. http://www.ops.fhwa.dot.gov/freight/freight_analysis/nat_freight_stats/docs/13factsfigures/pdfs/fff2013_highres.pdf
14. U.S. Census Bureau, Foreign Trade Division. 2015. FT920 - U.S. Merchandise Trade: Selected Highlights (annual issues). U.S. International Trade Data. https://www.census.gov/foreign-trade/Press-Release/ft920_index.html
15. U.S. Army Corps of Engineers. 2007. Report to Congress on the Annual Status of the Harbor Maintenance Trust Fund for Fiscal years 2005 and 2006. Washington DC: U.S. Army Corps of Engineers. http://www.iwr.usace.army.mil/Portals/70/docs/iwrreports/Harbor_main_trust_fund_2005_2006.pdf
16. U.S. Department of the Treasury. 2015. Inland Waterways Reports - 96X8861. Washington, DC: U.S. Department of the Treasury. https://www.treasurydirect.gov/govt/reports/tfmp/inwater/inwater.htm Accessed 02/27/2015.
27
17. Bureau of Labor Statistics. 2014. Producer Price Indexes. Washington, D.C.: U.S. Department of Labor. http://www.bls.gov/ppi/
18. U.S. Department of Agriculture, Agricultural Marketing Service. 2014. Grain Transportation Report Datasets. Washington, D.C., USA: U.S. Department of Agriculture. http://www.ams.usda.gov/AMSv1.0/getfile?dDocName=STELPRDC5084408
19. U.S. Army Corps of Engineers. 2015. Navigation Data Center: Lock Use, Performance, and Characteristics. Alexandria, V.A., USA: U.S. Army Corps of Engineers. http://www.navigationdatacenter.us/lpms/lpms.htm Accessed 02/27/2015.
20. U.S. Army Corps of Engineers. 2014. Navigation Data Center: U.S. Waterway Data. Alexandria, V.A., USA: U. S. Army Corps of Engineers. http://www.navigationdatacenter.us/data/datapdom.htm Accessed 02/27/2015.
21. National Oceanic and Atmospheric Administration. 2013. Tides & Currents: PORTS® (Physical Oceanographic Real-Time
System). Silver Spring, M.D., USA: National Oceanic and Atmospheric Administration. http://tidesandcurrents.noaa.gov/ports.html Accessed 05/20/2014.
22. U.S. Coast Guard. 2014. Homeport: Marine Casualty and Pollution Data for Researchers. Washington, D.C., USA: United States Coast Guard. https://homeport.uscg.mil/ Accessed 05/19/2014.
23. National Transportation Safety Board. 2015. Office of Marine Safety. Washington, DC: National Transportation Safety Board. http://www.ntsb.gov/about/organization/MS/Pages/office_ms.aspx Accessed 02/19/2015.
24. U. S Department of Energy. 2013. Petroleum & Other Liquids: Data: Distillate Fuel Oil and Kerosene Sales by End Use. Washington, D.C.: U.S. Department of Energy. http://www.eia.gov/dnav/pet/pet_cons_821use_dcu_nus_a.htm Accessed 05/19/2014.
25. U.S. Army Corps of Engineers. 2015. Navigation Data Center: Dredging Information System. U.S. Army Corps of Engineers Institute for Water Resources Navigation Data Center 7701 Telegraph Rd Alexandria, VA 22315: http://www.navigationdatacenter.us/dredge/drgdisp.htm Accessed 02/27/2015.
26. U.S. Army Corps of Engineers. 2014. Lock Characteristics General Report. Washington, D.C., USA: U.S. Army Corps of Engineers, Navigation Data Center. http://www.navigationdatacenter.us/lpms/pdf/lkgenrl.pdf
27. U.S. Army Corps of Engineers. 2013. Asset Management. http://operations.usace.army.mil/pdfs/assetmgmt-brochure.pdf.
28. U.S. Department of the Treasury. 2015. Harbor Maintenance Reports - 96X8863. Washington, DC: U.S. Department of the Treasury. https://www.treasurydirect.gov/govt/reports/tfmp/hmaint/hmaint.htm Accessed 02/27/2015.
29. U.S. Department of Transportation, Federal Highway Administration. 2014. Freight Planning. Washington, DC: U.S. Department of Transportation. http://www.fhwa.dot.gov/planning/freight_planning/ Accessed 01/15/2015.
30. Transportation Research Board. 2015. Committee on Marine Safety and Human Factors (AW040). Washington, D.C.: Transportation Research Board of the National Academies. www.trb.org/AW040/ircStandingCommittee.aspx Accessed 04/06/2015.
31. U.S. Environmental Protection Agency. 2014. Transportation and Air Quality: Nonroad Engines, Equipment, and Vehicles; Ocean Vessels and Large Ships. Washington, DC: U.S. Environmental Protection Agency. http://www.epa.gov/otaq/oceanvessels.htm#emissioncontrol Accessed 12/22/2014.
32. U.S. Army Corps of Engineers. 2014. Navigation Data Center: Homepage. U.S. Army Corps of Engineers Institute for Water Resources Navigation Data Center 7701 Telegraph Rd Alexandria, VA 22315: http://www.navigationdatacenter.us/ Accessed 03/26/2014.
28
33. Henry, A. G., T. V. N. Cole, M. Garron, L. Hall, W. Ledwell and A. Reid. 2012. Mortality and Serious Injury Determinations for Baleen Whale Stocks along the Gulf of Mexico, United States East Coast and Atlantic Canadian Provinces, 2006-2010. Northeast Fish Sci Cent Ref Doc. 12-11. Woods Hole, MA: U.S. Department of Commerce. http:// www.nefsc.noaa.gov/nefsc/publications/
34. Glass, A. H., T. V. N. Cole, M. Garron, R. L. Merrick and R. M. III Pace. 2008. Mortality and serious injury determinations for baleen whale stocks along the United States eastern seaboard and adjacent Canadian Maritimes, 2002-2006. Northeast Fish Sci Cent Ref Doc. 08-04. Woods Hole, MA: U.S. Department of Commerce. http://www.nefsc.noaa.gov/nefsc/publications/
35. U.S. Committee on the Marine Transportation System. 2015. Resilience Integrated Action Team. Washington, DC: U.S. Committee on the Marine Transportation System. http://www.cmts.gov/Activities/ActionTeams.aspx Accessed 04/15/2015.
36. U.S. Environmental Protection Agency. 2014. Data Finder. Washington, D.C., USA: U.S. Environmental Protection Agency (EPA). http://www.epa.gov/datafinder/ Accessed 07/11/2014.
37. U.S. Coast Guard. 2014. United States Coast Guard: About us. Washington, D.C.: United States Coast Guard, U.S. Department of Homeland Security. http://www.uscg.mil/top/about/ Accessed 03/26/2014.
38. U.S. Department of Transportation. U.S. Department of Transportation: Homepage. Washington, D.C.: U.S. Department of Transportation. http://www.dot.gov/ Accessed 03/26/2014.
39. National Oceanic and Atmospheric Administration. National Oceanic and Atmospheric Administration (NOAA): Homepage. Silver Spring, M.D., USA: National Oceanic and Atmospheric Administration, U.S. Department of Commerce. http://www.noaa.gov/ Accessed 03/26/2014.
40. U.S. Census Bureau, U.S. Dept of Commerce. 2015. U.S. Census Bureau Homepage. Washington, D.C.: http://www.census.gov/# Accessed 03.13/2015.
41. Bureau of Labor Statistics. 2014. Subject Area Categories. Washington, D.C.: U.S. Department of Labor;. http://www.bls.gov/bls/proghome.htm Accessed 03/26/2014.
42. Kruse, C. J., A. Protopapas, D. Bierling, L. E. Olson, B. Wang and M. Khodakarami. 2014. Integrating MTS Commerce Data with Multimodal Freight Transportation Performance Measures to Support MTS Maintenance Investment Decision Making. NCFRP 32. Washington, DC: National Academy of Sciences. http://onlinepubs.trb.org/onlinepubs/ncfrp/ncfrp_rpt_032.pdf
43. U.S. Army Corps of Engineers. 2015. Joint Airborne Lidar Bathymetry Technical Center of Expertise: National Coastal Mapping Program. Mobile, AL: U.S. Army Corps of Engineers. http://shoals.sam.usace.army.mil/Mapping.aspx Accessed 04/15/2015.
44. Committee for a Study of the Federal Role in the Marine Transportation System. 2004. The Marine Transportation System and the Federal Role: Measuring Performance, Targeting Improvement. Special Report 279. Washington, D.C.: Transportation Research Board of the National Academies.