Embed Size (px)
Citation preview
Master‘s thesis
Maritime transport in the Gulf of Bothnia
2010-2030 Future scenarios for Maritime Spatial Planning purposes
Maija Annukka Pekkarinen
Advisor:Advisor:Advisor:Advisor: Sari RepkaSari RepkaSari RepkaSari Repka
University of Akureyri Faculty of Business and Science
University Centre of the Westfjords Master of Resource Management: Coastal and Marine Management
Ísafjörður, May 2012

Supervisory Committee Advisor: Sari Repka, PhD, Head of Unit Reader: Sigríður Kristjánsdóttir, Dr. Program Director: Dagný Arnarsdóttir, MSc.
Student’s name Maija Annukka Pekkarinen Title of thesis Maritime Transport in the Gulf of Bothnia 2010-2030
30/60/45 ECTS thesis submitted in partial fulfilment of a Master of Resource Management degree in Coastal and Marine Management at the University Centre of the Westfjords, Suðurgata 12, 400 Ísafjörður, Iceland
Degree accredited by the University of Akureyri, Faculty of Business and Science, Borgir, 600 Akureyri, Iceland
Copyright © YEAR Student’s name All rights reserved Printing: University Centre of the Westfjords and/or Printer, town, Month YEAR
Declaration
I hereby confirm that I am the sole author of this thesis and it is a product of my own academic research.
__________________________________________ Student‘s name
Abstract
The study aims to describe the main factors contributing to the development of maritime
transport and to form future scenarios for shipping traffic in the Gulf of Bothnia by 2030.
The goal is to identify future developments that should be taken into account when
preparing a Maritime Spatial Plan for the Bothnian Sea area.
The methods include applying existing large scale quantitative scenarios for the volume of
maritime traffic specifically in the Gulf of Bothnia context and Real-time Delphi round to
find out the probability and desirability of the main factors having an impact on marine
traffic. The factors contributing to the future of maritime traffic in Gulf of Bothnia are
assessed and debated by an expert group. The study concludes with implications and
recommendations for planning. Moreover, due to the spatial nature of the project, one of
the most important outcomes of the study is the results shown on maps.
Area specific future scenarios have not been made concerning maritime transport in the
Gulf of Bothnia. The future scenarios contribute to the area based, future oriented,
participatory and adaptive nature of Marine Spatial Planning.
Maritime Spatial Planning is a fairly new approach to sustainable marine management. It is
currently tested on trans-national scale in the Bothnian Sea area as a pilot project. Futures
research and Delphi method have been used to aid logistics and traffic planning on land.
This study explores how futures research methodology can be applied to planning on
marine areas.

Foreword
This study serves as background data for Plan Bothnia –Project, funded by Directorate
General for Fisheries and Maritime Affairs (DG MARE) and coordinated by Helsinki
Commission (HELCOM). Centre for Maritime Studies has been responsible for the
maritime transport section of the project. Plan Bothnia is a pilot project to test Maritime
Spatial Planning between two countries, Finland and Sweden. Their common EEZ border
runs in the middle of the planning area and both countries possess areas of approximately
the same size. Similar marine activities can be found from both sides of the border,
including shipping, environmental protection, wind park projects, military practise,
fisheries, dredging and aquaculture.
The goal is to prepare a comprehensive, ecosystem based maritime spatial plan for
Bothnian Sea, covering all main activities in marine areas. Overlap of spatial interests of
different sectors is studied to find out possible conflicts between them. This study
describes the development scenarios of maritime transport in the planning area, as well as
in Bay of Bothnia. Future activities in Bay of Bothnia have a great impact on traffic within
the planning area and therefore the scope of this study is widened from the Plan Bothnia
area lineation to include Bay of Bothnia.
viii
Table of Contents
Foreword ............................................................................................................................ vii
List of Figures ....................................................................................................................... x
List of Tables ...................................................................................................................... xii
Acronyms .......................................................................................................................... xiii
Acknowledgements ............................................................................................................. xv
1 INTRODUCTION ......................................................................................................... 17 1.1 Maritime Spatial Planning ..................................................................................... 17 1.2 Literature review .................................................................................................... 19
2 RESEARCH AREA DESCRIPTION .......................................................................... 23
2.1 Scope of the study .................................................................................................. 23 2.2 Navigation in offshore areas of Gulf of Bothnia .................................................... 25
2.2.1 Legal background ........................................................................................ 25
2.2.2 Routing system for marine transportation in the Gulf of Bothnia ............... 26 2.2.3 Maritime Safety ........................................................................................... 27 2.2.4 Navigation in ice .......................................................................................... 27 2.2.5 Environmental regulations concerning Maritime transport in offshore
areas ............................................................................................................. 28 2.3 Maritime transport in the Gulf of Bothnia 2010 .................................................... 31
2.3.1 Ship types .................................................................................................... 31 2.3.2 Main commodity groups .............................................................................. 33
2.4 Analysis of current status of transports and economic development ..................... 34
2.4.1 Finland ......................................................................................................... 34 2.4.2 Sweden ......................................................................................................... 35
2.5 Ports ....................................................................................................................... 36 2.5.1 Priority Ports ................................................................................................ 43
2.6 Description of transportation developments .......................................................... 44
2.6.1 Development projects and ports investments in Gulf of Bothnia ports ....... 44 2.6.2 Mining industry transports ........................................................................... 45
2.6.3 Forest industry transports ............................................................................ 50
2.6.4 Domestic traffic ........................................................................................... 51 2.6.5 Transit traffic ............................................................................................... 51 2.6.6 Container and other unitized cargo transport .............................................. 52
2.6.7 Nuclear power plants and radioactive cargo ................................................ 52
2.6.8 Liquid bulk: Oil products and chemicals transport in the Gulf of Bothnia ......................................................................................................... 53
2.6.9 European Union projects developing transport chains ................................ 55
ix
3 METHODOLOGY ....................................................................................................... 59 3.1 Methodology for Future Scenarios ........................................................................ 59
3.1.1 Part I ............................................................................................................. 60 3.1.2 Part II ........................................................................................................... 61
4 PART I: FORECASTED CARGO VOLUME SCENARIOS .................................. 65 4.1 Existing scenarios .................................................................................................. 65
4.1.1 FMA Scenario .............................................................................................. 65 4.1.2 Baltic Maritime Outlook scenario ................................................................ 67
4.1.3 BTO scenario ............................................................................................... 68 4.2 Results ................................................................................................................... 69
4.2.1 Strong growth............................................................................................... 70 4.2.2 Average growth ............................................................................................ 71 4.2.3 Modest growth ............................................................................................. 72 4.2.4 Comparison to other existing scenarios ....................................................... 74
4.3 Discussion ............................................................................................................. 74
5 PART II: RT-DELPHI ABOUT FUTURE OF MARITIME TRANSPORTATION IN THE GULF OF BOTHNIA 2030 ........ ............................ 77
5.1 Key concepts ......................................................................................................... 77 5.1.1 Megatrends ................................................................................................... 77 5.1.2 Trends .......................................................................................................... 79 5.1.3 Wild cards .................................................................................................... 80 5.1.4 Key factors ................................................................................................... 80
6 Results ............................................................................................................................ 83
6.1 Scenarios ............................................................................................................... 87 6.1.1 Basic assumptions for scenarios and maps .................................................. 87
7 DISCUSSION ................................................................................................................ 99 7.1 Implications for Planning .................................................................................... 101 7.2 Recommendations and lessons learned ............................................................... 105
7.3 Further research ................................................................................................... 106
References......................................................................................................................... 108
Appendix A ....................................................................................................................... 116
Appendix B ....................................................................................................................... 119
Appendix C ....................................................................................................................... 122
x
List of Figures
Figure 1: Ports of the research area ..................................................................................... 24
Figure 2: Ship types in the whole Gulf of Bothnia (%) (HELCOM, 2011b) ...................... 32
Figure 3: Ship types in Bay of Bothnia (%) (HELCOM, 2011b) ....................................... 33
Figure 3: Main commodity groups transported in the Gulf of Bothnia 2010 (Mt) (Baltic Port List, 2011) ..................................................................................... 33
Figure 4: Transports in Finnish Ports in Bothnian Sea (tons/a), main types of cargo and commodities in 2010. Red columns illustrate ports that have more imports than exports and blue columns stand for mainly exporting ports. (Baltic Port List 2011) ...................................................................................... 37
Figure 5: Transports in Finnish ports in Bothnian Bay (tons/a), main types of cargo and commodities in 2010. Red columns illustrate ports that have more imports than exports and blue columns stand for mainly exporting ports. (Baltic port list 2011). ...................................................................................... 38
Figure 6: Swedish Ports in South Bothnian Sea 2010 (tons/a), their main cargo types and commodities Red columns illustrate ports that have more imports than exports and blue columns stand for mainly exporting ports. (Baltic port List 2011) .................................................................................................. 40
Figure 7: Swedish ports in North Bothnian Sea 2010 (tons/a), main cargo types and commodities. Red columns illustrate ports that have more imports than exports and blue columns stand for mainly exporting ports. (Holma et al, 2011). ................................................................................................................ 41
Figure 8: Swedish ports in Bothnian Bay 2010 (tons/a), main cargo types and commodities Red columns illustrate ports that have more imports than exports and blue columns stand for mainly exporting ports. (Baltic port List 2011) ......................................................................................................... 41
Figure 9: Investments in ports 2011-2015 and the shares of investments in the ports of the Gulf of Bothnia. (Sjöfartsverket, 2011, Karvonen, 2010) ...................... 45
Figure 10: Forestry and mining industry transports in the Gulf of Bothnia 2010 (Baltic port List 2011) ...................................................................................... 48
Figure 11: Existing railroads, mining activities in the area and proposed new railroads. (Lohi, 2012, Rautajoki, Oikarinen, Somero & Väyrynen, 2007, Mid-Lapland railroad, 2011, Corneliussen & Allertsen, 2009,
xi
Trafikverket, 2011b, FODD, 2011, Data on mining sites reproduced with the permission of GTK, SGU, MNRRF, NGU. All rights reserved.).............. 49
Figure 12: Ports handling domestic tranport. (Baltic Port List 2011) ................................. 51
Figure 13: Container transport in Gulf of Bothnia 2010 by Twenty-foot Equivalent Unit (TEU) (Baltic port List 2011) ................................................................... 52
Figure 14: Liquid bulk transports in the Gulf of Bothnia 2010 (Baltic Port List 2011) ...... 54
Figure 15: Cargo volume scenarios for the Gulf of Bothnia 2000-2030 (in million tons). ................................................................................................................. 73
Figure 16: International transports in the Gulf of Bothnia 2000-2030 with two additional scenarios .......................................................................................... 75
Figure 17: Averages and medians of the key factor-assessment ......................................... 84
Figure 18: Results on railroad alternatives and economic development (Annual average growth of GDP) (Theses 14 and 15) ................................................... 85
Figure 19: Results on question 19 concerning most important key factors......................... 86
Figure 20: Results on Cargo volume scenarios assessment ................................................ 86
Figure 21: Strong Europe 2030 Map ................................................................................... 91
Figure 22: Towards Arctic 2030 Map ................................................................................. 94
Figure 23: East-West transit 2030Map ................................................................................ 97
Figure 24: Implications for planning. “Possible areas for routing measures” include the areas that seem to have strong importance in all the scenarios. “Maritime transport areas I” include the areas that can be expected to have high international importance in future. “Maritime transport areas II” includes national interest areas and possible new Cross-Bothnian connections. Map data for existing routing measures as well as Swedish national interest fairways of Sweden are obtained from HELCOM Plan Bothnia Map and Data Service (2012b). ........................................................ 104
xii
List of Tables
Table 1: International transports of Finland in 2010 including transit. (FTA 2011) .......... 35
Table 2: International transports in the Gulf of Bothnia 2010 (Baltic Port List 2011) ....... 35
Table 3: International transports of Sweden in 2010 (Sjöfartsverket, 2011) ..................... 36
Table 4: International transports in the Gulf of Bothnia 2010 (Baltic Port List 2011) ....... 36
Table 5: Oil transports in the Gulf of Bothnia (Baltic port List 2011) ................................ 55
Table 6: International transports in Finland 2030 according to FMA (2006) ..................... 67
Table 7: International transports in the Gulf of Bothnia 2030 according to FMA (2006) ............................................................................................................... 67
Table 8: International transports 2020 according to BMO (2006) ...................................... 67
Table 9: Strong growth scenario for the Gulf of Bothnia 2030 .......................................... 70
Table 10: Average growth Scenario for the Gulf of Bothnia 2030 ..................................... 72
Table 11: Modest growth Scenario for the Gulf of Bothnia 2030 ...................................... 73
Table 12: International transports in Finland in 2030 according to FMA 2006 ................. 74
Table 13: International Transports in Finland according to BTO (2011) ........................... 74
Table 14: Panel structure for the RT Delphi round. ............................................................ 83
xiii
Acronyms
In the order of appearance:
MSP: Marine Spatial Planning, Maritime Spatial Planning
TEN-T: Trans-European Transport Networks
BMO: Baltic Maritime Outlook
FMA: Finnish Maritime Administration (Currently FTA: Finnish Transport Agency)
BTO: Baltic Transport Outlook
SWOT: Strengths, Weaknesses, Opportunities, Threats
MARPOL 73/78: International Convention for the Prevention of Pollution from Ships (Marine Pollution, years 1973, 1978)
DG MARE: European Commission Directorate General for Fisheries and Maritime Affairs
HELCOM: Helsinki Commission, Baltic Marine Environment Protection Commission
EEZ: Exclusive Economic Zone
IMO: International Maritime Organization
TSS: Traffic Separation Scheme
GDP: Gross Domestic Production
AIS: Automatic Identification System
VTS: Vessel Traffic Service
UNCLOS: United Nation Convention on Law of the Sea
GOFREP: Gulf of Finland Reporting System
RO-RO: Roll-On Roll-Off ship
SECA: Sulphur Emission Control Area
NECA: Nitrogen Emission Control Area
EEDI: Energy Efficiency Design Index
RT Delphi: Real-Time Delphi
NSR: North Sea Route
TEU: Twenty-foot Equivalent Unit

xiv
xv
Acknowledgements
This research was funded by "Plan Bothnia" -Preparatory action on Maritime Spatial Planning in the Baltic Sea (Reference MARE/2009/16)
I want to thank following people for their input and support for the project:
Ms Sari Repka.
From Plan Bothnia project Mr Hermanni Backer, Mr Manuel Frias and Ms Mirja Rasi as well as all the other project partners.
From Centre of Maritime Studies: Juha Kalli
For support in applying Delphi method and Futures studies: Anita Rubin, Yrjö Myllylä, Hannu Linturi, Jenni Linturi,
For language check Adam MacLeod and Jon McEwan
Especially I would like to thank the RT Delphi Expert panel members for considerable input for the project.

17
1 INTRODUCTION
1.1 Maritime Spatial Planning
Maritime Spatial Planning (MSP) is gaining importance as a new approach to manage
marine areas. The pressure on offshore areas has grown as relatively new forms of using
marine areas, such as wind parks and aquaculture installations compete of space with more
traditional uses such as fisheries and maritime transportation. Various MSP projects have
already been initiated in small scale as well as on national level all around the world.
Backer (2011) notes that there is a difference in terminology: while in international context
“Marine Spatial Planning” is commonly used, European Community refers to “Maritime
Spatial Planning” when discussing the concept. Due to the EU context, the term Maritime
Spatial Planning (MSP) will be used in this study. Maritime Spatial Planning is defined as
follows: “Maritime spatial planning is about planning and regulating all human uses of the
sea, while protecting marine ecosystems. It focuses on marine waters under national
jurisdiction and is concerned only with planning activities at sea. It does not cover
management of coastal zones or spatial planning of sea-land interface” (EC Maritime
Affairs, 2012).
European Union is promoting Maritime Spatial Planning as the key to modern, sustainable
management and works on setting common principles for European MSP policy and cross-
border cooperation on marine areas. In Gulf of Bothnia (GoB), a pilot project to test
Maritime Spatial Planning between two countries has begun in 2010. The aim is to make a
plan for the Bothnian Sea, a small brackish water basin divided between Finland and
Sweden.
Ehler (2011) describes Marine Spatial Planning as follows “Marine spatial planning is a
public process of analyzing and allocating the spatial and temporal distribution of human
activities to specific marine areas to achieve ecological, economic, and social goals and
objectives that are specified through a political process. MSP is integrated, future-oriented,
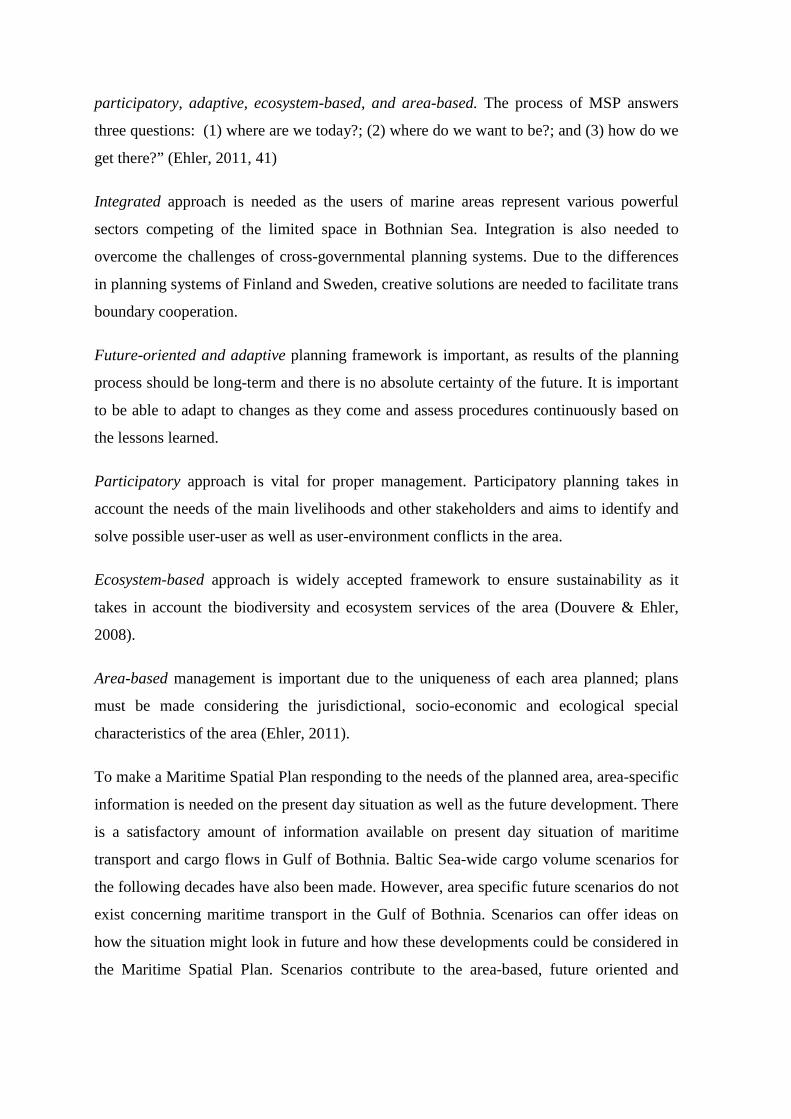
participatory, adaptive, ecosystem-based, and area-based. The process of MSP answers
three questions: (1) where are we today?; (2) where do we want to be?; and (3) how do we
get there?” (Ehler, 2011, 41)
Integrated approach is needed as the users of marine areas represent various powerful
sectors competing of the limited space in Bothnian Sea. Integration is also needed to
overcome the challenges of cross-governmental planning systems. Due to the differences
in planning systems of Finland and Sweden, creative solutions are needed to facilitate trans
boundary cooperation.
Future-oriented and adaptive planning framework is important, as results of the planning
process should be long-term and there is no absolute certainty of the future. It is important
to be able to adapt to changes as they come and assess procedures continuously based on
the lessons learned.
Participatory approach is vital for proper management. Participatory planning takes in
account the needs of the main livelihoods and other stakeholders and aims to identify and
solve possible user-user as well as user-environment conflicts in the area.
Ecosystem-based approach is widely accepted framework to ensure sustainability as it
takes in account the biodiversity and ecosystem services of the area (Douvere & Ehler,
2008).
Area-based management is important due to the uniqueness of each area planned; plans
must be made considering the jurisdictional, socio-economic and ecological special
characteristics of the area (Ehler, 2011).
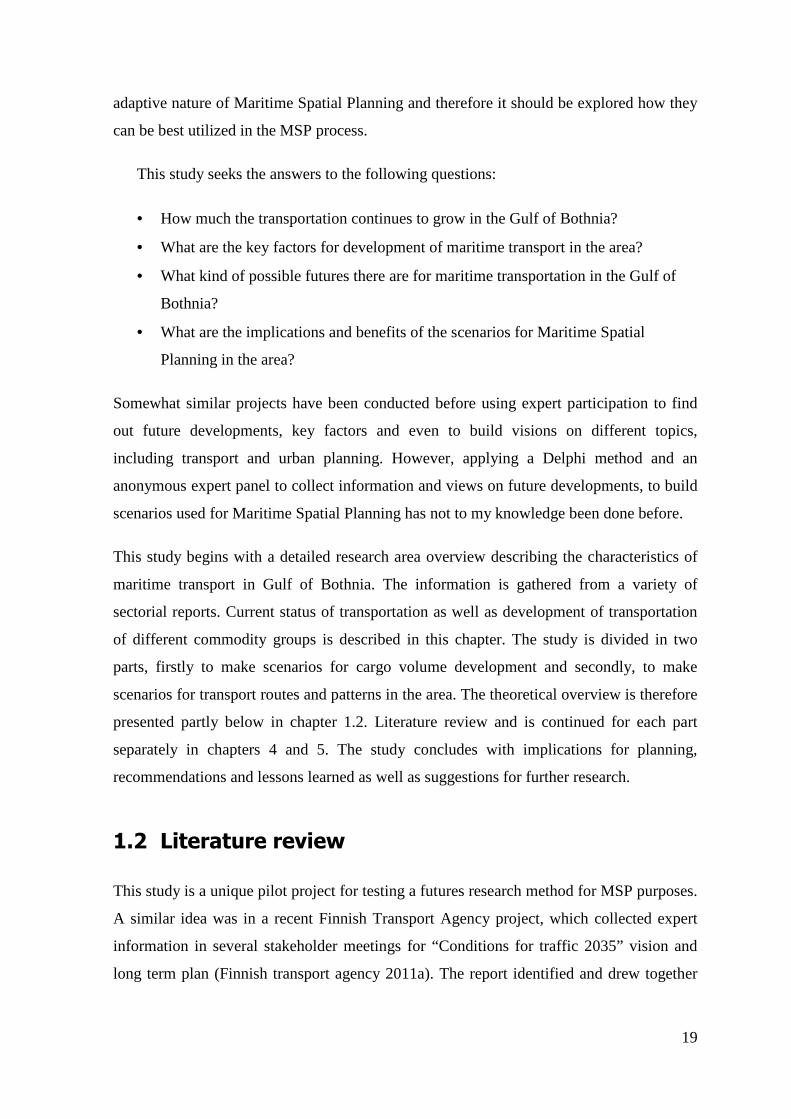
To make a Maritime Spatial Plan responding to the needs of the planned area, area-specific
information is needed on the present day situation as well as the future development. There
is a satisfactory amount of information available on present day situation of maritime
transport and cargo flows in Gulf of Bothnia. Baltic Sea-wide cargo volume scenarios for
the following decades have also been made. However, area specific future scenarios do not
exist concerning maritime transport in the Gulf of Bothnia. Scenarios can offer ideas on
how the situation might look in future and how these developments could be considered in
the Maritime Spatial Plan. Scenarios contribute to the area-based, future oriented and
19
adaptive nature of Maritime Spatial Planning and therefore it should be explored how they
can be best utilized in the MSP process.
This study seeks the answers to the following questions:
• How much the transportation continues to grow in the Gulf of Bothnia?
• What are the key factors for development of maritime transport in the area?
• What kind of possible futures there are for maritime transportation in the Gulf of
Bothnia?
• What are the implications and benefits of the scenarios for Maritime Spatial
Planning in the area?
Somewhat similar projects have been conducted before using expert participation to find
out future developments, key factors and even to build visions on different topics,
including transport and urban planning. However, applying a Delphi method and an
anonymous expert panel to collect information and views on future developments, to build
scenarios used for Maritime Spatial Planning has not to my knowledge been done before.
This study begins with a detailed research area overview describing the characteristics of
maritime transport in Gulf of Bothnia. The information is gathered from a variety of
sectorial reports. Current status of transportation as well as development of transportation
of different commodity groups is described in this chapter. The study is divided in two
parts, firstly to make scenarios for cargo volume development and secondly, to make
scenarios for transport routes and patterns in the area. The theoretical overview is therefore
presented partly below in chapter 1.2. Literature review and is continued for each part
separately in chapters 4 and 5. The study concludes with implications for planning,
recommendations and lessons learned as well as suggestions for further research.
1.2 Literature review
This study is a unique pilot project for testing a futures research method for MSP purposes.
A similar idea was in a recent Finnish Transport Agency project, which collected expert
information in several stakeholder meetings for “Conditions for traffic 2035” vision and
long term plan (Finnish transport agency 2011a). The report identified and drew together
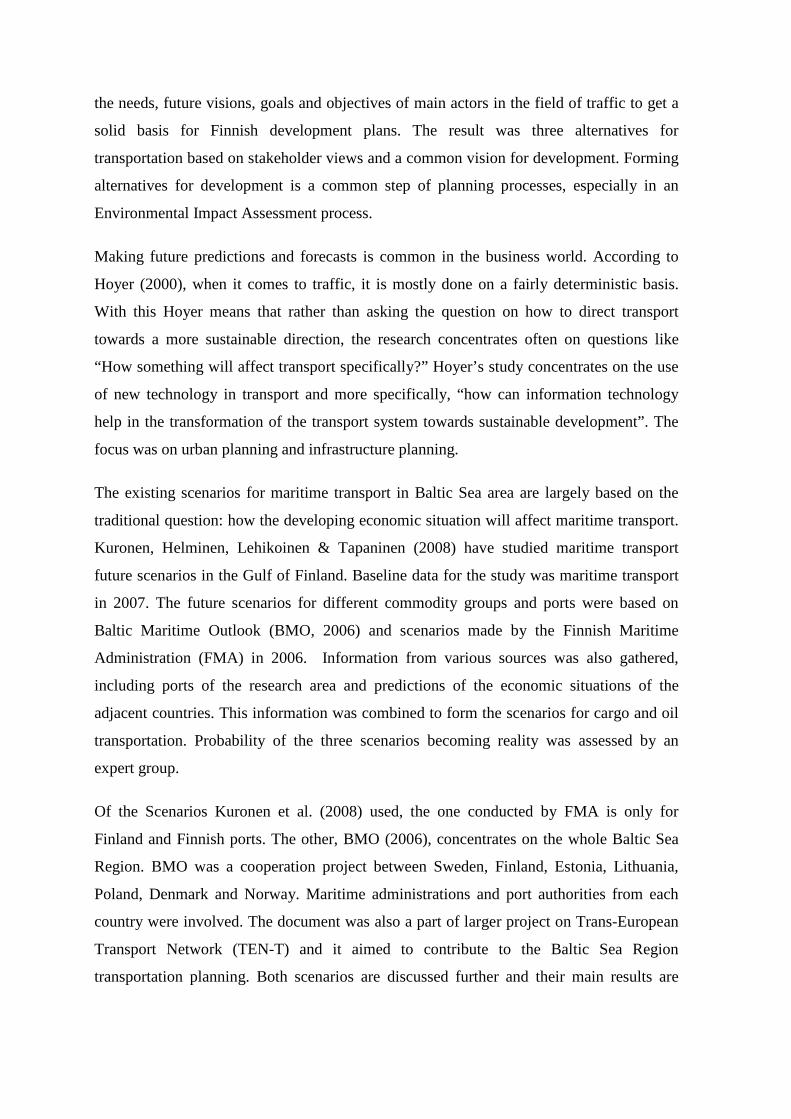
the needs, future visions, goals and objectives of main actors in the field of traffic to get a
solid basis for Finnish development plans. The result was three alternatives for
transportation based on stakeholder views and a common vision for development. Forming
alternatives for development is a common step of planning processes, especially in an
Environmental Impact Assessment process.
Making future predictions and forecasts is common in the business world. According to
Hoyer (2000), when it comes to traffic, it is mostly done on a fairly deterministic basis.
With this Hoyer means that rather than asking the question on how to direct transport
towards a more sustainable direction, the research concentrates often on questions like
“How something will affect transport specifically?” Hoyer’s study concentrates on the use
of new technology in transport and more specifically, “how can information technology
help in the transformation of the transport system towards sustainable development”. The
focus was on urban planning and infrastructure planning.
The existing scenarios for maritime transport in Baltic Sea area are largely based on the
traditional question: how the developing economic situation will affect maritime transport.
Kuronen, Helminen, Lehikoinen & Tapaninen (2008) have studied maritime transport
future scenarios in the Gulf of Finland. Baseline data for the study was maritime transport
in 2007. The future scenarios for different commodity groups and ports were based on
Baltic Maritime Outlook (BMO, 2006) and scenarios made by the Finnish Maritime
Administration (FMA) in 2006. Information from various sources was also gathered,
including ports of the research area and predictions of the economic situations of the
adjacent countries. This information was combined to form the scenarios for cargo and oil
transportation. Probability of the three scenarios becoming reality was assessed by an
expert group.
Of the Scenarios Kuronen et al. (2008) used, the one conducted by FMA is only for
Finland and Finnish ports. The other, BMO (2006), concentrates on the whole Baltic Sea
Region. BMO was a cooperation project between Sweden, Finland, Estonia, Lithuania,
Poland, Denmark and Norway. Maritime administrations and port authorities from each
country were involved. The document was also a part of larger project on Trans-European
Transport Network (TEN-T) and it aimed to contribute to the Baltic Sea Region
transportation planning. Both scenarios are discussed further and their main results are
21
presented in chapter 4 as these scenarios are also used as a basis in this study to make
forecasted scenarios for Gulf of Bothnia cargo volume. The idea is same as in the study
conducted by Kuronen et al. (2008) but due to the different nature of transportation in Gulf
of Bothnia and Gulf of Finland and somewhat different goal of this study, there are
changes in the way the scenarios are formed and assessed.
The results are compared to Baltic Transport Outlook (BTO) scenarios for maritime
transport in the Baltic Sea Region. According to BTO (2011, 1) “Baltic Transport Outlook
2030 is an EU funded project and a strategic priority within the Baltic Sea Strategy that
was adopted by the European Council in October 2009. The overall aim of the project is to
achieve better prerequisites for national long term infrastructure planning in the Baltic Sea
region to make the region more accessible and competitive.“ BTO is the latest scenario for
maritime transport in Baltic Sea. It was published in November 2011 after the forecast part
of this study was done, which is why its results are mainly used as comparison and not in
formation of the scenarios in this study. A SWOT analysis of Baltic Regions was also
conducted during BTO project. The SWOT results for Bothnian Sea transport was used in
key factor identification phase of this study.
None of the scenarios mentioned above concentrate on development of individual ports or
transport routes, which is what this study is aiming to do.
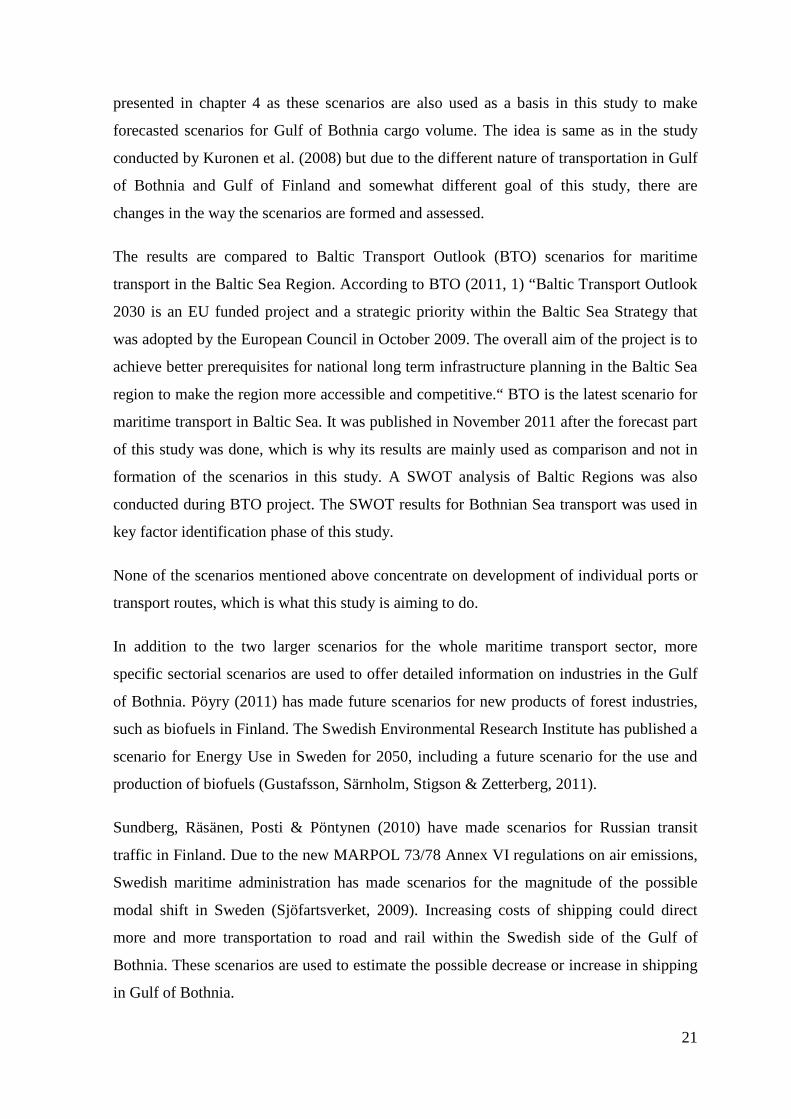
In addition to the two larger scenarios for the whole maritime transport sector, more
specific sectorial scenarios are used to offer detailed information on industries in the Gulf
of Bothnia. Pöyry (2011) has made future scenarios for new products of forest industries,
such as biofuels in Finland. The Swedish Environmental Research Institute has published a
scenario for Energy Use in Sweden for 2050, including a future scenario for the use and
production of biofuels (Gustafsson, Särnholm, Stigson & Zetterberg, 2011).
Sundberg, Räsänen, Posti & Pöntynen (2010) have made scenarios for Russian transit
traffic in Finland. Due to the new MARPOL 73/78 Annex VI regulations on air emissions,
Swedish maritime administration has made scenarios for the magnitude of the possible
modal shift in Sweden (Sjöfartsverket, 2009). Increasing costs of shipping could direct
more and more transportation to road and rail within the Swedish side of the Gulf of
Bothnia. These scenarios are used to estimate the possible decrease or increase in shipping
in Gulf of Bothnia.
The point of view in this study is on the other hand traditionally deterministic: how the
economic situation will affect the maritime transportation since most the data used is based
on this question. On the other hand, this study is also trying to find out if this is what
stakeholders and main actors in the field of maritime transport see as probable future
developments for the Gulf of Bothnia. This is done by means of Delphi method, developed
in 1950-1960 by RAND Corporation to collect expert judgements on a variety of topics
and described in detail by Linstone and Turoff (1975).
The Delphi method has not been widely used in a marine context. Perhaps the most
relevant example has been a study prepared by Myllylä and Iikkanen (1995): Changing
freight transport market in the Baltic Sea area – The position of South-Western Finland in
the context of Baltic Sea freight Network. In this study, a panel consisting of 15 experts
was considering the future developments until 2010, concerning mainly transit traffic, ferry
traffic between Sweden and Finland and positioning of North European distribution centres
and evaluating three scenarios for transport. Garrod (2003) has used Delphi panel to find
definitions for Marine Ecotourism and explore the perceptions of European Union and
Atlantic experts on this concept. Scenarios were not built in that study, Delphi method was
simply used to gather expert information. In the field of transport, Delphi method has been
used for example to find out future developments in European air traffic (Mason &
Alamjari, 2007).
23
2 RESEARCH AREA DESCRIPTION
2.1 Scope of the study
Definition of Gulf of Bothnia in this study is based on The HELCOM COMBINE manual.
(HELCOM, 2006) The research area includes the sub areas Bothnian Bay, Bothnian Sea
and The Quark. Åland Sea and Archipelago Sea have been left out from this study in order
to use the same southern limit as is used in the Plan Bothnia project. The Sea of Bothnia
(or Bothnian Sea) is the sea area between the line drawn on Northern side of Åland Island
between Ormön and Understen in Sweden to Emskär-Eckerö-Sälskär-Uusikaupunki and
Hörnefors-Vaasa in North. The Quark and Bay of Bothnia have been considered as a one
sea area in this study. Therefore the definition of the Bay of Bothnia is the sea area north of
a line drawn between Hörnefors-Vaasa. EEZ’s of Finland and Sweden cover the whole sea
area. The sea is divided between these two countries based on an agreement on borders,
which was checked the last time in 1981. (Law on Finnish Territorial Sea, 1956, article 1)
The Gulf of Bothnia coastline consists of seven regions on the Finnish side and five on the
Swedish side. Within those, there are 41 municipalities having coastline to the Gulf of
Bothnia in Finland and 19 in Sweden. In 2010, around 1,4 million people inhabited the
municipalities with direct coastline to GoB. In Continental Finland there are about 627 000
inhabitants, Åland around 6000 and Sweden 773 000. (SVT, 2011, SCB, 2011)
This study concentrates on finding out the transport patterns mainly in the offshore areas of
the Gulf of Bothnia. However, as the main drivers for development are on land, the scope
of the scenarios is wider than the marine areas in the Gulf of Bothnia.
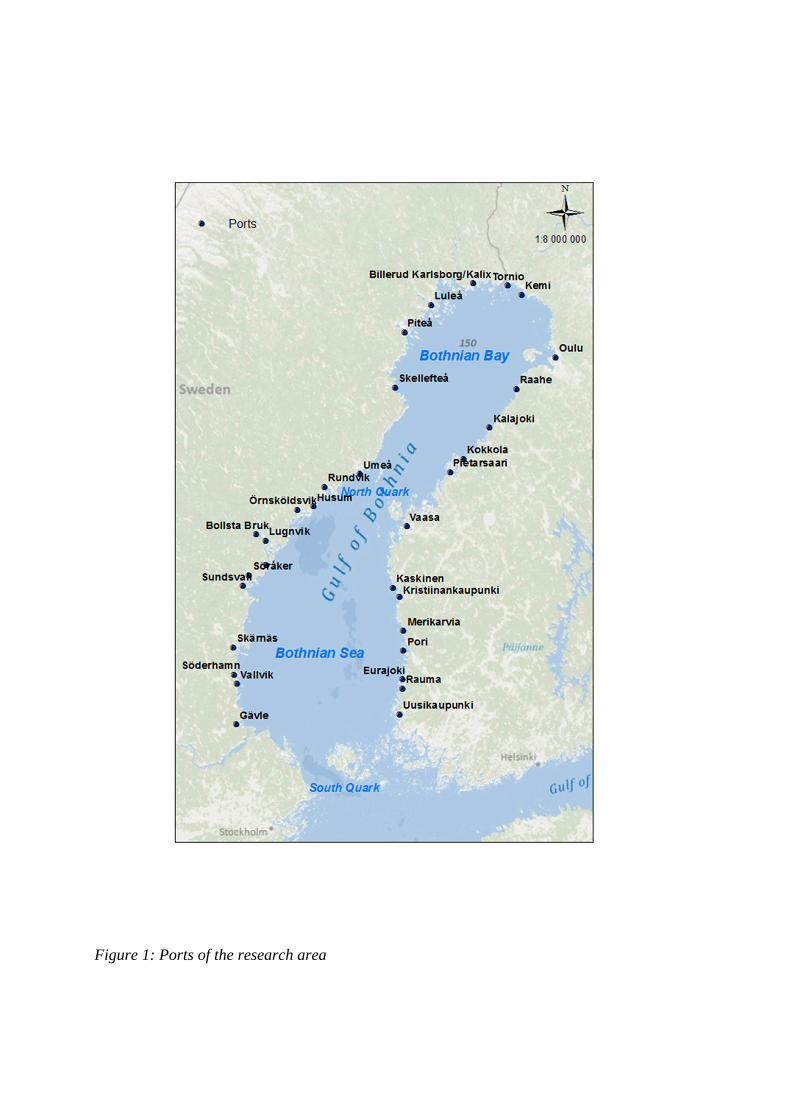
Figure 1: Ports of the research area
25
2.2 Navigation in offshore areas of Gulf of Bothnia
2.2.1 Legal background
The right to set rules for maritime transport in coastal states Exclusive Economic Zone
(EEZ) is based on the United Nations Convention on the Law of the Sea (UNCLOS, 1982).
The Baltic Sea has a Particularly Sensitive Sea Area (PSSA) status given by IMO as well
as a Special Area under MARPOL-status, which gives the coastal states of the Baltic
somewhat larger variety of means to govern maritime transport in their EEZs. For example
establishing routing measures in EEZs is possible and this has been done in Baltic Proper
as well as Gulf of Finland with Traffic Separation Schemes (TSS) and Deep Water Routes.
An interesting example of enforcing governance on Maritime Transport is the Norwegian-
Russian Barents Sea case where Norway has been exploring measures to manage the
potentially increasing oil and gas transports from Russia through the Norwegian EEZ. The
measures include for example extended territorial water limit, Vessel Traffic Services,
PSSA-status for parts of Barents Sea and Traffic Separation Scheme. A physical Marine
Spatial Plan of Norwegian Barents Sea was included in the Barents Sea Management plan.
The Barents Sea case has similarities with the Baltic Sea case as it concerns Maritime
transport in ice covered areas. UNCLOS article 231 handles specifically rights to govern
navigation in ice-covered EEZ’s and gives the coastal states a right to take measures to
prevent pollution from vessels in harsh climatic conditions (Stepanov & Brubaker 2005).
Another possibility to get legal backing for Maritime Spatial Planning is establishing
mandatory or recommended Areas To Be Avoided (ATBA). These kinds of areas also exist
in Baltic Proper, namely the Hoburg bank south of Gotland. For example particularly
sensitive natural areas with higher risk of accidents, such as banks, could be stated areas to
be avoided by commercial shipping. Unlike nature protection areas such as Natura 2000,
the ATBAs are marked in navigational charts.
According to IMO, the measures that coastal states are allowed to take within their EEZs
concerning maritime transport must be limited to such actions that have been approved by
IMO. These are therefore the main opportunities to govern maritime transport in EEZ, with
a legal basis. The measures must also be taken so that ships do not have to take
unnecessarily long alternative routes to comply with set regulations. Most of the approved
means to enforce rules on navigation in EEZs are already in use in the Baltic Sea.
2.2.2 Routing system for marine transportation in the Gulf of Bothnia
No fairways exist or are planned within Finnish and Swedish EEZs in the Bothnian Sea.
All fairways for commercial ships begin when they enter the territorial waters of coastal
states. From the starting point the fairways are usually 1-2 nautical miles wide and get
narrower towards the coastline. There is no standard for fairway width; planning of a
fairway is done case by case. The width is dependent on geography and hydrographic
characteristics of the area. In the Bothnian Sea area, the difficult ice conditions must be
taken in account when planning fairways. Generally the ships need more space when
operating in ice (Hartikainen & Reilimo, 2011).
If there is special need for a marked shipping route in open sea area, the solution is setting
a routing system such as TSS or Deep Water Route. At the moment there is a TSS and
Deep Water Route in South Quark in the narrow channel between Sweden and the Åland
Islands. Another TSS is planned for the narrow part of North Quark between the cities of
Vaasa and Umeå, where increasing traffic requires actions to ensure the safety of shipping.
Outside the TSS areas, the ships generally navigate shortest possible way to the ports. The
Automatic Identification System (AIS) tracks (HELCOM, 2012a) show that most of the
ships follow the same, mostly straight-line routes to main ports, as if they were navigating
on a fairway. This data gives good basis for MSP when defining the important areas for
maritime transportation.
Even though the official fairways are lacking from EEZs, Sweden has identified National
Interest fairways within the whole Swedish EEZ. In the Bothnian Sea area these identified
areas are the straightest routes to the main ports as well as the Swedish coastal route, which
can have great importance during the ice navigation season. National interest fairways are
also partly in Finnish side. In the Bay of Bothnia the route between port of Raahe and the
port of Luleå is marked as National interest fairway due to the regular iron ore transports to
the Raahe steel mill (HELCOM 2012b).
27
Using Finnish and Swedish fairways adds costs for the shipping companies. The costs are
piloting fees and fairway fees. In the beginning of 2012, Finnish piloting fees increased by
about 9.5%. However, even after the increase the fees are still lower than in Sweden
(Finnpilot, 2011). Sweden has planned increases in fairway fees, piloting fees and railway
fees. The analysis of impacts (Vierth & Mellin, 2010) stated that they can be expected to
be greatest for the Bothnian Bay transport, except when it comes to railway fees which
were considered to be low compared to some southern railways such as Gävle railway. The
impacts of the price increase were generally considered to be modest compared to the
Sulphur directive impacts on transports. According to the study, increase of prices in the
Bothnian Bay would be about 7.5-11%, depending on the scenario.
2.2.3 Maritime Safety
Maritime traffic in the Gulf of Bothnia is at the moment observed in two Vessel Traffic
Service units in Finnish coast. West Coast VTS is located in Kallo, Pori and Bothnia VTS
in Vaasa. These two units will combine in near future with Archipelago-VTS of Nauvo, to
form a Gulf of Bothnia VTS. The new centre will be located in Turku. Sweden has VTS
centers in Stockholm and Luleå.
Traffic observations are done mostly by AIS data. The Gulf of Bothnia piloting areas in
Sweden are Umeå, Luleå, Skellefteå and Örnsköldsvik. They offer mandatory piloting to
their responsibility ports in Swedish territorial waters. In Finland there are two areas, the
Bothnian Bay and Bothnian Sea pilotage areas, which are divided in pilot centers of
Bothnian Bay, Kokkola, Vaasa and Rauma.
2.2.4 Navigation in ice
Ice conditions in the Gulf of Bothnia are difficult during the winter time. Finland and
Sweden set winter restrictions for ships navigating in their waters. Only the ships with
specific ice classes are qualified to get assistance from the states’ ice breakers during the
winter season. The restrictions are set depending on the severity of ice conditions and they
vary yearly. In the Bay of Bothnia, the ice conditions are the most severe and the bay is
frozen also during the mild and short ice winters.
During an average winter, such as 2009-2010, Bothnian Bay restrictions are likely to begin
in December. Bothnian Sea restrictions begin later in end of December-January. In
February-March the ice cover reaches the maximum and restriction can be set higher in the
whole Gulf of Bothnia. The last days of restrictions are usually in April-May.
Finland and Sweden cooperate in organizing ice breaking services in the Bothnian Sea. For
example during the winter 2009, five icebreakers operated in the Bothnian Bay, of which
one was Swedish and four Finnish owned. In the Bothnian Sea the icebreaker fleet
consisted of five icebreakers and two tugboats (BIM, 2010).
Winter changes navigation procedures. During the ice breaking season the ships cannot
often take similar routes as during the ice free season. Ships navigating to ports in the Gulf
of Bothnia during the ice restrictions must make an announcement for ice info via VHF
radio. The operating ice breaker will give the ships route points or instructions on how to
navigate. The importance of the routes running along the coast grow in winter time, while
in summertime they are used more seldom as ships navigate the shortest possible way to
ports. During the winter time ice breaking services might be restricted for coastal fairways
only. Ships must comply with set speed limits and generally they must have a pilot on
board. During difficult ice conditions the traffic separation schemes can also be
temporarily not in use in the Quark and Åland Sea narrow channels (Finnish Transport
agency 2011b).
2.2.5 Environmental regulations concerning Maritime transport in
offshore areas
During the next decade the new air emission restrictions that are set in MARPOL Annex
VI by IMO are likely to have a great effect in shipping in the research area. The aim of the
regulations is to tackle most of the Sulphur and Nitrogen emissions from shipping. IMO is
also considering market based measures to reduce CO2-emissions. A brief description of
main maritime transport induced pollution and regulations concerning the Gulf of Bothnia
can be found below.
SOx
The Baltic Sea is designated as a Sulphur Emission Control Area (SECA). The sulphur
content of fuel that is used in the Baltic Sea was reduced in 2010 from 1,5% to 1%. EU has
29
set an additional requirement; 0,1% fuel must be used when operating in harbor area. In
2015 all fuel used by ships in the Baltic Sea area must contain no more than 0,1% sulphur.
Alternatively, SOx scrubbers resulting in same SOx abatement may be used. Adverse
environmental and health impacts from sulphur emissions and particulate matter (PM) will
be reduced with implementation of the SECA regulations (Kalli & Tapaninen, 2008).
NOx
Designation of the Baltic Sea as Nitrogen Emission Control Area (NECA), to reduce air-
emitted nitrogen that adds to the eutrophication problems of Baltic Sea is mentioned in
HELCOM Baltic Sea Action Plan. If the Baltic Sea will become a NECA, newly built
ships operating in the Baltic Sea area must install a system to tackle nitrogen emissions
from 2016 onwards. The only viable method at the moment is a SCR exhaust gas after
treatment device, which would reduce the nitrogen load from ships more than 80% (Kalli,
Repka & Karvonen, 2010).
CO2
Currently there are no binding goals to reduce CO2 emissions of shipping. The latest
achievement on the matter is the new Energy Efficiency Design Index (EEDI) for new
ships to promote energy efficiency in shipping and therefore reduce CO2 emissions. IMO
has evaluated that with currently available technical and operative measures, energy
savings could be between 25% and 75% in 2050 (Finnish Transport Agency 2011a). IMO
is also currently working on the best available market based measures to tackle CO2
emissions (IMO 2009).
Oil pollution
Although the amount of oil transports in the Gulf of Bothnia is considerably smaller than
in the Gulf of Finland, the risk of oil accidents should not be overlooked. Ice conditions are
difficult and the narrow navigational routes of North and South Quark pass archipelago
areas with valuable natural features. The Baltic Sea Action Plan has set an obligation for
member states to participate preparing a mutual plan for places of refuge in case of
emergency. The plan will be a new HELCOM recommendation. The place for refuge could
be in the area of another country than the one where the distress situation originally begun.
In the Gulf of Bothnia this could mean that oil spill hazard could be directed to the nearest
place for refuge in Finland or Sweden, independent on which country’s response zone the
accident occurs. Requesting shelter in neighboring country could be based on weather
conditions or lack of shelter in each country’s own response zone, not on financial reasons
or lack of emergency response resources (HELCOM, 2010).
A risk analysis and a development plan for oil accident response are currently being
prepared for the Finnish side of the Bay of Bothnia. The results will be published in 2012.
The previous plan for the Finnish side was made in 2005 by regional environment centers
and it covered the area North of Vaasa. The new plan aims to take into account the
increasing maritime traffic due to mining activities (SYKE, 2011).
Sweden has a national strategic plan for oil accident emergency response covering all
national, regional and municipal actors that are involved in the process (Räddningsverket,
2004). BRISK project by HELCOM does risk analysis on oil spills for the whole Baltic
Sea Region.
Illegal oil discharges
According to HELCOM (2010) “altogether 149 oil spills were observed in 2010, which is
29 less than in 2009 and 61 less than in 2008. In general, the number of detected oil spills
in the Baltic Sea has been constantly decreasing, even though the density of shipping has
rapidly grown and the aerial surveillance activity in the countries has been substantially
improved”. Surveillance is done with small aircrafts and all Baltic Sea countries except
Latvia contributed to the total 4279 flight hours in the Baltic Sea area. Oil discharges are
also detected by using satellite images. 91 % of all detected spills were smaller than 1 m3
and none of the detected spills were in the Gulf of Bothnia area.
Alien species and Ballast water management
Alien species spreading with ballast waters of ships or attached to surfaces is an interesting
question in the Baltic Sea context. The shallow and small sea area enables some of the
local species to spread on their own. The IMO Ballast Water Management Convention
(BWMC), to be ratified by HELCOM countries by 2013, will reduce the risk of alien
species spreading to the Baltic Sea from other sea areas, but Intra Baltic transportation is
an issue that must be addressed separately. A pilot risk assessment was recently conducted.
The study addresses the BWMC regulations that apply to Intra Baltic Voyages and makes
31
suggestions for HELCOM. Especially the concept “Same Location” is considered,
referring to areas that are ecologically similar and do not require Ballast water
management for voyages within the areas (HELCOM, 2011a).
2.3 Maritime transport in the Gulf of Bothnia 2010
The Gulf of Bothnia coasts are characterized with several small ports rather than large
centralized port complexes. Organizational changes in ports are a common trend in Finland
and Sweden. Most of the ports used to be municipal corporations but privatization is
expected to be more common in the future due to the EU regulations about the special
status of municipal corporations (Mylly, 2010). Port of Gävle recently went through a
major organizational change as the Gävle Hamn AB (Joint stock Company) bought the
whole port infrastructure from Municipality of Gävle. There are also several private
industrial ports in the Gulf of Bothnia. The large port complexes often include private port
units.
About 11 770 ship calls were made in Gulf of Bothnia Ports in 2010. As a comparison, the
port of Helsinki alone had about 8000 ship calls, the port of St. Petersburg 9000 and the
port of Helsingborg 30 000 in the same year. Of all the ship calls in the Baltic Sea, about
3,8% was made in Gulf of Bothnia Ports. The total cargo volume handled in the Gulf of
Bothnia ports was about 66,5 million tons. This is about 0,8% of the cargo volume in the
whole Baltic Sea. The rather shallow fairways to the ports set limits to the size of the ships
and the amount of cargo they can carry. The Gulf of Bothnia is characterized with a fleet of
relatively small ships.
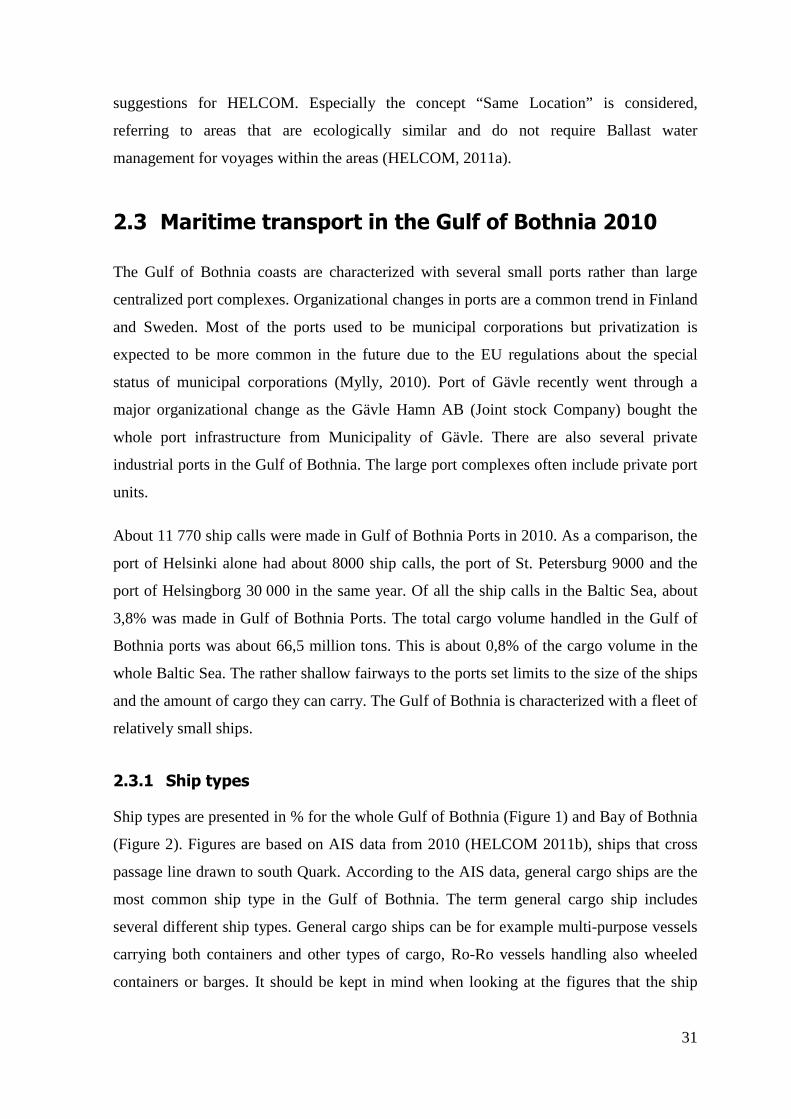
2.3.1 Ship types
Ship types are presented in % for the whole Gulf of Bothnia (Figure 1) and Bay of Bothnia
(Figure 2). Figures are based on AIS data from 2010 (HELCOM 2011b), ships that cross
passage line drawn to south Quark. According to the AIS data, general cargo ships are the
most common ship type in the Gulf of Bothnia. The term general cargo ship includes
several different ship types. General cargo ships can be for example multi-purpose vessels
carrying both containers and other types of cargo, Ro-Ro vessels handling also wheeled
containers or barges. It should be kept in mind when looking at the figures that the ship
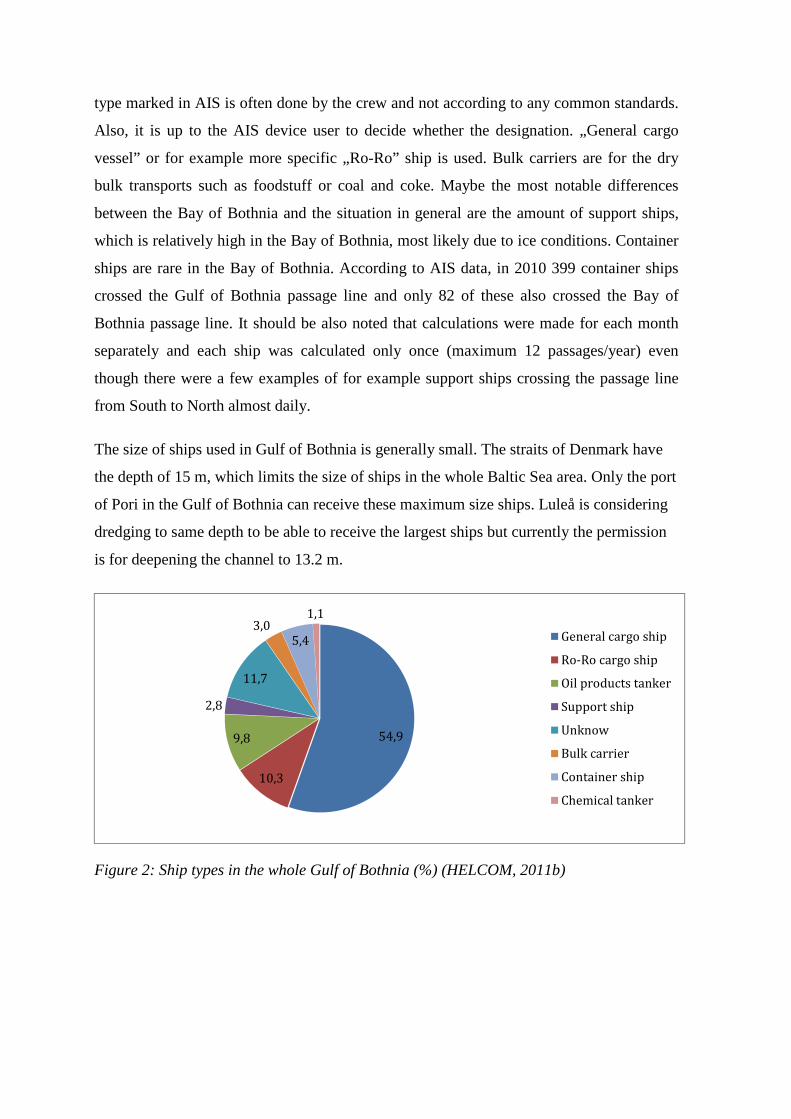
type marked in AIS is often done by the crew and not according to any common standards.
Also, it is up to the AIS device user to decide whether the designation. „General cargo
vessel” or for example more specific „Ro-Ro” ship is used. Bulk carriers are for the dry
bulk transports such as foodstuff or coal and coke. Maybe the most notable differences
between the Bay of Bothnia and the situation in general are the amount of support ships,
which is relatively high in the Bay of Bothnia, most likely due to ice conditions. Container
ships are rare in the Bay of Bothnia. According to AIS data, in 2010 399 container ships
crossed the Gulf of Bothnia passage line and only 82 of these also crossed the Bay of
Bothnia passage line. It should be also noted that calculations were made for each month
separately and each ship was calculated only once (maximum 12 passages/year) even
though there were a few examples of for example support ships crossing the passage line
from South to North almost daily.
The size of ships used in Gulf of Bothnia is generally small. The straits of Denmark have
the depth of 15 m, which limits the size of ships in the whole Baltic Sea area. Only the port
of Pori in the Gulf of Bothnia can receive these maximum size ships. Luleå is considering
dredging to same depth to be able to receive the largest ships but currently the permission
is for deepening the channel to 13.2 m.
Figure 2: Ship types in the whole Gulf of Bothnia (%) (HELCOM, 2011b)
54,9
10,3
9,8
2,8
11,7
3,05,4
1,1
General cargo ship
Ro-Ro cargo ship
Oil products tanker
Support ship
Unknow
Bulk carrier
Container ship
Chemical tanker
33
Figure 3: Ship types in Bay of Bothnia (%) (HELCOM, 2011b)
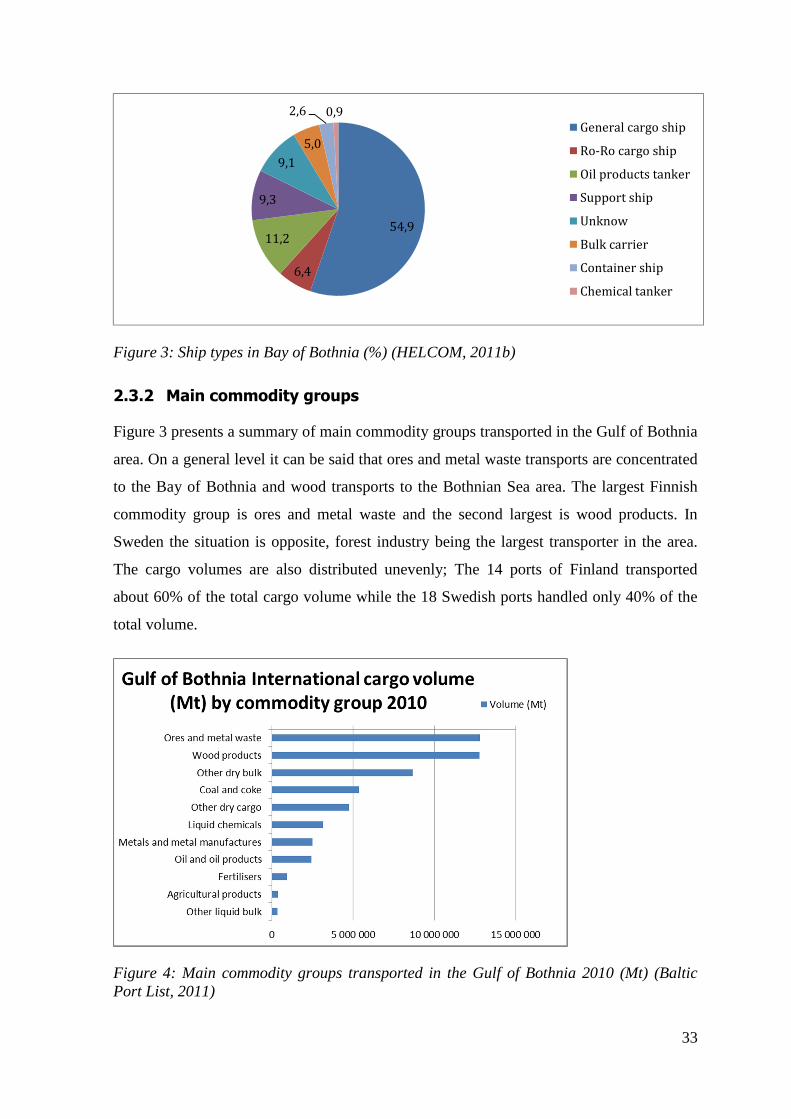
2.3.2 Main commodity groups
Figure 3 presents a summary of main commodity groups transported in the Gulf of Bothnia
area. On a general level it can be said that ores and metal waste transports are concentrated
to the Bay of Bothnia and wood transports to the Bothnian Sea area. The largest Finnish
commodity group is ores and metal waste and the second largest is wood products. In
Sweden the situation is opposite, forest industry being the largest transporter in the area.
The cargo volumes are also distributed unevenly; The 14 ports of Finland transported
about 60% of the total cargo volume while the 18 Swedish ports handled only 40% of the
total volume.
Figure 4: Main commodity groups transported in the Gulf of Bothnia 2010 (Mt) (Baltic Port List, 2011)
54,9
6,4
11,2
9,3
9,1
5,0
2,6 0,9
General cargo ship
Ro-Ro cargo ship
Oil products tanker
Support ship
Unknow
Bulk carrier
Container ship
Chemical tanker
2.4 Analysis of current status of transports and
economic development
Finnish and Swedish transport statistics and descriptions from 2010 have been used as
current status data for this study. The shares of ports in the Gulf of Bothnia of the total
international cargo volumes are based on these figures. Some of the main assumptions
concerning the quantitative scenarios for Gulf of Bothnia are based on the descriptions of
economic situations in Finland and Sweden.
2.4.1 Finland
Economic development of Finland
Finnish Bank estimated in March 2011 that GDP growth for 2011 would be 3,8% and for
years 2012-2013 about 2,5%. This estimation has come down in the latest Finnish
estimation, which predicts an average growth of 1,9 % for years 2012-2015.
Economic growth can be expected to slow down in future due to aging of Finnish
population as large post-world war II age groups will retire during the next decade. Finland
has highly specialized export sector and the public services development has been weak.
According to the ministry of finances, industries will be further supported with energy
taxation reductions for energy intensive industries, subsidies for shipping companies to
invest in innovations and environmentally friendly technology. Opportunities for financing
of exports will be enhanced by internationally competitive export financing model and a
free guarantee by state (Ministry of Finances, 2011).
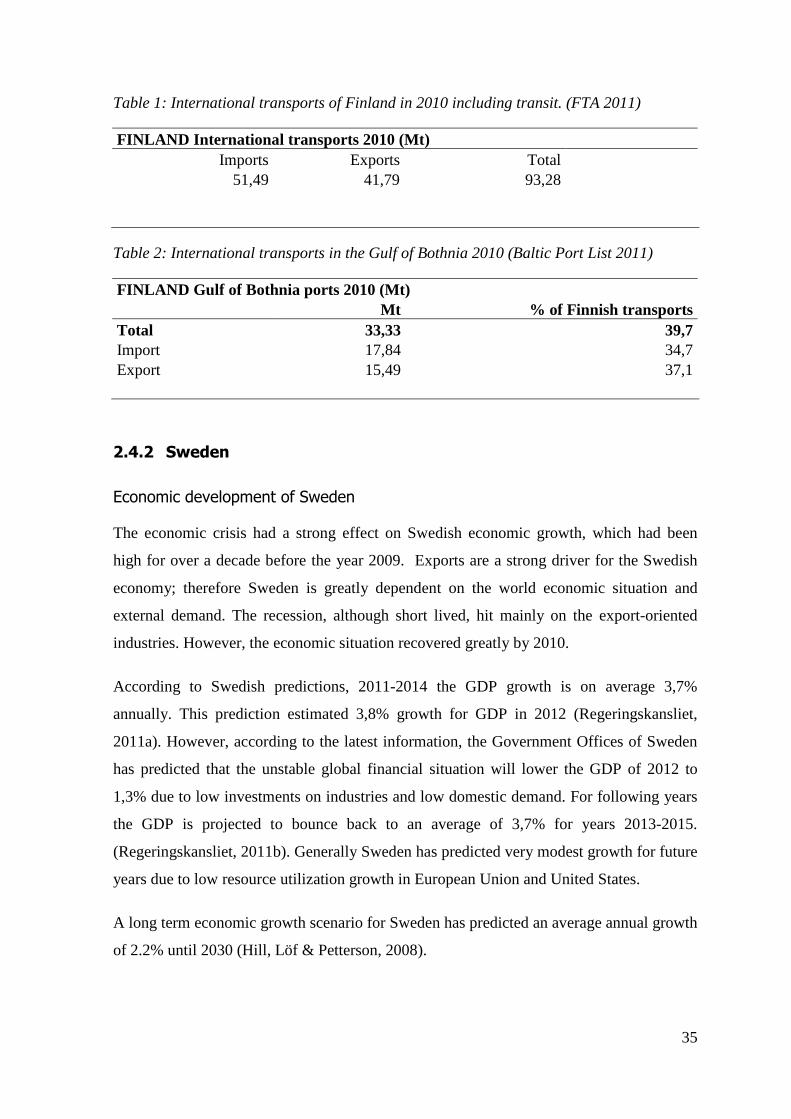
Cargo volumes in 2010
The numbers presented in tables 1 and 2 include the international transports of Finland and
Gulf of Bothnia in 2010, including transit traffic.
35
Table 1: International transports of Finland in 2010 including transit. (FTA 2011)
FINLAND International transports 2010 (Mt) Imports Exports Total
51,49 41,79 93,28
Table 2: International transports in the Gulf of Bothnia 2010 (Baltic Port List 2011)
FINLAND Gulf of Bothnia ports 2010 (Mt) Mt % of Finnish transports Total 33,33 39,7 Import 17,84 34,7 Export 15,49 37,1
2.4.2 Sweden
Economic development of Sweden
The economic crisis had a strong effect on Swedish economic growth, which had been
high for over a decade before the year 2009. Exports are a strong driver for the Swedish
economy; therefore Sweden is greatly dependent on the world economic situation and
external demand. The recession, although short lived, hit mainly on the export-oriented
industries. However, the economic situation recovered greatly by 2010.
According to Swedish predictions, 2011-2014 the GDP growth is on average 3,7%
annually. This prediction estimated 3,8% growth for GDP in 2012 (Regeringskansliet,
2011a). However, according to the latest information, the Government Offices of Sweden
has predicted that the unstable global financial situation will lower the GDP of 2012 to
1,3% due to low investments on industries and low domestic demand. For following years
the GDP is projected to bounce back to an average of 3,7% for years 2013-2015.
(Regeringskansliet, 2011b). Generally Sweden has predicted very modest growth for future
years due to low resource utilization growth in European Union and United States.
A long term economic growth scenario for Sweden has predicted an average annual growth
of 2.2% until 2030 (Hill, Löf & Petterson, 2008).
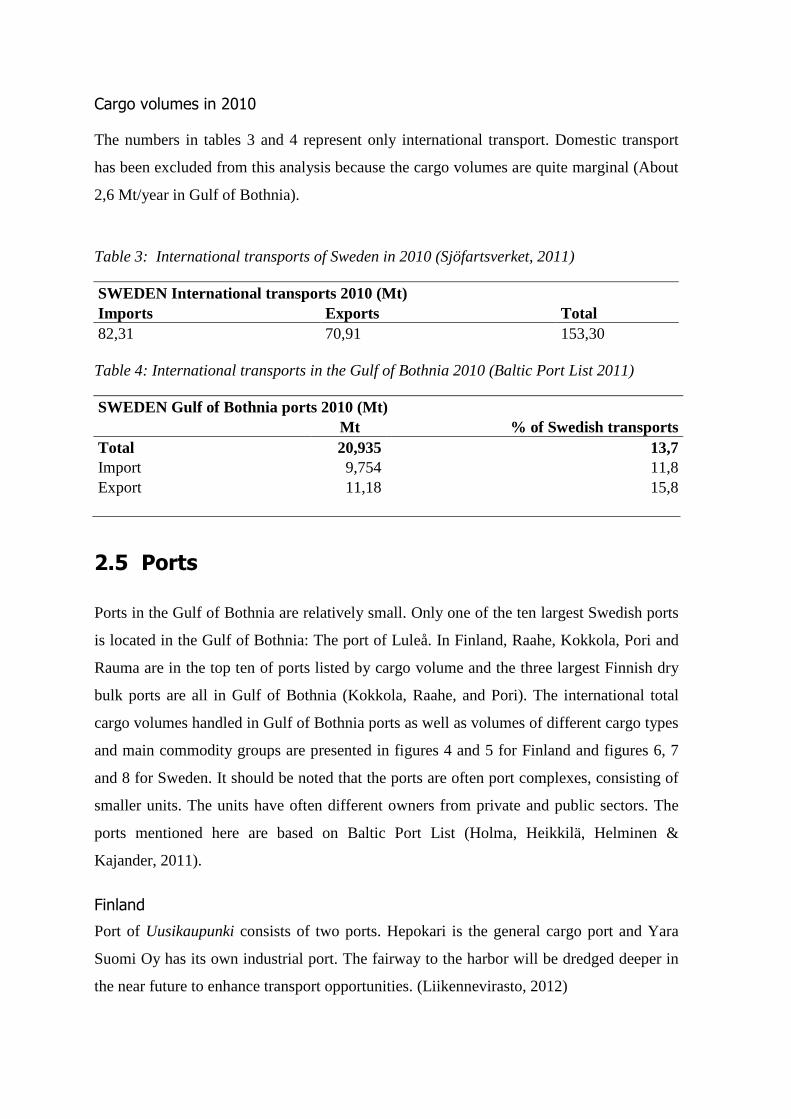
Cargo volumes in 2010
The numbers in tables 3 and 4 represent only international transport. Domestic transport
has been excluded from this analysis because the cargo volumes are quite marginal (About
2,6 Mt/year in Gulf of Bothnia).
Table 3: International transports of Sweden in 2010 (Sjöfartsverket, 2011)
SWEDEN International transports 2010 (Mt) Imports Exports Total 82,31 70,91 153,30 Table 4: International transports in the Gulf of Bothnia 2010 (Baltic Port List 2011)
SWEDEN Gulf of Bothnia ports 2010 (Mt) Mt % of Swedish transports Total 20,935 13,7 Import 9,754 11,8 Export 11,18 15,8
2.5 Ports
Ports in the Gulf of Bothnia are relatively small. Only one of the ten largest Swedish ports
is located in the Gulf of Bothnia: The port of Luleå. In Finland, Raahe, Kokkola, Pori and
Rauma are in the top ten of ports listed by cargo volume and the three largest Finnish dry
bulk ports are all in Gulf of Bothnia (Kokkola, Raahe, and Pori). The international total
cargo volumes handled in Gulf of Bothnia ports as well as volumes of different cargo types
and main commodity groups are presented in figures 4 and 5 for Finland and figures 6, 7
and 8 for Sweden. It should be noted that the ports are often port complexes, consisting of
smaller units. The units have often different owners from private and public sectors. The
ports mentioned here are based on Baltic Port List (Holma, Heikkilä, Helminen &
Kajander, 2011).
Finland
Port of Uusikaupunki consists of two ports. Hepokari is the general cargo port and Yara
Suomi Oy has its own industrial port. The fairway to the harbor will be dredged deeper in
the near future to enhance transport opportunities. (Liikennevirasto, 2012)
37
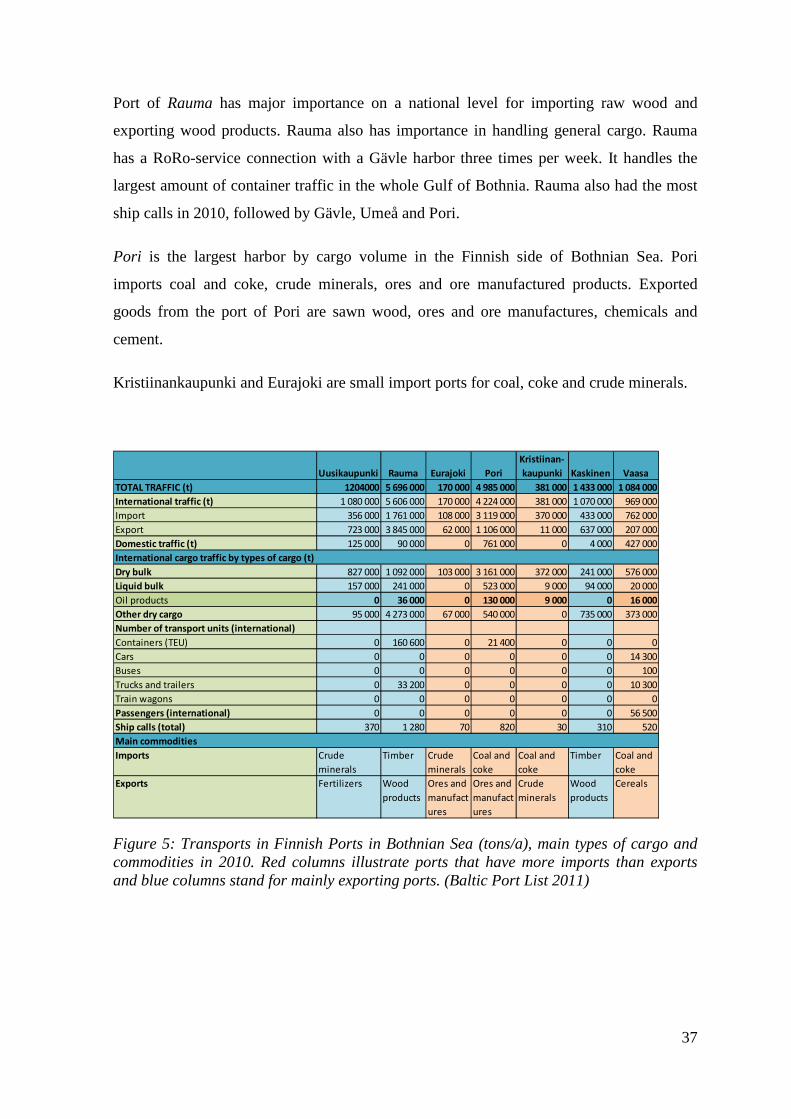
Port of Rauma has major importance on a national level for importing raw wood and
exporting wood products. Rauma also has importance in handling general cargo. Rauma
has a RoRo-service connection with a Gävle harbor three times per week. It handles the
largest amount of container traffic in the whole Gulf of Bothnia. Rauma also had the most
ship calls in 2010, followed by Gävle, Umeå and Pori.
Pori is the largest harbor by cargo volume in the Finnish side of Bothnian Sea. Pori
imports coal and coke, crude minerals, ores and ore manufactured products. Exported
goods from the port of Pori are sawn wood, ores and ore manufactures, chemicals and
cement.
Kristiinankaupunki and Eurajoki are small import ports for coal, coke and crude minerals.
Figure 5: Transports in Finnish Ports in Bothnian Sea (tons/a), main types of cargo and commodities in 2010. Red columns illustrate ports that have more imports than exports and blue columns stand for mainly exporting ports. (Baltic Port List 2011)
Uusikaupunki Rauma Eurajoki Pori
Kristiinan-
kaupunki Kaskinen Vaasa
TOTAL TRAFFIC (t) 1204000 5 696 000 170 000 4 985 000 381 000 1 433 000 1 084 000
International traffic (t) 1 080 000 5 606 000 170 000 4 224 000 381 000 1 070 000 969 000
Import 356 000 1 761 000 108 000 3 119 000 370 000 433 000 762 000
Export 723 000 3 845 000 62 000 1 106 000 11 000 637 000 207 000
Domestic traffic (t) 125 000 90 000 0 761 000 0 4 000 427 000
Dry bulk 827 000 1 092 000 103 000 3 161 000 372 000 241 000 576 000
Liquid bulk 157 000 241 000 0 523 000 9 000 94 000 20 000
Oil products 0 36 000 0 130 000 9 000 0 16 000
Other dry cargo 95 000 4 273 000 67 000 540 000 0 735 000 373 000
Number of transport units (international)
Containers (TEU) 0 160 600 0 21 400 0 0 0
Cars 0 0 0 0 0 0 14 300
Buses 0 0 0 0 0 0 100
Trucks and trailers 0 33 200 0 0 0 0 10 300
Train wagons 0 0 0 0 0 0 0
Passengers (international) 0 0 0 0 0 0 56 500
Ship calls (total) 370 1 280 70 820 30 310 520
Main commodities
Imports Crude
minerals
Timber Crude
minerals
Coal and
coke
Coal and
coke
Timber Coal and
coke
Exports Fertilizers Wood
products
Ores and
manufact
ures
Ores and
manufact
ures
Crude
minerals
Wood
products
Cereals
International cargo traffic by types of cargo (t)
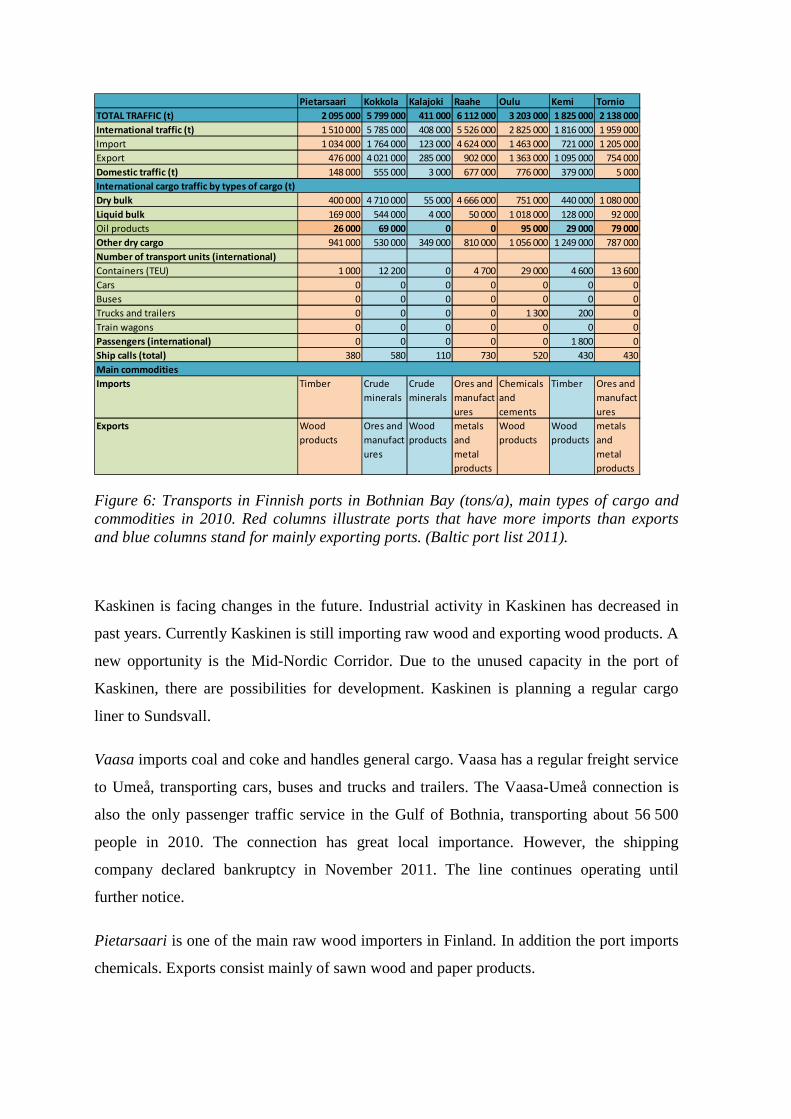
Figure 6: Transports in Finnish ports in Bothnian Bay (tons/a), main types of cargo and commodities in 2010. Red columns illustrate ports that have more imports than exports and blue columns stand for mainly exporting ports. (Baltic port list 2011).
Kaskinen is facing changes in the future. Industrial activity in Kaskinen has decreased in
past years. Currently Kaskinen is still importing raw wood and exporting wood products. A
new opportunity is the Mid-Nordic Corridor. Due to the unused capacity in the port of
Kaskinen, there are possibilities for development. Kaskinen is planning a regular cargo
liner to Sundsvall.
Vaasa imports coal and coke and handles general cargo. Vaasa has a regular freight service
to Umeå, transporting cars, buses and trucks and trailers. The Vaasa-Umeå connection is
also the only passenger traffic service in the Gulf of Bothnia, transporting about 56 500
people in 2010. The connection has great local importance. However, the shipping
company declared bankruptcy in November 2011. The line continues operating until
further notice.
Pietarsaari is one of the main raw wood importers in Finland. In addition the port imports
chemicals. Exports consist mainly of sawn wood and paper products.
Pietarsaari Kokkola Kalajoki Raahe Oulu Kemi Tornio
TOTAL TRAFFIC (t) 2 095 000 5 799 000 411 000 6 112 000 3 203 000 1 825 000 2 138 000
International traffic (t) 1 510 000 5 785 000 408 000 5 526 000 2 825 000 1 816 000 1 959 000
Import 1 034 000 1 764 000 123 000 4 624 000 1 463 000 721 000 1 205 000
Export 476 000 4 021 000 285 000 902 000 1 363 000 1 095 000 754 000
Domestic traffic (t) 148 000 555 000 3 000 677 000 776 000 379 000 5 000
International cargo traffic by types of cargo (t)
Dry bulk 400 000 4 710 000 55 000 4 666 000 751 000 440 000 1 080 000
Liquid bulk 169 000 544 000 4 000 50 000 1 018 000 128 000 92 000
Oil products 26 000 69 000 0 0 95 000 29 000 79 000
Other dry cargo 941 000 530 000 349 000 810 000 1 056 000 1 249 000 787 000
Number of transport units (international)
Containers (TEU) 1 000 12 200 0 4 700 29 000 4 600 13 600
Cars 0 0 0 0 0 0 0
Buses 0 0 0 0 0 0 0
Trucks and trailers 0 0 0 0 1 300 200 0
Train wagons 0 0 0 0 0 0 0
Passengers (international) 0 0 0 0 0 1 800 0
Ship calls (total) 380 580 110 730 520 430 430
Main commodities
Imports Timber Crude
minerals
Crude
minerals
Ores and
manufact
ures
Chemicals
and
cements
Timber Ores and
manufact
ures
Exports Wood
products
Ores and
manufact
ures
Wood
products
metals
and
metal
products
Wood
products
Wood
products
metals
and
metal
products
39
Kokkola is currently the only port in the Gulf of Bothnia handling transit traffic to and
from Russia. The transit goods are mainly iron pellets transportation from North West
Russia through Vartius railroad to Kokkola harbor and onwards. In 2010 the volume of
transit traffic was 2,7 million tons, which is about a third of the Finnish transit volume. In
addition Kokkola handles local metal industry transports.
Kalajoki (former Rahja) is a small harbor exporting mainly sawn wood.
Raahe harbor imports ores from Luleå to the local steel mill and exports metals and metal
products. The route from Luleå to Raahe has regular transportation and it is marked as
national interest fairway of Sweden.
Oulu is the third largest container port in the whole Gulf of Bothnia after Rauma and
Gävle. In addition, wood products and liquid bulk such as oil products and chemicals are
imported. Oulu handles almost the same amount of exports and imports; the main export
item is paper.
Most of the Kemi imports are raw wood and exports wood products. Northern mining
products from Kolari-Pajala were expected to be transported through Kemi but the mining
company decided to transport the Pajala products through Narvik in Norway. The other
new mining activities in Northern Finland can have an effect since Kemi is the nearest port
for several mining sites. More potential growth for the harbor is offered by planned biofuel
production plant and carbon dioxide liquefaction project in Kemi area (Viitala 2011).
Tornio is a typical stainless steel and metal industry harbor, importing mainly crude
minerals and ores and exporting metals and metal products.
Olkiluoto nuclear power plant has also port facilities.
Sweden
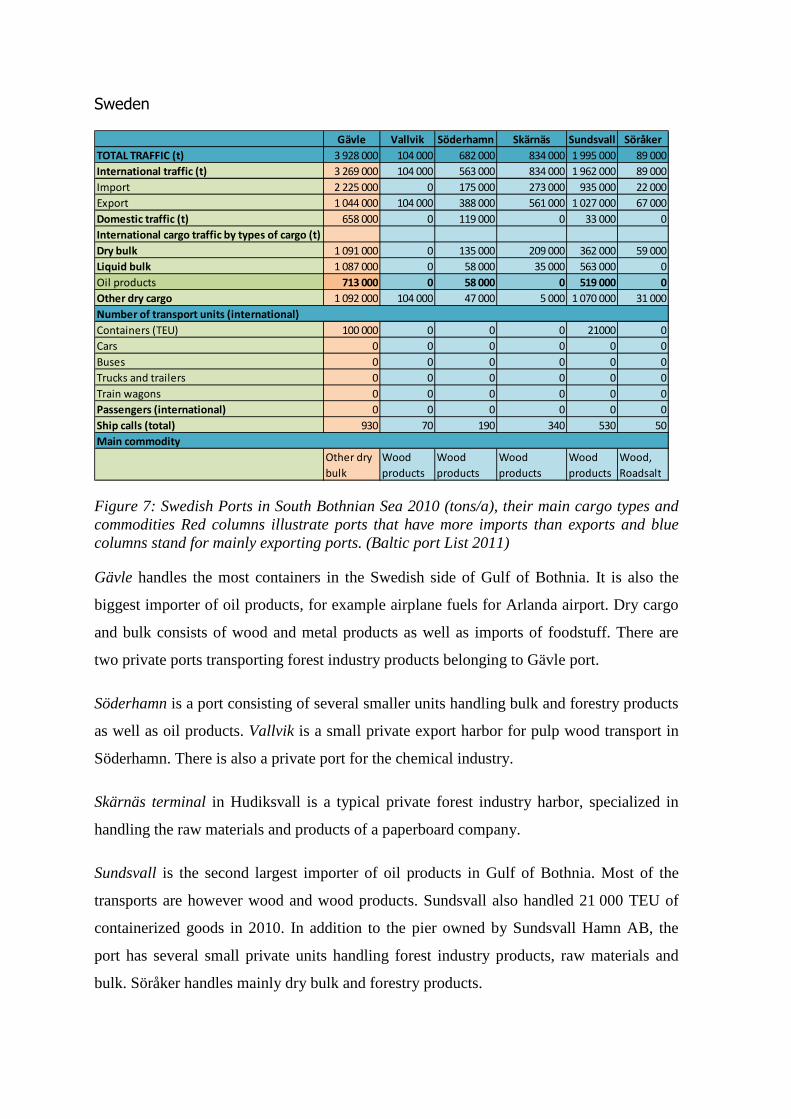
Figure 7: Swedish Ports in South Bothnian Sea 2010 (tons/a), their main cargo types and commodities Red columns illustrate ports that have more imports than exports and blue columns stand for mainly exporting ports. (Baltic port List 2011)
Gävle handles the most containers in the Swedish side of Gulf of Bothnia. It is also the
biggest importer of oil products, for example airplane fuels for Arlanda airport. Dry cargo
and bulk consists of wood and metal products as well as imports of foodstuff. There are
two private ports transporting forest industry products belonging to Gävle port.
Söderhamn is a port consisting of several smaller units handling bulk and forestry products
as well as oil products. Vallvik is a small private export harbor for pulp wood transport in
Söderhamn. There is also a private port for the chemical industry.
Skärnäs terminal in Hudiksvall is a typical private forest industry harbor, specialized in
handling the raw materials and products of a paperboard company.
Sundsvall is the second largest importer of oil products in Gulf of Bothnia. Most of the
transports are however wood and wood products. Sundsvall also handled 21 000 TEU of
containerized goods in 2010. In addition to the pier owned by Sundsvall Hamn AB, the
port has several small private units handling forest industry products, raw materials and
bulk. Söråker handles mainly dry bulk and forestry products.
Gävle Vallvik Söderhamn Skärnäs Sundsvall Söråker
TOTAL TRAFFIC (t) 3 928 000 104 000 682 000 834 000 1 995 000 89 000
International traffic (t) 3 269 000 104 000 563 000 834 000 1 962 000 89 000
Import 2 225 000 0 175 000 273 000 935 000 22 000
Export 1 044 000 104 000 388 000 561 000 1 027 000 67 000
Domestic traffic (t) 658 000 0 119 000 0 33 000 0
International cargo traffic by types of cargo (t)
Dry bulk 1 091 000 0 135 000 209 000 362 000 59 000
Liquid bulk 1 087 000 0 58 000 35 000 563 000 0
Oil products 713 000 0 58 000 0 519 000 0
Other dry cargo 1 092 000 104 000 47 000 5 000 1 070 000 31 000
Containers (TEU) 100 000 0 0 0 21000 0
Cars 0 0 0 0 0 0
Buses 0 0 0 0 0 0
Trucks and trailers 0 0 0 0 0 0
Train wagons 0 0 0 0 0 0
Passengers (international) 0 0 0 0 0 0
Ship calls (total) 930 70 190 340 530 50
Other dry
bulk
Wood
products
Wood
products
Wood
products
Wood
products
Wood,
Roadsalt
Number of transport units (international)
Main commodity
41
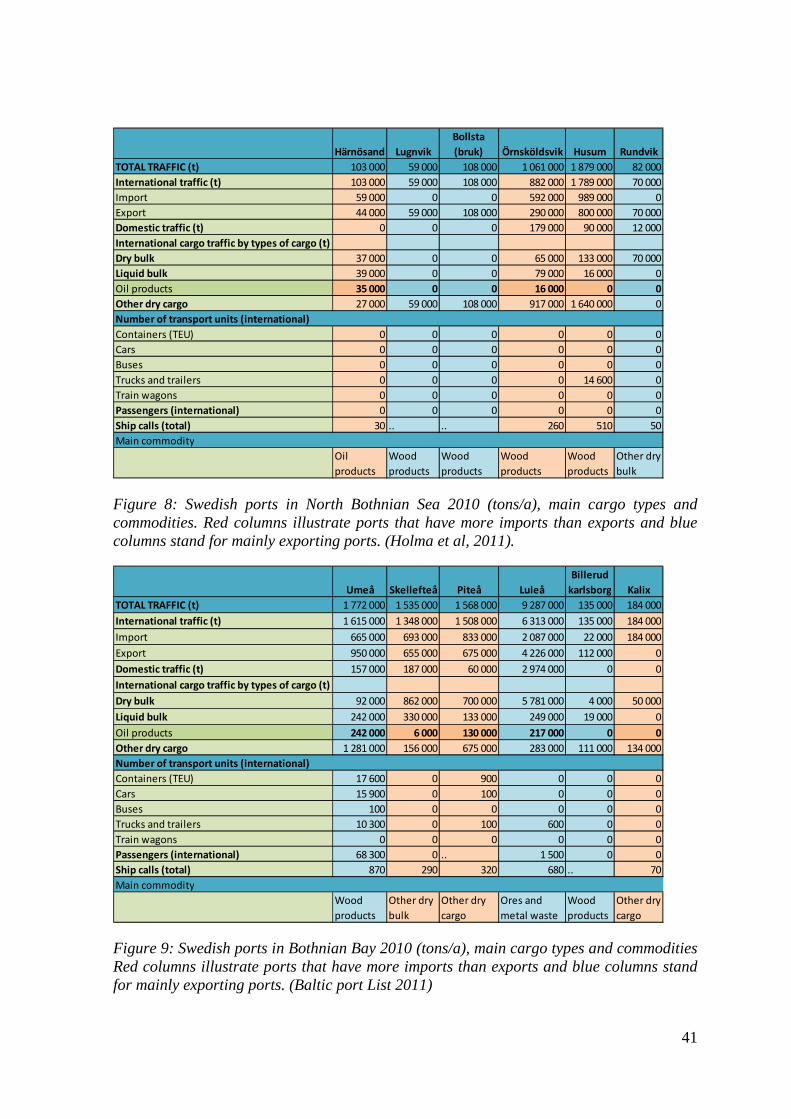
Figure 8: Swedish ports in North Bothnian Sea 2010 (tons/a), main cargo types and commodities. Red columns illustrate ports that have more imports than exports and blue columns stand for mainly exporting ports. (Holma et al, 2011).
Figure 9: Swedish ports in Bothnian Bay 2010 (tons/a), main cargo types and commodities Red columns illustrate ports that have more imports than exports and blue columns stand for mainly exporting ports. (Baltic port List 2011)
Härnösand Lugnvik
Bollsta
(bruk) Örnsköldsvik Husum Rundvik
TOTAL TRAFFIC (t) 103 000 59 000 108 000 1 061 000 1 879 000 82 000
International traffic (t) 103 000 59 000 108 000 882 000 1 789 000 70 000
Import 59 000 0 0 592 000 989 000 0
Export 44 000 59 000 108 000 290 000 800 000 70 000
Domestic traffic (t) 0 0 0 179 000 90 000 12 000
International cargo traffic by types of cargo (t)
Dry bulk 37 000 0 0 65 000 133 000 70 000
Liquid bulk 39 000 0 0 79 000 16 000 0
Oil products 35 000 0 0 16 000 0 0
Other dry cargo 27 000 59 000 108 000 917 000 1 640 000 0
Containers (TEU) 0 0 0 0 0 0
Cars 0 0 0 0 0 0
Buses 0 0 0 0 0 0
Trucks and trailers 0 0 0 0 14 600 0
Train wagons 0 0 0 0 0 0
Passengers (international) 0 0 0 0 0 0
Ship calls (total) 30 .. .. 260 510 50
Oil
products
Wood
products
Wood
products
Wood
products
Wood
products
Other dry
bulk
Number of transport units (international)
Main commodity
Umeå Skellefteå Piteå Luleå
Billerud
karlsborg Kalix
TOTAL TRAFFIC (t) 1 772 000 1 535 000 1 568 000 9 287 000 135 000 184 000
International traffic (t) 1 615 000 1 348 000 1 508 000 6 313 000 135 000 184 000
Import 665 000 693 000 833 000 2 087 000 22 000 184 000
Export 950 000 655 000 675 000 4 226 000 112 000 0
Domestic traffic (t) 157 000 187 000 60 000 2 974 000 0 0
International cargo traffic by types of cargo (t)
Dry bulk 92 000 862 000 700 000 5 781 000 4 000 50 000
Liquid bulk 242 000 330 000 133 000 249 000 19 000 0
Oil products 242 000 6 000 130 000 217 000 0 0
Other dry cargo 1 281 000 156 000 675 000 283 000 111 000 134 000
Containers (TEU) 17 600 0 900 0 0 0
Cars 15 900 0 100 0 0 0
Buses 100 0 0 0 0 0
Trucks and trailers 10 300 0 100 600 0 0
Train wagons 0 0 0 0 0 0
Passengers (international) 68 300 0 .. 1 500 0 0
Ship calls (total) 870 290 320 680 .. 70
Wood
products
Other dry
bulk
Other dry
cargo
Ores and
metal waste
Wood
products
Other dry
cargo
Number of transport units (international)
Main commodity
Härnösand has oil storage facilities and it imported 35 000 tons of oil products in 2010.
Before 2009 Härnösand had a regular RoRo-connection to port of Kaskinen in Finland but
this line does not have service anymore. Härnösand port is owned by Härnösands
municipality but port is managed and operated by the company owning Söråker port.
Lugnvik and Bollsta (Bruk) in Ångermanälven are small private wood products exporters.
Örnsköldsvik handles mainly sawn wood and other bulk goods. There is also transportation
of building materials for wind parks construction. A biofuel production plant in
Örnsköldsvik produces ethanol from black liqueur wood pulp and paper mill waste.
Örnsköldsvik also imports ethanol from Brazil for distribution to Swedish markets
(Dahlbacka, 2009).
Husum is a large industrial harbor concentrated on forest industry, wood and paper
products.
Rundvik is a small private industrial port of a company producing and exporting different
types of sawn goods.
Umeå exports mainly forestry products and imports a substantial amount of oil products
for further distribution. The passenger/unitized cargo ship RG-Line operates between
Umeå and Vaasa.
Skellefteå has chemicals and oil products transported for industries as well as pellets
imported for the local energy company. There is also a metal and other industrial waste
recycling company, importing waste material and exporting recycled materials. Skellefteå
has a regular cargo line to England.
Piteå is a traditional forest industry harbor importing raw materials and exporting wood
products and paper. Future plans include a new factory building cement parts for wind
power plants, which would require investments for the port, for example lengthening of
piers. Piteå has experience in transporting materials for wind power construction sites. The
port has a regular Ro-Ro connection to England and Germany. There is also a fuel terminal
and a biodiesel factory in the area.
43
Luleå is one of the five biggest Swedish ports and the largest bulk harbor. The other end of
the Swedish iron ore railway (Malmbanan) is in Luleå, running through main mining sites
to Narvik in Norway. There is also a cement factory in Luleå and a pier for ice breakers
operating in Bothnian Bay.
Kalix/Billerud Karlsborg is forestry products harbor handling raw wood and sawn wood.
The industry pier handles pulp wood and paper for Billerud factory.
Skellefteå, Piteå, Luleå and Kalix have a cooperation project called North Sweden Sea
Port. The aim is to enhance the northern shipping competition to benefit the industries and
society and coordinate ice breaking and Northern cargo line services.
In addition to the abovementioned ports there is a port in Forsmark nuclear power plant.
2.5.1 Priority Ports
Strategically and nationally important ports have been identified in Sweden. The strategic
ports include Sundsvall, Gävle and Luleå in Bothnian Sea area (Regeringskansliet, 2007).
The Swedish National interest harbor list is longer. The list includes the ports that:
• Belong to European Commissions Trans-European Transport Networks (TEN-T)
• Show remarkable growth during the last five year period: increase of 100 000 tons
of cargo or 200 000 passengers per year.
• Is essential for the country’s transport: transporting the goods by some other mode
or through another port would compromise the public interest.
The ports that fulfill the above criteria in Sweden are Forsmark Nuclear power plant,
Gävle, Söderhamn/Ljusne/Orrskär, Söderhamn, Örnsköldsvik, Sundsvall, Skellefteå,
Umeå, Luleå and Piteå.
National priority ports and fairways of Finland are the ports that fulfill the TEN-T criteria
and the fairways leading to those. They include:
• Ports with cargo volumes more than 1,5Mt/year or 0,2 million passengers/year
• Fairways that lead to these ports and winter fairways of the coast
• Saimaa fairway network and ports
• Connection from Saimaa to Gulf of Finland
In the Gulf of Bothnia, the ports that fulfill the above criteria in 2010 were Rauma, Pori,
Pietarsaari, Raahe, Kokkola, Oulu, Kemi and Tornio.
Baltic Transport Outlook (2011a) has identified “strategic port network” ports for Baltic
Sea Region. Principles for choosing the ports were as follows: size and cargo volume of
harbor should not be the only criteria used and strategic network should consist of fewer
ports than the TEN-T network. The assessment was based on multi-criteria analysis in
three phases. The criteria for non-bulk ports were the same as in TEN-T, but for bulk cargo
ports the criteria was set six times higher. This means that the smaller TEN-T ports that are
mainly concentrated on bulk cargo (such as minerals, oil etc.) were excluded from the
analysis on the first round (BTO, 2011a).
Based on the analysis, only two ports qualify to be part of the strategic network in the Gulf
of Bothnia. These are Rauma-Pori in Finland, which was considered as a one port entity
and industrial port Husum in Sweden, in Örnsköldsvik municipality. The explanation for
excluding most of GoB ports in the assessment was that the port infrastructure consists of
several small ports scattered along the coastline. Concentration of cargo volumes in certain
ports would therefore change the basic settings of the analysis. The potential increase in
cargo volumes due to northern mining activities was considered likely to add at least one
more port in the list in the Bay of Bothnia.
In the final version of BTO, several ports in Gulf of Bothnia were added due to their
connectivity to the strategic railway and road networks. The ports that are part of strategic
network for the Gulf of Bothnia are therefore Rauma, Pori, Vaasa, Kokkola, Oulu and
Kemi in Finland and Luleå, Umeå, Husum, Sundsvall and Gävle in Sweden. Of these
Sundsvall and Gävle were specifically mentioned as intermodal terminals.
2.6 Description of transportation developments
2.6.1 Development projects and ports investments in Gulf of Bothnia
ports
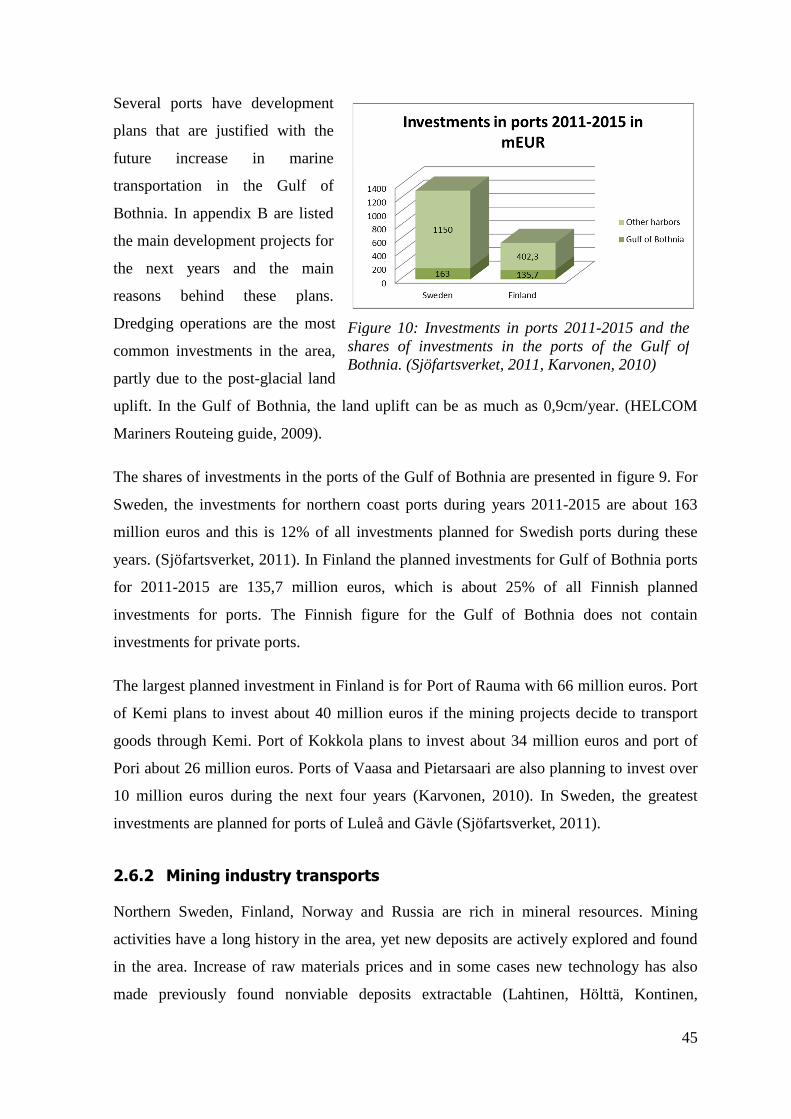
45
Several ports have development
plans that are justified with the
future increase in marine
transportation in the Gulf of
Bothnia. In appendix B are listed
the main development projects for
the next years and the main
reasons behind these plans.
Dredging operations are the most
common investments in the area,
partly due to the post-glacial land
uplift. In the Gulf of Bothnia, the land uplift can be as much as 0,9cm/year. (HELCOM
Mariners Routeing guide, 2009).
The shares of investments in the ports of the Gulf of Bothnia are presented in figure 9. For
Sweden, the investments for northern coast ports during years 2011-2015 are about 163
million euros and this is 12% of all investments planned for Swedish ports during these
years. (Sjöfartsverket, 2011). In Finland the planned investments for Gulf of Bothnia ports
for 2011-2015 are 135,7 million euros, which is about 25% of all Finnish planned
investments for ports. The Finnish figure for the Gulf of Bothnia does not contain
investments for private ports.
The largest planned investment in Finland is for Port of Rauma with 66 million euros. Port
of Kemi plans to invest about 40 million euros if the mining projects decide to transport
goods through Kemi. Port of Kokkola plans to invest about 34 million euros and port of
Pori about 26 million euros. Ports of Vaasa and Pietarsaari are also planning to invest over
10 million euros during the next four years (Karvonen, 2010). In Sweden, the greatest
investments are planned for ports of Luleå and Gävle (Sjöfartsverket, 2011).
2.6.2 Mining industry transports
Northern Sweden, Finland, Norway and Russia are rich in mineral resources. Mining
activities have a long history in the area, yet new deposits are actively explored and found
in the area. Increase of raw materials prices and in some cases new technology has also
made previously found nonviable deposits extractable (Lahtinen, Hölttä, Kontinen,
Figure 10: Investments in ports 2011-2015 and the shares of investments in the ports of the Gulf of Bothnia. (Sjöfartsverket, 2011, Karvonen, 2010)
Niiranen, Nironen, Saalmann, & Sorjonen-Ward, 2011). In global context the quantities
mined in Finland and Sweden are relatively small but mines have great importance for the
European Union which is dependent on imports of metals and has a strategy to strengthen
the domestic sources of raw materials (TEM, 2011a).
Luleå is an important link in mining products transport, as it is connected to iron ore
deposits and enrichment plants in Kiruna. Over 90% of ores produced in the European
Union area come from Sweden. Ores are transported from Kiruna for example to Raahe
steel mill. Raahe has also a recently opened a gold extraction site. Tornio has a stainless
steel production unit aiming to double its production by 2015. Kemi has the only
chromium mine in the European Union and together with the Tornio smelter it forms an
important ferrochrome production area in Europe.
Kokkola in Finland has a zinc processing plant. The plant is part of a Swedish corporation
which has extensive gold, silver, copper and zinc operations in Boliden area in Skellefte, a
copper mine in Aitik, Gällivaara, zinc-copper mine Garpenberg in Dalarna region and
copper, nickel and sulphuric acid plants in Harjavalta. Harjavalta near the port of Pori is an
extensive metal industry centre. For example Talvivaara mine in central Finland transports
ores to Harjavalta nickel smelter. If all the required permits are obtained, Talvivaara could
also begin transporting relatively small amounts of radioactive uranium ore through ports
of Oulu or Kokkola.
Dalarna region next to Gävleborg in Sweden has long history with mining industry. In
addition to products from Garpenberg, value added stainless steel products are produced in
the area. Dannemora iron ore mine in Uppsala region south of Gävle is currently sought to
be reopened.
The mining activities and processing plants increase exports in the area but also require
extensive amount of imports, such as coal and coke for smelters. Luleå, Pori and Raahe
with connections to main metal industry areas are the largest coal and coke importers in the
Gulf of Bothnia. The current ore and metal waste transport to and from the Gulf of Bothnia
ports is illustrated in figure 10.
47
New mining projects and Northern railroad projects
The new mining projects in Northern Finland and Sweden are likely to increase
transportation if they are realized. Kevitsa Copper-Nickel mine in Sodankylä begins
production in 2012. About 5 million tons of ores will be mined yearly and research is being
made on expanding the production to 7,5-10 million tons. Another mining company has
found potentially the largest nickel deposit in Europe from Viiankiaapa, in the vicinity of
Kevitsa. Viiankiaapa is a Natura 2000 protection area, so the realization of this project
depends on the stated approval of EU and Finnish governments (Nilsen 2011a). The
economic viability of the Rovaniemi-Kirkenes railway is dependent on this project (Lohi,
2012). The existing and potential mining sites as well as proposed new railway connections
for transport of the mining products are presented in the figure 11.
A new phosphate mine in Sokli is projected to begin operations in 2014-2015. The current
plan is to ship the ores to Kovdor, Russia for processing and onwards through Murmansk
Port to Norway (Nilsen 2011b). The iron ore deposits of a mine in Kolari-Pajala extend on
both the Finnish and Swedish side of the border. Pajala mining products are planned to be
transported to Narvik and onwards via Narvik-Luleå iron ore railway. The same company
is considering opening another mine in Hannukainen, Kolari in Finland. The amount or
enriched products would add about 2 million tons yearly. Decision on the transport route
has not been made but Kolari-Kemi railroad and Port of Kemi is one potential alternative.
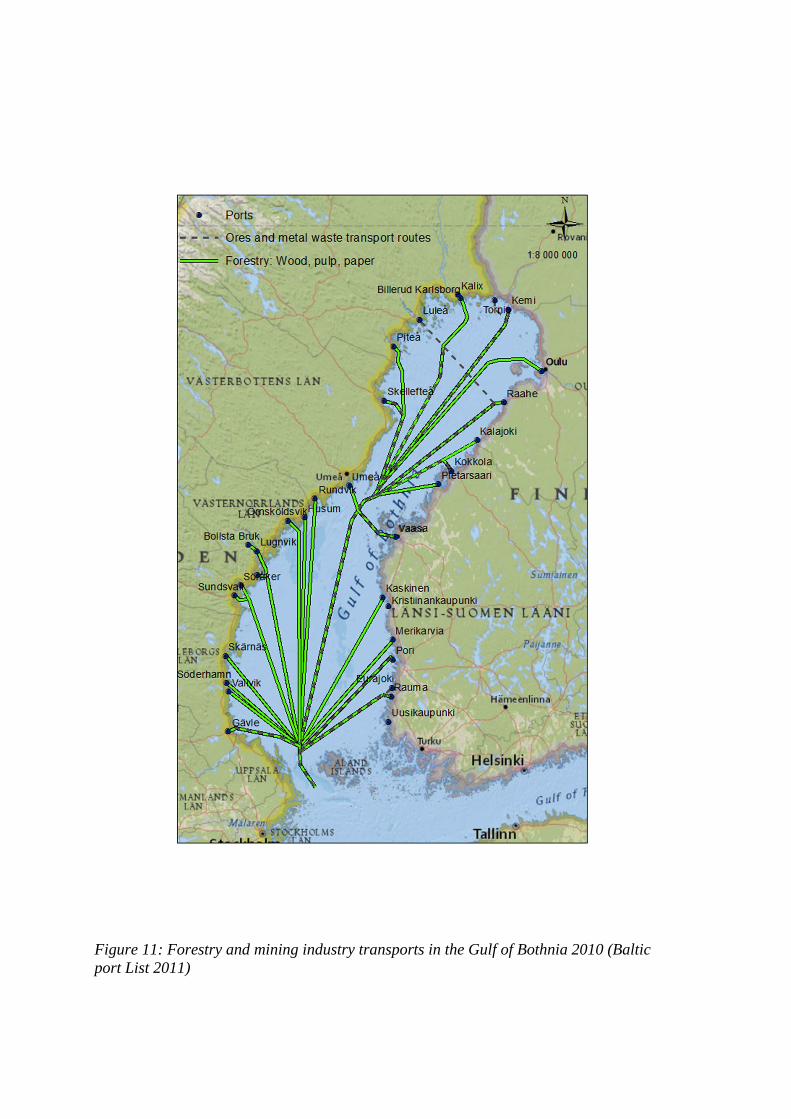
Figure 11: Forestry and mining industry transports in the Gulf of Bothnia 2010 (Baltic port List 2011)
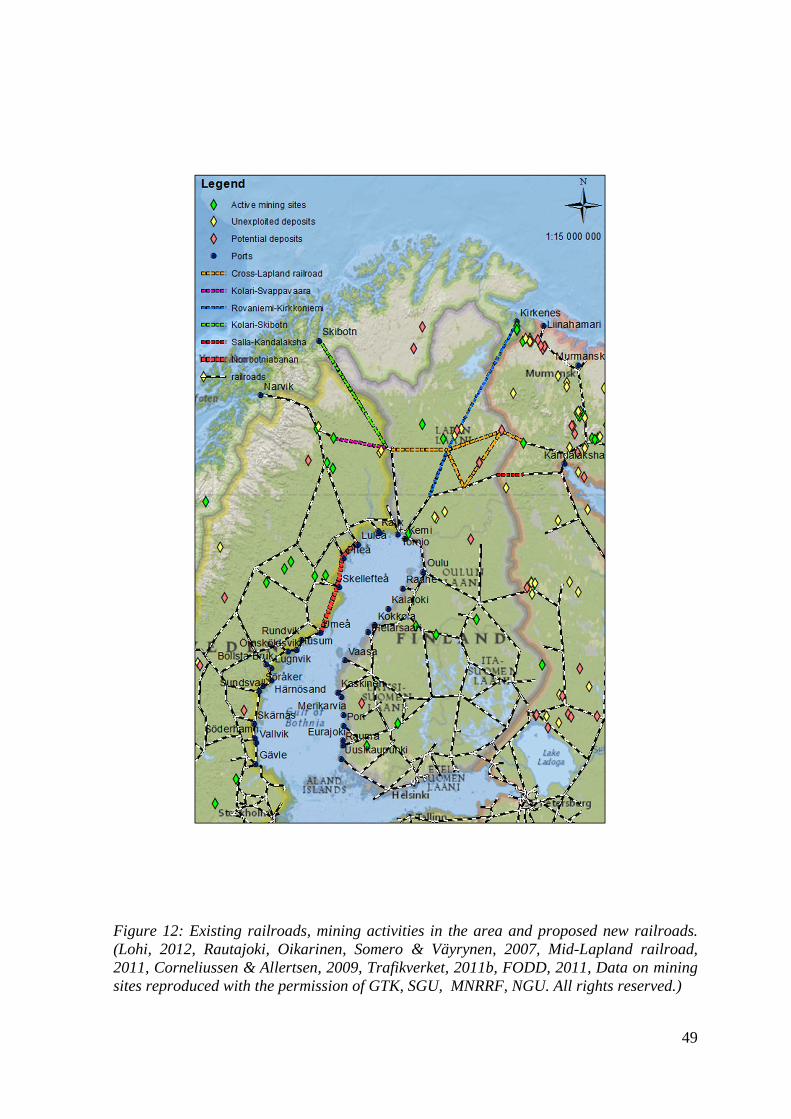
49
Figure 12: Existing railroads, mining activities in the area and proposed new railroads. (Lohi, 2012, Rautajoki, Oikarinen, Somero & Väyrynen, 2007, Mid-Lapland railroad, 2011, Corneliussen & Allertsen, 2009, Trafikverket, 2011b, FODD, 2011, Data on mining sites reproduced with the permission of GTK, SGU, MNRRF, NGU. All rights reserved.)
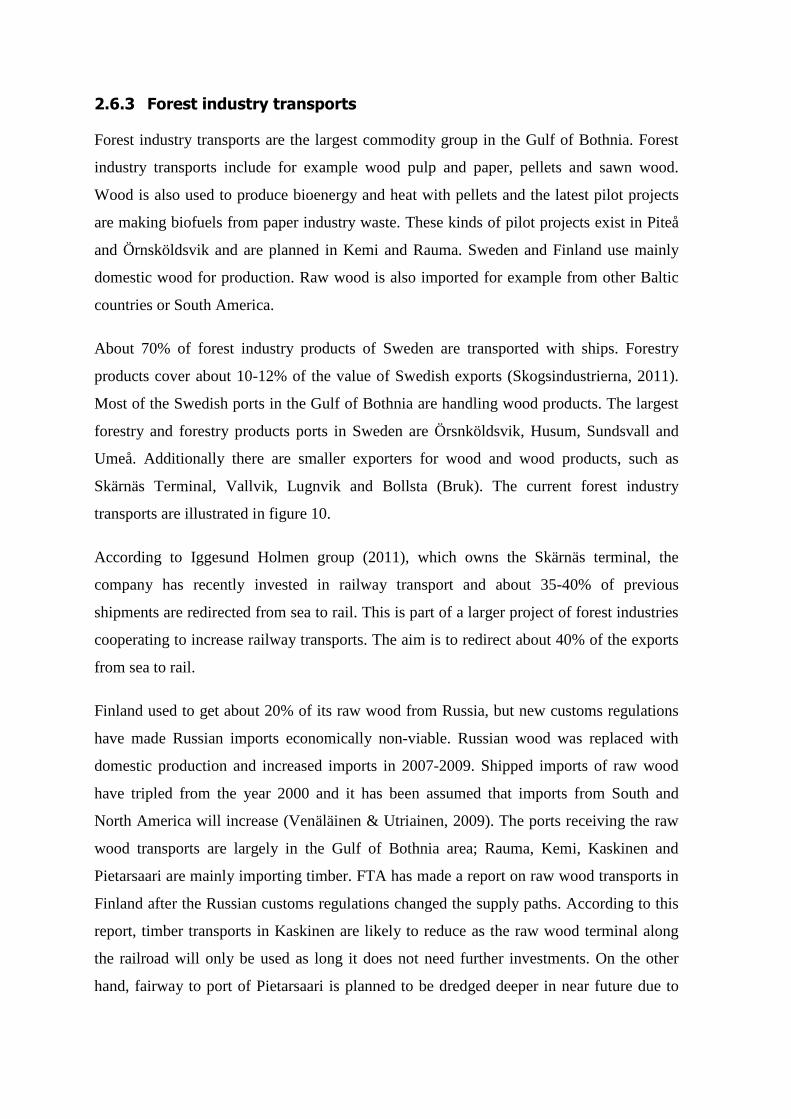
2.6.3 Forest industry transports
Forest industry transports are the largest commodity group in the Gulf of Bothnia. Forest
industry transports include for example wood pulp and paper, pellets and sawn wood.
Wood is also used to produce bioenergy and heat with pellets and the latest pilot projects
are making biofuels from paper industry waste. These kinds of pilot projects exist in Piteå
and Örnsköldsvik and are planned in Kemi and Rauma. Sweden and Finland use mainly
domestic wood for production. Raw wood is also imported for example from other Baltic
countries or South America.
About 70% of forest industry products of Sweden are transported with ships. Forestry
products cover about 10-12% of the value of Swedish exports (Skogsindustrierna, 2011).
Most of the Swedish ports in the Gulf of Bothnia are handling wood products. The largest
forestry and forestry products ports in Sweden are Örsnköldsvik, Husum, Sundsvall and
Umeå. Additionally there are smaller exporters for wood and wood products, such as
Skärnäs Terminal, Vallvik, Lugnvik and Bollsta (Bruk). The current forest industry
transports are illustrated in figure 10.
According to Iggesund Holmen group (2011), which owns the Skärnäs terminal, the
company has recently invested in railway transport and about 35-40% of previous
shipments are redirected from sea to rail. This is part of a larger project of forest industries
cooperating to increase railway transports. The aim is to redirect about 40% of the exports
from sea to rail.
Finland used to get about 20% of its raw wood from Russia, but new customs regulations
have made Russian imports economically non-viable. Russian wood was replaced with
domestic production and increased imports in 2007-2009. Shipped imports of raw wood
have tripled from the year 2000 and it has been assumed that imports from South and
North America will increase (Venäläinen & Utriainen, 2009). The ports receiving the raw
wood transports are largely in the Gulf of Bothnia area; Rauma, Kemi, Kaskinen and
Pietarsaari are mainly importing timber. FTA has made a report on raw wood transports in
Finland after the Russian customs regulations changed the supply paths. According to this
report, timber transports in Kaskinen are likely to reduce as the raw wood terminal along
the railroad will only be used as long it does not need further investments. On the other
hand, fairway to port of Pietarsaari is planned to be dredged deeper in near future due to
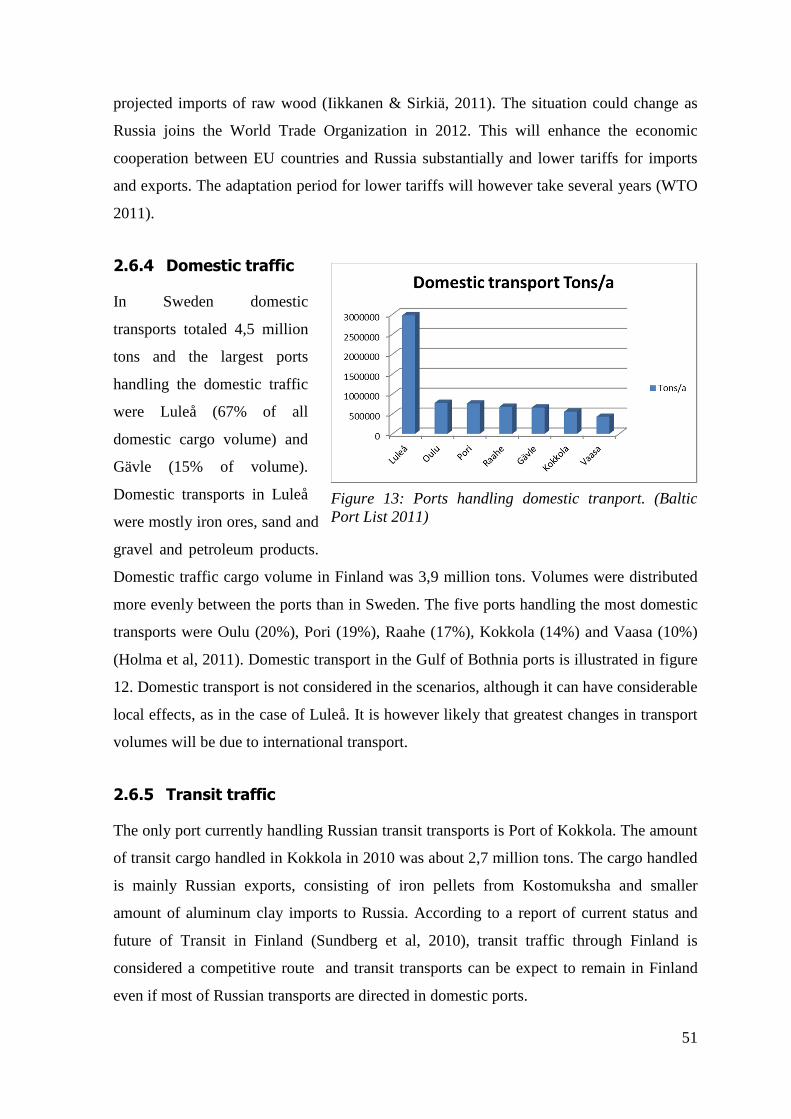
51
projected imports of raw wood (Iikkanen & Sirkiä, 2011). The situation could change as
Russia joins the World Trade Organization in 2012. This will enhance the economic
cooperation between EU countries and Russia substantially and lower tariffs for imports
and exports. The adaptation period for lower tariffs will however take several years (WTO
2011).
2.6.4 Domestic traffic
In Sweden domestic
transports totaled 4,5 million
tons and the largest ports
handling the domestic traffic
were Luleå (67% of all
domestic cargo volume) and
Gävle (15% of volume).
Domestic transports in Luleå
were mostly iron ores, sand and
gravel and petroleum products.
Domestic traffic cargo volume in Finland was 3,9 million tons. Volumes were distributed
more evenly between the ports than in Sweden. The five ports handling the most domestic
transports were Oulu (20%), Pori (19%), Raahe (17%), Kokkola (14%) and Vaasa (10%)
(Holma et al, 2011). Domestic transport in the Gulf of Bothnia ports is illustrated in figure
12. Domestic transport is not considered in the scenarios, although it can have considerable
local effects, as in the case of Luleå. It is however likely that greatest changes in transport
volumes will be due to international transport.
2.6.5 Transit traffic
The only port currently handling Russian transit transports is Port of Kokkola. The amount
of transit cargo handled in Kokkola in 2010 was about 2,7 million tons. The cargo handled
is mainly Russian exports, consisting of iron pellets from Kostomuksha and smaller
amount of aluminum clay imports to Russia. According to a report of current status and
future of Transit in Finland (Sundberg et al, 2010), transit traffic through Finland is
considered a competitive route and transit transports can be expect to remain in Finland
even if most of Russian transports are directed in domestic ports.
Figure 13: Ports handling domestic tranport. (Baltic Port List 2011)
2.6.6 Container and other unitized cargo transport
Rauma and Gävle were the
largest container ports by far.
There is also constant container
transportation between these
two ports. When it comes to
other transport units, Vaasa and
Umeå were the major
transporters for cars (10 000),
buses (100) and trucks and
trailers (15 000 units) in 2010.
Oulu is the largest container port
in Bay of Bothnia. However, the
amount of containers handled in all of the ports of Gulf of Bothnia is similar to the amount
Port of Helsinki alone handled in 2010 (Baltic Port List 2011). The current amount of
containers transported in the Gulf of Bothnia ports in illustrated in figure 13.
It has been estimated that within the Baltic Sea context, great growth for transports can be
expected for unitized cargo, as intermodal transport chains develop further (Meriläinen,
Mäenpää, Kunnas, Lundberg, Ramstedt, Quistgaard, Isberg, 2010). Transbaltic scenarios
and oversight –report (2010) mentions increasing container transports from overseas as one
of the likely drivers of transports in the Baltic Sea area. It also considers the effects of
North Sea Route and growth of the Barents Region to be possible factors for development
in Baltic Sea transport. Global warming can ease the ice conditions in Northern Sea route
as multi-year ice packs disappear from the Arctic Ocean. The Northern sea route could
shorten the navigation time for example from Rotterdam to Yokohama with as much as 10
days (Liu & Kronbak 2010).
2.6.7 Nuclear power plants and radioactive cargo
There is a nuclear power plant in Forsmark in Sweden with three reactors. The nuclear
power plant has been operational for 30 years. There is also a nationally important
geological storage for nuclear waste in Forsmark area (Vattenfall, 2011).
Figure 14: Container transport in Gulf of Bothnia 2010 by Twenty-foot Equivalent Unit (TEU) (Baltic port List 2011)
53
Olkiluoto in Finland has 2 reactors and third one is currently being built. The owners of
Olkiluoto reactors have also left an application for fourth reactor to Finnish Parliament in
2008 and it was approved in 2010. Olkiluoto reactors are owned largely by Finnish energy
and forestry industries. Uranium for the reactors is imported and a geological storage for
nuclear waste is currently built in Olkiluoto. (TEM, 2011b) Due to building projects there
is regular maritime transportation in Olkiluoto.
Nuclear waste is transported by sea in Sweden and Finland. Sweden has a special ship, MS
Sigyn, for nuclear transports which also operates in Finland when needed (Jalovaara,
2011). Swedish nuclear waste is currently handled and stored in two places: Oskarshamn
has a temporary storage for higher radioactivity nuclear fuel and waste with lower
radioactivity is handled in Forsmark (SKB, 2012). Finland has temporary storages for high
activity waste in the power plant areas. In future also the nuclear waste from Loviisa
reactors in Gulf of Finland will be transported to Olkiluoto or Rauma, to be placed in the
geological storage. (Jalovaara, 2011)
The nuclear transports in the Gulf of Bothnia are generally rare but mentioned here due to
their special status and the risks associated with the transport. Radioactive transports could
get slightly more common if Talvivaara nickel mine begins to sell uranium as side product.
Talvivaara received permit to sell uranium in 2011 and is currently waiting for other
governmental approvals for production. The uranium ore production would be relatively
small in Talvivaara: 350 tons/year. The ore would be transported through Port of Oulu or
Kokkola. Sweden has large deposits compared to Finland, but the Swedish Uranium
concentration of ores is not currently economically viable. The new nuclear power plant
project in Bothnian Bay, Pyhäjoki, will begin operating at the earliest in 2020. This project
will potentially increase radioactive transports in the Gulf of Bothnia in the future
(Fennovoima, 2012).
2.6.8 Liquid bulk: Oil products and chemicals transport in the Gulf of Bothnia
Oil transports development
Oil transports within the Gulf of Bothnia consisted mainly of oil products i.e. no raw oil
was transported to or from the Gulf of Bothnia ports. The liquid bulk transport in the Gulf
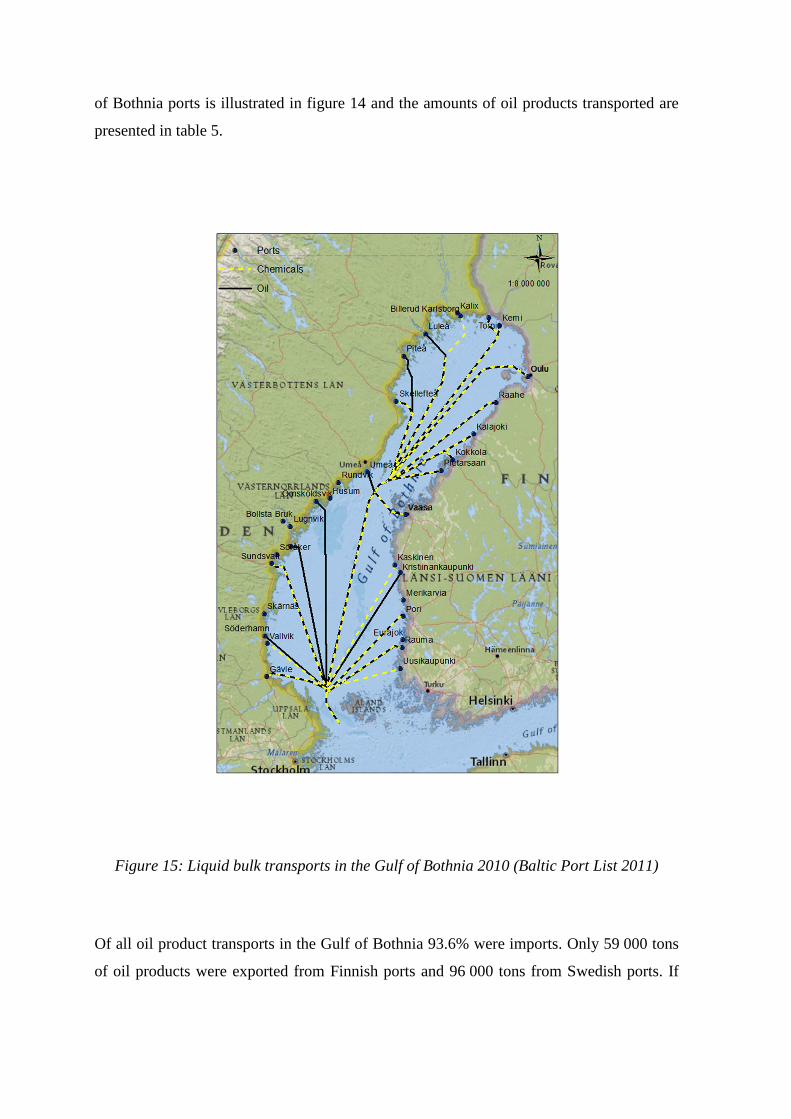
of Bothnia ports is illustrated in figure 14 and the amounts of oil products transported are
presented in table 5.
Figure 15: Liquid bulk transports in the Gulf of Bothnia 2010 (Baltic Port List 2011)
Of all oil product transports in the Gulf of Bothnia 93.6% were imports. Only 59 000 tons
of oil products were exported from Finnish ports and 96 000 tons from Swedish ports. If
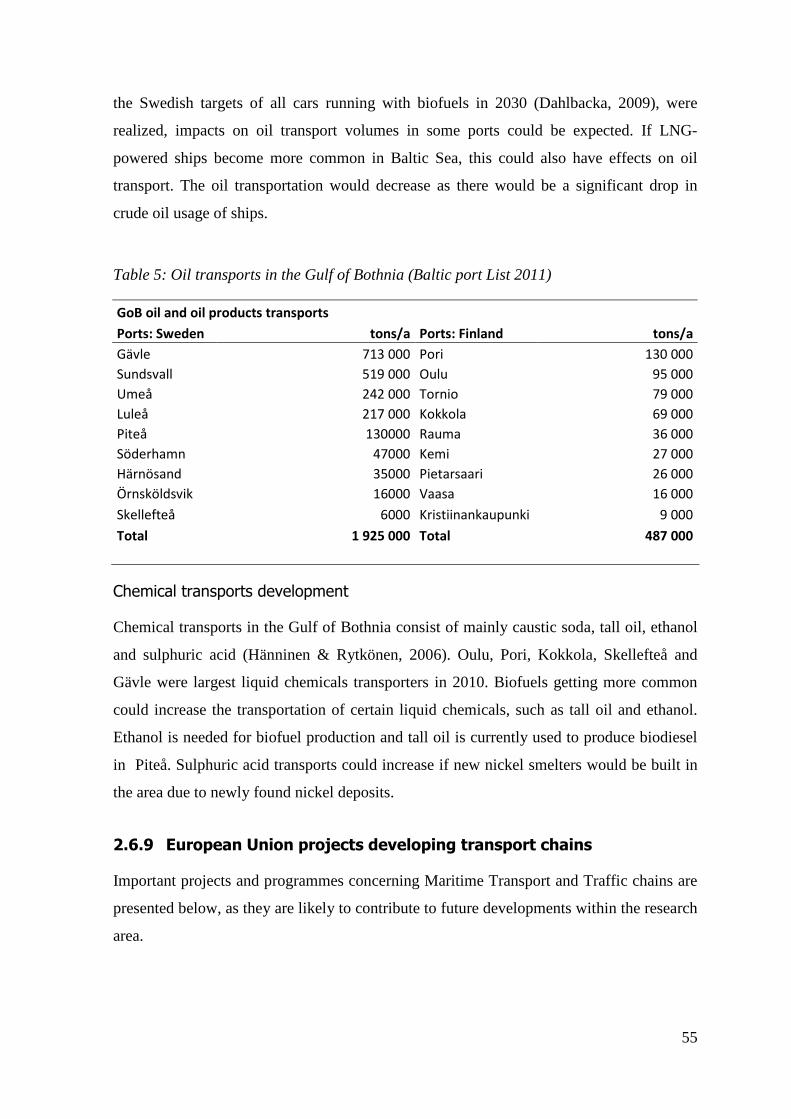
55
the Swedish targets of all cars running with biofuels in 2030 (Dahlbacka, 2009), were
realized, impacts on oil transport volumes in some ports could be expected. If LNG-
powered ships become more common in Baltic Sea, this could also have effects on oil
transport. The oil transportation would decrease as there would be a significant drop in
crude oil usage of ships.
Table 5: Oil transports in the Gulf of Bothnia (Baltic port List 2011)
GoB oil and oil products transports
Ports: Sweden tons/a Ports: Finland tons/a
Gävle 713 000 Pori 130 000
Sundsvall 519 000 Oulu 95 000
Umeå 242 000 Tornio 79 000
Luleå 217 000 Kokkola 69 000
Piteå 130000 Rauma 36 000
Söderhamn 47000 Kemi 27 000
Härnösand 35000 Pietarsaari 26 000
Örnsköldsvik 16000 Vaasa 16 000
Skellefteå 6000 Kristiinankaupunki 9 000
Total 1 925 000 Total 487 000
Chemical transports development
Chemical transports in the Gulf of Bothnia consist of mainly caustic soda, tall oil, ethanol
and sulphuric acid (Hänninen & Rytkönen, 2006). Oulu, Pori, Kokkola, Skellefteå and
Gävle were largest liquid chemicals transporters in 2010. Biofuels getting more common
could increase the transportation of certain liquid chemicals, such as tall oil and ethanol.
Ethanol is needed for biofuel production and tall oil is currently used to produce biodiesel
in Piteå. Sulphuric acid transports could increase if new nickel smelters would be built in
the area due to newly found nickel deposits.
2.6.9 European Union projects developing transport chains
Important projects and programmes concerning Maritime Transport and Traffic chains are
presented below, as they are likely to contribute to future developments within the research
area.
TEN-T
TEN-T projects aim to build the missing links and remove the bottlenecks in the European
Union transport infrastructure and ensure the sustainability of transport networks. TEN-T
consist of 30 priority projects, one of which is the Motorways of the Sea, which has a great
role in the Baltic Sea Maritime transport development. TEN-T offers different kinds of
financial instruments, loans and grants, for implementation of the TEN-T priority projects
(EC Mobility and Transport, 2011).
Mona Lisa
Mona Lisa (Motorways and Electronic Navigation by Intelligence at sea) project aims to
develop Motorways of the Sea concept in Baltic Sea and contribute to EU’s strategy for
Baltic Sea. The project is funded by TEN-T and it is one the 21 projects that make up the
Motorways of the Seas priority project. In the Gulf of Bothnia context, Green corridors and
Baltic fairway re-survey are under focus in the Mona Lisa project. Mona Lisa contributes
also to development of e-navigation applications and optimized shipping routes to reduce
emissions, basically offering the ships a possibility to make the shortest possible route
plan. Lead partner of the project is Swedish Maritime Administration.
The Baltic Sea Harmonized re-Survey scheme was requested already in HELCOM
Copenhagen 2001 Ministerial Declaration. The scope of the re-survey scheme was
widened in Moscow 2010 Ministerial Declaration. Mona Lisa is speeding up this Baltic
Sea -wide process in the Bothnian Sea area (Finnish Transport Agency 2011c).
MidNordic green corridor
Green Corridors is an EU initiative to promote sustainable logistics and transport corridors.
North East Cargo Link II (NECL) —project aims to develop and promote the Mid-Nordic
Green corridor and intermodal connections across Bothnian Sea in East-West direction.
The project is funded by European Union Regional Development fund and European
neighborhood and partnership instrument. The partners include transport agencies and
regional actors in Finland, Sweden and Norway.
The corridor begins from Norway and continues through Sweden and Finland towards
Russia and Asia. If the project is successful, the cross-Bothnian Sea marine traffic could
increase across the Quark. (NECL II, 2011). NECL II studies the investments to ports and
57
hinterland connections of Kaskinen and Vaasa in Finland and Örnsköldsvik and Sundsvall
in Sweden. As an example, the port of Kaskinen has ordered a feasibility study for cargo
liner between Kaskinen and Sundsvall.
Bothnian corridor
The Bothnian corridor railway transport route is currently under development. Running
along the coast around the Bothnian Bay it strengthens the North-South connections. The
Bothnian corridor includes 11 ports on the Finnish side and 14 on the Swedish side as
“secondary transport network”-ports enhancing the intermodal transport chains. Ten of
these Ports (Rauma, Pori, Kaskinen, Vaasa, Pietarsaari, Kokkola, Raahe, Oulu, Kemi and
Tornio) are located in the research area on the Finnish side and nine (Gävle, Söderhamn,
Sundsvall, Örnsköldsvik, Umeå. Skellefteå, Piteå, Luleå and Kalix) are on the Swedish
side. These ports could benefit from the increasing transports through Bothnian corridor
railway, and the maritime traffic to and from these ports would grow correspondingly
(Meriläinen et al, 2010).

59
3 METHODOLOGY
3.1 Methodology for Future Scenarios
Höjer (2000, 16) states, that “the choice of methodology is a reflection of the aim of the
study.” He then presents three methodologies, namely backcasting, forecasting and
explorative scenario technique and describes where these methodologies can be best
applied.
Backcasting is generally described as a method where the first step is setting targets for
the future. The image of a future where these targets are fulfilled is then compared to
forecast of the future. If future forecast does not fulfill these set targets, it is necessary to
create alternative scenarios about how the targets could be reached. According to Höjer
(2000, 16): “Backcasting is motivated when there is a target, when forecasts indicate that
this target will not be met, and when the changes needed to reach the targets seem to be
beyond the scope of current policy.” Basically, backcasting aims to describe an issue and
find a solution for it by preparing alternative scenarios.
Forecasting is the more traditional form of future studies. In simplest form, it can be made
for example by extrapolation of past development into the future. This method is used
especially in forecasts for economic development and examples are often from business
studies. For long-term forecasts, scenario methods are commonly utilized. Scenario
methods aim for a more holistic point of view than linear extrapolation and they can be
considered as a “softer” method than other forecasting methods. Scenarios can be a
description of future development path or description of the future state, a so called “image
of the future” (Höjer, 2000, 10). Forecasting aims to answer a question “What will or will
not happen”, by researching external factors that have an effect on the studied topic.
The third methodology presented by Höjer (2000, 16) is Explorative scenario techniques,
that are “…appropriate when the character of the external factors is known but the
uncertainty of their values is great.”
There is in fact not a great variety of strict methods available for each specific field of
future studies. Predictions or forecasts for future are often made using a combination of
existing methods, adapted specifically for the topic under research. For example Höjer
(2000) used a self-developed method in a study he calls a “Backcasting Delphi study” to
find out potential paths of development for sustainable urban transport systems.
For this study, a combination of methodologies is also used, and it could be called a
forecasting Delphi study. From the three methodologies presented above, the explorative
scenario technique is chosen as the external factors affecting the future of maritime
transports in the Gulf of Bothnia are quite well known, but there is great uncertainty
concerning them. Carlsson-Kanyama (et al, 2008) pairs the explorative approach with
normative approach as the methods that can be used for studying possible or desirable
futures, in contrast for studying probable futures by forecasting methods. The explorative
approach aims to answer to the question “what could happen” and normative approach to
the question “how a solution to a particular problem might look”.
3.1.1 Part I
Firstly, in order to make the forecasted future scenarios, following topics were studied:
• Current situation -Maritime transportation in the Gulf of Bothnia in 2010
• Economic development
• Development of key industries
• Development of infrastructure in the Gulf of Bothnia
• Existing scenarios
All of these topics were not researched in detail here but information was gathered from
existing studies, plans and strategies and development of different industries to construct
scenarios for Maritime Transport in the Gulf of Bothnia in 2030.
Part I of this study aims to answer the question: How much the cargo volumes could grow
in the Gulf of Bothnia. The future scenarios were constructed by means of forecasting,
applying existing quantitative scenario for maritime transport made by Baltic Maritime
Outlook (2006) for the Bothnian Sea context. Basically, new scenarios were not prepared
61
but the GoB-specific scenarios are based on combining existing scenarios and analysis of
other relevant factors. The cargo volume scenarios obtained in this way are:
• Strong growth scenario
• Average growth scenario
• Modest growth scenario
As the BMO scenario was only made until 2020, the scenarios for the Bothnian Sea were
continued until 2030 by making a few assumptions based on Finnish Maritime
Administration scenario for Finnish Maritime Transports (2006). Such assumptions were
for example that the development of Finnish exports follows the development of GDP
from 2020-2030. A further assumption was made that this is true also for Sweden.
The existing scenarios were further adjusted for the Bothnian Sea by combining the
possible futures of certain key factors, such as transit traffic (Scenario by Finnish Maritime
Administration, 2006) and modal shift forecasts (Scenario based on ENTEC 2010). This
type of methodology has been previously used by Kuronen et al. (2006) to prepare future
scenarios for Gulf of Finland. The cargo volumes of the scenarios were assessed by an
expert panel, to find out the margins for the scenarios. In this study, the role of the expert
panel was extended as described below in part II.
3.1.2 Part II
Rubin (2004) writes: „Even though quantitative methods have traditionally been used to
produce models of one future without alternatives, it is possible to use the produced results
to build different alternative scenarios, or combine both quantitative and qualitative
methods for the same purpose. On the point where quantitative methods produce forecasts
that are unambiguous and punctual, but at the same time limited at some degree and
inflexible, qualitative methods bring about images of the future which are more ambiguous
and perhaps somewhat unpunctual, but also flexible, descriptive and wide and point at
alternatives between images rather than at details within them“.
As cargo volume scenarios do not consider and answer the question about what causes the
changes and what are the spatial implications, part II of the study aimed to identify and
assess key factors for development and what kind of spatial developments they could cause
in the Gulf of Bothnia. The key factors were identified by literature review, telephone and
e-mail interviews as well as the group work discussions about Maritime transport in the
Bothnian Sea in Plan Bothnia MSP 3 meeting in Helsinki. The probability and significance
of identified key factors were assessed using Real-Time Delphi method, described by
Gordon & Pease (2006). As the future scenarios serve as background material for marine
spatial planning, it is important to ensure stakeholder participation and expert views in
evaluating the probability and significance of key factors as well as general quality of
different scenarios. Delphi method gives the stakeholders an opportunity to express their
personal ideas and opinions more freely, as the panel is anonymous and panelists do not
know who the other participants are. The aim is that also the more delicate opinions and
speculations that would not necessarily be expressed in a regular round-table stakeholder
meeting can be considered.
Real Time Delphi-method differs from the traditional Delphi-method mainly in number of
questionnaire rounds. While the traditional Delphi is often done in three or more rounds to
reach consensus, Real time Delphi requires only one round and the goal can be getting new
ideas concerning future developments and not necessarily reaching consensus. It is more
efficient and fast way of conducting a Delphi study than the traditional Delphi method. The
expert group is also somewhat smaller than in traditional Delphi. According to Gordon &
Pease (2006) RT Delphi expert group can consist of about 10-15 panelists in contrast to
recommended 20-50 for traditional Delphi. The panelists receive a report of the answers of
other participants immediately after answering and they are encouraged to comment and
elaborate on their arguments.
Panelists were chosen based on a panel table with three interest groups and four groups of
expertise. One panelist could belong to more than one group. The panel structure is
presented in table 14.
The panelists were asked to assess the probability and significance of the 18 key factors as
well as the quantitative cargo volume scenarios constructed during phase I. The theses
were formed in a way that aimed to raise discussion over the key factors. The panelists
were asked to provide comments to support their choice as well as mention if the effects
concentrate on a specific port/area in the Gulf of Bothnia, to get data that could be
interpreted in spatial form. The Delphi round was made with an internet based open source
program developed specifically for conducting Delphi studies (www.edelphi.fi). The panel
63
website is available in the address http://www.edelphi.fi/en/groups/maritime/content/index
and the panel theses and themes are presented in detail in appendix B.
Based on the results from the Delphi-round, a futures table was constructed to serve as a
basis for scenario building. The table is presented in appendix A. Using futures tables for
scenario building is an analysis method described by Seppälä in his book „84 thousand
futures“ (1984). The idea is to identify the developments that cannot exist simultaneously
and construct scenarios that do not contain conflicting elements. The aim is that the
scenarios seem plausible and relevant for those who use them and to find out what could be
the implications of probable future developments for Marine Spatial Planning. The futures
table was constructed by making a matrix of the comments received during the RT-Delphi
round and marking whether or not the described events and ideas
• Support each other (Green color)
• Do not have considerable effect on each other (Orange color)
• Cannot coexist at the same time or in the same scenario (Red color)
The scenarios were then built by following paths in the matrix and finding possible
combinations of the events and ideas described by the panelists.

65
4 PART I: FORECASTED CARGO VOLUME
SCENARIOS
4.1 Existing scenarios
As for the forecasted Gulf of Bothnia-specific cargo volume scenarios are based on
existing large scale maritime transport scenarios, their main findings are described here
briefly.
4.1.1 FMA Scenario
The figures for development of transit traffic, as well as some general assumptions for
continuing the scenarios until 2030, are obtained from the scenarios published by FMA in
2006 (Lehto, Venäläinen & Hietala, 2006). The scenarios are based on econometric
modeling and are a relatively traditional future forecast based on external factors. The data
used was time series of maritime transport 1981-2005 provided by Finnish Maritime
Administration, development scenarios of Finnish Gross Domestic Production (GDP),
energy use scenarios and the estimated relationship between GDP and export volumes
(Lehto et al, 2006). International maritime transports were divided in three groups: 1)
transport of oil energy products and fuels, 2) transit traffic and 3) other marine transports.
The development of these three groups was considered to be dependent on different factors
and was therefore forecasted separately.
The average growth of GDP per year is considered to be 2.37 %, but growth slows down in
the end of the timeline. Portion of exports from GDP is expected to grow from 39% in
2005 to 49% in 2020 and stay on that level until 2030.
This scenario also divided the projected transport volumes to regions, based on their
current shares of transports. Most of exports were thought to be processed forestry
products and general cargo. The share of ores and minerals of future exports in the Gulf of
Bothnia was quite low in this scenario. The numbers do not show for example the future
increase caused by new mining projects in Northern Finland, due to the mechanical
calculations based on the shares of transports in 2005. Imports were mainly ores and
minerals, general cargo and energy products and fuel.
The economic crisis has altered the picture since the scenarios were made. Recent
development of exports has been the opposite as predicted in the scenario and the share of
exports of the GDP is currently about 29% (Tilastokeskus, 2011). Also, the projected
average GDP growth for 2012-2015 is only 1,9%. GDP is projected to drop to 1,6% in
2015 whereas according to the 2006 minimum scenario this low growth was supposed to
occur in 2025. Therefore the growth scenario of FMA is fairly optimistic considering the
current situation.
Tables 6 and 7 are scenarios based on FMA report and were calculated to serve as
comparison for the quantitative scenarios made in this study. The scenarios were made in
2006 and what the situation would be in 2010 was calculated as follows: In table 6, the
numbers for “2010 (Realized)” are the actual cargo volumes for 2010 published by Finnish
Transport Agency. The numbers for “2010 (Scenario)” based on FMA forecasts are
calculated by the following formula:
a+((b-a)/t*y)=c
where:
a=volumes in 2005
b=volumes in 2030
t=total years (25)
y=years from 2005 to 2010
The growth is assumed to be linear through the years. Transit growth had five different
scenarios for the year 2030. From these the one labeled “WSP” was chosen as it yielded
the volume that was closest to the realized transit volumes in 2010, calculated with the
formula presented above. The WSP-scenario for transit was a consultant estimate of the
growth of each commodity group.
For Table 7, the share of the Gulf of Bothnia ports is calculated by dividing the volumes of
FMA scenario for 2010 and 2030 by the realized shares of its ports in 2010. In the FMA
2006 Scenario all figures were presented without transit traffic, which was calculated
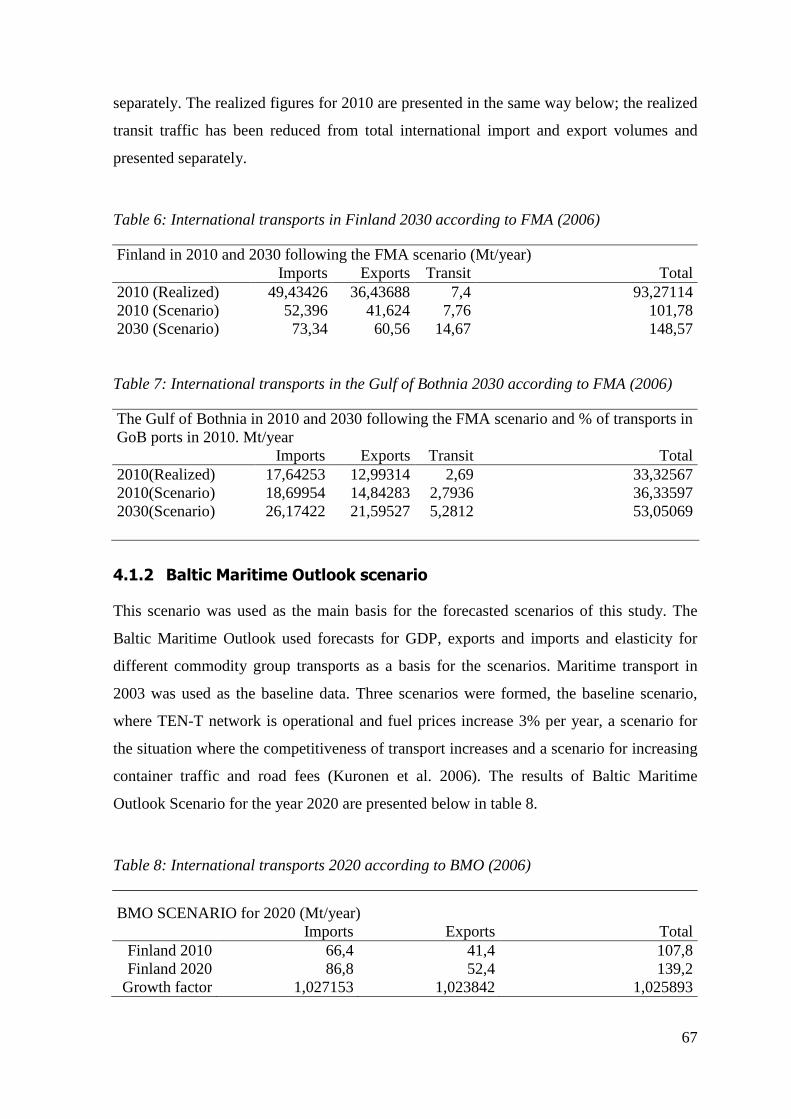
67
separately. The realized figures for 2010 are presented in the same way below; the realized
transit traffic has been reduced from total international import and export volumes and
presented separately.
Table 6: International transports in Finland 2030 according to FMA (2006)
Finland in 2010 and 2030 following the FMA scenario (Mt/year) Imports Exports Transit Total 2010 (Realized) 49,43426 36,43688 7,4 93,27114 2010 (Scenario) 52,396 41,624 7,76 101,78 2030 (Scenario) 73,34 60,56 14,67 148,57 Table 7: International transports in the Gulf of Bothnia 2030 according to FMA (2006)
The Gulf of Bothnia in 2010 and 2030 following the FMA scenario and % of transports in GoB ports in 2010. Mt/year Imports Exports Transit Total 2010(Realized) 17,64253 12,99314 2,69 33,32567 2010(Scenario) 18,69954 14,84283 2,7936 36,33597 2030(Scenario) 26,17422 21,59527 5,2812 53,05069
4.1.2 Baltic Maritime Outlook scenario
This scenario was used as the main basis for the forecasted scenarios of this study. The
Baltic Maritime Outlook used forecasts for GDP, exports and imports and elasticity for
different commodity group transports as a basis for the scenarios. Maritime transport in
2003 was used as the baseline data. Three scenarios were formed, the baseline scenario,
where TEN-T network is operational and fuel prices increase 3% per year, a scenario for
the situation where the competitiveness of transport increases and a scenario for increasing
container traffic and road fees (Kuronen et al. 2006). The results of Baltic Maritime
Outlook Scenario for the year 2020 are presented below in table 8.
Table 8: International transports 2020 according to BMO (2006)
BMO SCENARIO for 2020 (Mt/year) Imports Exports Total
Finland 2010 66,4 41,4 107,8 Finland 2020 86,8 52,4 139,2
Growth factor 1,027153 1,023842 1,025893
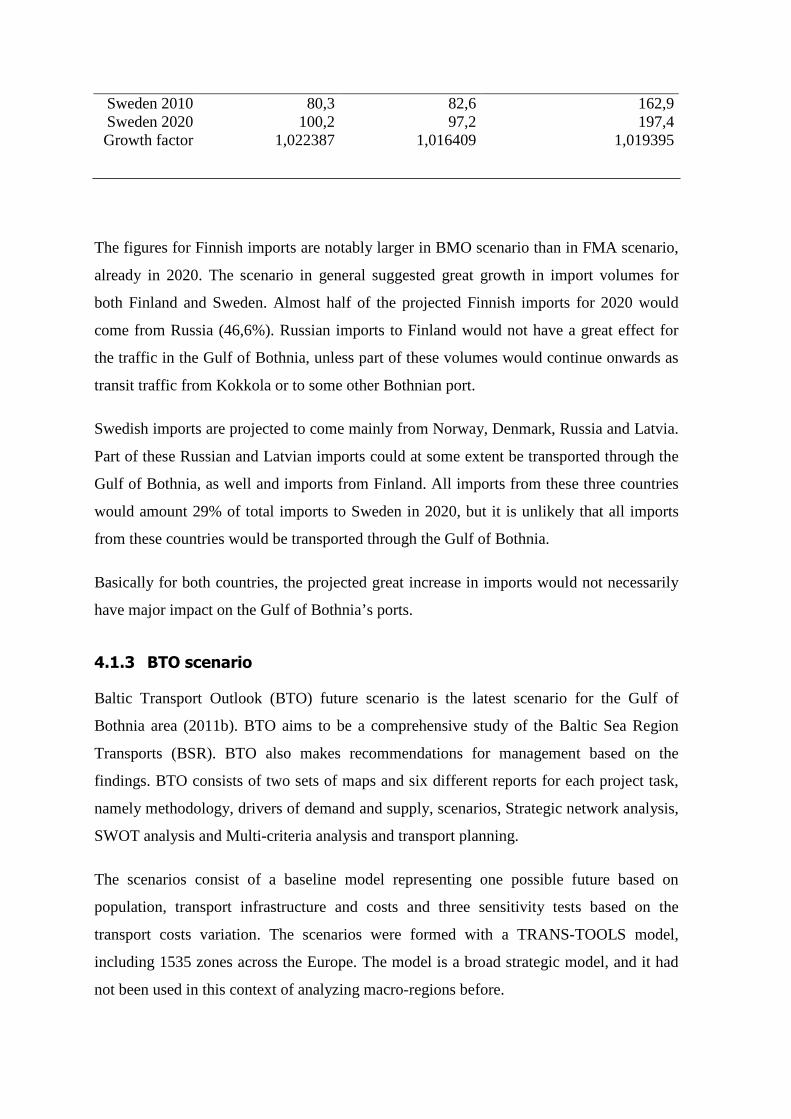
Sweden 2010 80,3 82,6 162,9 Sweden 2020 100,2 97,2 197,4 Growth factor 1,022387 1,016409 1,019395
The figures for Finnish imports are notably larger in BMO scenario than in FMA scenario,
already in 2020. The scenario in general suggested great growth in import volumes for
both Finland and Sweden. Almost half of the projected Finnish imports for 2020 would
come from Russia (46,6%). Russian imports to Finland would not have a great effect for
the traffic in the Gulf of Bothnia, unless part of these volumes would continue onwards as
transit traffic from Kokkola or to some other Bothnian port.
Swedish imports are projected to come mainly from Norway, Denmark, Russia and Latvia.
Part of these Russian and Latvian imports could at some extent be transported through the
Gulf of Bothnia, as well and imports from Finland. All imports from these three countries
would amount 29% of total imports to Sweden in 2020, but it is unlikely that all imports
from these countries would be transported through the Gulf of Bothnia.
Basically for both countries, the projected great increase in imports would not necessarily
have major impact on the Gulf of Bothnia’s ports.
4.1.3 BTO scenario
Baltic Transport Outlook (BTO) future scenario is the latest scenario for the Gulf of
Bothnia area (2011b). BTO aims to be a comprehensive study of the Baltic Sea Region
Transports (BSR). BTO also makes recommendations for management based on the
findings. BTO consists of two sets of maps and six different reports for each project task,
namely methodology, drivers of demand and supply, scenarios, Strategic network analysis,
SWOT analysis and Multi-criteria analysis and transport planning.
The scenarios consist of a baseline model representing one possible future based on
population, transport infrastructure and costs and three sensitivity tests based on the
transport costs variation. The scenarios were formed with a TRANS-TOOLS model,
including 1535 zones across the Europe. The model is a broad strategic model, and it had
not been used in this context of analyzing macro-regions before.
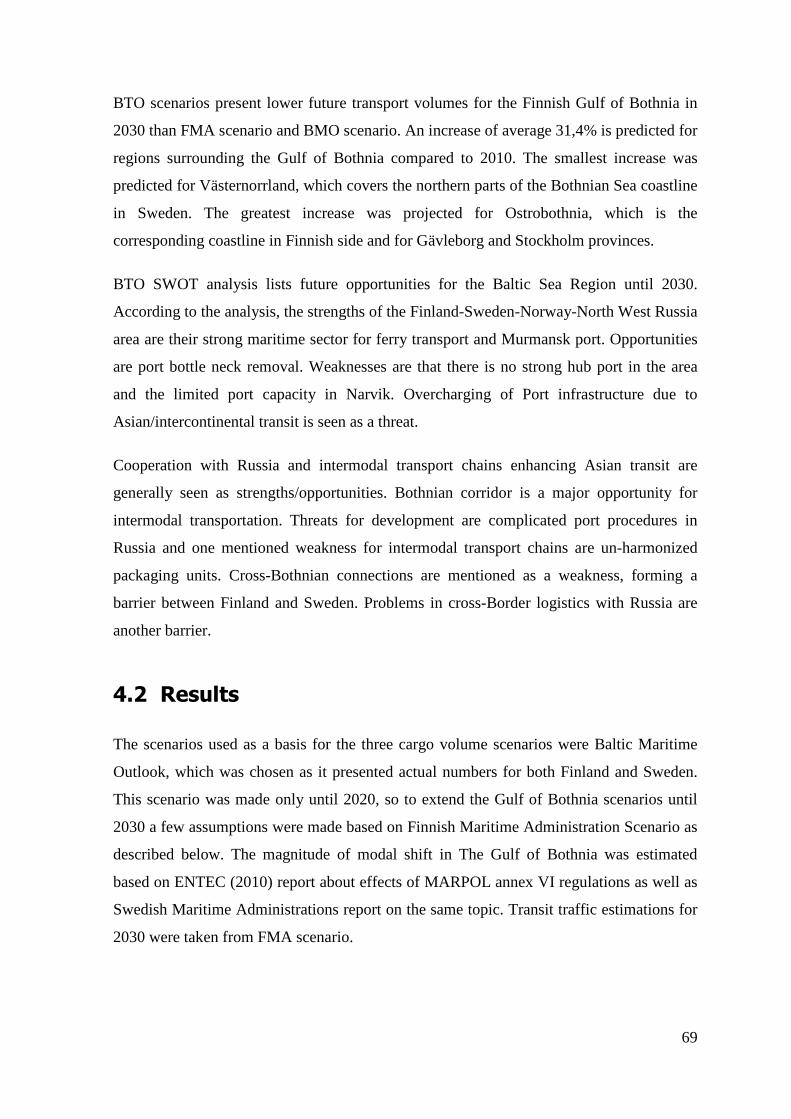
69
BTO scenarios present lower future transport volumes for the Finnish Gulf of Bothnia in
2030 than FMA scenario and BMO scenario. An increase of average 31,4% is predicted for
regions surrounding the Gulf of Bothnia compared to 2010. The smallest increase was
predicted for Västernorrland, which covers the northern parts of the Bothnian Sea coastline
in Sweden. The greatest increase was projected for Ostrobothnia, which is the
corresponding coastline in Finnish side and for Gävleborg and Stockholm provinces.
BTO SWOT analysis lists future opportunities for the Baltic Sea Region until 2030.
According to the analysis, the strengths of the Finland-Sweden-Norway-North West Russia
area are their strong maritime sector for ferry transport and Murmansk port. Opportunities
are port bottle neck removal. Weaknesses are that there is no strong hub port in the area
and the limited port capacity in Narvik. Overcharging of Port infrastructure due to
Asian/intercontinental transit is seen as a threat.
Cooperation with Russia and intermodal transport chains enhancing Asian transit are
generally seen as strengths/opportunities. Bothnian corridor is a major opportunity for
intermodal transportation. Threats for development are complicated port procedures in
Russia and one mentioned weakness for intermodal transport chains are un-harmonized
packaging units. Cross-Bothnian connections are mentioned as a weakness, forming a
barrier between Finland and Sweden. Problems in cross-Border logistics with Russia are
another barrier.
4.2 Results
The scenarios used as a basis for the three cargo volume scenarios were Baltic Maritime
Outlook, which was chosen as it presented actual numbers for both Finland and Sweden.
This scenario was made only until 2020, so to extend the Gulf of Bothnia scenarios until
2030 a few assumptions were made based on Finnish Maritime Administration Scenario as
described below. The magnitude of modal shift in The Gulf of Bothnia was estimated
based on ENTEC (2010) report about effects of MARPOL annex VI regulations as well as
Swedish Maritime Administrations report on the same topic. Transit traffic estimations for
2030 were taken from FMA scenario.
All these figures were then applied to the Gulf of Bothnia context based on the share of the
Gulf of Bothnia ports for all international transports of Finland and Sweden in 2010 (Baltic
Port List 2011).
4.2.1 Strong growth
The transports in the Gulf of Bothnia will grow 60% by the year 2030
The figures of the strong growth scenario, presented in table 9, are based on the BMO
scenario. However, the starting point (year 2010) has been adjusted so that instead of the
BMO scenario figures for the year 2010, the realized cargo volumes of Finland and
Sweden have been used as the basis for calculations. The growth factors for the years
2010-2020 is calculated from the original BMO scenario. The growth is assumed to be
linear, so the scenario for 2030 has been extrapolated based on the same growth factors as
for the decade 2010-2020. The Transit traffic figures have been added based on the
“Näkymä-WSP” in the FMA scenario which was an estimate of the growth of each
commodity group transport made by consultants. Transit growth had five different
scenarios for the year 2030. The “Näkymä-WSP” was chosen as it gave a cargo volume
that was closest to the realized transit volumes in 2010, calculated with the formula
described above in chapter 4.1.1.
It is assumed that 1 million tons of cargo will be shifted from maritime transport to
railways and roads due to MARPOL restrictions in the Gulf of Bothnia area. This figure is
estimated based on study prepared by Swedish Maritime Administration Sjöfartsverket
(2009).
Table 9: Strong growth scenario for the Gulf of Bothnia 2030
STRONG GROWTH (TOTAL TRANSPORT Mt/year) Import Export Total + Transit FI 2010 49,43426 36,43688 85,87114 7,4 FI 2020 64,62189 46,11818 110,74007 FI 2030 84,47561 58,3718 142,84741 14,67 SWE 2010 84,372 70,624 154,996 SWE 2020 105,2811 83,10718 188,3883 SWE 2030 131,372 97,79682 229,16879
71
STRONG GROWTH Gulf of Bothnia (Mt/year)
Import Export Transit/Modal
shift Total FI 2010 17,64253 12,99314 2,69 33,32567 FI 2020 22,4238 17,10984 39,53364 FI 2030 29,31303 21,65594 5,2812 56,25017 SWE 2010 9,754 11,18 20,934 SWE 2020 12,46419 12,10325 1Mt modal shift 24,56744 SWE 2030 15,55307 15,10268 30,65576
4.2.2 Average growth
The transports in the Gulf of Bothnia will grow 43% by year 2030.
The average growth scenario is presented in table 10. The figures for the years 2010-2020
have been calculated in the same way as described above. The growth factor for the years
2020-2030 has been estimated as follows:
The FMA scenario predicts that the growth of Finnish exports follows the growth of GDP
in 2020-2030. The GDP growth is generally predicted to slow down during the next
decade. Finnish Bank estimated in March 2011 that GDP growth for 2011 would be 3,8%
and for years 2012-2013 about 2,5%. This estimation has come down in the latest Finnish
estimation, which predicts an average growth of 1,9 % for years 2012-2015 (Ministry of
Finances 2011). Since these overall estimates have gone down from the time when FMA
scenario was made, the minimum scenario of that study is considered to be the average
growth scenario here. In FMA scenario, the minimum scenario for the annual GDP growth
of Finland for the years 2020-2025 is 1,8% and for the years 2025-2030 1,6%. The
average of these (1,7%) has been used as the growth factor for Finnish exports for the
decade 2020-2030. The annual growth decreases therefore 26,08% compared to the growth
between 2010 and 2020. A robust assumption was made; the growth rates for Finnish
imports and exports as well as for Swedish imports and exports react in a similar way.
Therefore all growth rates are 26,08% lower than in the strong growth scenario.
For transit, it is estimated that the cargo volumes stay on the same level as in 2010. It is
assumed that a modal shift of 2 million tons will occur in Swedish side due to MARPOL
regulations in 2010-2020.
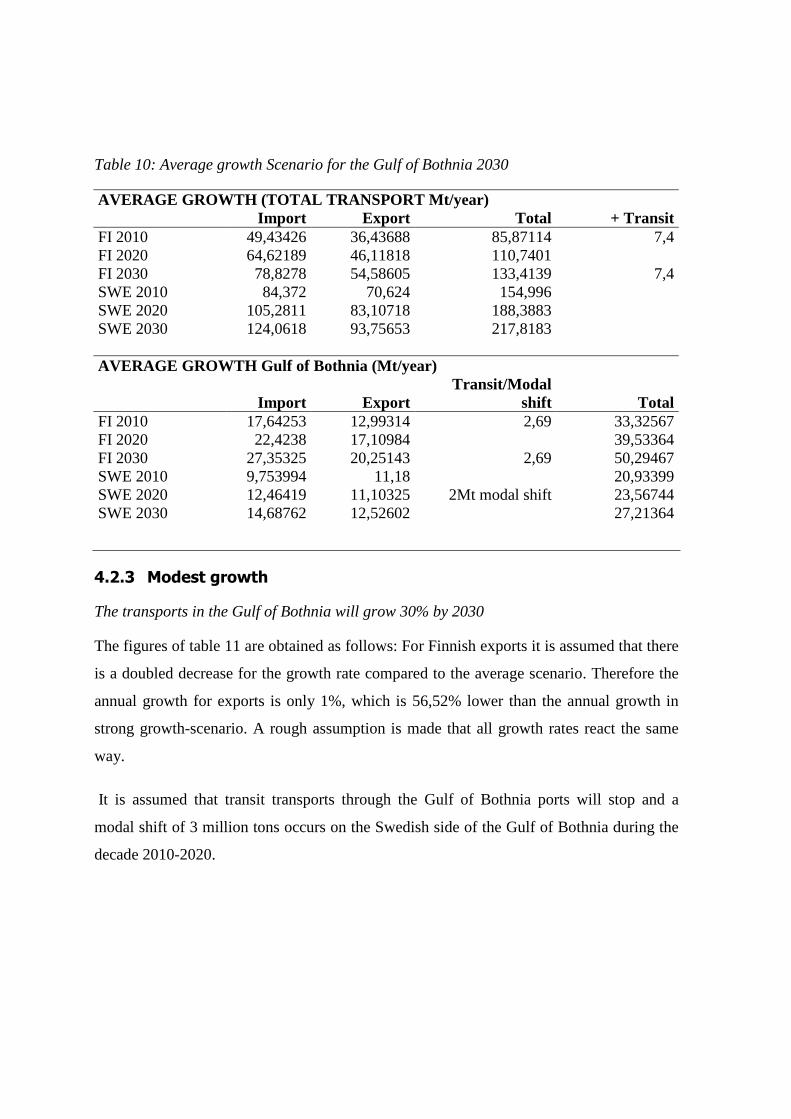
Table 10: Average growth Scenario for the Gulf of Bothnia 2030
AVERAGE GROWTH (TOTAL TRANSPORT Mt/year) Import Export Total + Transit FI 2010 49,43426 36,43688 85,87114 7,4 FI 2020 64,62189 46,11818 110,7401 FI 2030 78,8278 54,58605 133,4139 7,4 SWE 2010 84,372 70,624 154,996 SWE 2020 105,2811 83,10718 188,3883 SWE 2030 124,0618 93,75653 217,8183
AVERAGE GROWTH Gulf of Bothnia (Mt/year)
Import Export Transit/Modal
shift Total FI 2010 17,64253 12,99314 2,69 33,32567 FI 2020 22,4238 17,10984 39,53364 FI 2030 27,35325 20,25143 2,69 50,29467 SWE 2010 9,753994 11,18 20,93399 SWE 2020 12,46419 11,10325 2Mt modal shift 23,56744 SWE 2030 14,68762 12,52602 27,21364
4.2.3 Modest growth
The transports in the Gulf of Bothnia will grow 30% by 2030
The figures of table 11 are obtained as follows: For Finnish exports it is assumed that there
is a doubled decrease for the growth rate compared to the average scenario. Therefore the
annual growth for exports is only 1%, which is 56,52% lower than the annual growth in
strong growth-scenario. A rough assumption is made that all growth rates react the same
way.
It is assumed that transit transports through the Gulf of Bothnia ports will stop and a
modal shift of 3 million tons occurs on the Swedish side of the Gulf of Bothnia during the
decade 2010-2020.
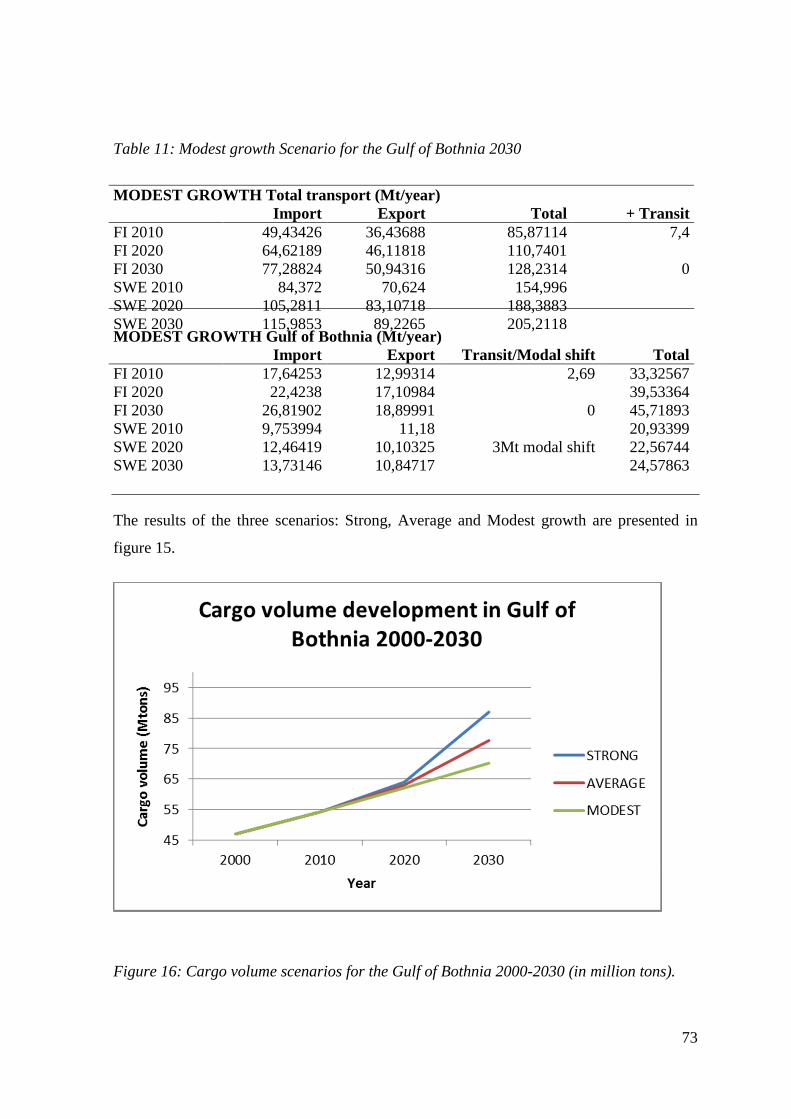
73
Table 11: Modest growth Scenario for the Gulf of Bothnia 2030
The results of the three scenarios: Strong, Average and Modest growth are presented in
figure 15.
Figure 16: Cargo volume scenarios for the Gulf of Bothnia 2000-2030 (in million tons).
MODEST GROWTH Total transport (Mt/year) Import Export Total + Transit FI 2010 49,43426 36,43688 85,87114 7,4 FI 2020 64,62189 46,11818 110,7401 FI 2030 77,28824 50,94316 128,2314 0 SWE 2010 84,372 70,624 154,996 SWE 2020 105,2811 83,10718 188,3883 SWE 2030 115,9853 89,2265 205,2118 MODEST GROWTH Gulf of Bothnia (Mt/year) Import Export Transit/Modal shift Total FI 2010 17,64253 12,99314 2,69 33,32567 FI 2020 22,4238 17,10984 39,53364 FI 2030 26,81902 18,89991 0 45,71893 SWE 2010 9,753994 11,18 20,93399 SWE 2020 12,46419 10,10325 3Mt modal shift 22,56744 SWE 2030 13,73146 10,84717 24,57863
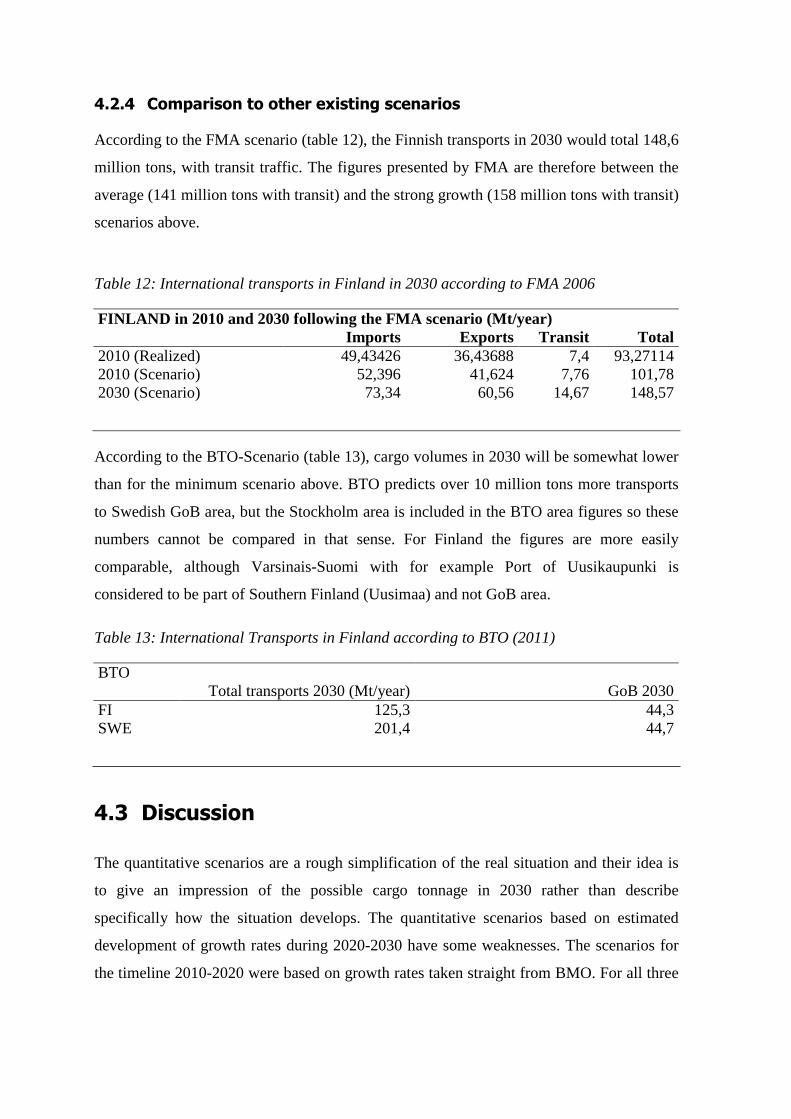
4.2.4 Comparison to other existing scenarios
According to the FMA scenario (table 12), the Finnish transports in 2030 would total 148,6
million tons, with transit traffic. The figures presented by FMA are therefore between the
average (141 million tons with transit) and the strong growth (158 million tons with transit)
scenarios above.
Table 12: International transports in Finland in 2030 according to FMA 2006
FINLAND in 2010 and 2030 following the FMA scenario (Mt/year) Imports Exports Transit Total 2010 (Realized) 49,43426 36,43688 7,4 93,27114 2010 (Scenario) 52,396 41,624 7,76 101,78 2030 (Scenario) 73,34 60,56 14,67 148,57
According to the BTO-Scenario (table 13), cargo volumes in 2030 will be somewhat lower
than for the minimum scenario above. BTO predicts over 10 million tons more transports
to Swedish GoB area, but the Stockholm area is included in the BTO area figures so these
numbers cannot be compared in that sense. For Finland the figures are more easily
comparable, although Varsinais-Suomi with for example Port of Uusikaupunki is
considered to be part of Southern Finland (Uusimaa) and not GoB area.
Table 13: International Transports in Finland according to BTO (2011)
BTO Total transports 2030 (Mt/year) GoB 2030 FI 125,3 44,3 SWE 201,4 44,7
4.3 Discussion
The quantitative scenarios are a rough simplification of the real situation and their idea is
to give an impression of the possible cargo tonnage in 2030 rather than describe
specifically how the situation develops. The quantitative scenarios based on estimated
development of growth rates during 2020-2030 have some weaknesses. The scenarios for
the timeline 2010-2020 were based on growth rates taken straight from BMO. For all three
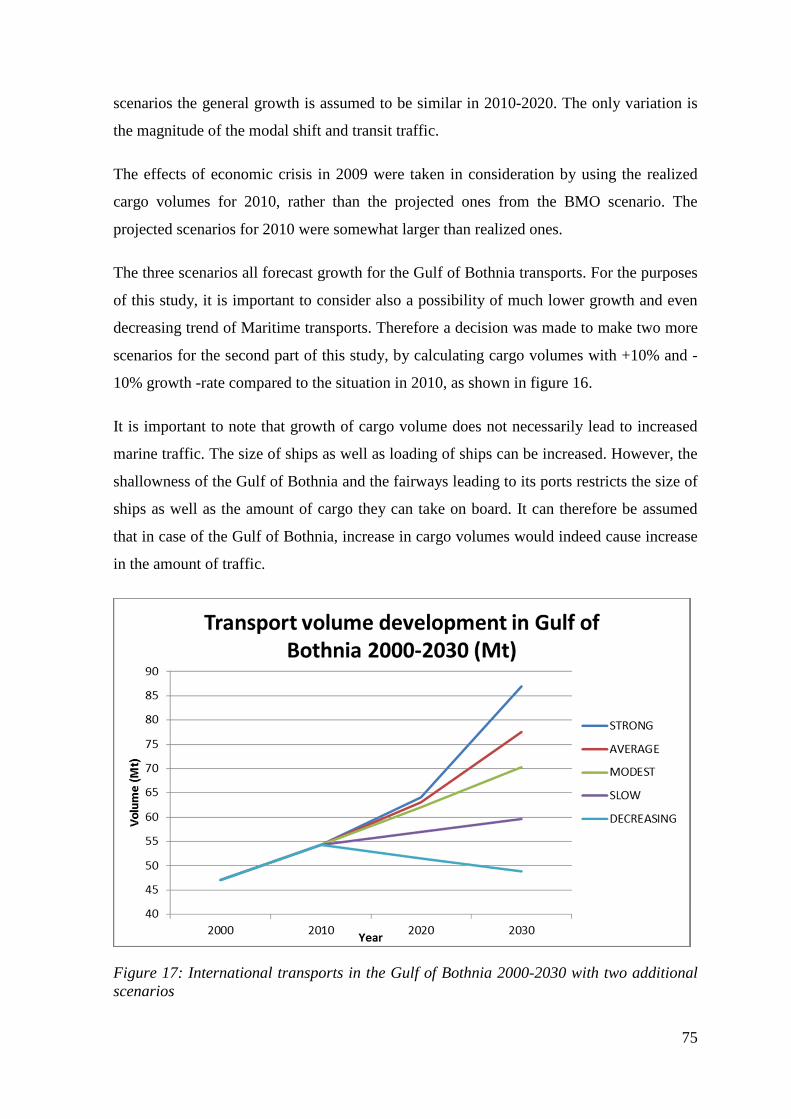
75
scenarios the general growth is assumed to be similar in 2010-2020. The only variation is
the magnitude of the modal shift and transit traffic.
The effects of economic crisis in 2009 were taken in consideration by using the realized
cargo volumes for 2010, rather than the projected ones from the BMO scenario. The
projected scenarios for 2010 were somewhat larger than realized ones.
The three scenarios all forecast growth for the Gulf of Bothnia transports. For the purposes
of this study, it is important to consider also a possibility of much lower growth and even
decreasing trend of Maritime transports. Therefore a decision was made to make two more
scenarios for the second part of this study, by calculating cargo volumes with +10% and -
10% growth -rate compared to the situation in 2010, as shown in figure 16.
It is important to note that growth of cargo volume does not necessarily lead to increased
marine traffic. The size of ships as well as loading of ships can be increased. However, the
shallowness of the Gulf of Bothnia and the fairways leading to its ports restricts the size of
ships as well as the amount of cargo they can take on board. It can therefore be assumed
that in case of the Gulf of Bothnia, increase in cargo volumes would indeed cause increase
in the amount of traffic.
Figure 17: International transports in the Gulf of Bothnia 2000-2030 with two additional scenarios

77
5 PART II: RT-DELPHI ABOUT FUTURE OF
MARITIME TRANSPORTATION IN THE
GULF OF BOTHNIA 2030
5.1 Key concepts
5.1.1 Megatrends
When scenarios are formed, it is important to identify the factors that have an obvious and
straight forward impact on the development. Additionally, there are megatrends which are
the large scale driving forces. Megatrends are defined as developments that “should be
characterized as megatrends because they overarch and impact on everything else. They
are trends deemed so powerful that they have the potential to transform society across
social categories and at all levels, from individuals and local-level players to global
structures, and eventually to change our ways of living and thinking“ (Norden, 2011).
Nordic cooperation project Norden has prepared a Megatrends report for the Arctic. They
identified nine megatrends:
1. Increased urbanization
2. Demographic change in age structure
3. Dependency on transfers and exploitation of natural resources
4. Pollution and Climate change have a great effect in Arctic areas
5. More investments in human capital needed
6. Private and Public sector interaction impacts development
7. Renewable energy will contribute to greening of economy
8. Increased accessibility creates new risks
9. The arctic is a new player in the global game
All of these megatrends do not necessarily have a great impact on the Gulf of Bothnia
maritime traffic, others are very relevant. Dependency on transfers and natural resources
(Megatrend no. 3) is maybe the most important megatrend in the Gulf of Bothnia area.
Mining activities in the old Fennoscandian shield with mineral resources are one of the
main driving forces of transportation.
Pollution and Climate change (Megatrend no. 4) effect maritime transportation on two
different ways. Firstly, climate warming might open new opportunities for maritime
transport if ice conditions get easier in the Gulf of Bothnia and along the Northern Sea
Route from the North Atlantic to the Pacific Ocean. If this sea route opens, it could create
new business opportunities for the Gulf of Bothnia to operate as a strong hinterland
connection to Murmansk hub port, a gateway for increasing transports between Europe and
Asia. This kind of increased accessibility (Megatrend no. 8) and traffic would create new
environmental risks for the whole Baltic Sea but also improve the global status of this area
and direct more attention towards it as an important transportation corridor (Megatrend no.
9). Better connections to North and northern railroad projects have been studied in several
occasions. Preliminary studies have been conducted for the Kolari-Skibotten railroad,
Rovaniemi-Kirkenes railroad as well as the Salla-Kandalaksha railroad (see figure 11). The
Salla Kandalaksha-study was made before the raw wood transports from Russia ended,
reducing the transport potential remarkably. However, in future the connection could be
feasible due to potential growth of Kola Peninsula and the Northern Sea Route transports.
The other point of view is the increased awareness of pollution and climate change,
especially the contribution of shipping to these. New regulations concerning environmental
aspects of shipping are a major contributor to the future of this transport mode. Renewable
energy (Megatrend no. 7) is a part of this: biofuels are having an impact in ship building
technology and marine transportation of energy resources.
The private and public sector interaction (Megatrend no. 6) is also relevant in the Gulf of
Bothnia maritime transport sector. Not only it plays a key role in mining activities, as
mining companies are private but public sector is still greatly responsible for infrastructure,
but also in development of ports and different services for shipping.
79
5.1.2 Trends
Trends can be more short term or more limited phenomena compared to megatrends. For
example market trends belong to this category. Cyclical trends in for example bulk
shipping supply-demand pattern or forest industry profitability can be very important
factors in the Gulf of Bothnia context. Privatization of ports and service sector for maritime
transport can also be seen as a trend, which could make the ports more rapidly adaptable to
changing business environment as slower municipal decision making processes would not
be necessary to develop the ports.
Raw materials price development is one of the most important trends affecting the
maritime transport in the Gulf of Bothnia. It is a grey area whether or not raw materials
price development and increasing competition over limited resources are in fact a global
megatrend. It is clear that in the future the prices will increase as competition and demand
of limited natural resources will grow, provided that the general economic growth will
continue. This will have great effects through global and local economics, societies as well
as individuals and change the way of living and even thinking. Prices have fluctuated
during last decades due to economic growth and strong increase of demand. Supply of
certain raw materials cannot follow the demand fast enough, as launching of mining
projects is slow process.
Unitized cargo is also a maritime transport trend. According to BTO scenarios, the greatest
growth for maritime transport in the scale of the whole Baltic Sea Region can be expected
to be containerized cargo. Directing the transports from roads to sea and rail to decrease
the congestion could be mentioned as an important trend.
One important trend affecting the maritime transport in general is the recent great growth
in Eastern and Southern economies and related to this: the shift of industries from West to
East and from North to South. This is a phenomenon which is not likely to get weaker and
it has a great effect on transportation of goods in global as well as local scale. Annual
growth rate for container transports from Europe to Asia have been estimated to be of 5-6
% between 2008 and 2015 and 2-4 % between 2015 and 2030 (Transbaltic 2010).
5.1.3 Wild cards
Carbon dioxide liquefaction plants can be mentioned as a wild card. This technology is still
in developing phase but it has a possibility to change the course dramatically.
Transportation of liquefied carbon dioxide would require transportation capacity and
special vessels. One plant is planned near the port of Kemi and the projected volume for
this is about 0,5 Mtons/year. If this technology would be widely utilized, transportation of
liquefied carbon dioxide could have effects on Maritime transport in Gulf of Bothnia.
Another wild card is the development of arctic shipping technology so that all ships that
are operating in the Gulf of Bothnia would have capability to function as ice breakers. This
would reduce the waiting time for ice breakers and secure timely shipping in all ice
conditions as ships would not need to wait for assistance. At the moment ice breaking
services guarantee a maximum 4 hour waiting time for ships requesting assistance.
5.1.4 Key factors
Megatrends and trends can be key factors for a maritime transport scenario but key factors
can also be more specific, short term, single events that have an effect in the whole picture.
Based on trends, megatrends and wild cards, 18 key factors were identified and formed
into theses or multiple choice questions about future for the RT-Delphi round. The key
factors were divided in five themes. They are listed below to give an image of what each
thesis was concerning.
Theme I: Environment and physical conditions
Thesis 1: Ice conditions
Thesis 2: Northern sea route (North-east passage) opens for commercial shipping by 2030
Thesis 3: Sulphur Emission Control area (SECA)
Thesis 4: Nitrogen Emissions Control Area (NECA)
THEME 2: Innovations and industries
Thesis 5: New forestry products, such as biofuels
Thesis 6: Development of imports of raw wood to Finland and Sweden
Thesis 8: Carbon dioxide capture
Thesis 7: Northern mining products transport
81
THEME 3: Logistics and Transport corridors
Thesis 9: Mid-Nordic corridor
Thesis 10: Bothnian corridor
Thesis 11: Transit traffic
Thesis 12: Murmansk Port effect
Thesis 13: Transport centralizing in fewer large ports
Thesis 14: New railroad connections built to Northern Finland and Sweden
THEME 4: Economics
Thesis 15: Annual growth of GDP by 2030
Thesis 16: Fairway fees in Finland and Sweden
Thesis 17: Railway fees
Thesis 18: Raw materials prices
THEME 5: Conclusion on key factors and cargo volume
Assessment of three most important key factors
Assessment of cargo volume scenarios from Part I of this study

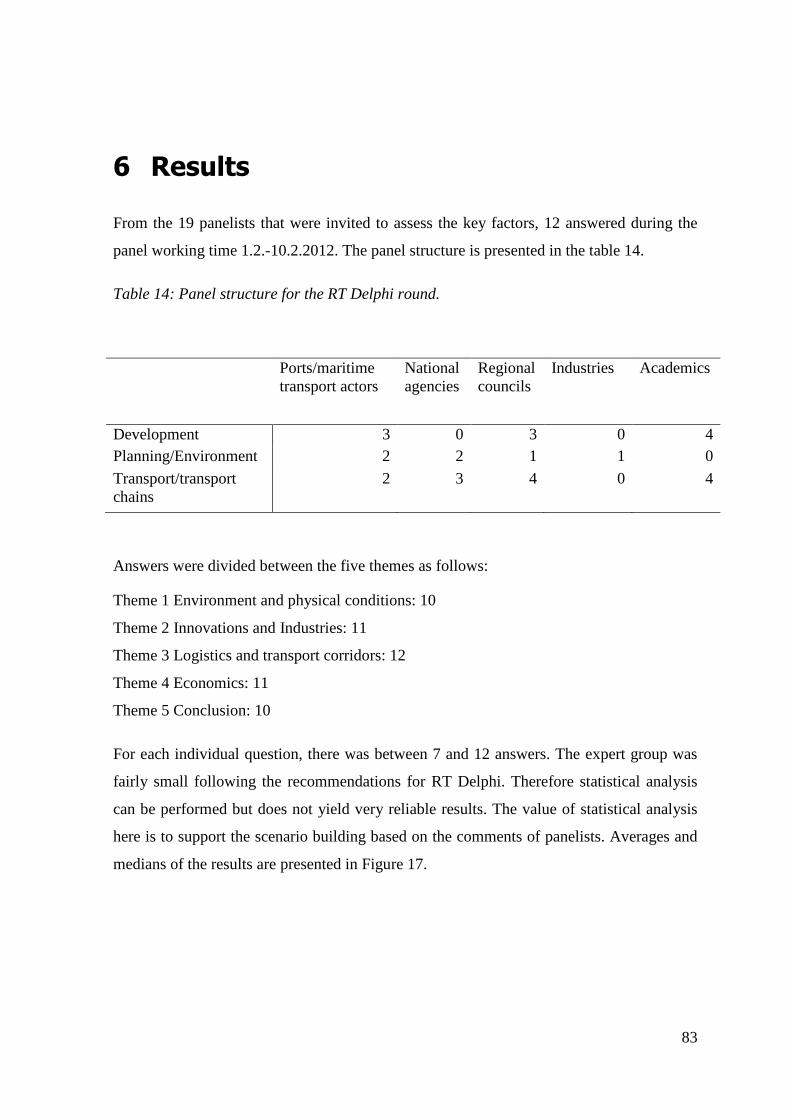
83
6 Results
From the 19 panelists that were invited to assess the key factors, 12 answered during the
panel working time 1.2.-10.2.2012. The panel structure is presented in the table 14.
Table 14: Panel structure for the RT Delphi round.
Answers were divided between the five themes as follows:
Theme 1 Environment and physical conditions: 10
Theme 2 Innovations and Industries: 11
Theme 3 Logistics and transport corridors: 12
Theme 4 Economics: 11
Theme 5 Conclusion: 10
For each individual question, there was between 7 and 12 answers. The expert group was
fairly small following the recommendations for RT Delphi. Therefore statistical analysis
can be performed but does not yield very reliable results. The value of statistical analysis
here is to support the scenario building based on the comments of panelists. Averages and
medians of the results are presented in Figure 17.
Ports/maritime transport actors
National agencies
Regional councils
Industries Academics
Development 3 0 3 0 4 Planning/Environment 2 2 1 1 0
Transport/transport chains
2 3 4 0 4
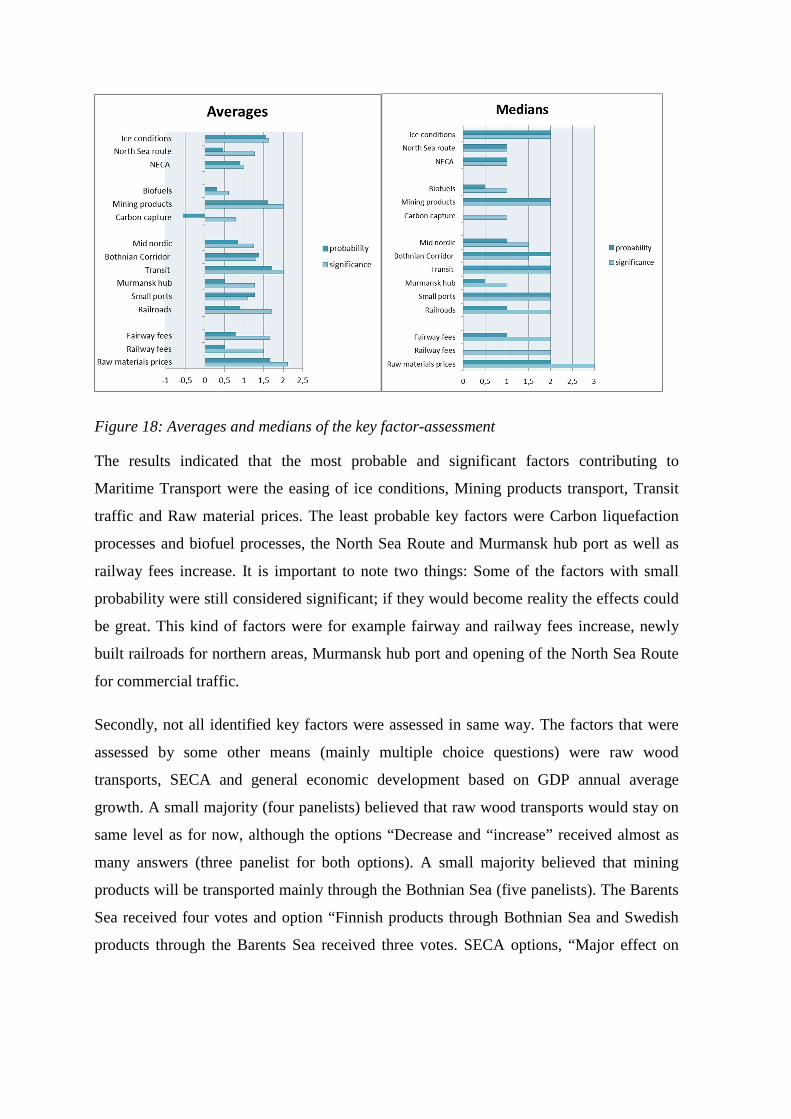
Figure 18: Averages and medians of the key factor-assessment
The results indicated that the most probable and significant factors contributing to
Maritime Transport were the easing of ice conditions, Mining products transport, Transit
traffic and Raw material prices. The least probable key factors were Carbon liquefaction
processes and biofuel processes, the North Sea Route and Murmansk hub port as well as
railway fees increase. It is important to note two things: Some of the factors with small
probability were still considered significant; if they would become reality the effects could
be great. This kind of factors were for example fairway and railway fees increase, newly
built railroads for northern areas, Murmansk hub port and opening of the North Sea Route
for commercial traffic.
Secondly, not all identified key factors were assessed in same way. The factors that were
assessed by some other means (mainly multiple choice questions) were raw wood
transports, SECA and general economic development based on GDP annual average
growth. A small majority (four panelists) believed that raw wood transports would stay on
same level as for now, although the options “Decrease and “increase” received almost as
many answers (three panelist for both options). A small majority believed that mining
products will be transported mainly through the Bothnian Sea (five panelists). The Barents
Sea received four votes and option “Finnish products through Bothnian Sea and Swedish
products through the Barents Sea received three votes. SECA options, “Major effect on
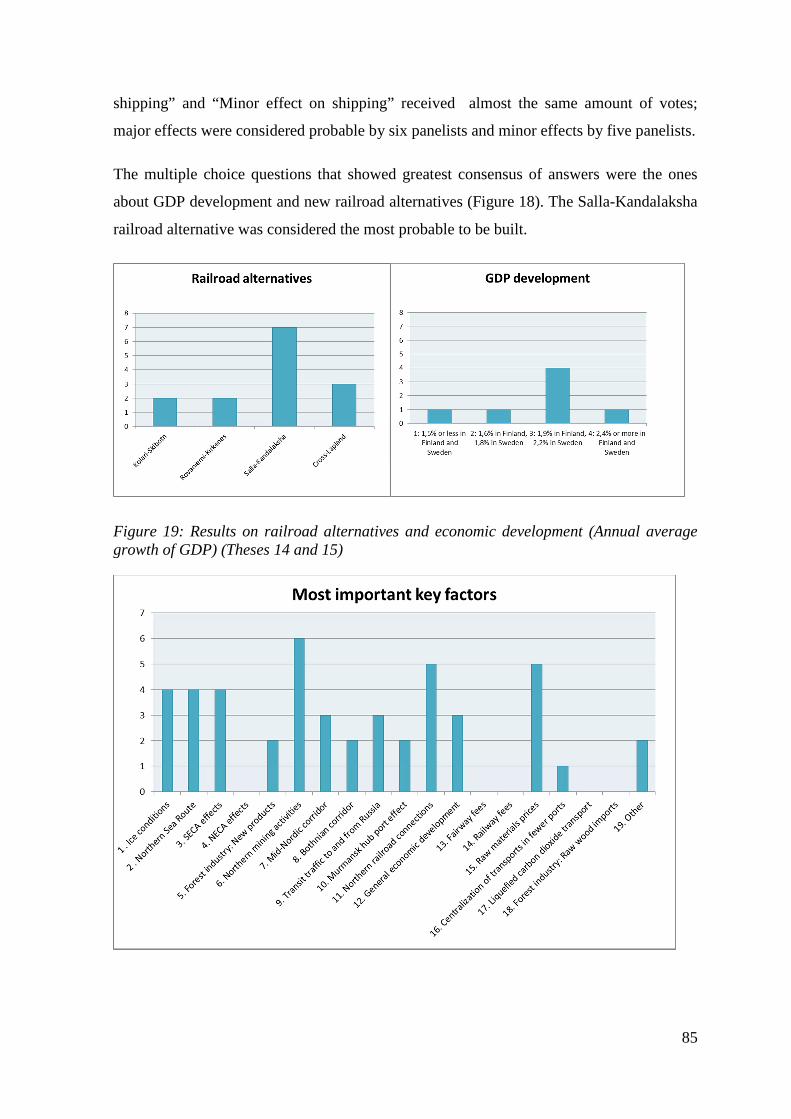
85
shipping” and “Minor effect on shipping” received almost the same amount of votes;
major effects were considered probable by six panelists and minor effects by five panelists.
The multiple choice questions that showed greatest consensus of answers were the ones
about GDP development and new railroad alternatives (Figure 18). The Salla-Kandalaksha
railroad alternative was considered the most probable to be built.
Figure 19: Results on railroad alternatives and economic development (Annual average growth of GDP) (Theses 14 and 15)
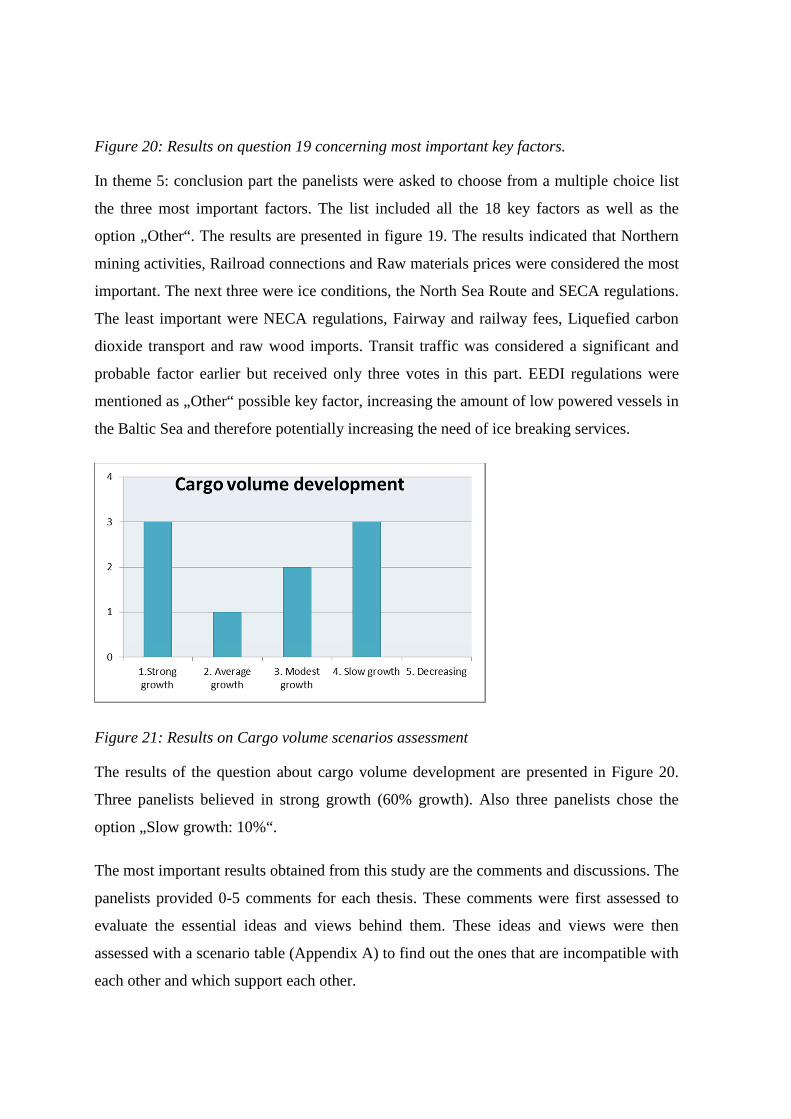
Figure 20: Results on question 19 concerning most important key factors.
In theme 5: conclusion part the panelists were asked to choose from a multiple choice list
the three most important factors. The list included all the 18 key factors as well as the
option „Other“. The results are presented in figure 19. The results indicated that Northern
mining activities, Railroad connections and Raw materials prices were considered the most
important. The next three were ice conditions, the North Sea Route and SECA regulations.
The least important were NECA regulations, Fairway and railway fees, Liquefied carbon
dioxide transport and raw wood imports. Transit traffic was considered a significant and
probable factor earlier but received only three votes in this part. EEDI regulations were
mentioned as „Other“ possible key factor, increasing the amount of low powered vessels in
the Baltic Sea and therefore potentially increasing the need of ice breaking services.
Figure 21: Results on Cargo volume scenarios assessment
The results of the question about cargo volume development are presented in Figure 20.
Three panelists believed in strong growth (60% growth). Also three panelists chose the
option „Slow growth: 10%“.
The most important results obtained from this study are the comments and discussions. The
panelists provided 0-5 comments for each thesis. These comments were first assessed to
evaluate the essential ideas and views behind them. These ideas and views were then
assessed with a scenario table (Appendix A) to find out the ones that are incompatible with
each other and which support each other.
87
Not enough data about the spatial implications of the key factors was obtained. Only one
port was specifically mentioned (Kaskinen) and additionally some comments implicated
that the ports and cities that belong to the international corridors are likely to benefit of the
developments.
6.1 Scenarios
6.1.1 Basic assumptions for scenarios and maps
The scenarios are based on the comments and views of the panelists. The scenarios were
created to offer insight to future states that could cause the most variation to shipping
traffic in the Gulf of Bothnia so the probability of each scenario varies. They aim to
consider the effects of most important and significant key factors identified by the
panelists.
The comments and views were analysed with a scenario table to find out the developments
that are so called “impossible paired events” and the developments that support each other.
Based on the probability analyses, some basic assumptions were made for all scenarios to
be true.
Not many comments from the RT-Delphi round indicated specific areas, ports and such.
The spatial nature of this study is therefore more speculative than a direct result of the
research. The scenarios and especially their physical consequences on shipping in Gulf of
Bothnia are assumptions based on for example ports associated with different transport
corridor projects, ports investments and existing or planned railroad connections. The maps
are to be considered as speculation on how the different key factors and the three scenarios
built on the comments provided by the panelists could direct transport flows in the Gulf of
Bothnia and as an example of what kind of results could be obtained if the research was
repeated following the recommendations presented later in the discussion part.
The basic assumptions for all scenarios:
• Raw materials prices will stay relatively high. The demand is high in Asia and/or
Europe, and catastrophic wild card events such as economic crisis will not occur.
• Mining activities, raw materials prices and transit traffic are the strongest drivers
for development in the area
• Ice conditions will eventually get easier but the speed of this development and
effects in the Gulf of Bothnia vary between scenarios.
• Centralization of industries and port activities to larger entities is a common trend.
The basic assumptions for maps:
• The ports which are mentioned to be part of primary network of the Bothnian
Corridor or the Mid-Nordic corridor are all considered to benefit equally if the
corridors realize.
• The ports which are part of Mid-Nordic corridor are considered to grow in the East-
West transit 2030-scenario.
• The main growth is assumed to be in bulk transport except in scenario 3 where the
MidNordic corridor is assumed to handle also unitized cargo. The ports that are
currently transporting unitized cargo in the Gulf of Bothnia are assumed to continue
it as for now.
• The ports where pilot biofuel operations exist or are planned are considered to be
the important ports of biofuel developments also in 2030.
• The ports that have recently planned or made investments in fairway dredging are
considered to gain importance as it is one of the main limiting factors for
transportation in the Gulf of Bothnia ports that will stay constant, due to post-
glacial land uprising
Strong European industry 2030
“The Baltic Sea Region has tremendous potential for global transports with strengthening
of the Baltic states and Eastern European Countries as a means to make manufacturing
more sustainable i.e. closer to markets assuming they can make profits with
globalization.”
Main logic:
• Production moves closer to markets
89
• The Gulf of Bothnia and Bothnian corridor is an important transport route for
Northern mining products
• The North Sea route has not opened for commercial shipping
• Strong cooperation between the Northern countries
High demand of raw materials and warming trend makes conditions favorable to the
Nordic countries and Russia. Sustainability is a key word for economic development and
industries tend to move closer to markets.
Especially the Baltic countries and Eastern European countries act as strong drivers for the
European economy and Baltic Sea Region is an area of global importance. The Bothnia
corridor and associated investments prove necessary and goods flow to and from the Gulf
of Bothnia ports belonging to this corridor as secondary links. Russia becoming part of
WTO has improved trade conditions and relations. Finnish-Russian border operations have
been made more efficient to handle cargo flows. Transit traffic increases in the Gulf of
Bothnia ports. Kokkola has experience of handling transit traffic but as the cargo volume
increases, some other ports with unused potential could take over part of it, provided that
their railway connections are improved to handle future demand. For example port of
Kaskinen could benefit from this if investments were made to improve the railroad
connections from Seinäjoki in the future.
Of the proposed railway connections in Northern Fennoscandia, the Salla-Kandalaksha
connection is built to increase the connectivity between the Nordic countries and Kola area
to make it a strong mineral region for European needs. Northern Sea route has not opened
for commercial traffic; maximum ice extent has been significantly reduced, however the
ice conditions are still too unpredictable. The situation is likely to change in future.
Murmansk port is strong due to Arctic gas transport and the Salla-Kandalaksha connection
foresees great increase in cargo volumes as the importance of the Murmansk port keeps
growing. The ports that are closely linked to the new railroad connection gain benefit.
Closest port for the new railroad is Kemi.
There are fewer drivers, such as strong ocean currents, to ease the ice conditions in the
Gulf of Bothnia than in the North Sea Route. The reliability of transport is insufficient for
international container transports so Bulk cargo is the most common cargo type in the
Bothnian Sea. Narvik railroad is improved to ensure flow of Northern minerals to the
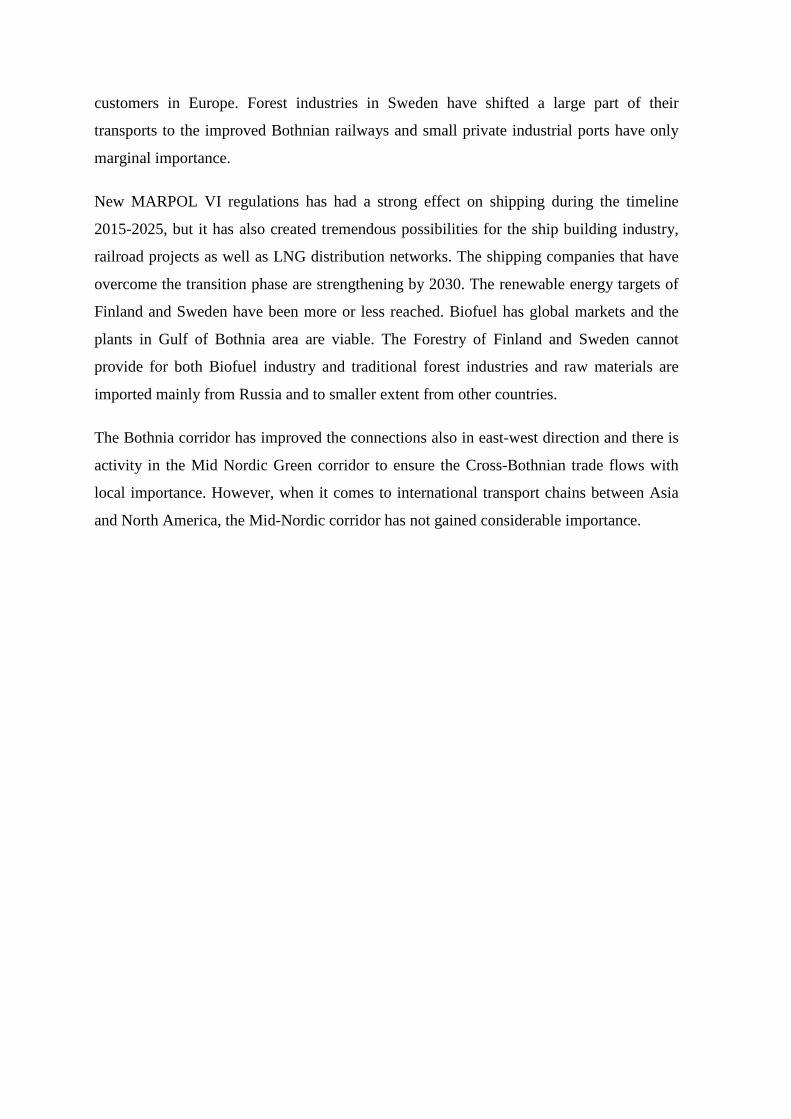
customers in Europe. Forest industries in Sweden have shifted a large part of their
transports to the improved Bothnian railways and small private industrial ports have only
marginal importance.
New MARPOL VI regulations has had a strong effect on shipping during the timeline
2015-2025, but it has also created tremendous possibilities for the ship building industry,
railroad projects as well as LNG distribution networks. The shipping companies that have
overcome the transition phase are strengthening by 2030. The renewable energy targets of
Finland and Sweden have been more or less reached. Biofuel has global markets and the
plants in Gulf of Bothnia area are viable. The Forestry of Finland and Sweden cannot
provide for both Biofuel industry and traditional forest industries and raw materials are
imported mainly from Russia and to smaller extent from other countries.
The Bothnia corridor has improved the connections also in east-west direction and there is
activity in the Mid Nordic Green corridor to ensure the Cross-Bothnian trade flows with
local importance. However, when it comes to international transport chains between Asia
and North America, the Mid-Nordic corridor has not gained considerable importance.
91
Figure 22: Strong Europe 2030 Map
Towards Arctic 2030
“Murmansk region will develop for energy industry and logistic center until 2030 for
North-West Russia. It is also very important for the Northern Sea Route”
“No doubt Murmansk port will be a key hub for oil and gas, minerals, and timber
transports between Eurasia and will enhance sustainability, but it will require a sense of
Nordic trust”
“Kirkenes competes with port of Murmansk”
Main logic:
• Northern railroad projects are realized but cooperation between the Northern
regions is not successful
• Northern Sea Route opens for commercial transport
• MARPOL regulations have a strong effect on transports in the Gulf of Bothnia
• Competition between Russian and Scandinavian ports in the Arctic
Global interest has shifted strongly towards the Arctic as the North Sea Route offers great
possibilities for world trade. Strong effect on trade patterns come from European and
Russian trading relations, which have not improved considerably even though Russia is
part of WTO. Lack of trust between the Northern countries has led to Nordic countries
trading with each other and competition between Murmansk and Kirkenes ports in the
arctic.
Of the Northern railroad projects, the Salla-Kandalaksha has been built in the awaiting of
Northern cooperation in transport but the route has not fulfilled the purpose as the
bottleneck issues in the Murmansk-South Kola railroad have not been solved and border
controls in Finnish-Russian border are still not efficient enough. Murmansk is a hub for oil
and gas, minerals, and timber transports but this does not have considerable effects on the
Gulf of Bothnia due to high cost of intermodal land transport through this transport chain.
Transit traffic in the Gulf of Bothnia has reduced considerably.
As most of the customers for raw material trade are in Asia, Nordic mining industries need
good connections to the Barents Sea and the North Sea Route. This has been ensured with
93
building of the Kolari-Svappavaara and the Rovaniemi-Kirkkoniemi railroads as well as
improving the Narvik Iron Ore railway to the Norwegian Sea coast.
The effects in the Gulf of Bothnia concentrate on the Bay of Bothnia. The Mid Nordic
corridor is not realized as a large scale international transport route. Small Bothnian Sea
ports could not grow as international hubs due to their remoteness. Investments are made
elsewhere and the Gulf of Bothnia port connections are not prioritized. Some trade activity
of local importance between Nordic countries exists in the area but cross-Bothnian
connections are generally not profitable. Container transports continue in ports that are
currently handling unitized cargo.
Centralization of Industries in the Gulf of Bothnia area is strong and smaller ports have lost
importance. Transports have concentrated in larger ports that are part of the Bothnian
Corridor. The Bothnia Corridor serves industries with connections to mainland Europe and
modal shift has been strong in Sweden due to MARPOL VI regulations. The ice conditions
get easier also in the Gulf of Bothnia but this has no considerable effects on cargo
volumes.
Mining activities have generally increased their importance in the Gulf of Bothnia area, but
the reducing of transports of other types of industries slow down the cargo volumes growth
in the area. Russian raw wood transports remain economically non-viable and wood is
imported through the Gulf of Bothnia ports to satisfy the needs of forest industry and
biofuels production.
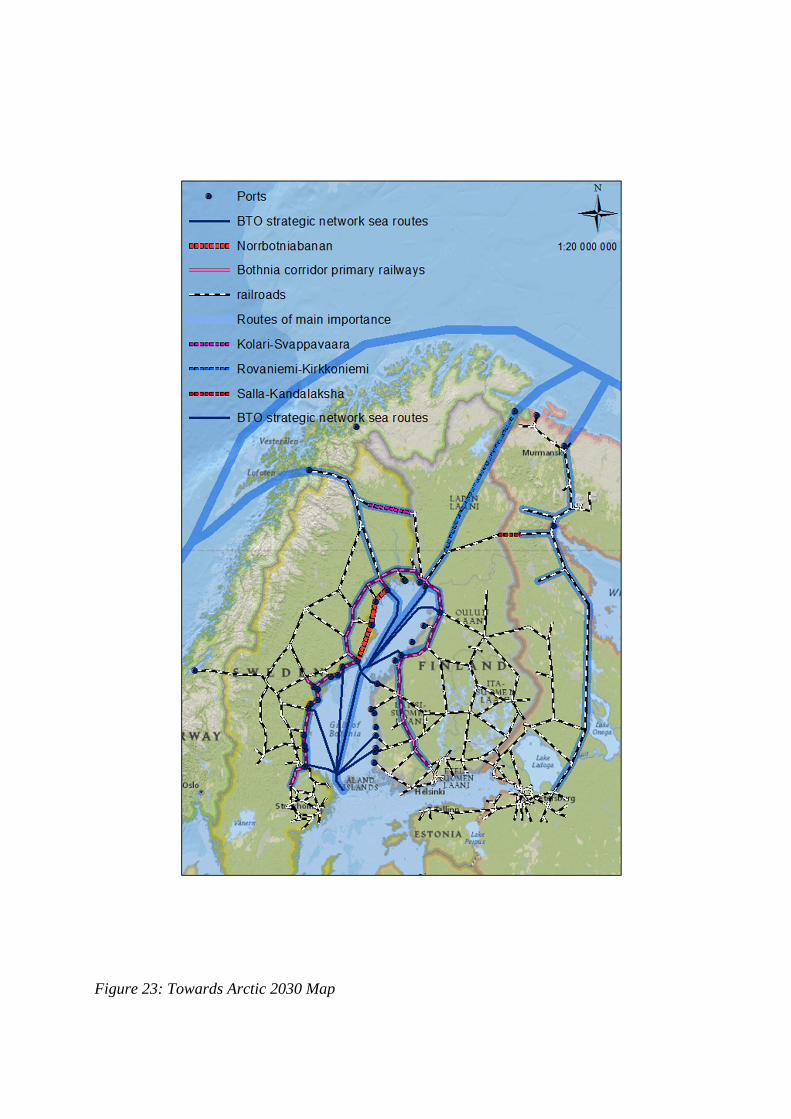
Figure 23: Towards Arctic 2030 Map
95
East-West Transit 2030
“The green corridors overcome the negative reasons to link through Lapland to
Murmansk. Access to the NSR to Asia would flow West through Sweden to Norway and to
North America and Europe… The cross Bothnia crossing would keep excess traffic out of
the Baltic Sea due to congestion and pollution concerns”
Main logic:
• North sea Route does not open for commercial traffic
• No new northern railroad projects –development of existing routes
• Mid Nordic corridor is an important international transport chain between Atlantic
and Asia
The North Sea Route has not opened for commercial traffic as the ice conditions are still
not predictable enough for commercial traffic. Demand of raw materials has settled for a
lower level in Asia and decreased the price pressure. Northern railroad projects have not
realized due to profitability issues and the uncertainty concerning the North Sea Route.
Some of the suggested mining projects have still been realized and there is North-South-
direction transport through the Gulf of Bothnia and coastal railroads.
Environmental damage for remote areas of natural state has also been considered too great
for new large railroad projects. A decision is made to develop existing connections instead
of building new ones. The Narvik railroad has been improved. Baltic Proper is severely
congested with oil and gas transport. The need of reliable trade connections between
Finland, Sweden, Norway, Russia and Asia makes the Mid Nordic corridor a good option.
East-west direction traffic in the Gulf of Bothnia increases greatly. MARPOL regulations
do not have considerable effect on shipping in the Gulf of Bothnia. Regular Mid Nordic
connections are operated by specialized fleet fulfilling the environmental regulations. Ice
conditions are not considerably easier in Gulf of Bothnia but high ice class of operating
ships makes the need of ice breakers rare.
This has required great investments in relevant infrastructure such as Mid-Scandinavian,
Russian and Finnish railroads, railway connections to Russia, handling of cargo in the
international borders and cargo handling facilities in relevant ports.
Mid-Nordic corridor offers employment and possibilities for the adjacent regions and
communities and improves their connectivity and development as well as economic
sustainability. It employs the under-used resources of the Mid-Bothnian ports.
Centralization of industries and port activities is a common trend so ports other than the
ones participating in mining products transport, large centralized forest industry transports
or international corridors have only marginal importance. Forestry raw materials are
needed to satisfy the needs of Biofuels, paper pulp and sawn wood industries and imports
are needed. The container ports in southern Gulf of Bothnia could benefit of the trend of
increasing container transports in the Baltic Sea.
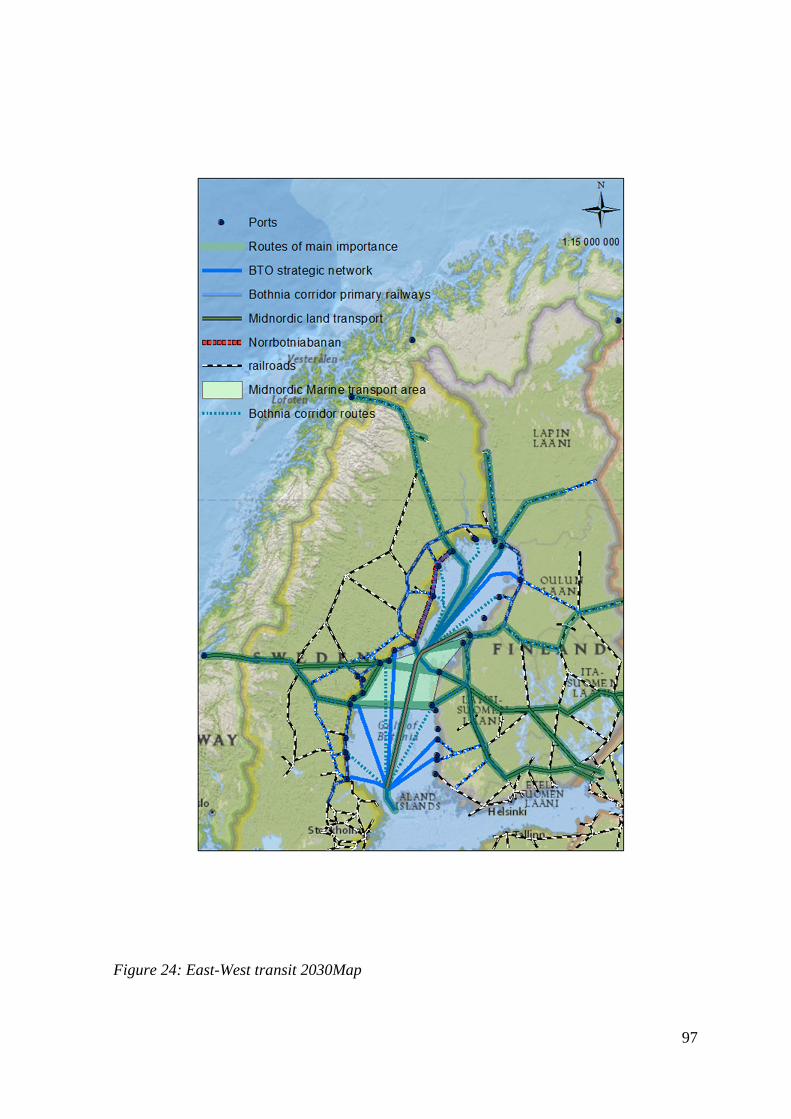
97
Figure 24: East-West transit 2030Map

99
7 DISCUSSION
In a Delphi study, statistical analysis of the results gives mainly support to the scenario
building phase, rather than reliable statistical facts. This is due to choosing a small amount
of panelists based on their areas of expertise in a very subjective manner. Despite the fact
that the panel was lacking some expert groups, as shown in table 14, some important
results were obtained from this study. The most important key factors seem to be ice
conditions, mining projects, raw materials prices and transit traffic, which were considered
both important and probable factors for future developments in the Gulf of Bothnia. The
questions and theses were however made so that probability-results do not include some
factors, such as SECA effects and raw wood transports. The reason for this is that these
factors were handled with direct questions rather than probability-significance assessment.
What could be noted is that it would be better to have all the factors assessed in similar
way: the probability and significance assessment should have been attached to the direct
questions.
The concluding question about importance of all key factors could therefore yield better
results concerning the main drivers for development. It should be kept in mind that some
respondents mentioned more than three “most important key factors” which makes the
results somewhat compromised. However, the results of “Most important key factors” and
the significance-results support each other well, which is why the results were considered
reliable enough to be used in scenario building. Northern mining projects and raw
materials prices would be the main drivers based on the results. Railroad projects were also
considered important and significant, but not that probable.
What is interesting is that forest industry transports such as raw wood imports only came
up in one comment and were not considered that important, although Forest industry
transports are the main commodity group currently transported in the Bothnian Sea. This is
most likely due to two reasons: Firstly: the panel was lacking input from local industries,
both mining and forestry. Secondly, mining activities have been discussed widely recently
and there are great future expectations for economic development driven by northern
mining projects. Also, if the thesis was formed differently to mention also paper and pulp
transports, the results could have looked somewhat different.
The SECA matter was handled with a simple question: Major effects on shipping or minor
effects on shipping. The results were almost even, six panelists considering that effects will
be minor and five voting for major effects. The comments for this thesis however offered
important information on the views of panelists. Major effects on shipping could be seen as
a possibility for several fields of industry offering technology to tackle the sulphur
emissions as well as railways. And even though the effects can be great on shipping,
impacts were considered to be rather short term and shipping could be expected to recover
by 2030. One respondent stated that the accumulated impact of MARPOL 73/78 can be
considered great but for example NECA alone does not have great effect on Maritime
Transport in the Gulf of Bothnia.
Ice conditions getting easier were considered an important factor for development and
significant for the Gulf of Bothnia. Some respondents however stated that there are less
factors (ocean currents etc.) to affect the ice conditions in the Gulf of Bothnia than in the
Barents sea or that even though ice conditions get easier, it might not have considerable
effect on transport in the Gulf of Bothnia. Opening of the North Sea Route was not
considered very important in the Gulf of Bothnia context. Panelists mentioned for example
that land transport and intermodal routes add costs and the Gulf of Bothnia route is not
reliable enough for extensive container transport.
The carbon liquefaction processes were considered the least probable factor in the Gulf of
Bothnia, most panelists assessing zero probability and zero significance. Also, the only
comment provided was “I do not know”, which suggests that this matter is not yet that
commonly known or discussed as a realistic option.
It is important to note that even though the scenarios are based on the comments and views
provided by the panelists, the spatial implications are mainly based on literature research.
When it comes to spatial implications of the key factors, not many results were obtained.
Some maps were presented to the panelists to serve as inspiration for spatial thinking but
not many comments handled the specific areas or ports of importance. This could have
been considered too detailed matter to be forecasted. The other possibility is that the panel
101
with 20 theses or questions was too heavy. The theses may have aimed to get too many
kinds of results which made answering the panel too complicated.
Also, in the end it is the industries deciding which transport option or route to use and their
input would have therefore been important for this panel. Speculation on potential
transport patterns can be made based on existing and planned railway and ports
infrastructure and depth of fairways leading to ports. More than one comments mentioned
the positive effects of transport corridors to the adjacent ports, cities and regions, so the
maps were largely drawn based on ports belonging to these corridors.
Railway connections were prioritized as an important factor for transport patterns due to
the trend of directing transports from road to rail and sea even though truck transports have
also great importance in the research area.
The question concerning the forecasted cargo volume scenarios from Part I of this study
did not give results that could be easily combined with the three scenarios formed in Part
II. The opinions about the magnitude of annual cargo volume in 2030 vary greatly (From
10% to over 60% growth) but no one of the panelists believed that the cargo volume in the
Gulf of Bothnia will decrease by 2030.
7.1 Implications for Planning
Considering that the maritime transport and shipping traffic from the Bothnian Bay can be
expected to grow, maritime spatial planning should prepare for a possibility that new
routing measures might become necessary to establish at some point. As mentioned earlier,
IMO restricts the measures taken for directing shipping traffic in offshore areas for the
ones that are already approved by IMO. These kinds of measures are for example Traffic
Separation Schemes, Deep Water Routes and Areas To Be Avoided. Based on the
scenarios it would be recommended to reserve space for a TSS or a deep sea route in the
main route between the North and the South Quark. The width of this kind of area could be
similar to the TSS areas in Gulf of Finland.
The question of Cross-Bothnian connections is interesting; how to consider the possibility
of increase in the East-West direction transport in planning. If there was future
developments of large scale cross-Bothnian transport, similar measures could be taken as
in South Åland sea circular TSS.
When it comes to areas to be avoided, such status could be given for the ecologically
important banks in the area, if considered necessary. There are current development plans
for wind power installations for large bank areas in Sweden, which would basically have
the same effect as shipping routes and wind power installations cannot exist in the same
area. The remaining banks, such as the ones off the coast of Höga Kusten in Sweden could
be considered as an area to be avoided for shipping if the transport routes over and around
it would gain considerable increase in traffic as in the case of “East-West 2030” scenario.
As the areas round the shipping zones in offshore Gulf of Bothnia would most likely be
classified as areas with no specially appointed activities or interests, establishing TSS or
other routing measures is not an issue and there is plenty of space for them. However, if
extensive offshore installations such as floating wind power parks or offshore aquaculture
would be built in the research area in future, situation could change. Therefore it is
necessary to consider the space requirements of routing measures in important shipping
areas. However, both the required space for shipping and building of offshore installations
is strongly dependent on future ice conditions in the Gulf of Bothnia. Ships need more
space when operating in ice and the routing measures do not function in harsh ice
conditions. Building of floating offshore installations is also to some level dependent on
the development of ice conditions.
As for now there is no need to point out areas where exactly these routing measures would
be established as this should be researched in detail if the matter becomes urgent. The map
presented below (Figure 24) offers an idea of the possible space requirements of this kind
of establishments rather than a suggestion of the exact position of each routing measure.
Non-binding priority areas for shipping could be established as recommendations, to
encourage the ships to navigate in certain areas. This kind of priority areas are however not
likely to be printed on navigational maps. If the information on the priority areas could be
offered as supplementary information with for example electronic chart systems, good
results could be obtained. There are projects aiming to enhance the route planning of ships,
for example Mona Lisa. Cooperation with this project and using the information they have
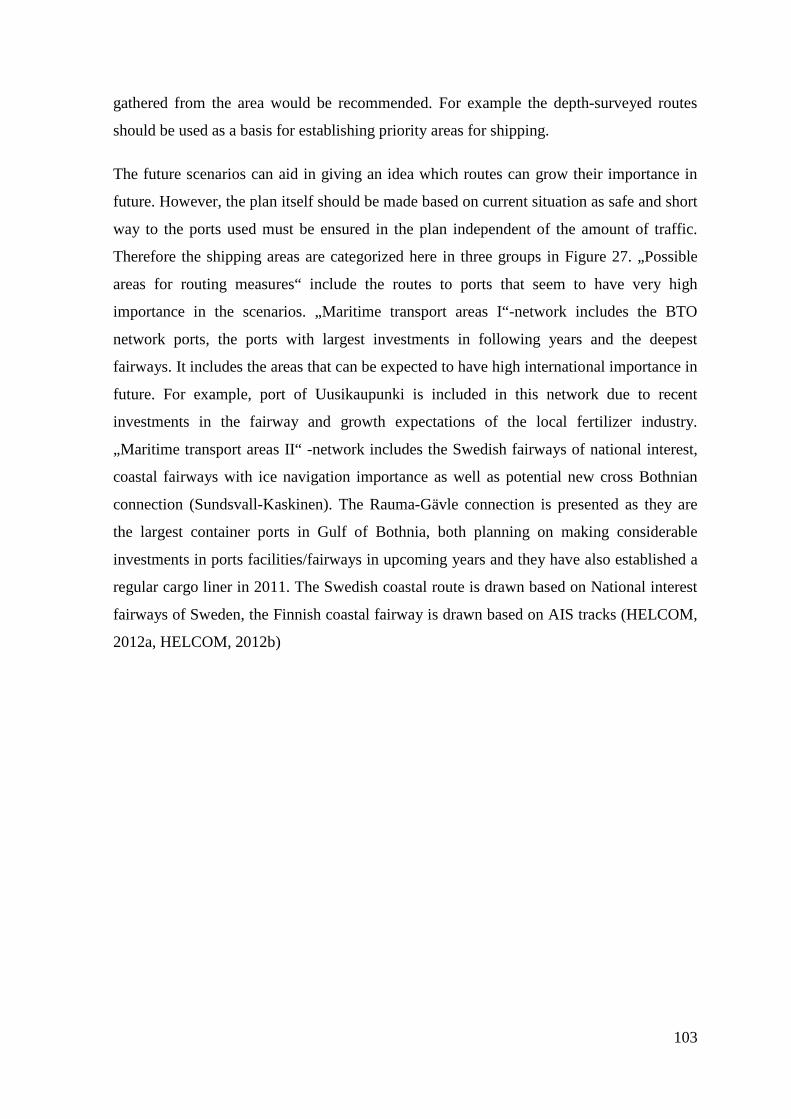
103
gathered from the area would be recommended. For example the depth-surveyed routes
should be used as a basis for establishing priority areas for shipping.
The future scenarios can aid in giving an idea which routes can grow their importance in
future. However, the plan itself should be made based on current situation as safe and short
way to the ports used must be ensured in the plan independent of the amount of traffic.
Therefore the shipping areas are categorized here in three groups in Figure 27. „Possible
areas for routing measures“ include the routes to ports that seem to have very high
importance in the scenarios. „Maritime transport areas I“-network includes the BTO
network ports, the ports with largest investments in following years and the deepest
fairways. It includes the areas that can be expected to have high international importance in
future. For example, port of Uusikaupunki is included in this network due to recent
investments in the fairway and growth expectations of the local fertilizer industry.
„Maritime transport areas II“ -network includes the Swedish fairways of national interest,
coastal fairways with ice navigation importance as well as potential new cross Bothnian
connection (Sundsvall-Kaskinen). The Rauma-Gävle connection is presented as they are
the largest container ports in Gulf of Bothnia, both planning on making considerable
investments in ports facilities/fairways in upcoming years and they have also established a
regular cargo liner in 2011. The Swedish coastal route is drawn based on National interest
fairways of Sweden, the Finnish coastal fairway is drawn based on AIS tracks (HELCOM,
2012a, HELCOM, 2012b)
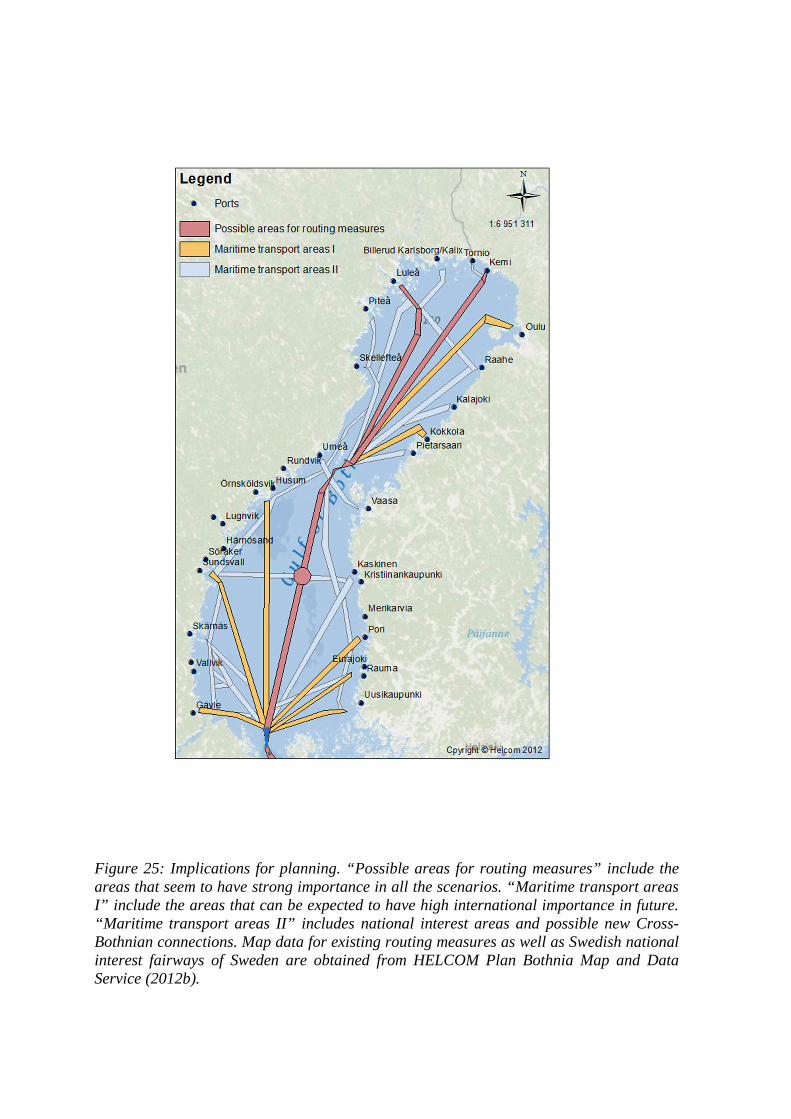
Figure 25: Implications for planning. “Possible areas for routing measures” include the areas that seem to have strong importance in all the scenarios. “Maritime transport areas I” include the areas that can be expected to have high international importance in future. “Maritime transport areas II” includes national interest areas and possible new Cross-Bothnian connections. Map data for existing routing measures as well as Swedish national interest fairways of Sweden are obtained from HELCOM Plan Bothnia Map and Data Service (2012b).
105
7.2 Recommendations and lessons learned
If this kind of research were to be repeated, better results could be obtained by making it
with several rounds. This idea is somewhat conflicting with the basic idea of RT Delphi,
making just one round during a short period of time. There are benefits in RT Delphi
method: the instant availability of results can make answering more interesting, offer new
ideas for the panelists and motivate to comment and provide their arguments. RT Delphi
can therefore be considered as one anonymous, internet based stakeholder meeting. It can
even be made as live event where all the panelists answer the questions simultaneously,
although a strictly set panel working time can make it even harder to engage participants
for the event.
The first round could contain just one type of question. All the factors identified by
literature review/pilot interviews could be presented as a list and ask the panelists to pick
three most important ones, just like in the conclusion-part of this panel. This would help
focusing the actual probability-significance assessment to the most relevant factors,
limiting the number of theses to the few most interesting ones and therefore increasing the
motivation to provide comments.
The spatial implications should be researched with a separate third round. Based on the
comments and probability-significance analysis obtained during the second round,
scenarios could be written as in this study, based on futures table analysis or possibly some
other futures research method. These scenarios could then be presented to the panelists and
ask them to draw main patterns or circle areas of importance on a map for each scenario.
This would make the maps a direct result of the panel work and therefore increase the
stakeholder participation in the marine spatial planning practices. The forecasted cargo
volume scenarios could also be presented here and ask the panelists to assess the probable
cargo volume growth for each scenario.
To discuss the five characteristics of MSP presented by Ehler: Integrated, future oriented
and adaptive, participatory, ecosystem based and area based, this type of method could
improve MSP in at least four of the mentioned areas, provided that the panelists are chosen
with careful consideration. Firstly, the panel should contain representatives from all
powerful sectors from the field of transport, both transport industry and industries
dependent on transports in the area. Different levels of governance should be represented
in the panel. This would ensure the integrated approach. Future-oriented, participatory and
area based approach is basically guaranteed with this type of methodology. This
methodology does not improve the ecosystem based approach to MSP in any considerable
way. Including the environmental and nature protection point of view is important for the
panel but the actual spatial implications are more difficult to combine here.
However, this type of futures research methodology can offer a considerable amount of
input for MSP projects. The maps obtained can be analyzed with existing spatial
information on ecosystem characteristics of the area to find out the areas of potential future
conflicts or areas where further management is needed in case the scenario realizes. In case
of the Gulf of Bothnia and the Baltic Sea in general, it is rather unlikely that brand new
shipping routes will be established but the amount of traffic could change in readily
established routes and these developments are in some cases important to take into
consideration in planning.
The methodology could be adapted to study future developments of other offshore marine
sectors, such as wind power or aquaculture. In best case all the sectors could be combined
to reach common visions for the area. Even though this panel combined several fields of
expertise and governmental levels, it is still sectorial in the sense that the focus is limited
on the development of transport and logistics and does not consider the other offshore
activities in the area.
7.3 Further research
The main value of this study was to serve as pilot project for using futures research
methodology for Maritime Spatial Planning purposes. During the process it was noticed
that there is both great challenges and great possibilities with this sort of research. Based
on the experiences gained from this project, more research are advisable to be made on
following topics:
107
• More testing of futures research methodology and the benefits for MSP projects,
especially concerning RT Delphi/traditional Delphi method providing stakeholder
input to the planning process.
• The transport plans of all the northern mining industries should be studied in depth
and considered as one entity to reach a conclusion on what would be the most
sensible targets for infrastructure investments and development, from both
economic and environmental point of view.
• Full summary should be made of regional and municipal development plans and
physical plans. It should be studied how these plans should be taken in account and
how to ensure compliance of all these development plans when making the
Maritime Spatial Plan for Bothnian Sea.
• Full review of Marine Spatial Planning initiatives to find out the basis for their
visions for maritime transport and how the methodology suggested in this paper
could benefit these initiatives.
The research project in general received attention and was considered interesting and
important based on discussions with panelists and people participating in the Plan Bothnia
project. This serves as an incentive to develop the idea and adjust the methodology further
to get maximum benefits for Maritime Spatial Planning initiatives.
References
Backer, H., (2011) Transboundary maritime spatial planning: a Baltic sea perspective. Journal of coastal conservation, 15, 279-289 BIM (2010) Baltic Sea Icebreaking Report 2009-2010. Baltic Icebreaking Management. Retrieved from: http://portal.fma.fi/sivu/www/baltice/BALTIC_ICEBREAKING_MANAGEMENT-_Joint_Annual__2009__2010_.pdf BMO (2006) Baltic Maritime Outlook 2006 – Goods flows and maritime infrastructure in the Baltic Sea Region. The Institute of Shipping Analysis; BMT Transport Solutions GmbH; Centre for Maritime Studies. Retrieved from: http://tentea.ec.europa.eu/download/MoS/2006_baltic_maritime_outlook.pdf BTO (2011a) Baltic Transport Outlook 2030, Report on main task 1: Strategic Network Methodology. Retrieved from: http://www.baltictransportoutlook.eu/index.php?main=about-rapporter.html BTO (2011b) Baltic Transport Outlook 2030, Report on main task 3: Scenarios. Retrieved from http://www.baltictransportoutlook.eu/index.php?main=about-rapporter.html Corneliussen, B., Allertsen, H. (2009) Report on Ishavsban: Kolari-Skibotten. 1/2009. Tromsö: Sweco. Retrieved from: http://www.tornedalen.org/files/1267454267_Jmerenrat-a-selvitys-2009.pdf Dahlbacka (2009) Sweden: Biofuels annual. SW9008. Stockholm: Global Agricultural Information Network. Retrieved from: http://gain.fas.usda.gov/Recent%20GAIN%20Publications/Biofuels%20Annual_Stockholm_Sweden_6-24-2009.pdf Douvere, F., Ehler, C.N. (2008) New perspective on sea use management: Initial findings from European experience with marine spatial planning. Journal of Environmental Management, 90, 77-88 EC Maritime affairs (2012) Marine Spatial Planning Retrieved from: http://ec.europa.eu/maritimeaffairs/policy/maritime_spatial_planning/index_en.htm EC Mobility and Transport (2011) TEN-T Transport Network. Retrieved from http://ec.europa.eu/transport/infrastructure/index_en.htm Ehler, C.N. (2011) Marine Spatial Planning in the arctic: A first step toward ecosystem-based management. In: The shared Future: a report of the Aspen Institute Commission on Arctic Climate change. pp. 40-90. Washington DC: The Aspen Institute. Retrieved from http://www.aspeninstitute.org/publications/shared-future-report-aspen-institute-commission-arctic-climate-change
109
Elverheim (2011, Feb 10) Fördjupning i Söråkers hamn fördubblar kapaciteten. Sundsvalls tidning http://st.nu/medelpad/soraker/1.2771434-fordjupning-i-sorakers-hamn-fordubblar-kapaciteten (Söråker) ENTEC (2010) Study To Review Assessments Undertaken Of The Revised MARPOL Annex VI Regulations. Final Report. London: Entec UK limited. Retrieved from http://www.marisec.org/ICS%20Paper%20MEPC%2061%20-%20Annex%20-%20MARPOL%20VI%20Final%20Report%20July%202010.pdf Fennovoima (2012) Pyhajoki. Retrieved from: http://www.fennovoima.fi/paikallissivut/pyhajoki Finnish Transport Agency (2011a) Liikenneolosuhteet 2035 (Conditions for transportation 2035) Background information report 19/2011. Helsinki: FTA. Finnish Transport Agency (2011b) Finland´s Winter Navigation 2011-2012. Helsinki: FTA. Retrieved from http://portal.liikennevirasto.fi/portal/page/portal/f/ammattiliikenteen_palvelut/talvimerenkulku/jaanmurtajat_kaikki_esitteet_2011_12_0.pdf Finnish Transport Agency (2011c) Proposed EU TEN-T project ‘MonaLisa’. Explanatory note. 15th BSHC Conference 21-23 September 2010 Gdynia, Poland Finnpilot (2011) Luotsausmaksut 2012. Retrieved from http://www.finnpilot.fi/www/ajankohtaista/tiedotteet/fi_FI/taksa/ FODD (2011) Fennoscandian Ore Deposit Database: Mines active in 2011, Large unexploited deposits in Fennoscandia Potentially large unexploited deposits in Fennoscandia. [Data file] Retrieved from: http://en.gtk.fi/ExplorationFinland/fodd/ Garrod, B (2003) Defining Marine Ecotourism: Delphi Study. In: Garrod, B., Wilson J.C. (Eds.) Marine ecotourism: Issues and experiences pp 17-36. Clevedon: Channel View Publications. Gordon, T., and Pease, A. (2006) RT Delphi, An Efficient, “Round-less” Almost Real Time Delphi Method. Technological forecasting and Social Change 73, 4, 321-333 Gustafsson, M., Särnholm, E., Stigson, P, Zetterberg, L., (2011) The IVL Scenario: Energy scenario for Sweden 2050. Stockholm: Swedish Environmental research institute. HELCOM (2012a) Helcom map and data service: Layer Maritime transport - AIS density (monthly average 2008) Retrieved from http://maps.helcom.fi/website/mapservice/index.html HELCOM (2012b) Helcom Plan Bothnia Map Service: Layers IMO routeing guide and Fairways of National Interest (SWE). Retrieved from: http://planbothnia.org/map-service/ HELCOM (2011a) Pilot risk assessments of alien species transfer on intra-Baltic ship voyages (2010-2011). Retrieved from: http://www.helcom.fi/projects/on_going/en_GB/alienspecies/ HELCOM (2011b) Helcom AIS database [Data file] Retrieved from: http://www.ais-helcom.eu/webstat/
HELCOM (2010) HELCOM report on illegal discharges observed during aerial surveillance 2010. Retrieved from http://www.helcom.fi/shipping/waste/en_GB/surveilance/ HELCOM Mariners Routeing guide (2009) Natural conditions. Retrieved from: http://www.helcom.dk/map/natural.htm HELCOM (2006) Manual for Marine Monitoring in the COMBINE Programme of HELCOM, Part A: Division of the Baltic and adjacent waters. Retrieved from: http://www.helcom.fi/groups/monas/CombineManual/PartA/en_GB/main/#Divisions Hill, M., Löf, P., Pettersson, T. (2008) Sveriges ekonomi. Scenarier på lång sikt. Bilaga 1 till Långtidsutredningen. Statens offentliga utredningar 2008:108. Retrieved from: http://www.regeringen.se/sb/d/10283/a/117347 Holma, E., Heikkilä, A., Helminen, R., Kajander, S (2011) Baltic Port List 2011: Annual cargo statistics of ports in the Baltic Sea Region. Centre for Maritime Studies, University of Turku Höjer, M. (2000) What’s the point of it? Backcasting Urban Transport and Land-Use Futures. Department of Infrastructure and Planning, Doctoral Dissertation. Stockholm: Royal Institute of Technology. Iggesund Holmen group (2011) Press release: Rail shipments improve service and help the environment. Retrieved from: http://www.iggesund.com/Main.aspx?ID=8e90f26d-b6d4-449f-8ef4-aa2a46c94227 Iikkanen, P., Sirkiä, A. (2011) Rataverkon raakapuun terminaali- ja kuormauspaikkaverkon kehittäminen. Liikenneviraston tutkimuksia ja selvityksiä 31/2011. Retrieved from: http://www2.liikennevirasto.fi/julkaisut/pdf3/lts_2011-31_rataverkon_raakapuun_web.pdf IMO (2009) Second IMO GHG study 2009. IMO, London Jalovaara, V.-M. (2011, Apr 4) Ydinjäte saa uutta kyytiä. Tekniikka ja Talous. http://www.tekniikkatalous.fi/energia/ydinjate+saa+uutta+kyytia/a603071 Kalli, J. and Tapaninen, U. (2008) Externalities of Shipping in the Gulf of Finland until 2015. A47. Turku: University of Turku, Centre of Maritime studies Kalli, J., Repka, S. & Karvonen, T. (2010) Baltic NECA – economic impacts. Turku: University of Turku, Centre for Maritime Studies. Karvonen, T. (2010) Investoinnit Suomen satamiin 2006-2015. Liikenneviraston tutkimuksia ja selvityksiä 36/2010. Helsinki: Liikennevirasto 27 pp. Retrieved from http://www2.liikennevirasto.fi/julkaisut/pdf3/lts_2010-36_investoinnit_suomen_web.pdf Mid-Lapland railroad (2011) Keski-Lapin poikittaisrata –Esiselvitys. Finland: KOKO & Tendon Oy. Retrieved from: http://www.tunturilappi.fi/sites/tunturilappi.fi/files/KeskiLapinPoikittaisrata20042011.pdf
111
Kuronen, J., Helminen, R., Lehikoinen, A., & Tapaninen, U. (2008) Maritime transportation in the Gulf of Finland in 2007 and in 2015. A 45. Turku: University of Turku, Centre for Maritime studies. Köjs (2011, Dec 31) Sandöleden ska bli ännu djupare. Norrbottens Kuriren http://www.kuriren.nu/nyheter/?articleid=6241267 Lahtinen, R., Hölttä, P., Kontinen, A., Niiranen, T., Nironen, M., Saalmann, K. & Sorjonen-Ward, P. (2011) Tectonic and metallogenic evolution of the Fennoscandian shield: key questions with emphasis on Finland. Geological Survey of Finland Special Paper, 49, 23–33 Law on Finnish Territorial Sea (1956) Laki Suomen aluevesien rajoista, article 1, 18.8. 1956/463. Retrieved from http://www.finlex.fi/fi/laki/ajantasa/1956/19560463 Lehto, H, Venäläinen, P, Hietala, K (2006). Suomen ja ulkomaiden välisen meriliikenteen kehitysnäkymät vuoteen 2030. Merenkulkulaitoksen julkaisuja 10/2006. Available at URL: http://www.fma.fi/media/julkaisusarjat/ML_ennuste_2030.pdf Linstone, A.H., Turoff, M. (1975) The Delphi Method: Techniques and Applications. Boston: Addison-Wesley. Hänninen, S., Rykönen, J. (2006) Transportation of liquid bulk chemicals by tankers in the Baltic Sea. Helsinki: VTT Publications. Retrieved from http://www.vtt.fi/publications/index.jsp) Liu, M., Kronbak, J. (2010) The potential economic viability of using the Northern Sea Route (NSR) as an alternative route between Asia and Europe. Journal of Transport Geography, 18, 434–444. doi:10.1016/j.jtrangeo.2009.08.004 Lohi, T. (2012) Arctic Railway: Rovaniemi – Kirkenes. In: Rouge-Oikarinen, R. & Rosqvist, H. (Eds.) Society and Socio-economic development. Rovaniemi: University of Lapland. (In Finnish: Näkökulmia alueen yhteiskunnalliseen ja sosioekonomiseen kehitykseen, Barents asiantuntijajulkaisu) Retrieved from: http://www.doria.fi/bitstream/handle/10024/74535/Barents-asiantuntijajulkaisu.pdf?sequence=1 Mason, K. J., Alamdarib, F., (2007) EU network carriers, low cost carriers and consumer behaviour: A Delphi study of future trends. Journal of Air Transport Management ,13, 299–310 Meriläinen, A, Mäenpää, M., Kunnas, J., Lundberg, A., Ramstedt, L., Quistgaard, K, Isberg, L., (2010) Transport potential and development needs in Bothnian Corridor transport network. Retrieved from: http://www.trafikverket.se/PageFiles/35243/bothnian_corridor_final_report_180610.pdf Ministry of Finances (2011) Europe 2020 –Strategy. Finlands National Programme Update, Autumn 2011. 38c/2011 Economic outlook and economic policy. Retrieved from: http://www.vm.fi/vm/en/04_publications_and_documents/01_publications/02_economic_surveys/20111027Europe/name.jsp Mylly, M (2010) EU:n kilpailualan säädösten vaikutus Suomen satamien hallintojärjestelmiin [presentation]. Incorporation of harbors -seminar 2.12.2010, Rauma, Finland
NECL II (2011) Mid-Nordic green transport corridor. Retrieved from http://www.midnordictc.net/ Nilsen (2011a, Nov 4) Huge nickel deposit discovered in Lapland. Barents Observer. Retrieved from: http://www.barentsobserver.com/huge-nickel-deposit-discovered-in-lapland.4980942.html Nilsen (2011b Feb 16) Yara: Mining in Lapland, enrichment on Kola. Barents observer. Retrieved from http://www.barentsobserver.com/yara-mining-in-lapland-enrichment-on-kola.4885926-16175.html Norden (2011) Megatrends. TemaNord 2011:527. Copenhagen: Nordic Council of Ministers. Retrieved from: www.norden.org/en/publications/publications/2011-527 Pöyry (2011) Metsäteollisuuden Investointinäkymät Suomessa. Selvitys Metsäteollisuudelle. Finland: Pöyry Management Consulting Oy. Rautajoki, T., Oikarinen, E., Somero, K., Väyrynen, K. (2003) Feasibility Study of the Salla-Kandalaksha Railway Line. JP Transplan . 51p. Regeringskansliet (2011a) Swedish national reform programme 2011. Europe 2020 – EU:s strategy for smart, sustainable and inclusive growth. Stockholm: Regeringskansliet. Retrieved from: http://ec.europa.eu/europe2020/pdf/nrp/nrp_sweden_en.pdf Regeringskansliet (2011b) 20 september 2011: Prognos för den svenska ekonomin och de offentliga finanserna. Stockholm: Regeringskansliet. Retrieved from: http://www.regeringen.se/sb/d/12335/a/175571 Regeringskansliet (2007) Hamnstrategi – strategiska hamnnoder i det svenska godstransportsystemet. Stockholm, Sweden: Regeringskansliet. Rubin A. (2004) Futures studies. Online learning materials (In Finnish: Tulevaisuudentutkimus tiedonalana. Retrieved from: http://www.tukkk.fi/tutu/topi/kokohakemistosivut/kokotiedonalana.htm 8.3.2012. Räddningsverket (2004) Oljeskadeskyddet utmed de svenska kusterna och i de stora insjöarna inför 2010. Sweden: Räddningsverket. 95pp. SCB (Statistiska Centralbyrån) (2011). Folkmängd i riket, län och kommuner 31 december 2010 och befolkningsförändringar 2010. [Data file]. Retrieved from http://www.scb.se/Pages/TableAndChart____308468.aspx Seppälä, Y (1984) 84 thousand futures (In Finnish: 84 tuhatta tulevaisuutta) Helsinki: Gaudeamus. 205pp. Sjöfartsverket (2011) Sjöfartens utveckling 2010. Sektorsrapport. Sweden: Sjöfartsverket. Retrieved from http://sjofartsverket.se/upload/Listade-dokument/Rapporter_Remisser/SV/2011/Sektorsrapport2011.pdf Sjöfartsverket (2009) Konsekvenser av IMO:s nya regler för svavelhalt i marint bränsle. 2009-05-14. 0601-08-03406
113
SKB (2012) Our current facilities. Retrieved from: http://www.skb.se/Templates/Standard____23781.aspx Skogsindustrierna (2011) Branschfakta. Retrieved from http://www.skogsindustrierna.org/web/Branschfakta.aspx Sundberg, P., Räsänen, O., Posti, A., Pöntynen, R. (2010) Sumen Transitoliikenne nyt ja tulevaisuudessa. SPC Finlandin transitoselvitys. (Finnish transit traffic now and in the future). B 180. Turku: University of Turku, Centre for Maritime Studies Stepanov, I.V. and Brubaker, D. (2005) Legal Implications for the Russian Northern Sea Route and Westward in the Barents Sea. FNI report 4/2005. Retrieved from http://www.fni.no/doc&pdf/FNI-R0405.pdf SVT (Suomen virallinen tilasto) (2011) Väestörakenne [Data file]. Helsinki: Tilastokeskus. Retrieved from: http://www.stat.fi/til/vaerak/. SYKE (2011) Perämeren öljyntorjunnan kehittämishanke (PÖK) Helsinki: SYKE. Retrieved from http://www.ymparisto.fi/default.asp?node=26340&lan=fi TEM (2011a) Mining Industry sector report 2011. Helsinki: Ministry of work and livelihoods (In Finnish: Toimialaraportti kaivosteollisuus). Retrieved from http://www.temtoimialapalvelu.fi/files/1349/kaivosteollisuus_2011_web.pdf TEM (2011b) Ydinenergia Suomessa (Nuclear energy in Finland) Retrieved from http://www.tem.fi/index.phtml?s=186 Trafikverket (2011a) Sjöfart. Retrieved from: http://www.trafikverket.se/Foretag/Planera-och-utreda/Samhallsplanering/Sjofart/ Trafikverket (2011b) Norrbotniabanan. Retrieved from: http://www.trafikverket.se/Privat/Projekt/Norrbotten/Norrbotniabanan/ Transbaltic (2010) Transbaltic Scenarios and foresight. no. 4665011_002 Retrieved from: http://www.transbaltic.eu/wp-content/uploads/2010/09/Transbaltic-scenarios-and-foresight-2030.pdf UNCLOS (1982) United Nations Convention on the Law of The Sea. article 231. (UNCLOS 1982) Vattenfall (2011) Forsmark. Retrieved from http://voimalaitokset.vattenfall.fi/powerplant/forsmark Venäläinen, P., Utriainen, M. (2009) Suomen merikuljetusten toimintaympäristön muutokset. 4/2009. Finland: Merenkulkulaitoksen julkaisuja Vierth, I, Mellin, A. (2010) Konsekvensanalyser av förändrade farleds och lotsavgifter. 13-2010. Sweden: VTI. Retrieved from http://www.vti.se/en/publications/pdf/impact-analyses-of-changed-fairway-dues-and-pilot-fees.pdf WTO (2011, Nov 16) News: WTO one big power bigger. The Voice of Russia. Retrieved from: http://www.wto.ru/en/news.asp?msg_id=28642
Interviews etc.: Viitala (2011) Reijo Viitala, Port administrator, Port of Kemi. [Phone interview] 11.11.2011. Myllylä (2011) Yrjö Myllylä, RD Aluekehitys, [e-mail communication] 20.11..2011 Kurzhunov, R (2011) concerning transit traffic and Mid-Nordic corridor. [E-mail communication] 11.11.2011. Fagerholm, K (2011) concerning railway investments in port of Kaskinen [E-mail communication] 2.11.2011 Hartikainen & Reilimo (2011). Traffic agency of Finland. Fairway planning. [E-mail communication]12.10.2011
Basemaps
ESRI National Geographic Basemap (2012) Retrieved from: http://www.arcgis.com/home/item.html?id=d94dcdbe78e141c2b2d3a91d5ca8b9c9
ESRI Ocean Basemap (2012) Retrieved from: http://www.arcgis.com/home/item.html?id=6348e67824504fc9a62976434bf0d8d5

115
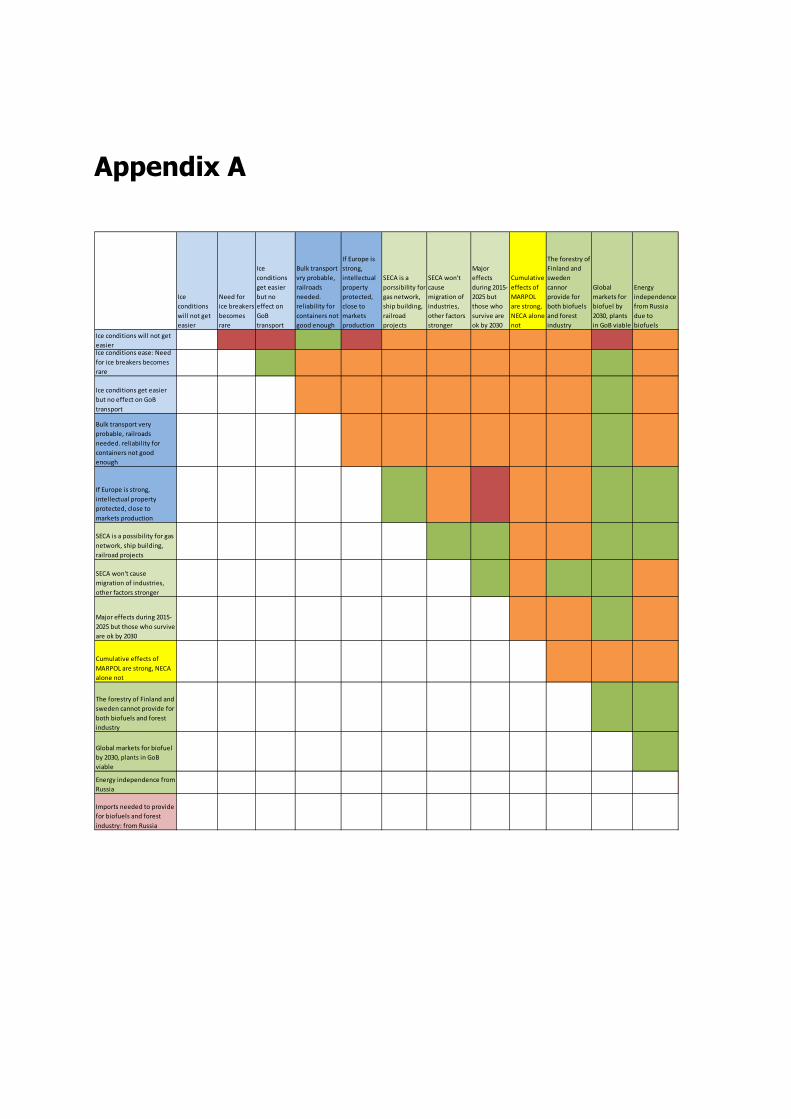
Appendix A
Ice
conditions
will not get
easier
Need for
ice breakers
becomes
rare
Ice
conditions
get easier
but no
effect on
GoB
transport
Bulk transport
vry probable,
railroads
needed.
reliability for
containers not
good enough
If Europe is
strong,
intellectual
property
protected,
close to
markets
production
SECA is a
porssibility for
gas network,
ship building,
railroad
projects
SECA won't
cause
migration of
industries,
other factors
stronger
Major
effects
during 2015-
2025 but
those who
survive are
ok by 2030
Cumulative
effects of
MARPOL
are strong,
NECA alone
not
The forestry of
Finland and
sweden
cannor
provide for
both biofuels
and forest
industry
Global
markets for
biofuel by
2030, plants
in GoB viable
Energy
independence
from Russia
due to
biofuels
Ice conditions will not get
easierIce conditions ease: Need
for ice breakers becomes
rare
Ice conditions get easier
but no effect on GoB
transport
Bulk transport very
probable, railroads
needed. reliability for
containers not good
enough
If Europe is strong,
intellectual property
protected, close to
markets production
SECA is a possibility for gas
network, ship building,
railroad projects
SECA won't cause
migration of industries,
other factors stronger
Major effects during 2015-
2025 but those who survive
are ok by 2030
Cumulative effects of
MARPOL are strong, NECA
alone not
The forestry of Finland and
sweden cannot provide for
both biofuels and forest
industry
Global markets for biofuel
by 2030, plants in GoB
viable
Energy independence from
Russia
Imports needed to provide
for biofuels and forest
industry: from Russia
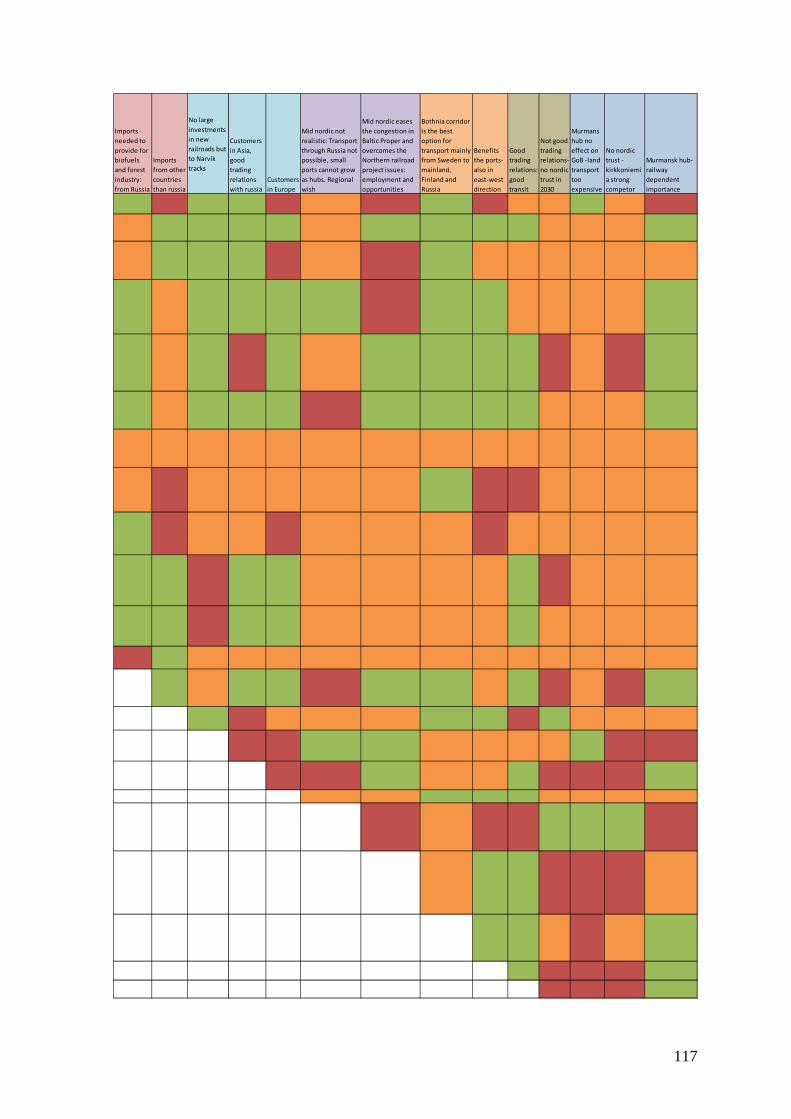
117
Imports
needed to
provide for
biofuels
and forest
industry:
from Russia
Imports
from other
countries
than russia
No large
investments
in new
railroads but
to Narvik
tracks
Customers
in Asia,
good
trading
relations
with russia
Customers
in Europe
Mid nordic not
realistic: Transport
through Russia not
possible, small
ports cannot grow
as hubs. Regional
wish
Mid nordic eases
the congestion in
Baltic Proper and
overcomes the
Northern railroad
project issues:
employment and
opportunities
Bothnia corridor
is the best
option for
transport mainly
from Sweden to
mainland,
Finland and
Russia
Benefits
the ports-
also in
east-west
direction
Good
trading
relations:
good
transit
Not good
trading
relations-
no nordic
trust in
2030
Murmans
hub no
effect on
GoB -land
transport
too
expensive
No nordic
trust -
kirkkoniemi
a strong
competor
Murmansk hub-
railway
dependent
importance
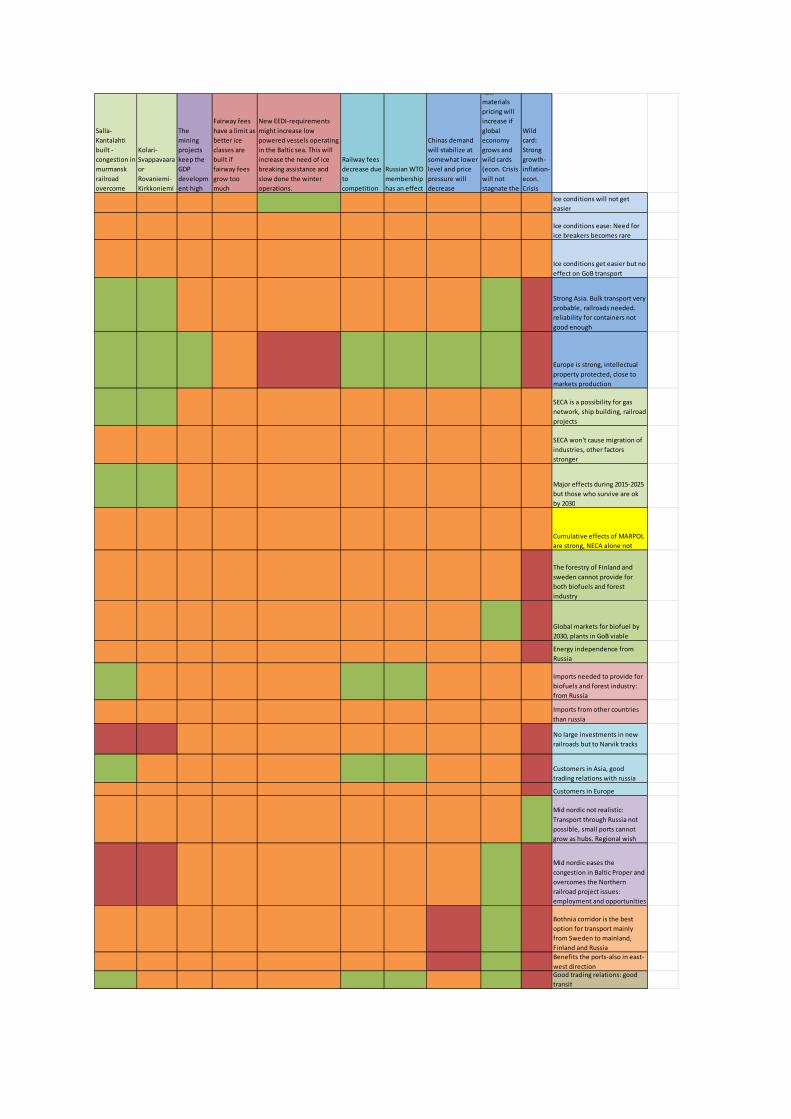
Salla-
Kantalahti
built -
congestion in
murmansk
railroad
overcome
Kolari-
Svappavaara
or
Rovaniemi-
Kirkkoniemi
The
mining
projects
keep the
GDP
developm
ent high
Fairway fees
have a limit as
better ice
classes are
built if
fairway fees
grow too
much
New EEDI-requirements
might increase low
powered vessels operating
in the Baltic sea. This will
increase the need of ice
breaking assistance and
slow done the winter
operations.
Railway fees
decrease due
to
competition
Russian WTO
membership
has an effect
Chinas demand
will stabilize at
somewhat lower
level and price
pressure will
decrease
Raw
materials
pricing will
increase if
global
economy
grows and
wild cards
(econ. Crisis
will not
stagnate the
Wild
card:
Strong
growth-
inflation-
econ.
Crisis
Ice conditions will not get
easier
Ice conditions ease: Need for
ice breakers becomes rare
Ice conditions get easier but no
effect on GoB transport
Strong Asia. Bulk transport very
probable, railroads needed.
reliability for containers not
good enough
Europe is strong, intellectual
property protected, close to
markets production
SECA is a possibility for gas
network, ship building, railroad
projects
SECA won't cause migration of
industries, other factors
stronger
Major effects during 2015-2025
but those who survive are ok
by 2030
Cumulative effects of MARPOL
are strong, NECA alone not
The forestry of Finland and
sweden cannot provide for
both biofuels and forest
industry
Global markets for biofuel by
2030, plants in GoB viable
Energy independence from
Russia
Imports needed to provide for
biofuels and forest industry:
from Russia
Imports from other countries
than russia
No large investments in new
railroads but to Narvik tracks
Customers in Asia, good
trading relations with russia
Customers in Europe
Mid nordic not realistic:
Transport through Russia not
possible, small ports cannot
grow as hubs. Regional wish
Mid nordic eases the
congestion in Baltic Proper and
overcomes the Northern
railroad project issues:
employment and opportunities
Bothnia corridor is the best
option for transport mainly
from Sweden to mainland,
Finland and Russia
Benefits the ports-also in east-
west directionGood trading relations: good
transit
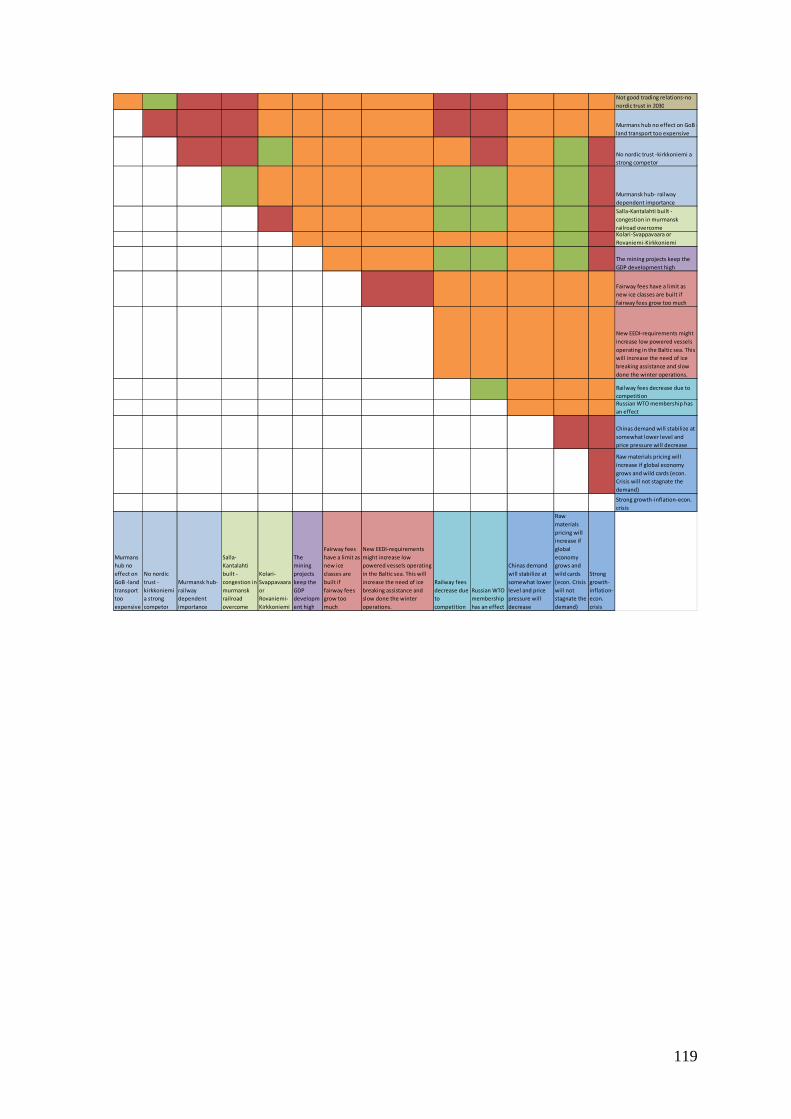
119
Not good trading relations-no
nordic trust in 2030
Murmans hub no effect on GoB -
land transport too expensive
No nordic trust -kirkkoniemi a
strong competor
Murmansk hub- railway
dependent importance
Salla-Kantalahti built -
congestion in murmansk
railroad overcomeKolari-Svappavaara or
Rovaniemi-Kirkkoniemi
The mining projects keep the
GDP development high
Fairway fees have a limit as
new ice classes are built if
fairway fees grow too much
New EEDI-requirements might
increase low powered vessels
operating in the Baltic sea. This
will increase the need of ice
breaking assistance and slow
done the winter operations.
Railway fees decrease due to
competition
Russian WTO membership has
an effect
Chinas demand will stabilize at
somewhat lower level and
price pressure will decrease
Raw materials pricing will
increase if global economy
grows and wild cards (econ.
Crisis will not stagnate the
demand)
Strong growth-inflation-econ.
crisis
Murmans
hub no
effect on
GoB -land
transport
too
expensive
No nordic
trust -
kirkkoniemi
a strong
competor
Murmansk hub-
railway
dependent
importance
Salla-
Kantalahti
built -
congestion in
murmansk
railroad
overcome
Kolari-
Svappavaara
or
Rovaniemi-
Kirkkoniemi
The
mining
projects
keep the
GDP
developm
ent high
Fairway fees
have a limit as
new ice
classes are
built if
fairway fees
grow too
much
New EEDI-requirements
might increase low
powered vessels operating
in the Baltic sea. This will
increase the need of ice
breaking assistance and
slow done the winter
operations.
Railway fees
decrease due
to
competition
Russian WTO
membership
has an effect
Chinas demand
will stabilize at
somewhat lower
level and price
pressure will
decrease
Raw
materials
pricing will
increase if
global
economy
grows and
wild cards
(econ. Crisis
will not
stagnate the
demand)
Strong
growth-
inflation-
econ.
crisis
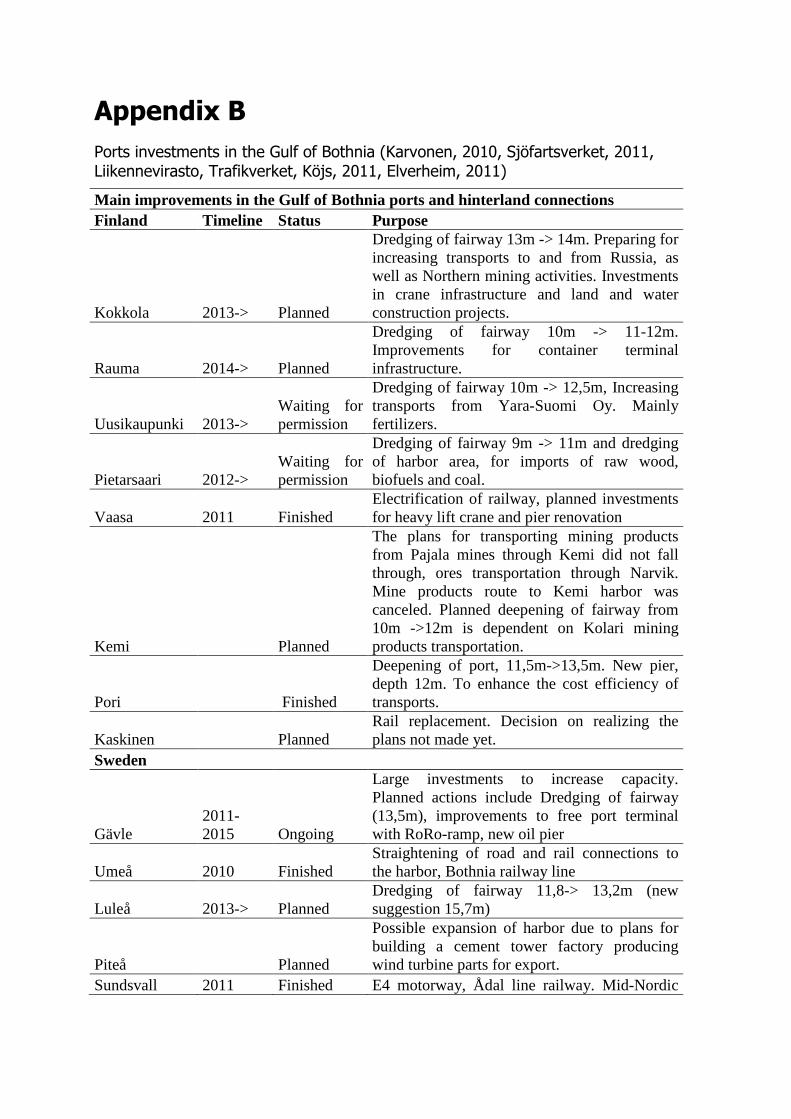
Appendix B
Ports investments in the Gulf of Bothnia (Karvonen, 2010, Sjöfartsverket, 2011, Liikennevirasto, Trafikverket, Köjs, 2011, Elverheim, 2011)
Main improvements in the Gulf of Bothnia ports and hinterland connections Finland Timeline Status Purpose
Kokkola 2013-> Planned
Dredging of fairway 13m -> 14m. Preparing for increasing transports to and from Russia, as well as Northern mining activities. Investments in crane infrastructure and land and water construction projects.
Rauma 2014-> Planned
Dredging of fairway 10m -> 11-12m. Improvements for container terminal infrastructure.
Uusikaupunki 2013-> Waiting for permission
Dredging of fairway 10m -> 12,5m, Increasing transports from Yara-Suomi Oy. Mainly fertilizers.
Pietarsaari 2012-> Waiting for permission
Dredging of fairway 9m -> 11m and dredging of harbor area, for imports of raw wood, biofuels and coal.
Vaasa 2011 Finished Electrification of railway, planned investments for heavy lift crane and pier renovation
Kemi Planned
The plans for transporting mining products from Pajala mines through Kemi did not fall through, ores transportation through Narvik. Mine products route to Kemi harbor was canceled. Planned deepening of fairway from 10m ->12m is dependent on Kolari mining products transportation.
Pori Finished
Deepening of port, 11,5m->13,5m. New pier, depth 12m. To enhance the cost efficiency of transports.
Kaskinen Planned Rail replacement. Decision on realizing the plans not made yet.
Sweden
Gävle 2011-2015 Ongoing
Large investments to increase capacity. Planned actions include Dredging of fairway (13,5m), improvements to free port terminal with RoRo-ramp, new oil pier
Umeå 2010 Finished Straightening of road and rail connections to the harbor, Bothnia railway line
Luleå 2013-> Planned Dredging of fairway 11,8-> 13,2m (new suggestion 15,7m)
Piteå Planned
Possible expansion of harbor due to plans for building a cement tower factory producing wind turbine parts for export.
Sundsvall 2011 Finished E4 motorway, Ådal line railway. Mid-Nordic
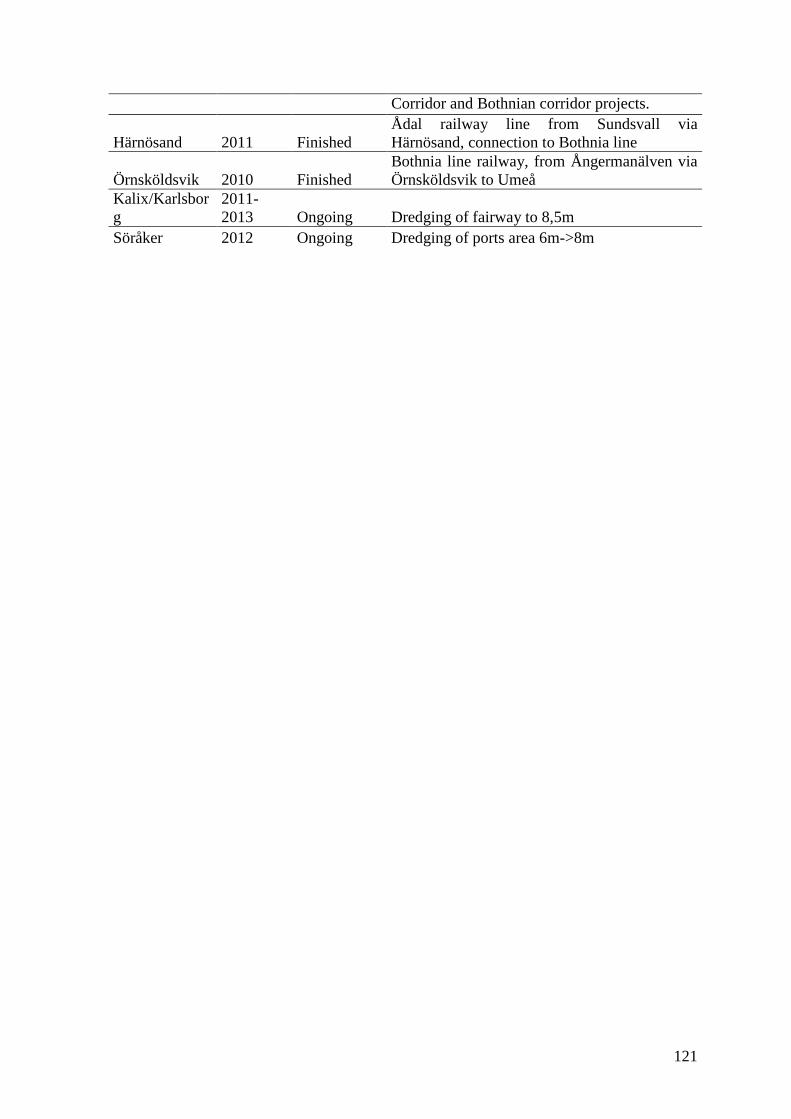
121
Corridor and Bothnian corridor projects.
Härnösand 2011 Finished Ådal railway line from Sundsvall via Härnösand, connection to Bothnia line
Örnsköldsvik 2010 Finished Bothnia line railway, from Ångermanälven via Örnsköldsvik to Umeå
Kalix/Karlsborg
2011-2013 Ongoing Dredging of fairway to 8,5m
Söråker 2012 Ongoing Dredging of ports area 6m->8m
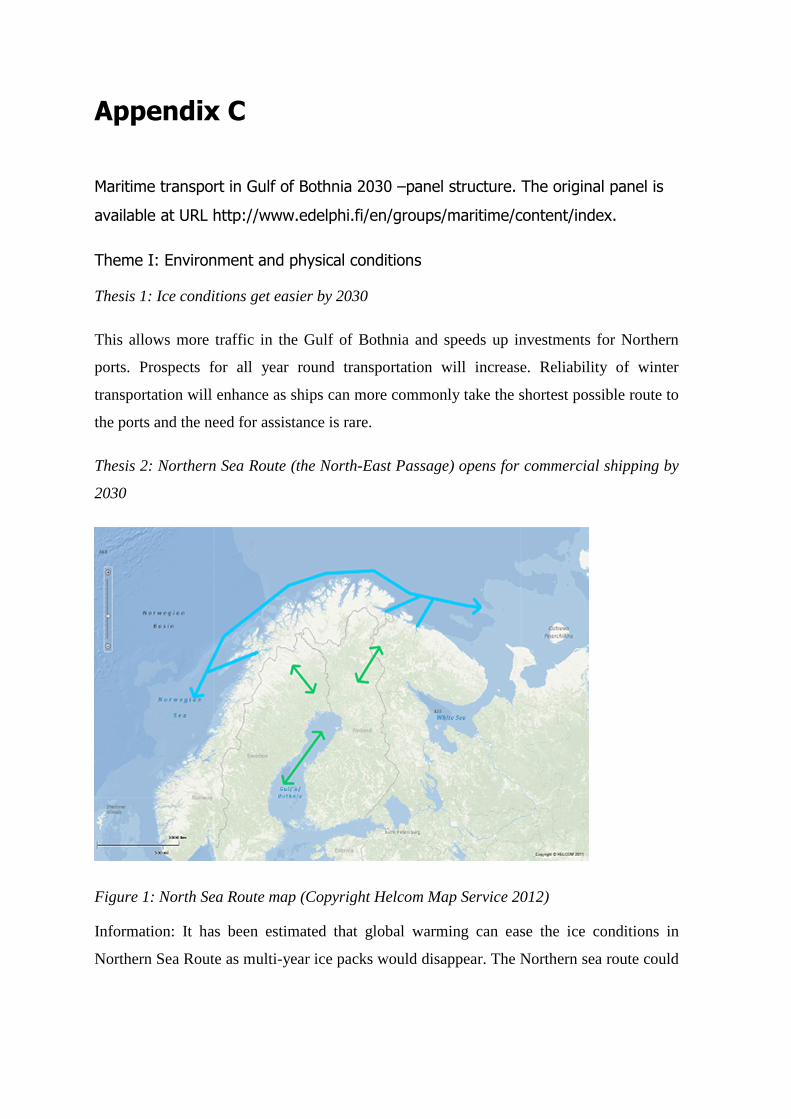
Appendix C
Maritime transport in Gulf of Bothnia 2030 –panel structure. The original panel is
available at URL http://www.edelphi.fi/en/groups/maritime/content/index.
Theme I: Environment and physical conditions
Thesis 1: Ice conditions get easier by 2030
This allows more traffic in the Gulf of Bothnia and speeds up investments for Northern
ports. Prospects for all year round transportation will increase. Reliability of winter
transportation will enhance as ships can more commonly take the shortest possible route to
the ports and the need for assistance is rare.
Thesis 2: Northern Sea Route (the North-East Passage) opens for commercial shipping by
2030
Figure 1: North Sea Route map (Copyright Helcom Map Service 2012)
Information: It has been estimated that global warming can ease the ice conditions in
Northern Sea Route as multi-year ice packs would disappear. The Northern sea route could
123
shorten the navigation time for example from Rotterdam to Yokohama with as much as 10
days (Liu & Kronbak 2010).
Goods flow through the Baltic Sea Region to and from the Barents Sea and the Norwegian
Sea ports and back. The increase is greatest for containerized goods but also Northern
Mining products and other bulk goods will be transported from ports of the Barents Sea.
The Baltic Sea Region is a strong gateway for global transports. Investments are made for
Gulf of Bothnia ports and transport corridors to enhance the North-South connection from
the Southern Baltic to the Barents Sea.
Thesis 3: Sulphur Emission Control area (SECA)
Information: the Baltic Sea is designated as a Sulphur Emission Control Area (SECA). The
sulphur content of fuel that is used in the Baltic Sea was reduced in 2010 from 1,5% to 1%.
EU has set an additional requirement; 0,1% fuel must be used when operating in harbor
area. In 2015 all fuel used by ships in the Baltic Sea area should not contain more than
0,1% sulphur. Alternatively, SOx scrubbers resulting in same SOx abatement may be used
(Kalli & Tapaninen, 2008).
Choose the option closer to your views
a: Minor effect on shipping by 2030
Sulphur emissions control area (SECA) for the Baltic Sea and the North Sea will have a
minor long-term effect on industries and maritime transport due to subsidization
instruments for transportation modes using environmentally sound technology. The
negative effects are short term and the transport sector will recover by 2030. Designation
of North Sea as SECA area has a positive effect.
b: Major effect on shipping by 2030
SECA will have a major effect on shipping in Gulf of Bothnia. Industries that are highly
dependent on transports will increasingly relocate their production units as they seek
production areas with more economically viable transport options or shift their transports
to roads and railways. The effects are greatest in the Northern Gulf of Bothnia as the
transport distances are the longest.
Thesis 4: Nitrogen Emissions Control Area (NECA) will not decrease shipping by 2030
Information: Designation of the Baltic Sea as Nitrogen Emission Control Area (NECA), to
reduce air-emitted nitrogen that adds to the eutrophication problems of the Baltic Sea is
mentioned in HELCOM Baltic Sea Action Plan . If the Baltic Sea will become a NECA,
newly built ships operating in the Baltic Sea area must install a system to tackle nitrogen
emissions from 2016 onwards. The only viable method at the moment is a SCR exhaust
gas after treatment device, which would reduce the nitrogen load from ships more than
80% (Kalli, Repka & Karvonen, 2010).
Nitrogen Emissions Control Area (NECA) will not have a significant effect on industries
and maritime transport in the Gulf of Bothnia since the investments in technology are not
as great as for SECA. The costs are gradual since technology must be applied for new
ships only.
THEME 2: Innovations and industries
Thesis 5: New forestry products, such as biofuels increase their production greatly by 2030
New facilities are built in Finland and Sweden alike. Government's renewable energy
strategy goal is fulfilled in Sweden: All cars run on biofuels by 2030. Great growth in
biofuel production is experienced especially in the North where raw materials from forest
industries are easily available. Traditional forest industries will experience growing
competition over raw materials and this can have effects on maritime transportation in
ports that are concentrated on forest industry cargo only.
Thesis 6: By 2030, imports of raw wood to Finland and Sweden are likely to..
A) Increase
B) Decrease
C) Stay on same level as for now
Thesis 7: Northern mining products transport will increase greatly by 2030.
The products will be mainly transported through
A) the Gulf of Bothnia
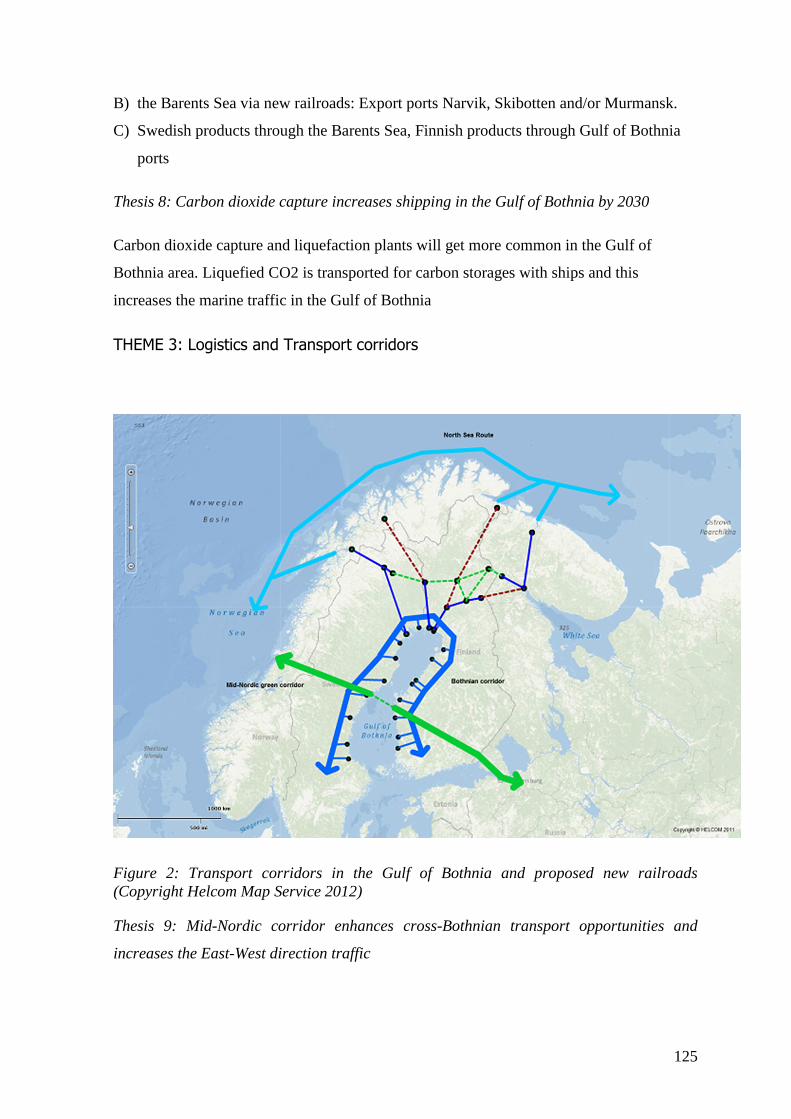
125
B) the Barents Sea via new railroads: Export ports Narvik, Skibotten and/or Murmansk.
C) Swedish products through the Barents Sea, Finnish products through Gulf of Bothnia
ports
Thesis 8: Carbon dioxide capture increases shipping in the Gulf of Bothnia by 2030
Carbon dioxide capture and liquefaction plants will get more common in the Gulf of
Bothnia area. Liquefied CO2 is transported for carbon storages with ships and this
increases the marine traffic in the Gulf of Bothnia
THEME 3: Logistics and Transport corridors
Figure 2: Transport corridors in the Gulf of Bothnia and proposed new railroads (Copyright Helcom Map Service 2012)
Thesis 9: Mid-Nordic corridor enhances cross-Bothnian transport opportunities and
increases the East-West direction traffic
The Gulf of Bothnia is a strong link for transit transports in East-West direction.
Transports will flow from Norwegian North Sea ports through Sweden and Finland to
Russia and Asia and vice versa.
Thesis 10: Bothnian corridor enhances the North-South connections on both sides of the
Gulf of Bothnia and increases intermodal transports in the ports
Intermodal transport chains will be effective and transports will generally grow in the Gulf
of Bothnia due to the Bothnian Corridor.
Thesis 11: Transit traffic increases the traffic in the Gulf of Bothnia by 2030
Transit traffic will continue to be economically viable in the Gulf of Bothnia. New ports
could benefit from transit traffic as intermodal transport chains develop, new railroad
connections are built and the border controls will get more effective. Russia becoming a
member of World Trade Organization has a boosting effect on transit traffic.
Thesis 12: Murmansk Port effect increases the traffic in Gulf of Bothnia by 2030
Murmansk is a large Northern hub port and the Gulf of Bothnia is a strong hinterland
connection for increasing North-South direction transports.
Thesis 13: Transport will centralize in fewer large ports in the Gulf of Bothnia by 2030
This is mainly due to centralization of industries. Smaller ports, especially those without
infrastructure for intermodal transports will have only marginal use.
Thesis 14: New railroad connections are built to Northern Finland and Sweden
One or more of the following railroad connections is built as the congestion on the railroad
to Narvik demands more transport routes to the Barents Sea:
A) Kolari-Skibotten
B) Rovaniemi-Kirkenes
C) Salla-Kandalaksha
D) Cross-Lapland railroad/Sokli railroad or smaller parts of it
127
THEME 4: Economics
Thesis 15: Annual growth of GDP by 2030 will be closest to an average of..
Maritime transport scenario made by Finnish Transport Agency (Finnish Maritime Agency
at the time) in 2006 predicted an average annual growth of 1,6% for Finland, as slow
growth scenario. A Swedish long-term scenario has predicted an average annual growth of
2,2% for Sweden. The Baltic Maritime Outlook scenarios in 2006 used an annual average
growth of 2,6% for Finland and 2,4% for Sweden. However the latest predictions for
coming few years have been more careful. Annual growth of GDP by 2030 will be closest
to an average of:
A) 1,5% or less in Finland and Sweden
B) 1,6% in Finland, 1,8% in Sweden
C) 1,9% in Finland, 2,2% in Sweden
D) 2,4% or more in Finland and Sweden
Thesis 16: Fairway fees in Finland and Sweden will grow substantially by 2030
This will have a decreasing effect on marine transport in the Gulf of Bothnia. Incentives
for ships using environmentally sound technology will offer only small ease for shipping
companies.
Thesis 17: Railway fees will increase significantly by 2030
Railway fees will grow due to magnitude of new investments in the railroad network.
Thesis 18: Raw materials prices will increase greatly by 2030
This is mainly due to competition over limited resources and future speculation of raw
materials markets. This will have an increasing effect on maritime transport in the Gulf of
Bothnia as economic viability of exploitation of raw material resources in the area will
enhance.
THEME 5: Conclusion on key factors and cargo volume
Three most important key factors
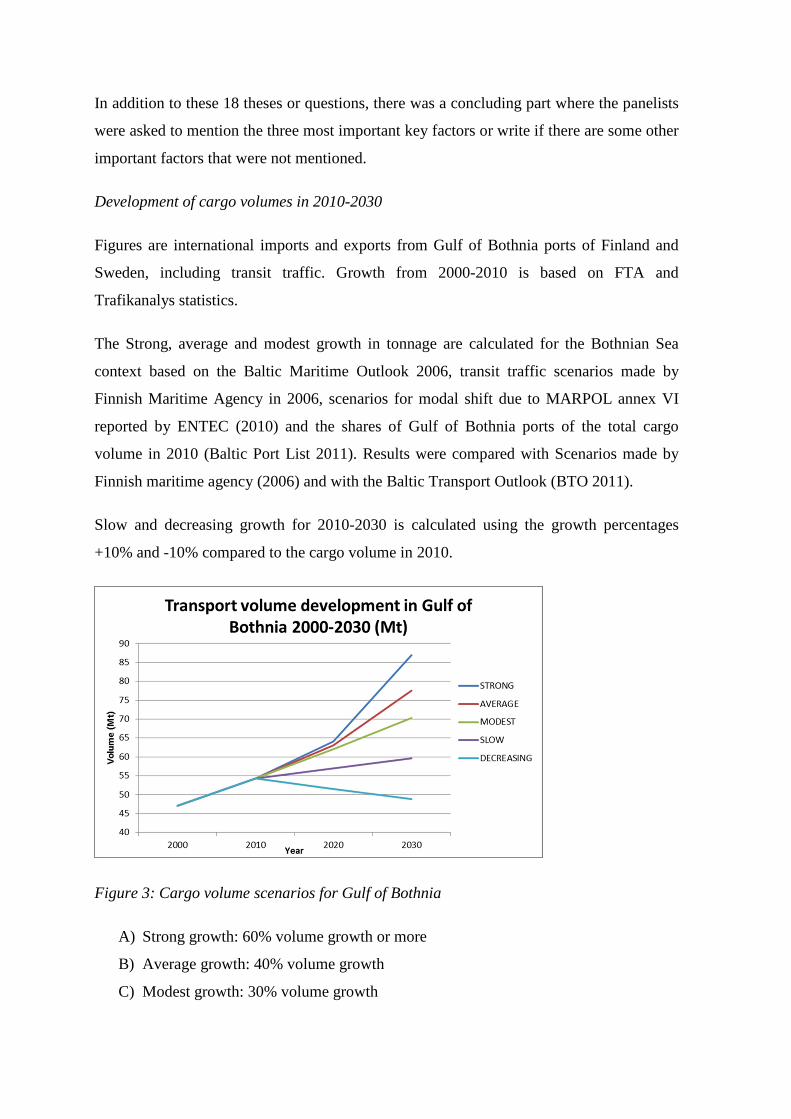
In addition to these 18 theses or questions, there was a concluding part where the panelists
were asked to mention the three most important key factors or write if there are some other
important factors that were not mentioned.
Development of cargo volumes in 2010-2030
Figures are international imports and exports from Gulf of Bothnia ports of Finland and
Sweden, including transit traffic. Growth from 2000-2010 is based on FTA and
Trafikanalys statistics.
The Strong, average and modest growth in tonnage are calculated for the Bothnian Sea
context based on the Baltic Maritime Outlook 2006, transit traffic scenarios made by
Finnish Maritime Agency in 2006, scenarios for modal shift due to MARPOL annex VI
reported by ENTEC (2010) and the shares of Gulf of Bothnia ports of the total cargo
volume in 2010 (Baltic Port List 2011). Results were compared with Scenarios made by
Finnish maritime agency (2006) and with the Baltic Transport Outlook (BTO 2011).
Slow and decreasing growth for 2010-2030 is calculated using the growth percentages
+10% and -10% compared to the cargo volume in 2010.
Figure 3: Cargo volume scenarios for Gulf of Bothnia
A) Strong growth: 60% volume growth or more
B) Average growth: 40% volume growth
C) Modest growth: 30% volume growth
129
D) Slow growth: 10% volume growth
E) Decreasing: -10% cargo volume.