Embed Size (px)
Citation preview
Maritime Transportation and Inland Freight Distribution: The Challenge of the Coast
Dr. Jean-Paul RodrigueDept. of Economics & GeographyHofstra UniversityHempstead, NY
http://people.hofstra.edu/faculty/jean-paul_rodrigue/
Outline
■ 1. Dislocation of Commercial Flows■ 2. Coping with Economies of Scale■ 3. Transforming Hinterlands■ 4. Conclusion: The Challenge of the Coast
1. Dislocation of Trade Flows
■ Differential growth• New origins and different growth rates for freight.
■ The kindness of strangers• Imbalanced trade and balance of payments.
■ What comes in does not come out• Imbalanced freight flows.
■ Going with the flow• A new reality for ports.
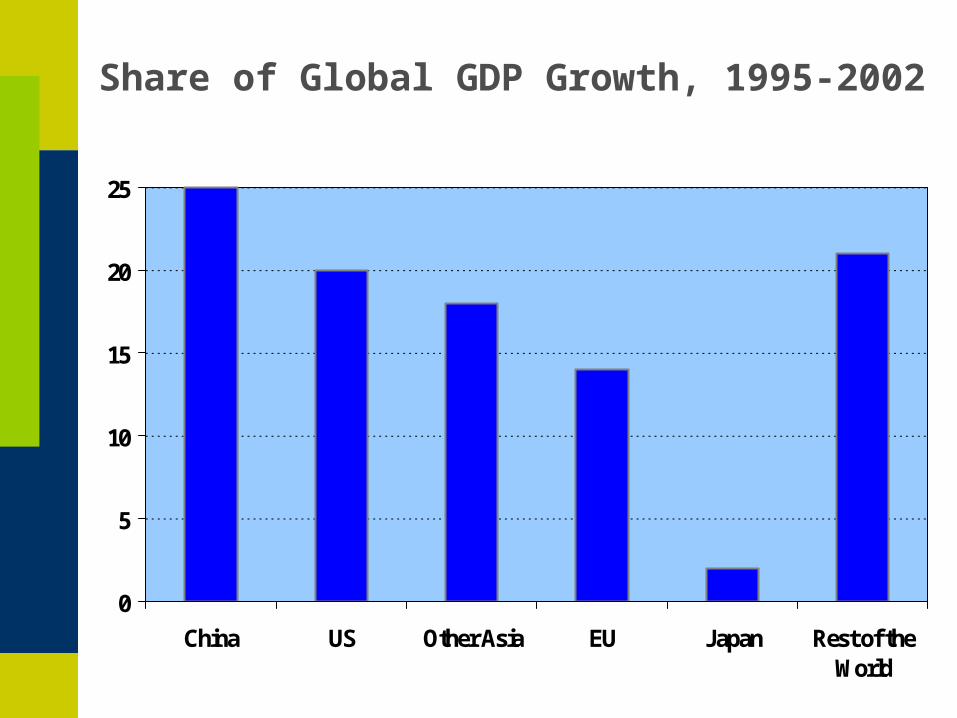
Share of Global GDP Growth, 1995-2002
0
5
10
15
20
25
China US Other Asia EU Japan Rest of theWorld
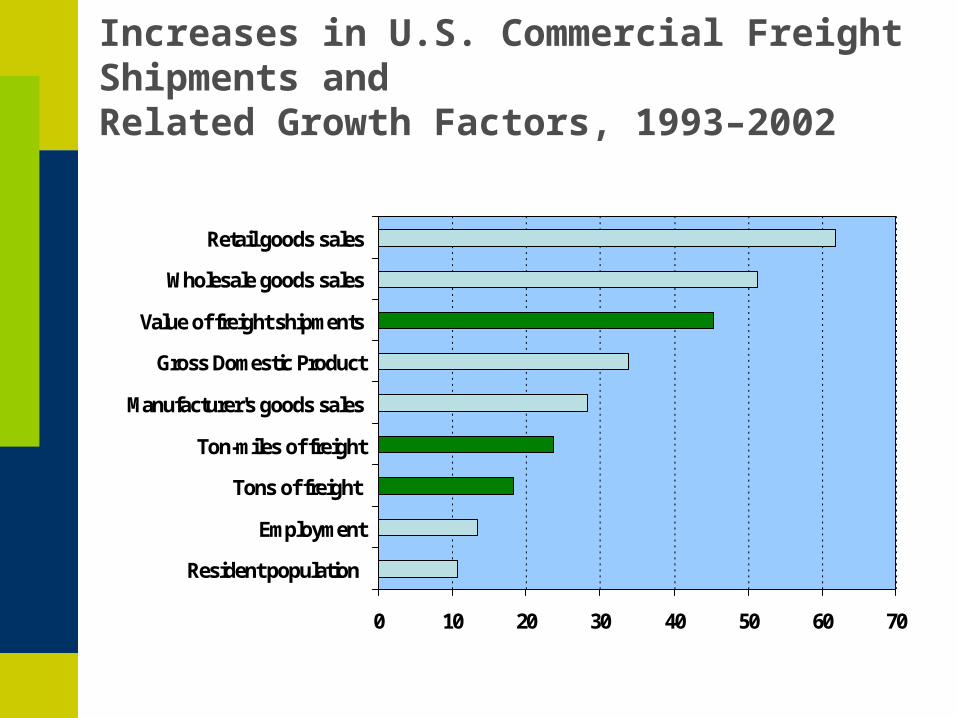
Increases in U.S. Commercial Freight Shipments andRelated Growth Factors, 1993–2002
0 10 20 30 40 50 60 70
Resident population
Employment
Tons of freight
Ton-miles of freight
Manufacturer's goods sales
Gross Domestic Product
Value of freight shipments
Wholesale goods sales
Retail goods sales

U.S. Trade in Goods and Services - Balance of Payments, 1970-2003 (billions of $US)
-600
-500
-400
-300
-200
-100
0
100
1970
1972
1974
1976
1978
1980
1982
1984
1986
1988
1990
1992
1994
1996
1998
2000
2002
Total
Goods
Services
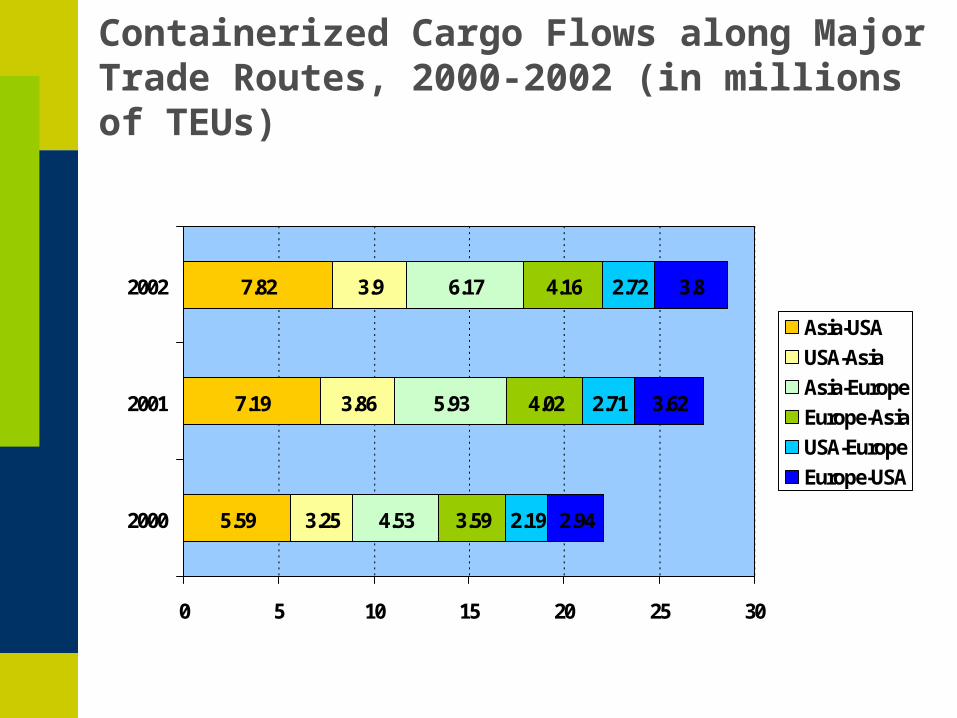
Containerized Cargo Flows along Major Trade Routes, 2000-2002 (in millions of TEUs)
5.59
7.19
7.82
3.25
3.86
3.9
4.53
5.93
6.17
3.59
4.02
4.16
2.19
2.71
2.72
2.94
3.62
3.8
0 5 10 15 20 25 30
2000
2001
2002
Asia-USA
USA-Asia
Asia-Europe
Europe-Asia
USA-Europe
Europe-USA
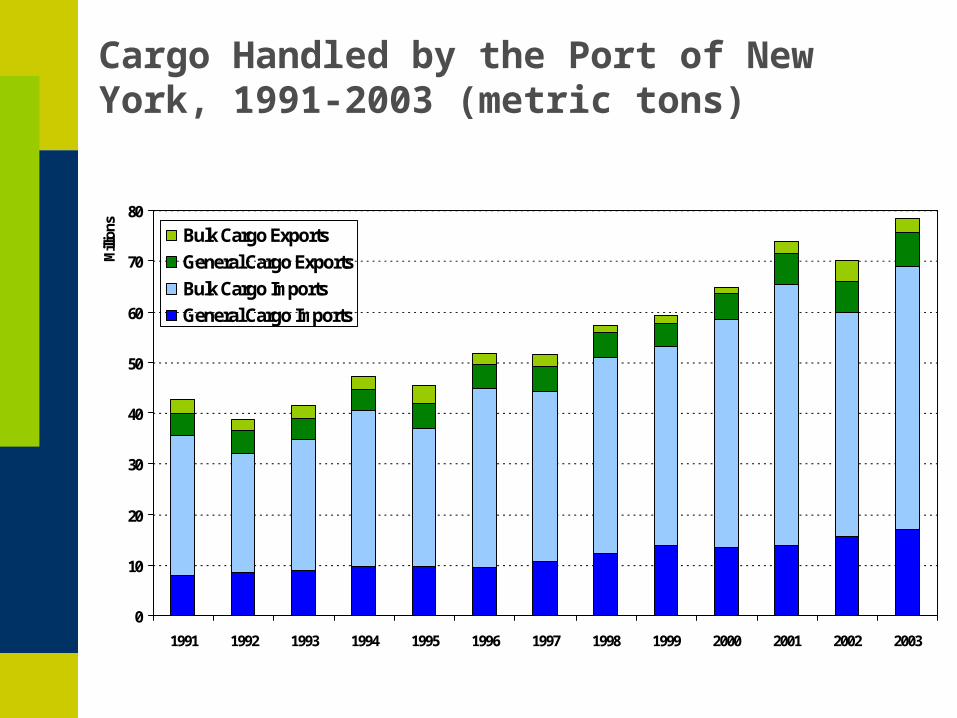
Cargo Handled by the Port of New York, 1991-2003 (metric tons)
0
10
20
30
40
50
60
70
80
1991 1992 1993 1994 1995 1996 1997 1998 1999 2000 2001 2002 2003
Mill
ions Bulk Cargo Exports
General Cargo Exports
Bulk Cargo Imports
General Cargo Imports

!(!(
!(
!(
!(
!(
!(
!(
!(
!(
Container Traffic at Major East Coast Ports, 1990-2003 (TEU)
0.0 0.5 1.0 1.5 2.0 2.5 3.0 3.5 4.0 4.5
1) New York/New Jersey
2) Charleston
3) Hampton Roads
4) Savannah
5) Miami
6) Jacksonville
7) Port Everglades
8) Baltimore
9) Wilmington
10) Palm Beach
11) Boston
12) Philadelphia
Millions
1990
1995
2000
20031
2
3
4
5
6
7
89
10
11
12
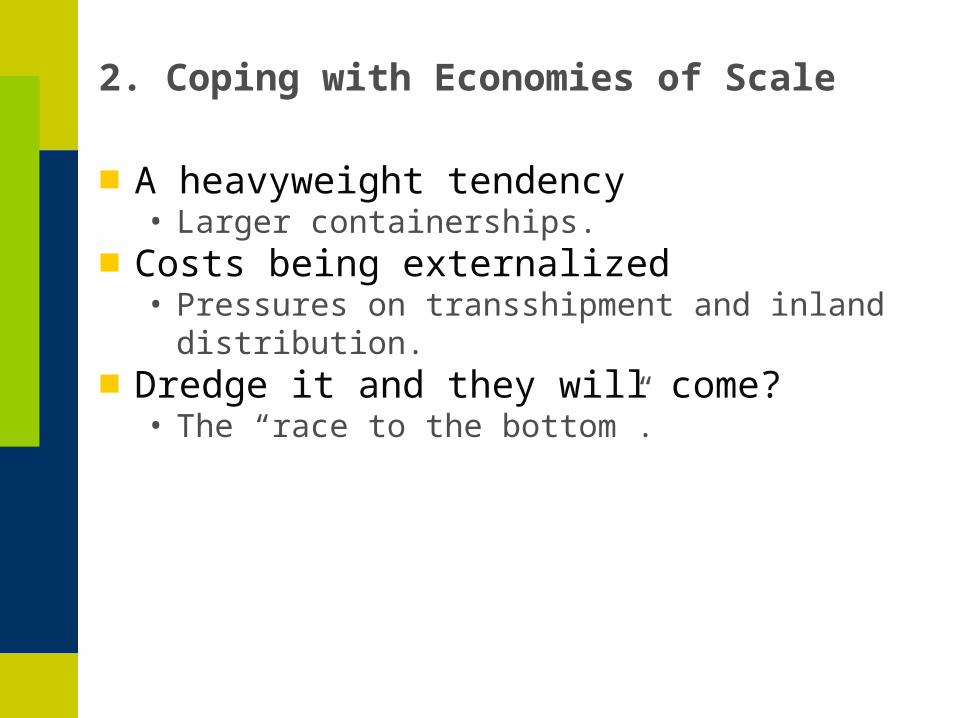
2. Coping with Economies of Scale
■ A heavyweight tendency• Larger containerships.
■ Costs being externalized• Pressures on transshipment and inland distribution.
■ Dredge it and they will come?• The “race to the bottom”.
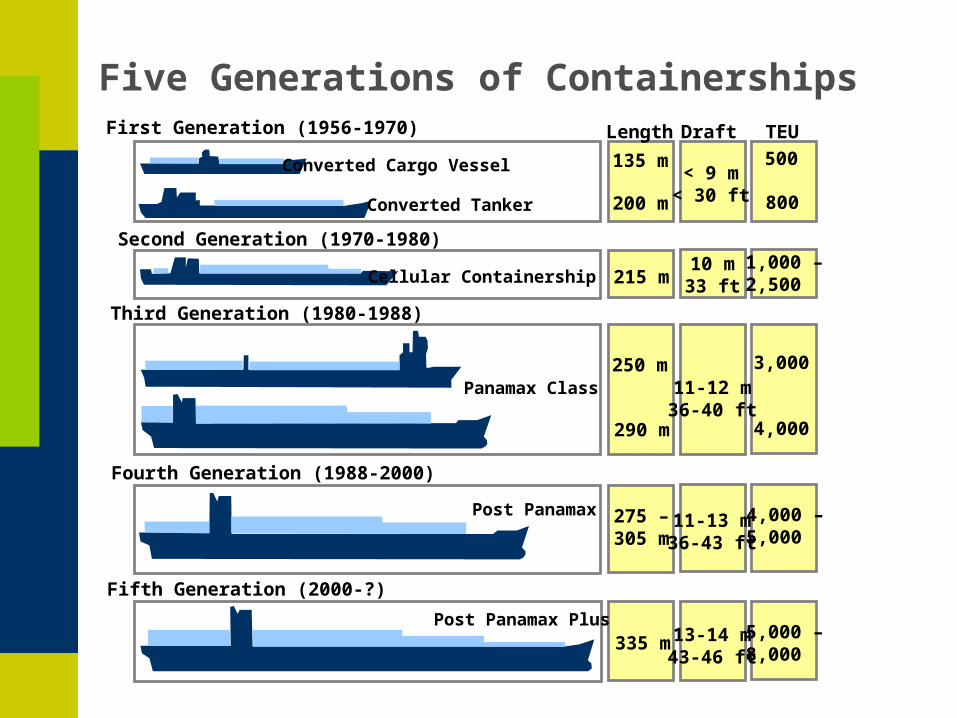
First Generation (1956-1970)
Converted Tanker
Second Generation (1970-1980)
Cellular Containership
Third Generation (1980-1988)
Panamax Class
Fourth Generation (1988-2000)
Post Panamax Plus
Fifth Generation (2000-?)
Post Panamax
Converted Cargo Vessel
Five Generations of Containerships TEULength
135 m
200 m
500
800
215 m1,000 –2,500
250 m 3,000
290 m 4,000
275 –305 m
4,000 –5,000
335 m5,000 –8,000
Draft
< 9 m< 30 ft
10 m33 ft
11-12 m36-40 ft
11-13 m36-43 ft
13-14 m43-46 ft

The Largest Available Containership, 1980-2000 (in TEUs)
0
1000
2000
3000
4000
5000
6000
7000
8000
9000
1980 1985 1990 1995 2000

Fourth Generation Containership (4,000 TEU), Le Havre
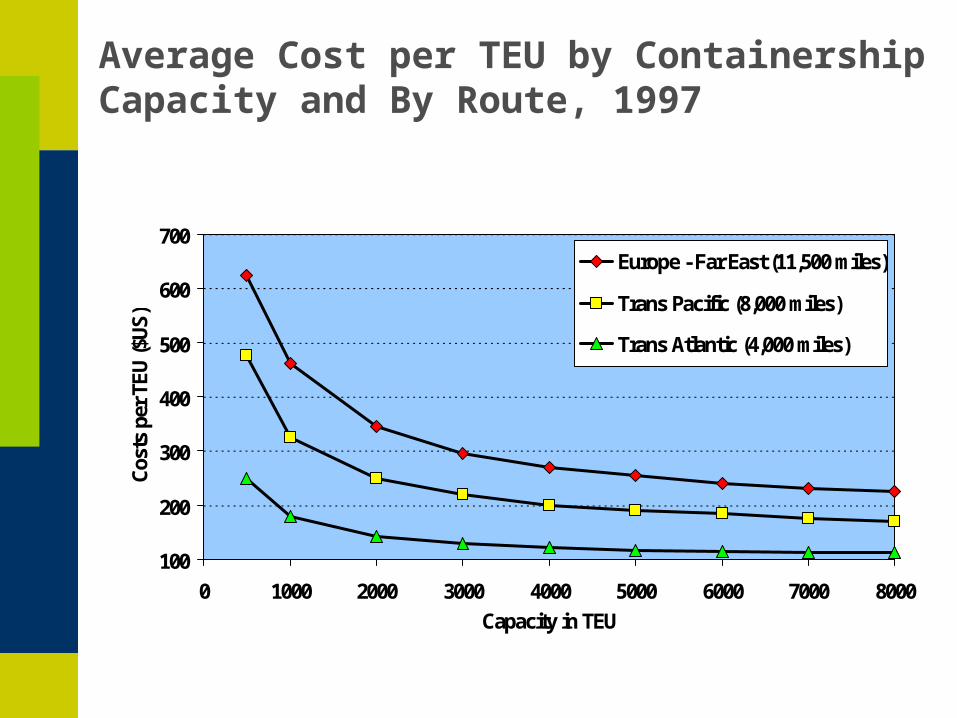
Average Cost per TEU by Containership Capacity and By Route, 1997
100
200
300
400
500
600
700
0 1000 2000 3000 4000 5000 6000 7000 8000
Capacity in TEU
Cos
ts p
er T
EU
($U
S)
Europe - Far East (11,500 miles)
Trans Pacific (8,000 miles)
Trans Atlantic (4,000 miles)
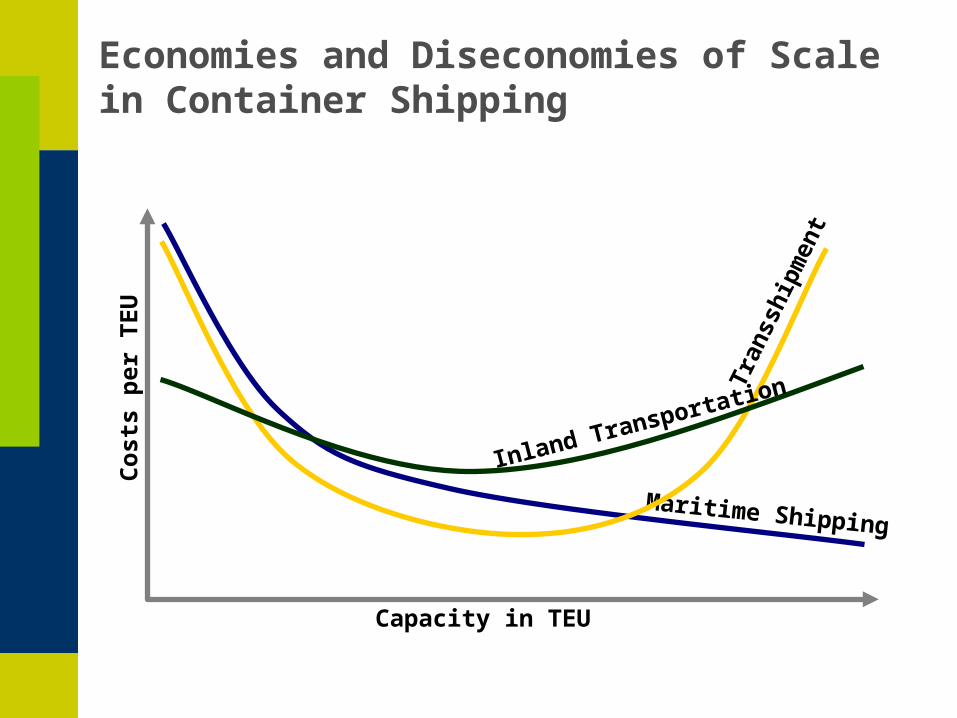
Economies and Diseconomies of Scale in Container Shipping
Cos
ts p
er T
EU
Capacity in TEU
Maritime Shipping
Tran
sshi
pmen
t
Inland Transportation
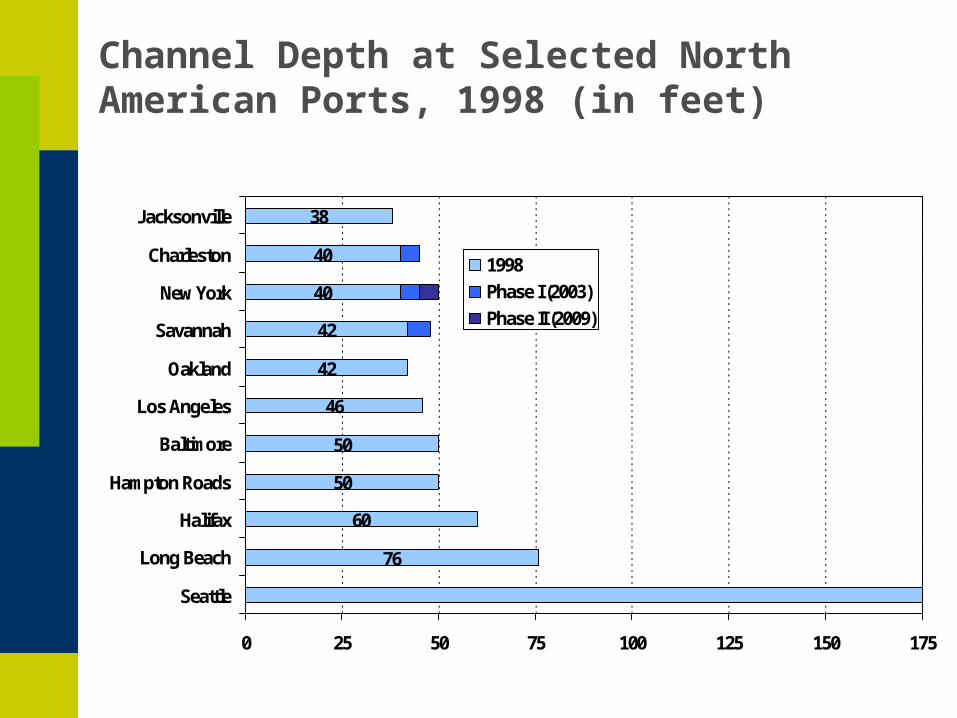
Channel Depth at Selected North American Ports, 1998 (in feet)
76
60
50
50
46
42
42
40
40
38
0 25 50 75 100 125 150 175
Seattle
Long Beach
Halifax
Hampton Roads
Baltimore
Los Angeles
Oakland
Savannah
New York
Charleston
Jacksonville
1998
Phase I (2003)
Phase II (2009)

!(
!(!(
!(
!(
!(
!(
!(!(!(
!(
!(
!(!(
!(!(!(
!(!(
!(
!(!(
!(
!(
!(
!(!(!(
!(!( !(
!(
!(
!(
!(
!(!(
!(
!(
!(
!(
!(
!(
!(
!(
!(
!(
!(
!(
!(
!(
!(
!(
!(!(!(
!(
!(
!(
!(
!(
!(!(
!(!(
!(!(
!(!(
!(
!(
!(
!(!(
!(
!(
!(
!(!(
!(!(!(
!(
!(
!(!(
!(
!(
!(
!(
!(
!(
!(
!(
!(!(
!(
!(
!(!(
!(!(
!(
!(
!(
!(
!(
!(!(
4 0 42 Miles
45
Navigation Channel
Control Depth (feet)
Intermodal Terminal
Container Port (proposed)
Major Highway
Proposed rail tunnel
4530
3737
37
45
45
40
43
40
45
40
37
Ambrose Channel
Main Ship Channel
Raritan Bay Channel
Arthur Kill Channel
Arthur Kill Channel
Kill Van KullChannel
Newark BayChannel
Upper Bay Channel
Hudson River
East River
45
The Narrows
Bro
okly
n
Stat
en Is
land
New
Jer
sey
N
2
1
Howland Hook
Red Hook
South Brooklyn
3
1- Port Newark2- Port Elizabeth3- Global Marine
Albers Equal-Area Conic Projection
Intermodal Facilities and Navigation Channels of the Port of New York, 2003
Port Elizabeth
Howland Hook
Port Newark
Global Marine
Red Hook
0 2000 4000 6000 8000 10000
Daily Truck Movements (one way), 2001

3. Transforming Hinterlands
■ The flexibility and adaptability of supply chains• Growing functional integration.
■ Between a port and a hard place• New hinterland structures.
■ The intermodal coast• Regionalization and modal shift.
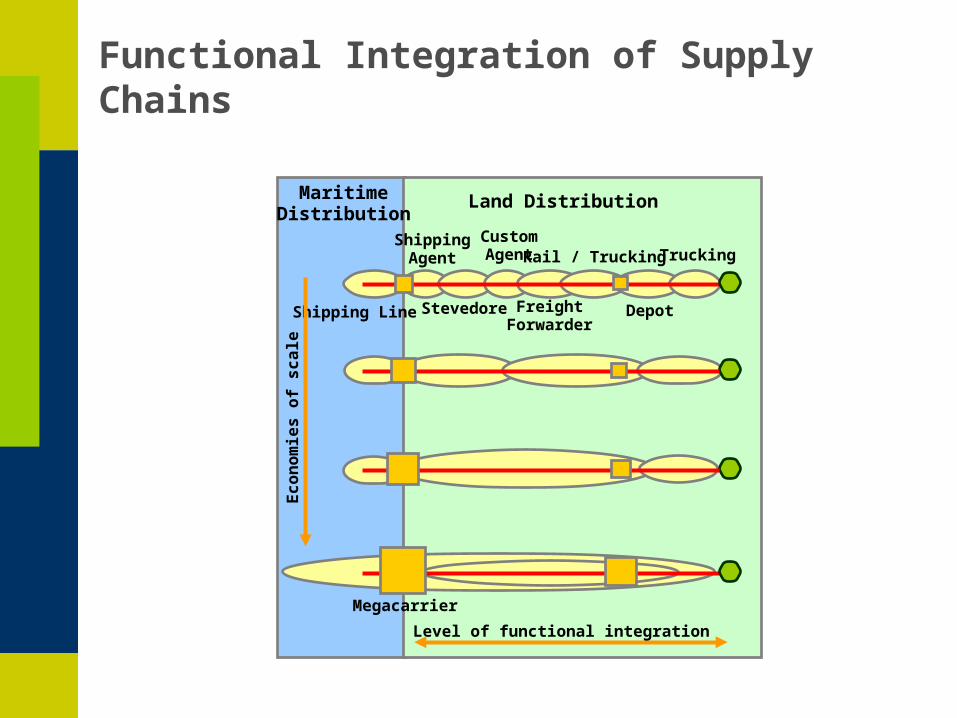
Functional Integration of Supply Chains
Shipping Line
ShippingAgent
Stevedore
CustomAgent
FreightForwarder
Rail / Trucking
Depot
Trucking
Megacarrier
Econ
omie
s of
sca
le
Land DistributionMaritimeDistribution
Level of functional integration
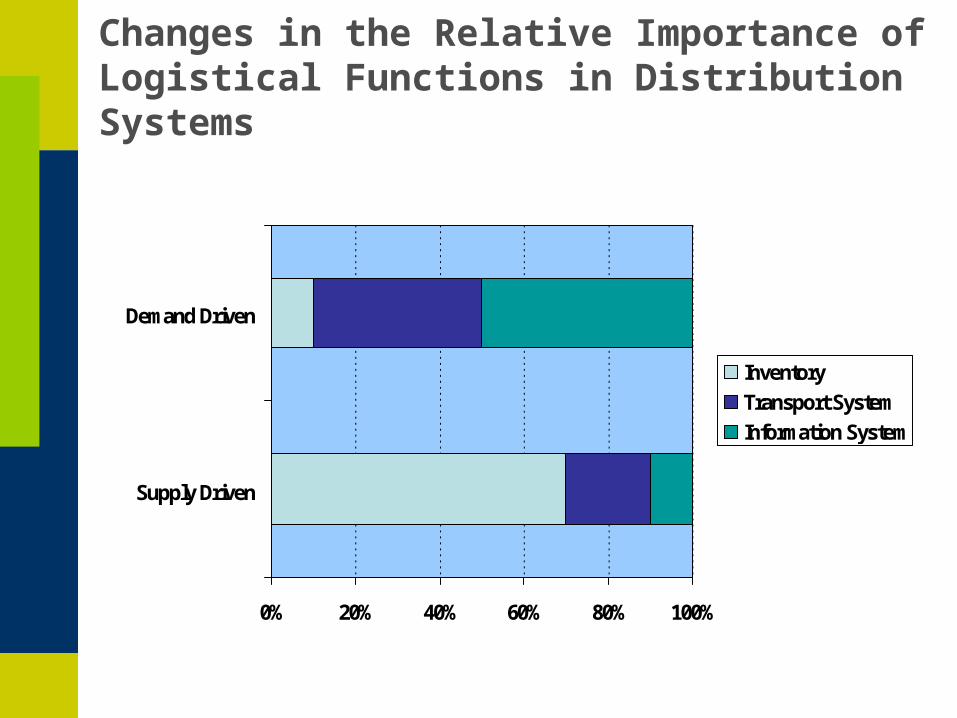
Changes in the Relative Importance of Logistical Functions in Distribution Systems
0% 20% 40% 60% 80% 100%
Supply Driven
Demand Driven
Inventory
Transport System
Information System
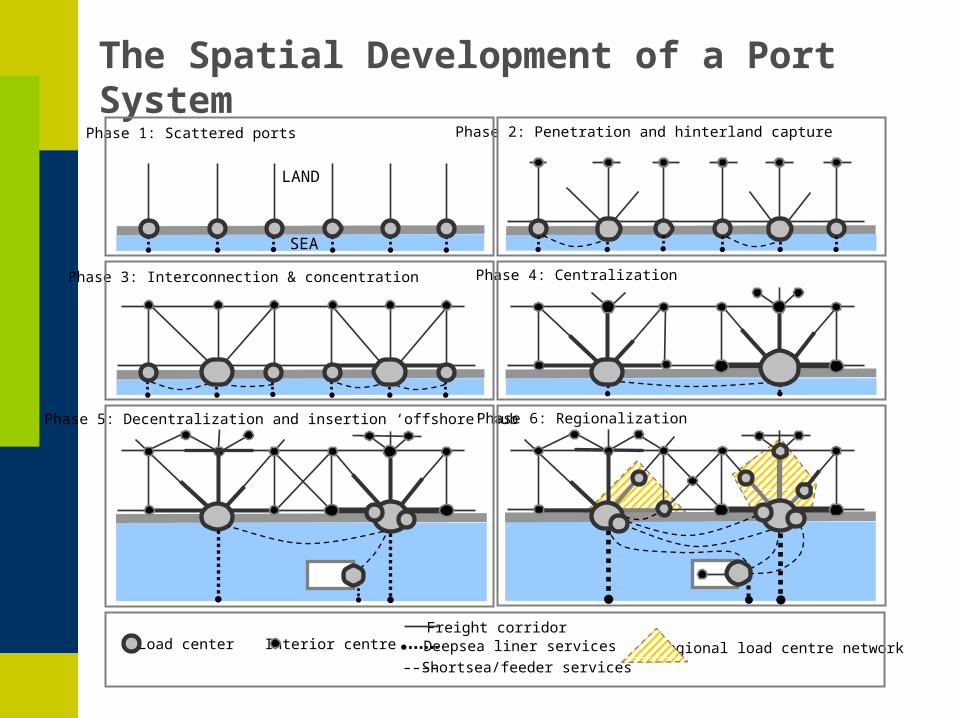
The Spatial Development of a Port SystemPhase 1: Scattered ports Phase 2: Penetration and hinterland capture
Phase 3: Interconnection & concentration Phase 4: Centralization
Phase 5: Decentralization and insertion ‘offshore’ hub Phase 6: Regionalization
Load center Interior centre Regional load centre network
Freight corridor
LAND
SEA
Deepsea liner services
Shortsea/feeder services

Pendulum Route: OOCL Container Services on the North Atlantic, 1997
BostonNew YorkNorfolk
SavannahJacksonville
MiamiHouston
BremenhavenFelixstowe
Rotterdam
Le Havre
NAX-1NAX-2
Atlantic Ocean

National Trade Areas, Articulation Points and Major Land Freight Gateways of the United States
Articulation Point
Land FreightGateway
Trade Area
Corridor
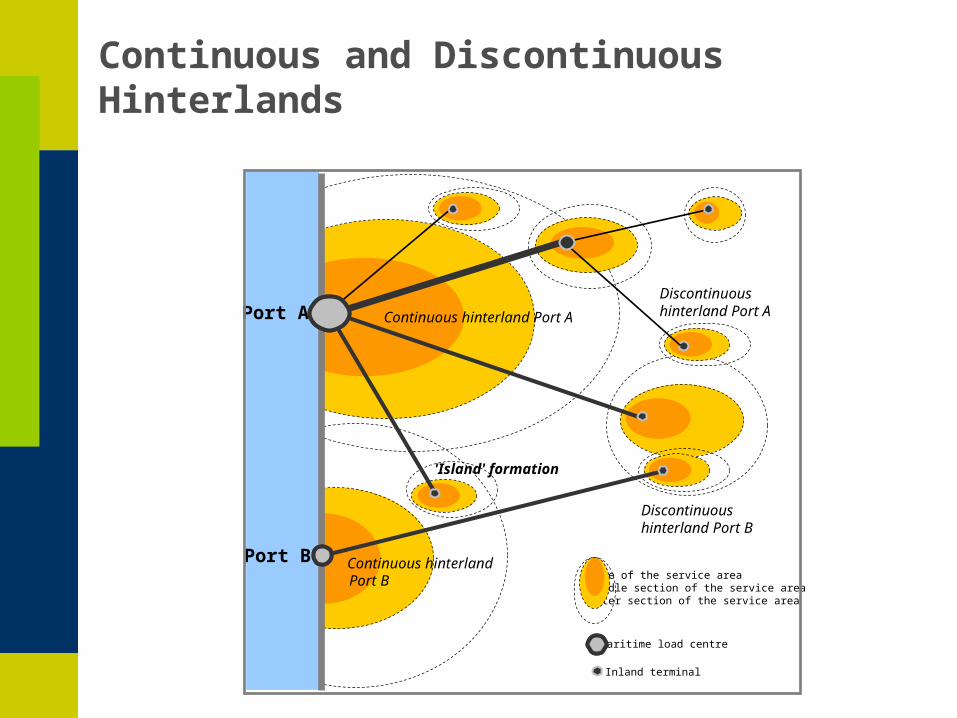
Continuous and Discontinuous Hinterlands
Core of the service areaMiddle section of the service areaOuter section of the service area
Maritime load centre
Inland terminal
Continuous hinterland Port A
Continuous hinterland Port B
Discontinuous hinterland Port A
Discontinuous hinterland Port B
'Island' formation
Port A
Port B
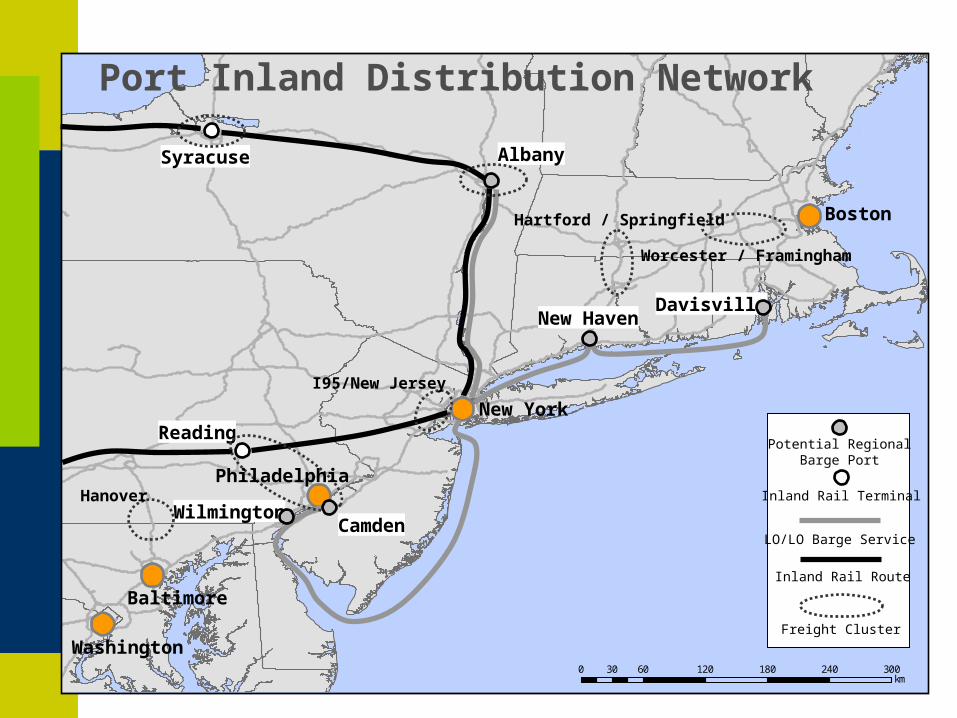
0 60 120 180 240 30030km
Albany
CamdenWilmington
New HavenDavisville
New York
Boston
Baltimore
Washington
Potential RegionalBarge Port
LO/LO Barge Service
Reading
Syracuse
Inland Rail Terminal
Inland Rail Route
Worcester / Framingham
Hanover
Hartford / Springfield
Freight Cluster
Philadelphia
I95/New Jersey
Port Inland Distribution Network

Potential Modal Split Changes Due to the PIDN
0% 20% 40% 60% 80% 100%
2001
2020
Truck
Rail
Barge

Modal Split for Container Traffic, Rhine Delta, 1995-2000
0% 20% 40% 60% 80% 100%
Rotterdam
Antwerp
Road
Rail
Inland navigation
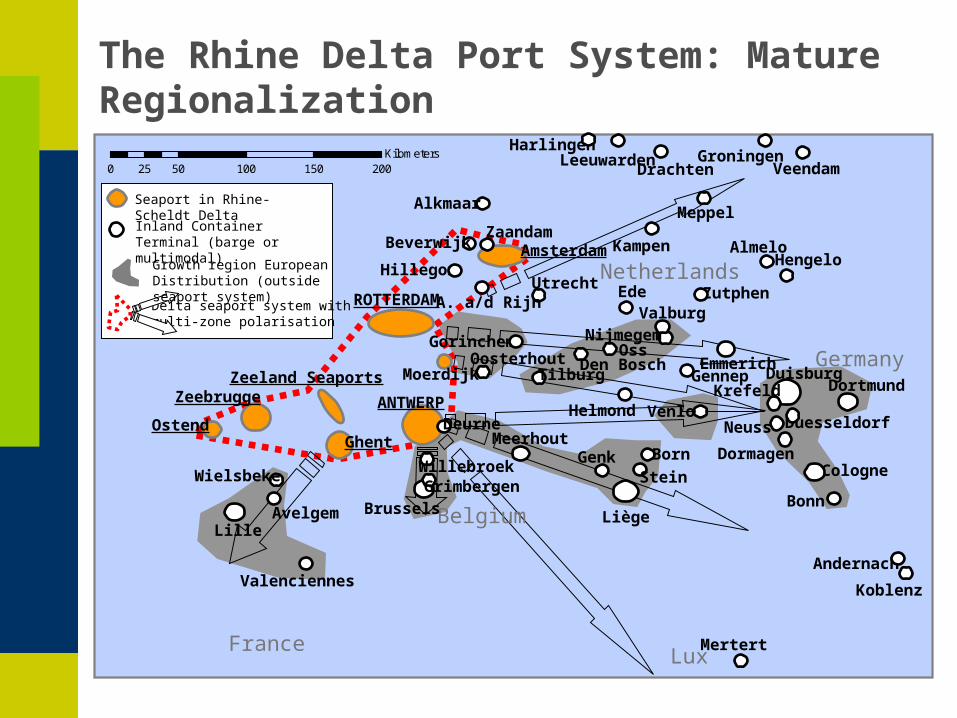
0 50 100 150 20025Kilometers
France
Belgium
Lux
Germany
NetherlandsROTTERDAM
Zeeland Seaports
ANTWERPZeebrugge
GhentOstend
BrusselsLille
Liège
WielsbekeGenk
DuisburgEmmerich
Nijmegem
Avelgem
Born
Venlo
Valenciennes
GrimbergenWillebroek
DeurneMeerhout
Duesseldorf
Cologne
Krefeld
Neuss
Bonn
Andernach
Dortmund
Amsterdam
Alkmaar
BeverwijkZaandam
HarlingenLeeuwarden Veendam
Meppel
GroningenDrachten
Kampen AlmeloHengelo
ZutphenEdeHillegom
UtrechtA. a/d Rijn
TilburgOosterhout
Helmond
Gorinchem
MoerdijkDen Bosch
Oss
Valburg
Stein
Gennep
Mertert
Koblenz
Dormagen
Seaport in Rhine-Scheldt Delta
Delta seaport system with multi-zone polarisation
Inland Container Terminal (barge or multimodal)
Growth region EuropeanDistribution (outside seaport system)
The Rhine Delta Port System: Mature Regionalization
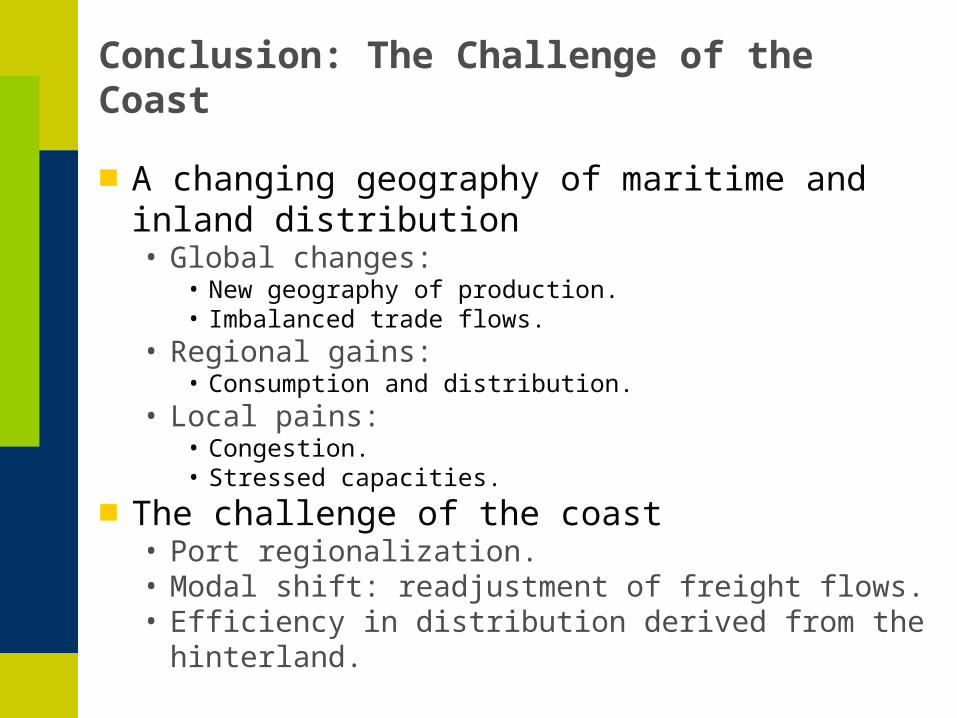
Conclusion: The Challenge of the Coast
■ A changing geography of maritime and inland distribution• Global changes:
• New geography of production.• Imbalanced trade flows.
• Regional gains:• Consumption and distribution.
• Local pains:• Congestion.• Stressed capacities.
■ The challenge of the coast• Port regionalization.• Modal shift: readjustment of freight flows.• Efficiency in distribution derived from the hinterland.