Embed Size (px)
DESCRIPTION
Houston Air Quality: Modeling, Monitoring and Risk Associated with Hazardous Air Pollutants (HAPs). Mark Harris, PhD Principal Health Scientist ChemRisk Inc. Houston Air Toxics Workshop II June 12, 2007. Houston Air Quality: Outline. Recent Events Mayor’s Task Force Report - PowerPoint PPT Presentation
Citation preview
ChemRisk
Houston Air Quality: Modeling, Monitoring and Risk Associated
with Hazardous Air Pollutants (HAPs)
Mark Harris, PhD
Principal Health ScientistChemRisk Inc.
Houston Air Toxics Workshop II June 12, 2007
ChemRisk
Houston Air Quality: Outline
• Recent Events
• Mayor’s Task Force Report
– data utilized
– risk characterization
• Conclusions
ChemRisk
Current Situation
• Houston complies with Clean Air Act (CAA) criteria pollutant standards except for ozone
• Coming into compliance with the CAA ozone standard is important:– Human health (asthma)– Federal funding– Remain competitive with other metropolitan areas
ChemRisk
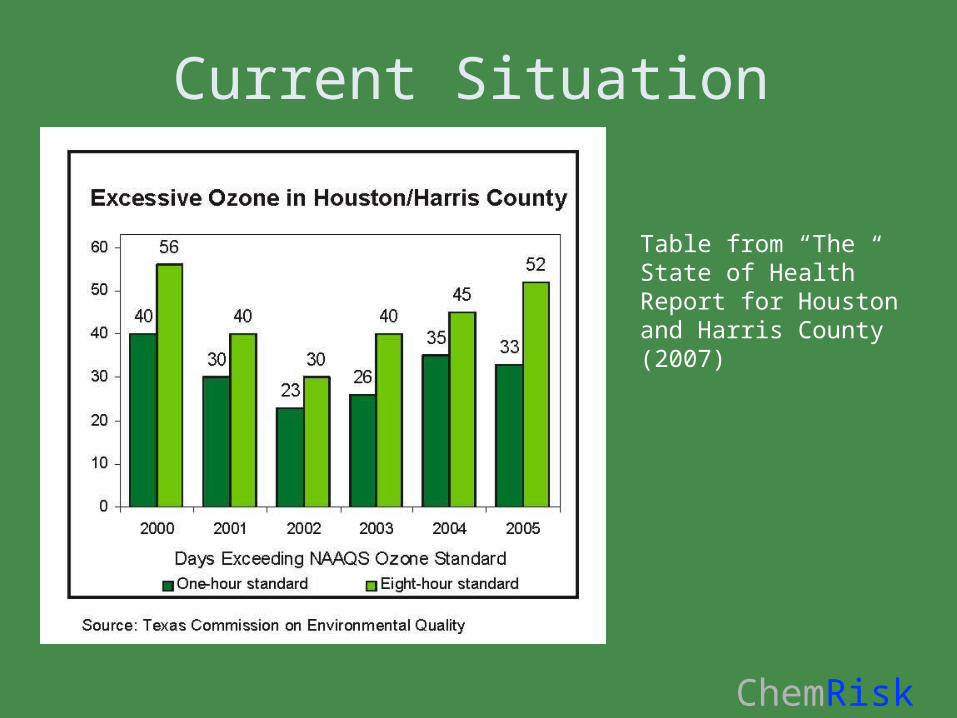
Current Situation
Table from “The State of Health” Report for Houston and Harris County (2007)
ChemRisk
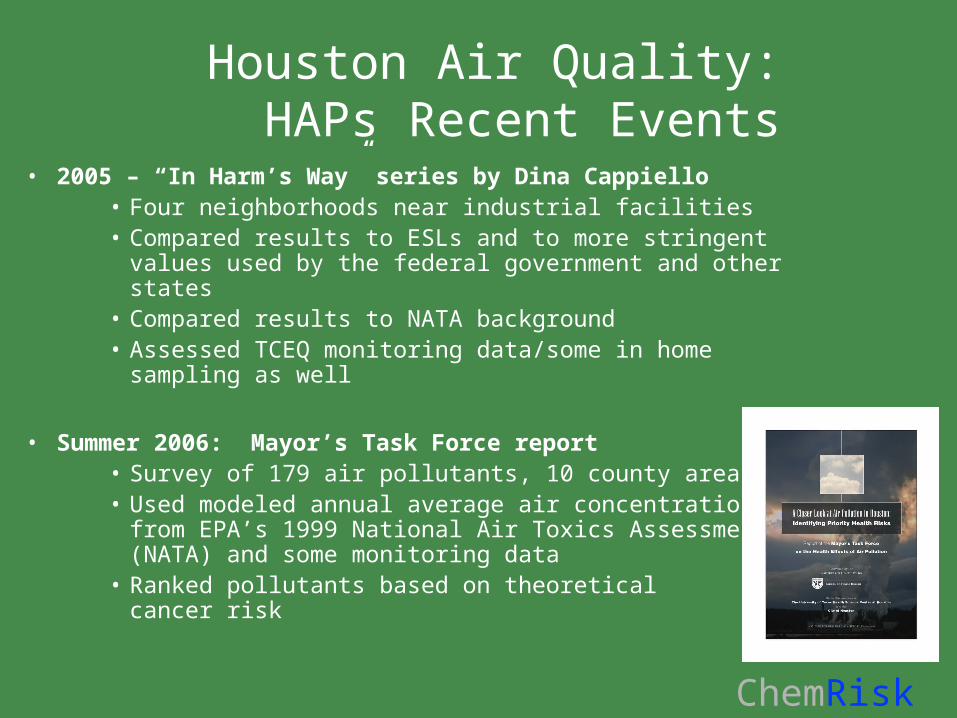
Houston Air Quality: HAPs Recent Events
• 2005 – “In Harm’s Way” series by Dina Cappiello• Four neighborhoods near industrial facilities• Compared results to ESLs and to more stringent values
used by the federal government and other states• Compared results to NATA background• Assessed TCEQ monitoring data/some in home sampling
as well
• Summer 2006: Mayor’s Task Force report• Survey of 179 air pollutants, 10 county area• Used modeled annual average air concentrations
from EPA’s 1999 National Air Toxics Assessment (NATA) and some monitoring data
• Ranked pollutants based on theoreticalcancer risk
ChemRisk
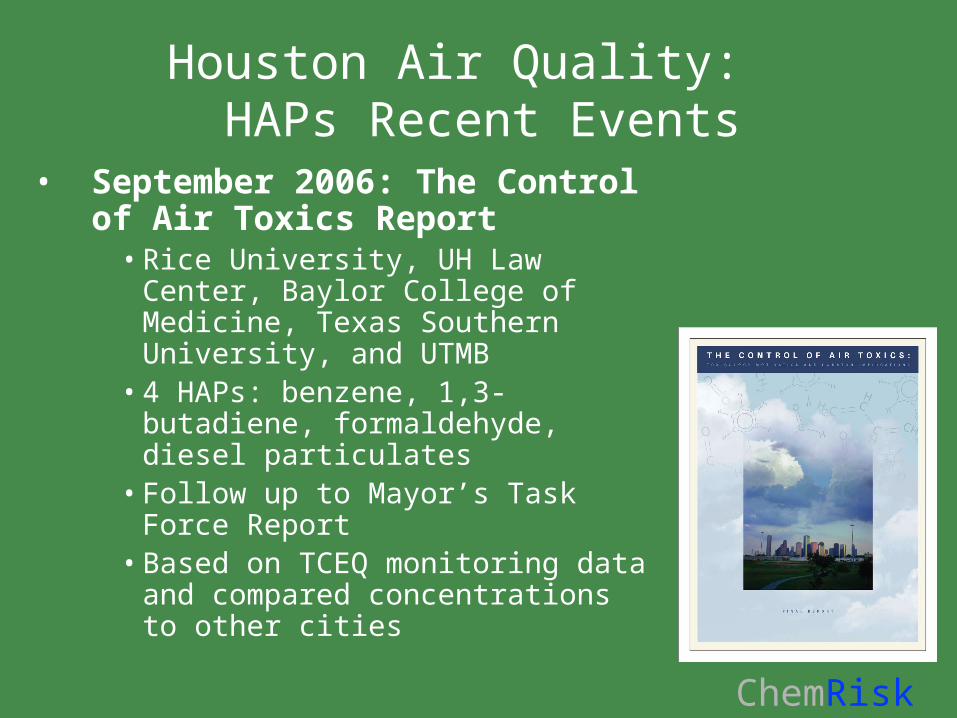
• September 2006: The Control of Air Toxics Report
• Rice University, UH Law Center, Baylor College of Medicine, Texas Southern University, and UTMB
• 4 HAPs: benzene, 1,3-butadiene, formaldehyde, diesel particulates
• Follow up to Mayor’s Task Force Report
• Based on TCEQ monitoring data and compared concentrations to other cities
Houston Air Quality: HAPs Recent Events
ChemRisk
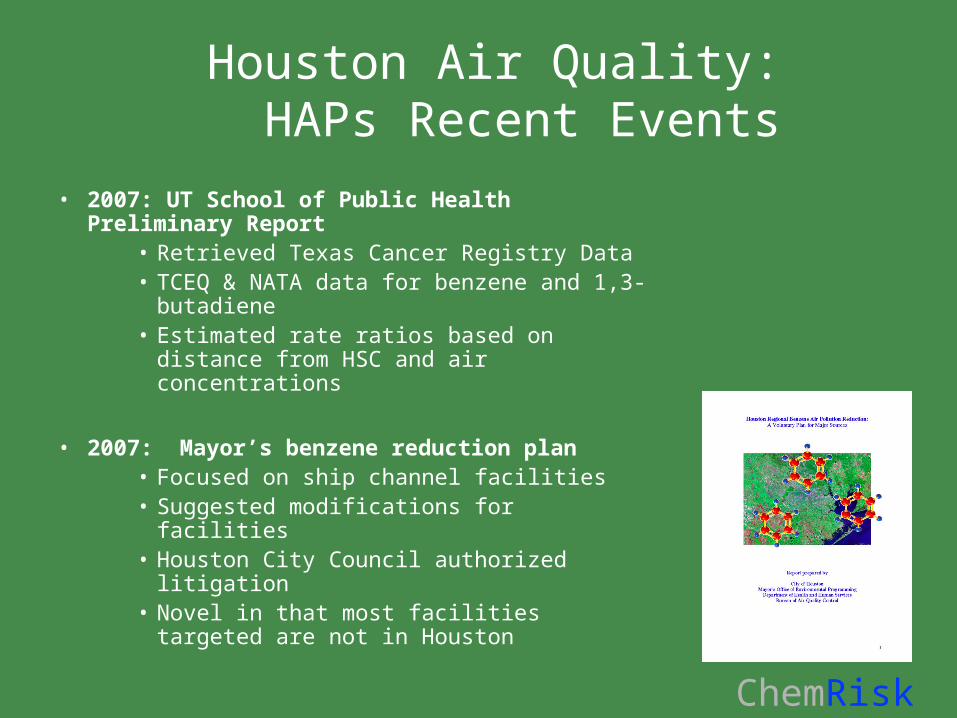
• 2007: UT School of Public Health Preliminary Report
• Retrieved Texas Cancer Registry Data• TCEQ & NATA data for benzene and
1,3-butadiene• Estimated rate ratios based on distance
from HSC and air concentrations
• 2007: Mayor’s benzene reduction plan• Focused on ship channel facilities• Suggested modifications for facilities• Houston City Council authorized litigation • Novel in that most facilities targeted are
not in Houston
Houston Air Quality: HAPs Recent Events
ChemRisk
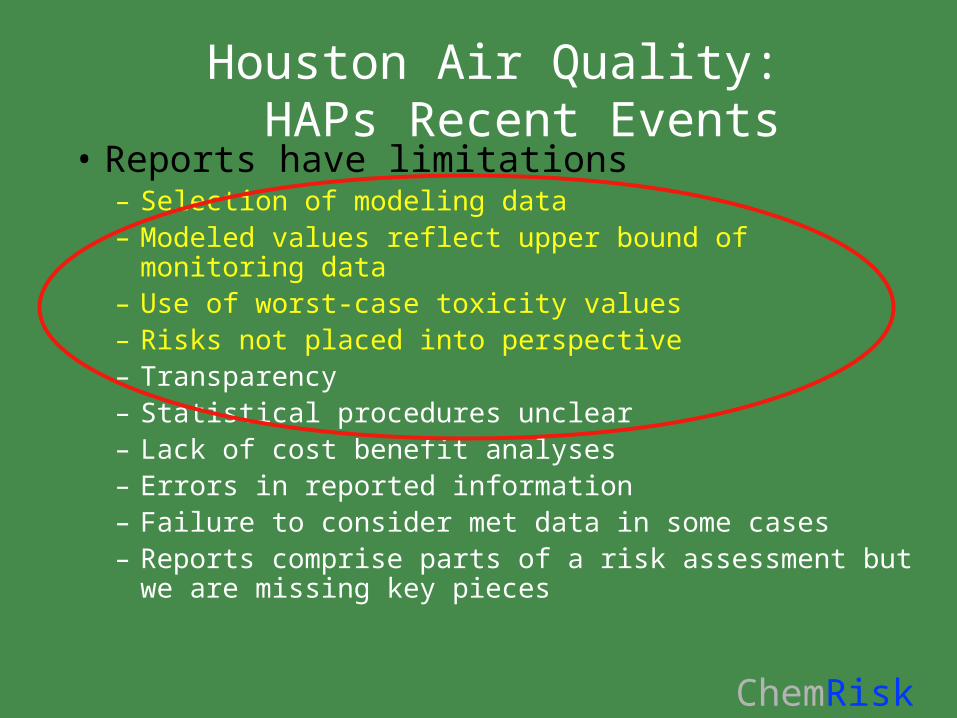
• Reports have limitations – Selection of modeling data– Modeled values reflect upper bound of monitoring data– Use of worst-case toxicity values– Risks not placed into perspective– Transparency – Statistical procedures unclear– Lack of cost benefit analyses– Errors in reported information– Failure to consider met data in some cases– Reports comprise parts of a risk assessment but we are
missing key pieces
Houston Air Quality: HAPs Recent Events
ChemRisk
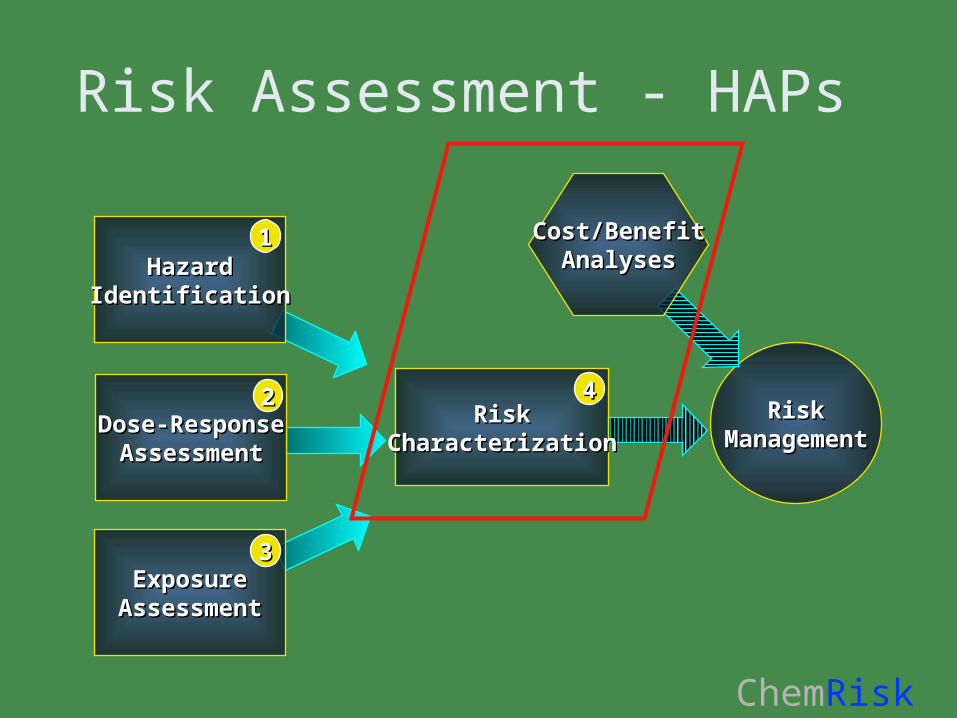
Risk Assessment - HAPs
RiskRiskCharacterizationCharacterization
Dose-ResponseDose-ResponseAssessmentAssessment
RiskRiskManagementManagement
HazardHazardIdentificationIdentification
ExposureExposureAssessmentAssessment
Cost/BenefitCost/BenefitAnalysesAnalyses
11
22
33
44
ChemRisk
Focus on Mayor’s Task Force Report
ChemRisk
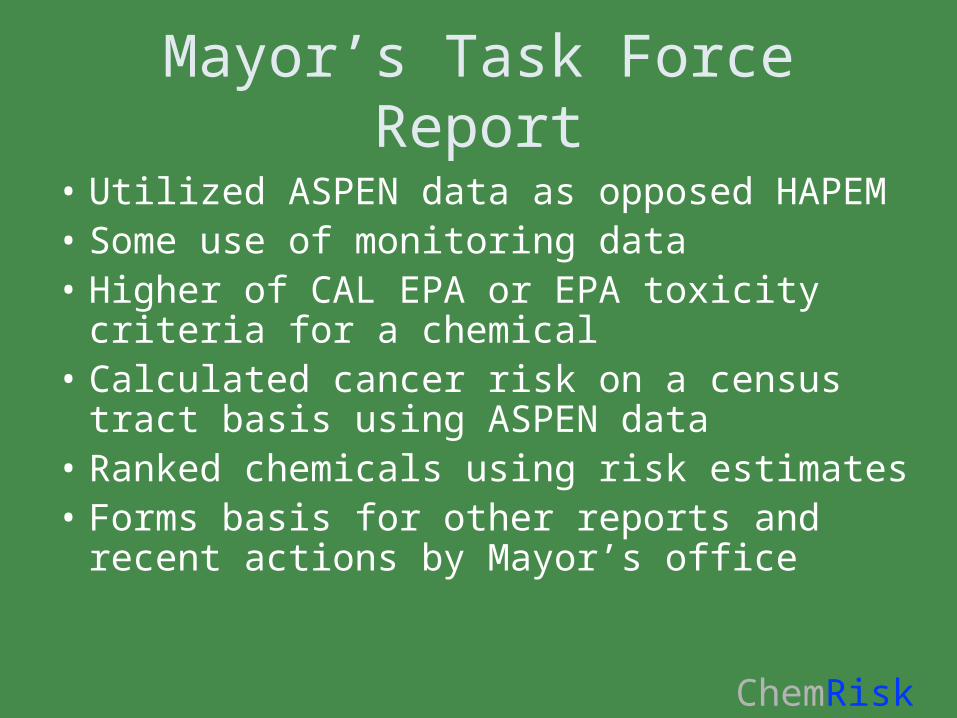
Mayor’s Task Force Report
• Utilized ASPEN data as opposed HAPEM• Some use of monitoring data• Higher of CAL EPA or EPA toxicity criteria
for a chemical• Calculated cancer risk on a census tract
basis using ASPEN data • Ranked chemicals using risk estimates• Forms basis for other reports and recent
actions by Mayor’s office
ChemRisk
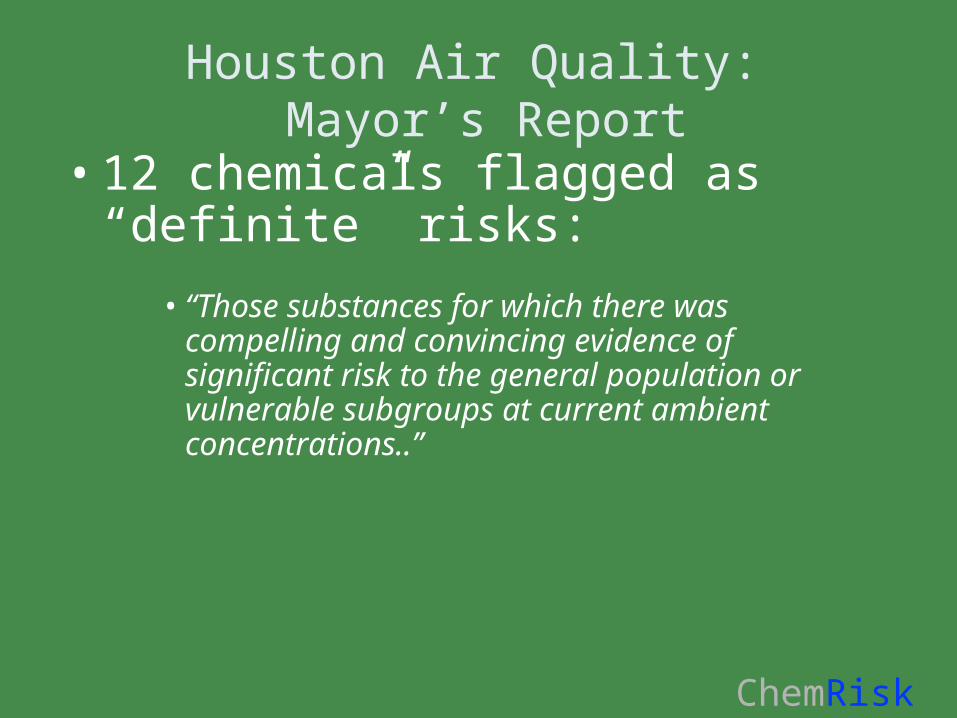
Houston Air Quality: Mayor’s Report
• 12 chemicals flagged as “definite” risks:
• “Those substances for which there was compelling and convincing evidence of significant risk to the general population or vulnerable subgroups at current ambient concentrations..”
ChemRisk
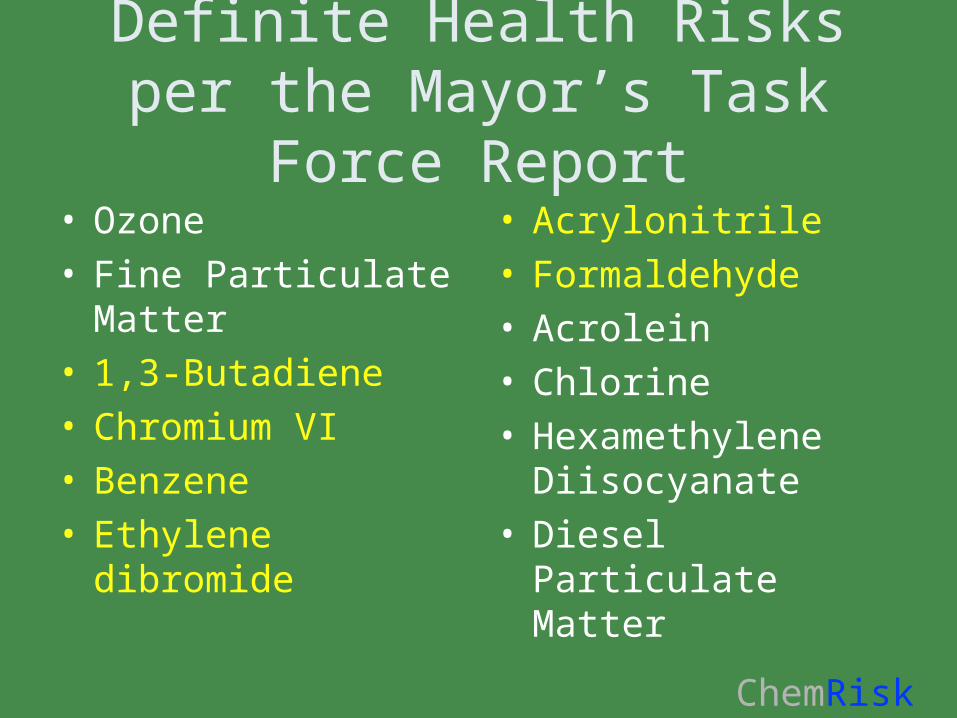
Definite Health Risks per the Mayor’s Task Force Report
• Ozone• Fine Particulate
Matter• 1,3-Butadiene• Chromium VI• Benzene• Ethylene dibromide
• Acrylonitrile• Formaldehyde• Acrolein• Chlorine• Hexamethylene
Diisocyanate• Diesel Particulate
Matter
ChemRisk
Our Evaluation
• Comparison of NATA modeled air concentrations for certain HAPs to monitoring results
• Risk Characterization– Sprinkles, a thunderstorm or hurricane?
ChemRisk
NATA Air Modeling
• As part of NATA, air concentrations were modeled by EPA using ASPEN and HAPEM for 895 census tracts in our 10 county area
• Air concentrations used by EPA to predict risk• 1999 vintage information• We pulled the modeled air concentrations into
ArcGIS, and plotted with TCEQ air monitoring locations
ChemRisk
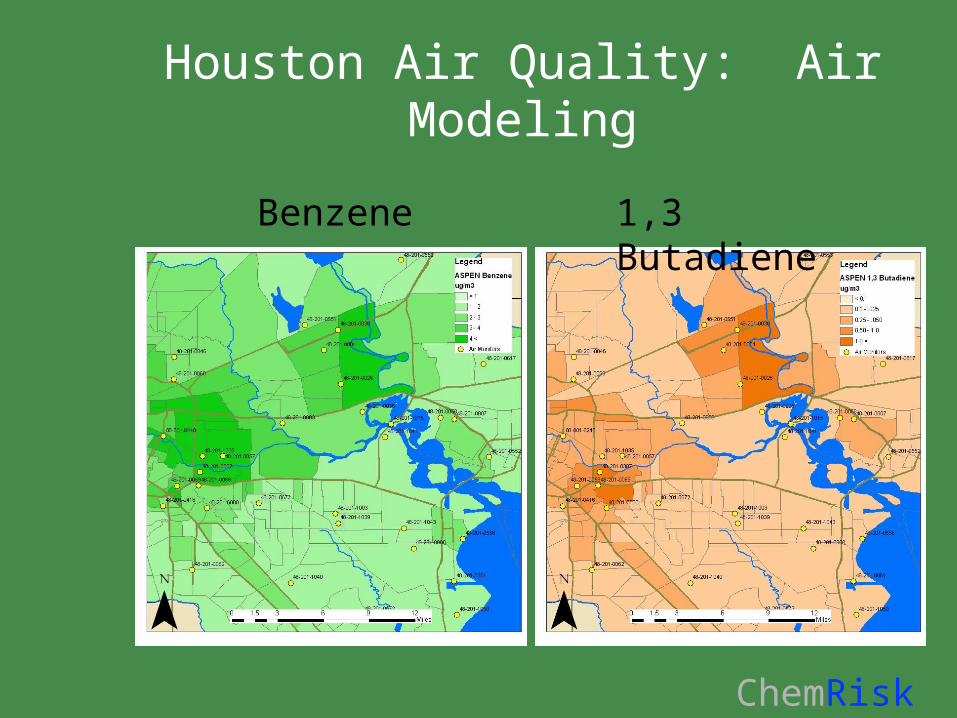
Houston Air Quality: Air Modeling
Benzene 1,3 Butadiene
ChemRisk
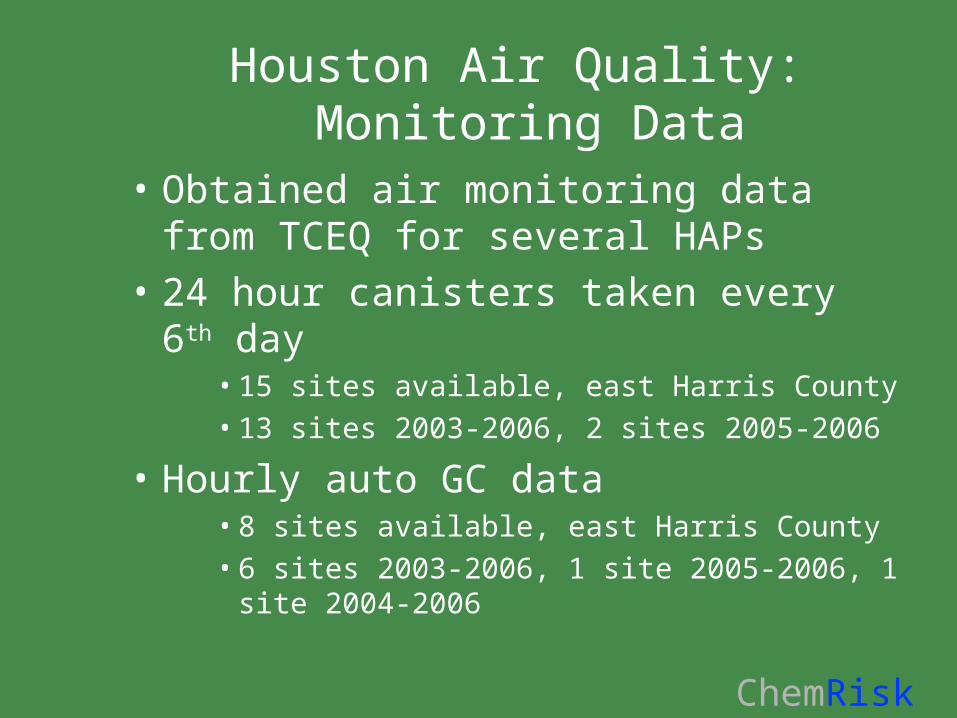
Houston Air Quality: Monitoring Data
• Obtained air monitoring data from TCEQ for several HAPs
• 24 hour canisters taken every 6th day • 15 sites available, east Harris County• 13 sites 2003-2006, 2 sites 2005-2006
• Hourly auto GC data • 8 sites available, east Harris County • 6 sites 2003-2006, 1 site 2005-2006, 1 site
2004-2006
ChemRisk
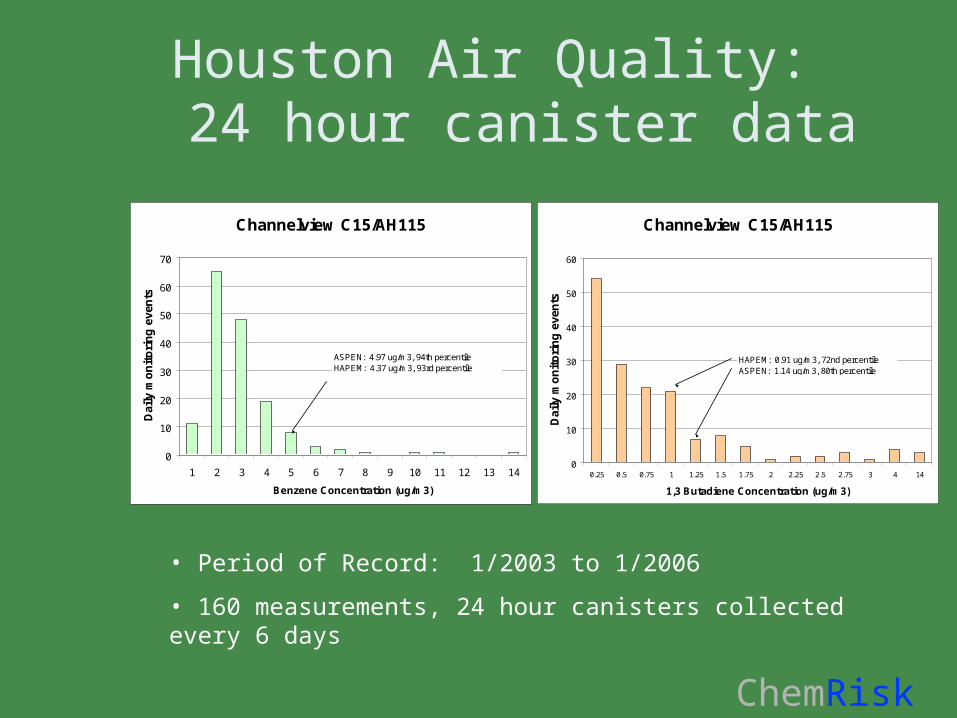
Houston Air Quality: 24 hour canister data
Channelview C15/AH115
0
10
20
30
40
50
60
70
1 2 3 4 5 6 7 8 9 10 11 12 13 14
Benzene Concentration (ug/m3)
Dai
ly m
on
ito
rin
g e
ven
ts
ASPEN: 4.97 ug/m3, 94th percentileHAPEM: 4.37 ug/m3, 93rd percentile
• Period of Record: 1/2003 to 1/2006
• 160 measurements, 24 hour canisters collected every 6 days
Channelview C15/AH115
0
10
20
30
40
50
60
0.25 0.5 0.75 1 1.25 1.5 1.75 2 2.25 2.5 2.75 3 4 14
1,3 Butadiene Concentration (ug/m3)
Dai
ly m
on
ito
rin
g e
ven
ts
HAPEM: 0.91 ug/m3, 72nd percentileASPEN: 1.14 ug/m3, 80th percentile
ChemRisk
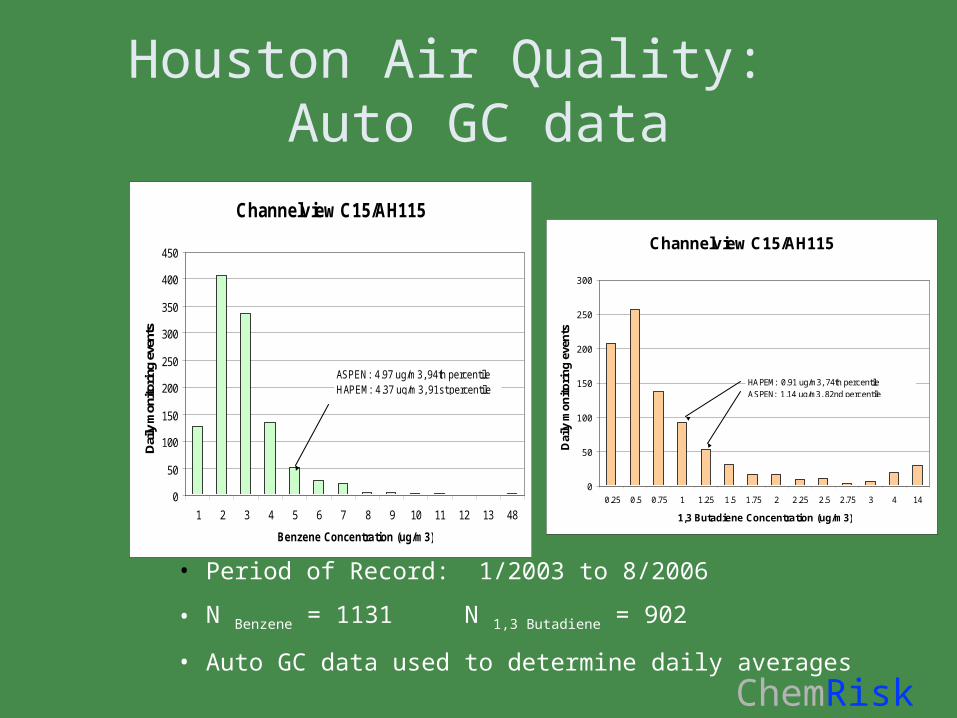
Houston Air Quality: Auto GC data
Channelview C15/AH115
0
50
100
150
200
250
300
350
400
450
1 2 3 4 5 6 7 8 9 10 11 12 13 48
Benzene Concentration (ug/m3)
Dai
ly m
onito
ring
even
ts
ASPEN: 4.97 ug/m3, 94th percentileHAPEM: 4.37 ug/m3, 91st percentile
Channelview C15/AH115
0
50
100
150
200
250
300
0.25 0.5 0.75 1 1.25 1.5 1.75 2 2.25 2.5 2.75 3 4 14
1,3 Butadiene Concentration (ug/m3)
Dai
ly m
on
ito
rin
g e
ven
ts
HAPEM: 0.91 ug/m3, 74th percentileASPEN: 1.14 ug/m3, 82nd percentile
• Period of Record: 1/2003 to 8/2006
• N Benzene = 1131 N 1,3 Butadiene = 902
• Auto GC data used to determine daily averages
ChemRisk
• Results for Channelview monitor typical• Results for Auto GC daily averages matches well
with 24 hour cans taken every 6 days• Modeled benzene concentration typically at or
greater than the 90th percentile of monitoring data• Modeled 1,3-butadiene concentration typically at
or greater than 70th percentile, often over 80th percentile
Houston Air Quality: Modeled vs. Monitored Air Concentration
ChemRisk
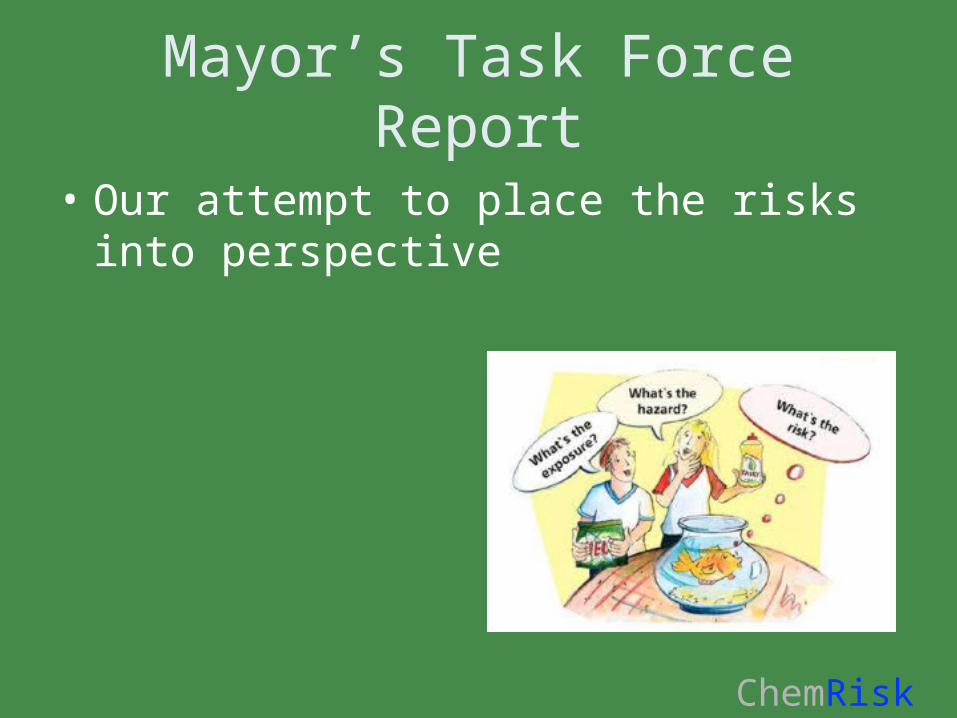
Mayor’s Task Force Report
• Our attempt to place the risks into perspective
ChemRisk
Risk Characterization
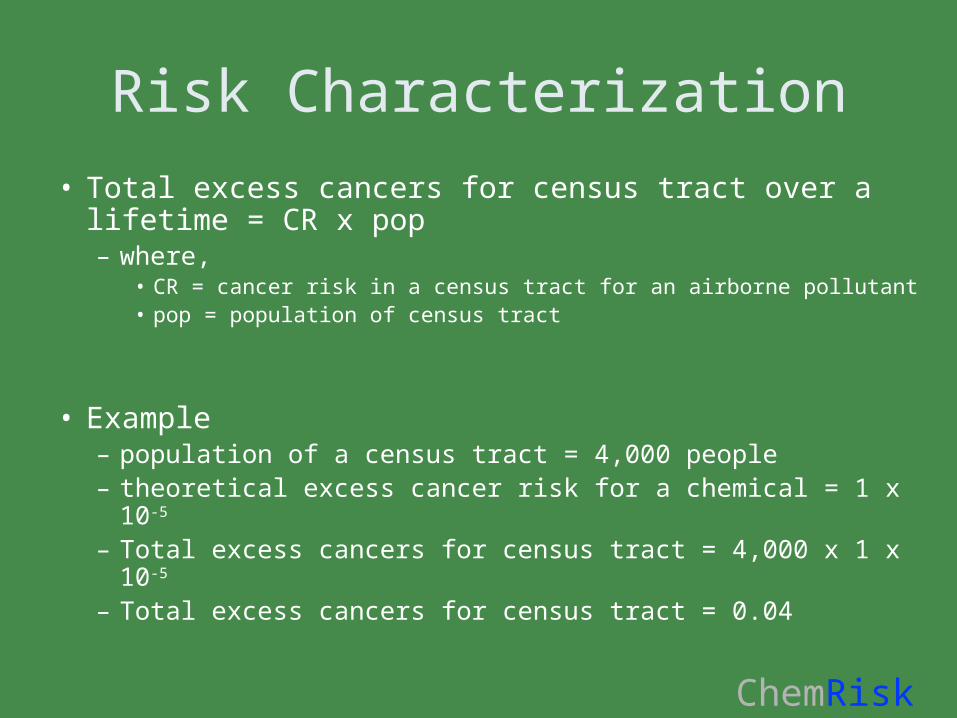
• Total excess cancers for census tract over a lifetime = CR x pop– where,
• CR = cancer risk in a census tract for an airborne pollutant• pop = population of census tract
• Example– population of a census tract = 4,000 people– theoretical excess cancer risk for a chemical = 1 x 10⁻⁵
– Total excess cancers for census tract = 4,000 x 1 x 10-5
– Total excess cancers for census tract = 0.04
ChemRisk
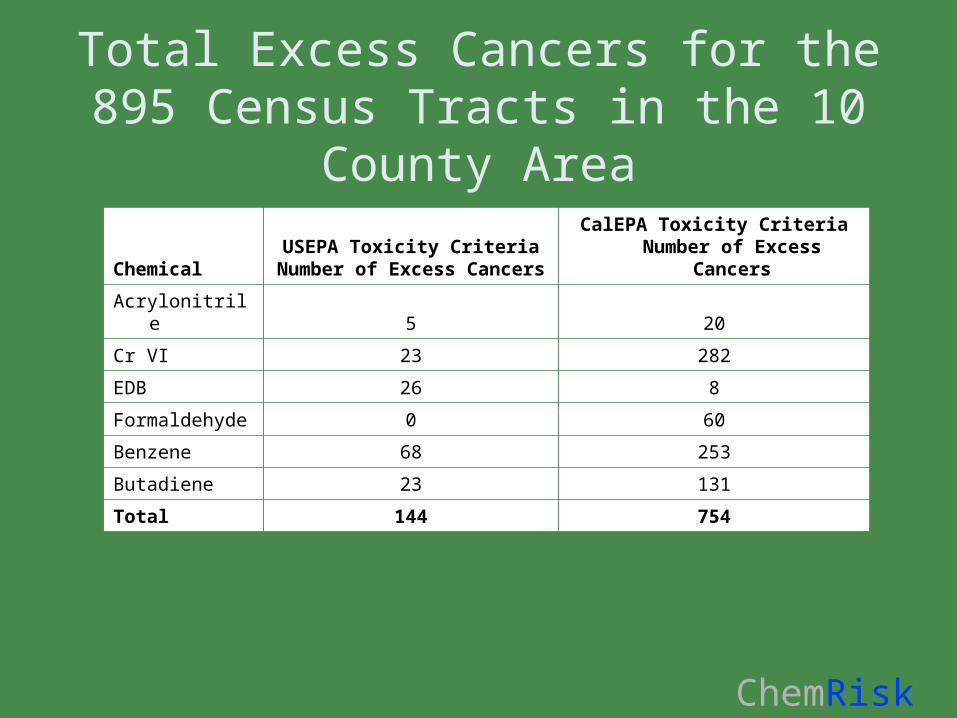
Total Excess Cancers for the 895 Census Tracts in the 10 County Area
ChemicalUSEPA Toxicity Criteria
Number of Excess CancersCalEPA Toxicity Criteria Number
of Excess Cancers
Acrylonitrile 5 20
Cr VI 23 282
EDB 26 8
Formaldehyde 0 60
Benzene 68 253
Butadiene 23 131
Total 144 754
ChemRisk
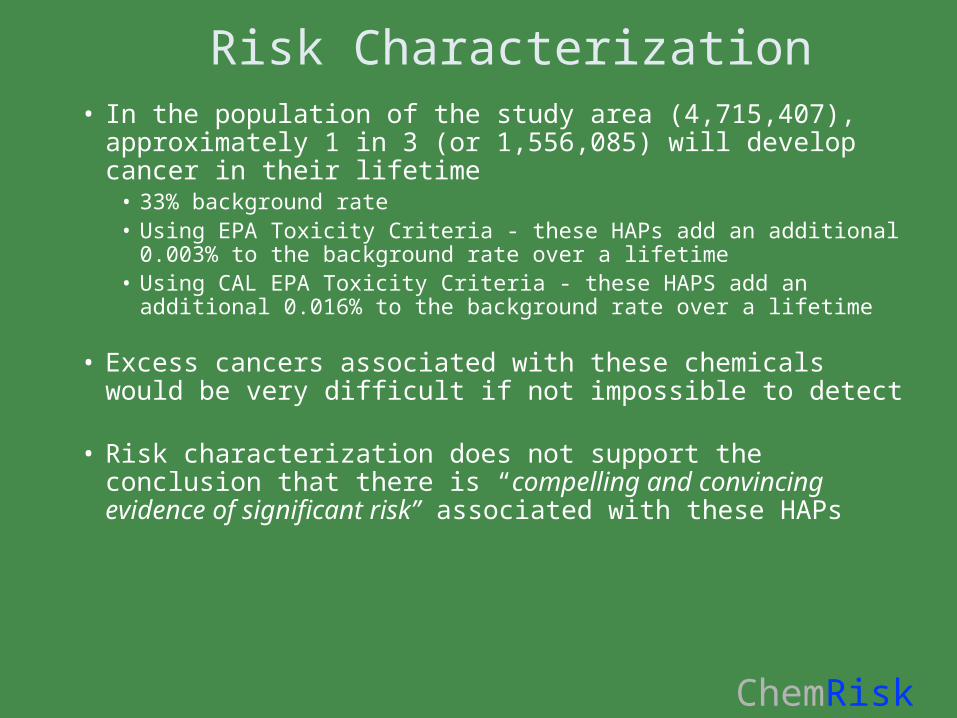
Risk Characterization• In the population of the study area (4,715,407), approximately
1 in 3 (or 1,556,085) will develop cancer in their lifetime• 33% background rate• Using EPA Toxicity Criteria - these HAPs add an additional 0.003% to
the background rate over a lifetime• Using CAL EPA Toxicity Criteria - these HAPS add an additional
0.016% to the background rate over a lifetime
• Excess cancers associated with these chemicals would be very difficult if not impossible to detect
• Risk characterization does not support the conclusion that there is “compelling and convincing evidence of significant risk” associated with these HAPs
ChemRisk
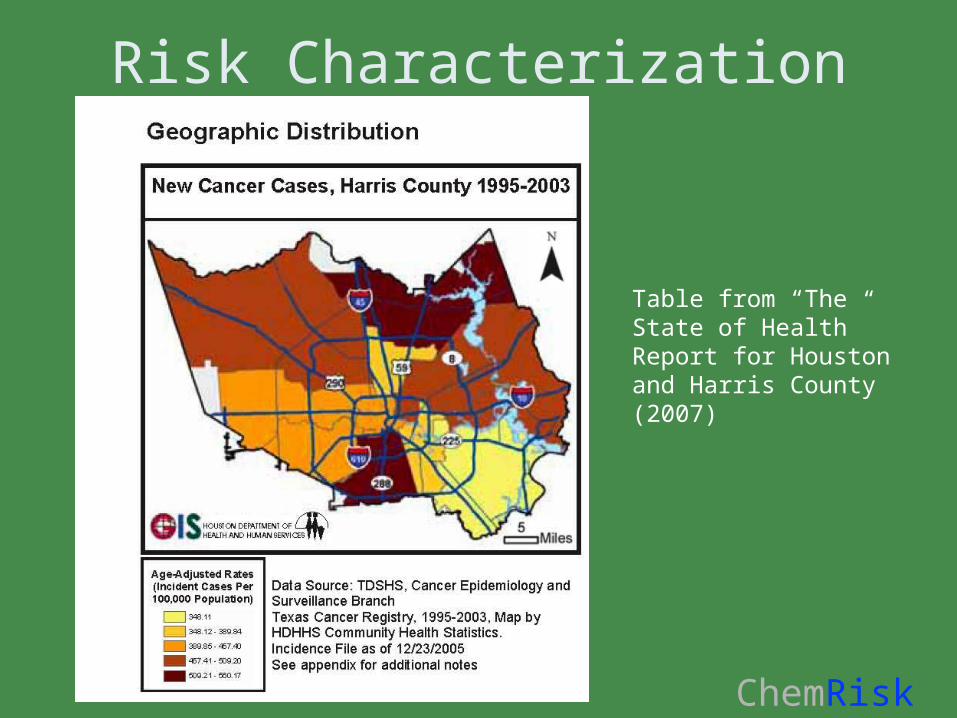
Risk Characterization
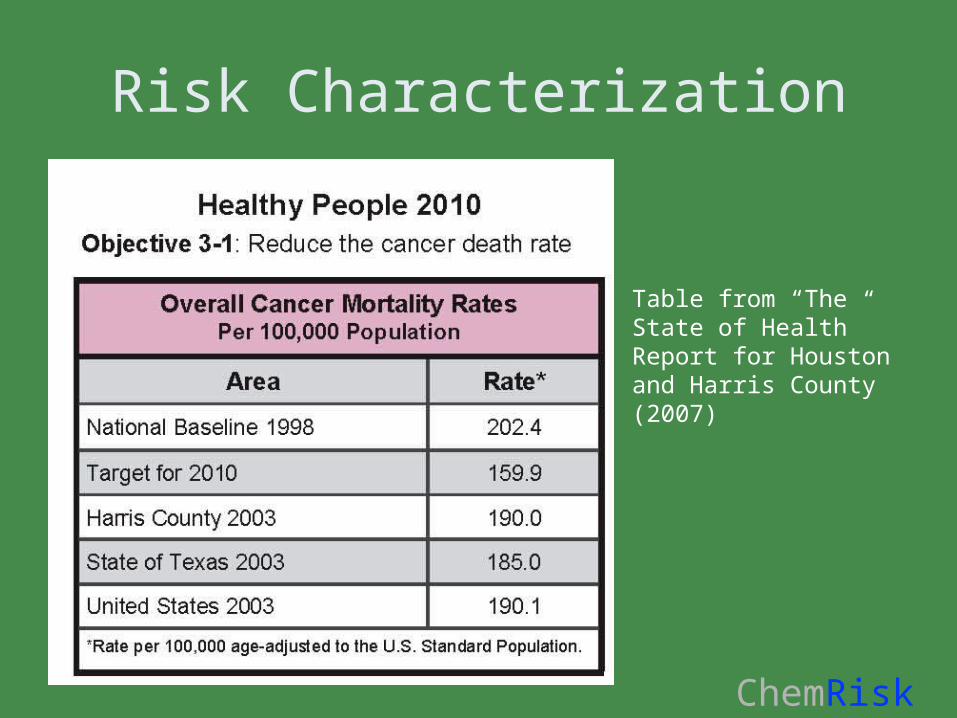
Table from “The State of Health” Report for Houston and Harris County (2007)
ChemRisk
Risk Characterization
Table from “The State of Health” Report for Houston and Harris County (2007)
ChemRisk
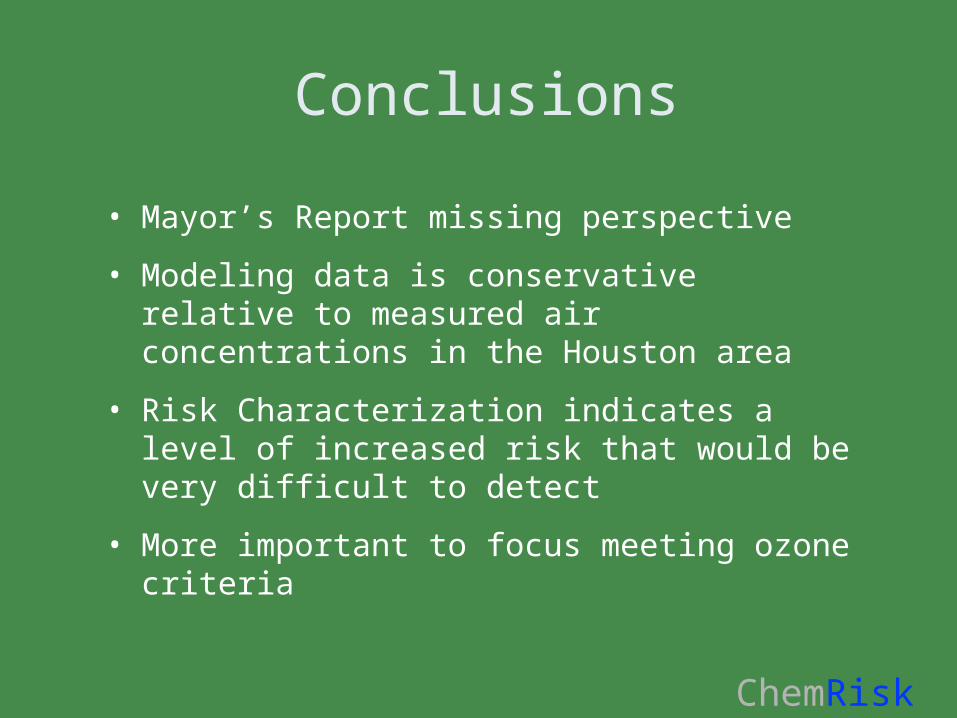
Conclusions
• Mayor’s Report missing perspective
• Modeling data is conservative relative to measured air concentrations in the Houston area
• Risk Characterization indicates a level of increased risk that would be very difficult to detect
• More important to focus meeting ozone criteria

ChemRisk
Co-Authors
• Dr. Laurie Haws
• Mr. Andrew Tachovsky
• Dr. Spencer Williams
• Ms. Ly Nguyen
• Ms. Laura Scott
ChemRisk
Thank you!
• Are there any questions?
• For further information:Mark Harris, Ph.D.
Principal Health Scientist
ChemRisk, Inc.
10375 Richmond Ave, Suite 350
Houston, TX 77042
phone: 713-974-6200 ext. 1001
fax: 713-974-6111
email: [email protected]