Embed Size (px)
Citation preview

Mark Scheme (Results)
Summer 2010
GCE
GCE ECONOMICS (6EC01) Paper 01
Edexcel Limited. Registered in England and Wales No. 4496 50 7 Registered Office: One90 High Holborn, London WC1V 7BH

Edexcel is one of the leading examining and awarding bodies in the UK and throughout the world. We provide a wide range of qualifications including academic, vocational, occupational and specific programmes for employers.
Through a network of UK and overseas offices, Edexcel’s centres receive the support they need to help them deliver their education and training programmes to learners.
For further information, please call our GCE line on 0844 576 0025, our GCSE team on 0844 576 0027, or visit our website at www.edexcel.com.
If you have any subject specific questions about the content of this Mark Scheme that require the help of a subject specialist, you may find our Ask The Expert email service helpful. Ask The Expert can be accessed online at the following link: http://www.edexcel.com/Aboutus/contact-us/ Alternatively, you can speak directly to a subject specialist at Edexcel on our dedicated subject* telephone line: 0207 190 5329
Summer 2010
Publications Code US023768
All the material in this publication is copyright © Edexcel Ltd 2010
NB: candidates may achieve up to 3 explanation marks even if incorrect option is selected. NB: candidates may achieve up to 3 marks for explaining three incorrect options (provided three different reasons are offered and each option key is explicitly rejected). Qu tes ion Number
An esw r Mark
1 Answer C (1) • Definition of production possibility frontier (the maximum output
combinations an economy can achieve when all its resources are fully / efficiently employed) (1)
• Definition of opportunity cost (the value of the next best alternative
foregone) (1) • Diagrammatic analysis or explanation of opportunity cost, e.g. depicting a
jection marks
by the price mechanism and are not shown on a production possibility frontier. (1)
(4)
movement along the production possibility frontier and showing the loss of output for one good and gain of another good (1+1)
Re• Option A is incorrect since external costs are those costs not taken
into account
• Option B or D incorrect since producer surplus / equilibrium price is shown by use of a demand and supply diagram. (1)
Question Number
Answer Mark
2 An• means a decrease in production costs
• Increase in incentives to produce (1)
a correctly labelled diagram depicting an increase in supply fall in market price (1+1) OR identifying that the supply of gold
will increase. (1)
arks
rds / to the right / increase the price of gold. (1)
in the price of silver will cause a
(4)
swer D (1) A decrease in the machinery costs for mining gold. (1)
• Award for and a
Rejection m
• Option A is incorrect since an increase in national income will shift the demand curve outwa
• Option B is incorrect since a decrease
decrease / shift inwards in the demand for gold – a substitute good. (1)

•inward shift in the supply curve for gold so price
increases. (1)
Option C is incorrect since an increase in wages of gold miners will lead to a decrease /
Question Number
Answer Mark
3 An• Definition of consumer surplus (the difference between the price one is
prepared to pay for a good and the actual price / market price paid) OR (the area above the equilibrium price and below the demand curve). (1)
• Identification of original consumer surplus as £500 / further
development using a numerical example(1)
• Definition of VAT (a tax placed on the expenditure / a tax set as a percentage of the price of a good) or indirect tax (1)
Diagrammatic analysis depicting an outward shift in supply curve (either
sumer +1) (accept parallel shift in
supply) Re
Option A is incorrect since an increase in wages to cruise holiday ruise
o is incorrect since a decrease in the number of companies in the
industry may shift the supply curve inwards and so raise the price of se holidays (1).
)
swer B (1)
• Explanation that a reduction in VAT will reduce the price of cruise
holidays and so lead to an increase in consumer surplus. (1)
• showing the original consumer surplus / the new level of consurplus / the change in consumer surplus) (1
jection marks o
workers will increase production costs / possibly raise the price of cholidays – reducing consumer surplus. (1)
o Option C is incorrect since an increase in price of cruise holidays to
£3000 will eliminate Neringa’s consumer surplus. (1)
Option D
Caribbean crui
(4
Question Number
Answer Mark
4 Afirms to increase
production / reduce price of a good) (1)
•
nswer C (1) • Definition of a subsidy (Government grant to
Unit subsidy × quantity is £3 × 150 = £450 (accept other methods of calculating subsidy) (2)

• Annotation of diagram to show subsidy area (but must be labelled)(1) • Award for identifying unit subsidy as the vertical difference between the
es OR £3 (1) Re
Option B is incorrect as this is the consumer subsidy. (1)
• this is the total consumer expenditure on the good plus the government subsidy. (1)
(4)
supply curv
jection marks • Option D is incorrect as
Question Number
Answer Mark
5 A• of demand (the responsiveness in
demand for one good due to a change in price of another good or %∆QD good B ÷ %∆P good A) (1)
• Games console and software games are complementary goods / joint
demand. (1)
• Complementary goods have a negative cross elasticity of demand. (1)
ice of games consol will cause an increase in the demand for
Re
Option A is incorrect since lamb and chicken are substitutes with a
demand for the other. (1)
be unrelated goods / inferior goods / they have a zero cross elasticity of
• Option D is incorrect since leather and beef are in joint supply. (1)
)
nswer C (1) Definition or formula of cross elasticity
• A fall in prcomputer software games. (1)
jection marks •
positive cross elasticity of demand / a decrease in price of one will cause a decrease in
• Option B is incorrect since bus travel and potatoes are likely to
demand. (1)
(4
Question Number
Answer Mark
6 Answer D (1)
ld in the market. (1)
rbon permits inwards and so increases its price (1+1) OR written explanation that a decrease in the supply of permits will lead to a rise in price. (1)
• Definition / understanding of tradable pollution permits, e.g. an allowance on the amount of pollution firms may emit which can be bought and so
• Relevant diagrammatic analysis which shifts the supply curve for ca

• Higher price of permits increase the cost of polluting or act as an
r firms to reduce their pollution. (1)
• additional permits rather than fund
cleaner technology / install clean production methods. (1+1) Re•
to lead to a fall in price and so firms have less incentive to reduce
Option B is incorrect since major polluting industries such as air travel
• Option C is incorrect since some firms may deliberately exceed / ignore
rmits as there is little chance of paying for it. (1)
)
incentive fo A low market price means firms have little incentive to reduce pollution / it might be cheaper to purchase
jection marks Option A is incorrect since an excess supply of pollution permits is likely
pollution emissions. (1)
•should be included in the carbon trading scheme so that less pollution is emitted. (1)
their carbon pe
(4
Question Number
Answer Mark
7 A•
ood once it is provided) NB: Only award if reference made to the inability for charging consumers. (1)
• s market failure. (1)
• Definition of public goods (non-excludable and non-rivalry) (1)
a public good, for example, light house, pavements, street
Rejection marks
ther rovision / increase market failure. (1)
o not relevant. (1)
• l rease market failure / increase the gap between the market
equilibrium and social optimum position / examples of goods which yield such as tobacco smoking, alcohol consumption or private
)
nswer A (1) Explanation of the free rider problem (difficulty in charging people for consuming a g
The free rider problem leads to under-provision of a good and so i
• Example oflighting, flood defence scheme, national defence and public firework display. (1)
• Option B is incorrect since taxation of public goods will lead to a furreduction in their p
• Option C is incorrect since luxury goods are private goods and s
Option D is incorrect since subsidies to goods which yield high externacosts will inc
external costs motoring. (1)
(4

Question Number
Answer Mark
8 Answer B (1) • Definition of market failure (the price mechanism fails to allocate
resources efficiently / inefficient allocation of resources / the price mechanism leads to a welfare loss) (1)
• Definition of external benefits (benefits external to an exchange /
positive third party effects / benefits outside of a transaction / difference between social and private benefits / benefits the price
anism ignores) (1)
on of under-consumption of education / explanation of this
• university education for QeQ1
students (1)
•
Identification of market equilibrium position MPB=MPC / identification of
NB output Qe and social optimum at utput Q1 without reference to MSB/MSC/MPB/MPC then award 1 mark
• correct since the free market quantity 0Qe is less than the
)
mech
• Identificatie.g. a more productive workforce. (1)
Social benefit exceeds social cost of
Identification of welfare gain or loss triangle is ZYX or annotation of diagram (1)
•social optimum equilibrium position MSB=MSC (1+1) : Just identifying market equilibrium at
o
Rejection marks
Option A is in
(4

social optimum number of students 0Q1. (1)
• ZYX. (1)
es / pivots as the quantity of students increase. (1)
Option C is incorrect since the triangle of welfare gain is
• Option D is incorrect since the marginal external benefit increas
Question Number
Answer Mark
9(a) • Direct reference to food price increase in Figure 1 e.g nominal price rise from 100 to more than 200 / real price rise from 100 to 160. (1) The increase in price of food caused by: • Increase in demand due to global population growth / increase in incomes in developing countries (1+1) Either of these points may be developed to achieve 2 marks, e.g. reference to positive income elasticity of demand for food / normal good.
arks available for explaining increased demand.
B: 2 marks available for explaining decreased supply. ply and/or demand (1).
explanation / data reference.
NB: 2 m
• Decrease in supply due to increased costs of production / e.g. rising fuel prices, farm machinery and animal feed (1+1). N• Accept a reference to inelasticity of sup NB: Award a maximum of 5 marks for

Diagram up to 4 marks:
Original demand & supply diagram with equilibrium price(1) Increase in demand curve (1)
y curve (1)
NB w s for the diagram if just one curve
Decrease in suppl New equilibrium price (1)
: A ard a maximum of 2 mark
is c
(8)
orrectly shifted.
Price
Question Number
Answer Mark
9(b) Award up to 4 marks for KAA come households likely to be hit the hardest since:
Price elasticity of demand is inelastic / basic necessity / so an will cause an increase in total spending on
refers to a ‘shortage of affordable food’ / suggesting it
• Dema
• Low in
increase in food price food (1+1)
They spend a higher proportion of their income on food than other income groups / consequently spend less on other goods. (1+1) The extractis the basics which are rising in price such as bread, potatoes, vegetables, rice and fruit. (1+1)
nd for food is income inelastic / the percentage change in spending
D
S S1
P1
e
0 Q1 Qe Quantity
D1
P

on fo nge in income (1+1)
• ase of more than 100%.
• me falling.
• n price of luxury foods may have little impact on low ly to purchase these types of food.
nal welfare
)
od is less than the percentage cha
Evaluation (2 marks) Magnitude of the increase in food prices / significant incre
Discussion of real inco• Discussion of households switching to inferior goods / lower priced
alternatives.• Composition / size of household. • It depends on the meaning of ‘households on low incomes’. An increase iincome households who are unlike
• Government may respond by offering food subsidies / additiopayments.
(6
Question Number
Answer Mark
9(c) Award up to 4 marks for KAA: tion / understanding of price elasticity of demand. (1)
lastic demand (the proportionate change in
his may be shown by a diagram. (1)
•
• Numerical application of price inelastic demand. (1)
• Food is price inelastic in demand as spending on it comprises relatively
• ems such as caviar / eating out at
restaurants may be price elastic in demand. broad and narrow definition of food (food as a whole is
• / depends on whether a
6)
• Defini
• Understanding of price inedemand is less than the proportionate change in price). T
Food likely to be price inelastic in demand as a whole since essential good / necessity. (1)
• No substitute for food (1)
small proportion of total income (1)
Evaluation (2) Depends on type of food / luxury it
• Discussion of price inelastic in demand). Comparison of different income groups developed or developing country.
(
Question Number
Answer Mark
9(d) Award up to 6 marks for KAA:
• Definition of minimum price (e.g. the minimum price below which the a floor price)(1)
price of a good cannot fall /
Price
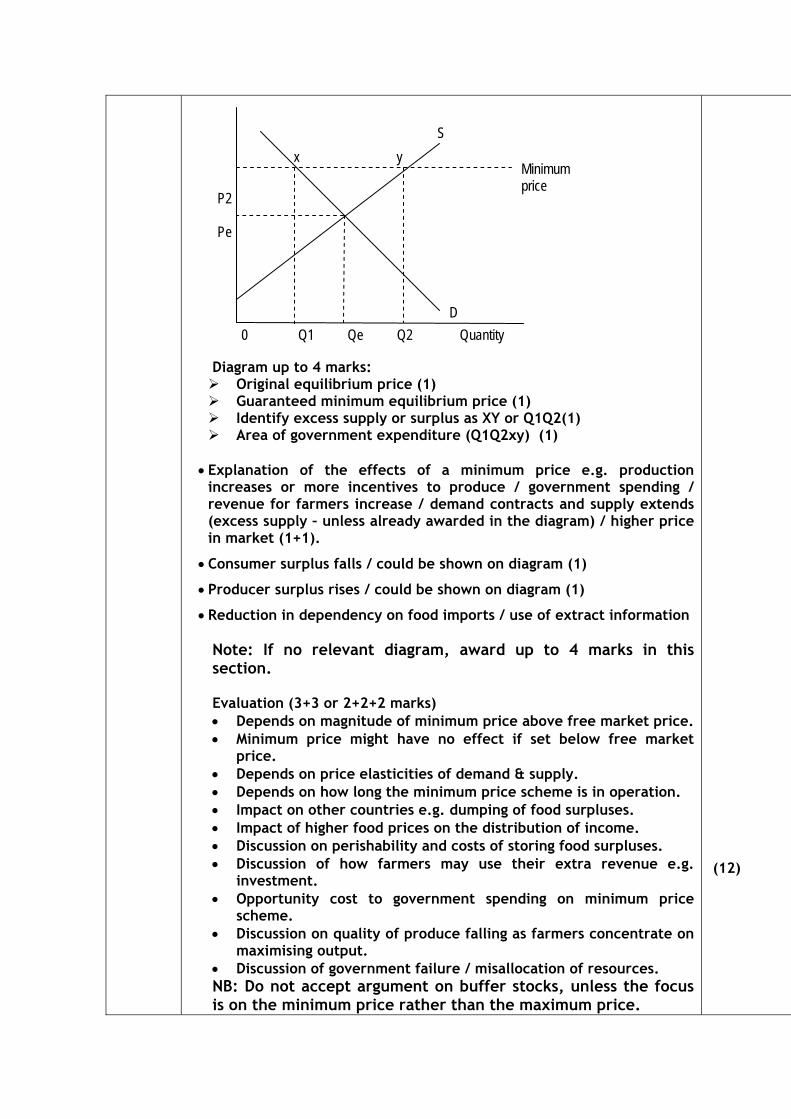
Diagram up to 4 marks: Original equilibrium price (1) Guaranteed minimum equilibrium price (1) Identify excess supply or surplus as XY or Q1Q2(1) Area of government expenditure (Q1Q2xy) (1)
• Explanation of the effects of a minimum price e.g. production
increases or more incentives to produce / government spending / revenue for farmers increase / demand contracts and supply extends (excess supply – unless already awarded in the diagram) / higher price in market (1+1).
• Consumer surplus falls / could be shown on diagram (1)
• Producer surplus rises / could be shown on diagram (1)
• Reduction in dependency on food imports / use of extract information
Note: If no relevant diagram, award up to 4 marks in this section. Evaluation (3+3 or 2+2+2 marks) • Depends on magnitude of minimum price above free market price. • Minimum price might have no effect if set below free market
price. • Depends on price elasticities of demand & supply. • Depends on how long the minimum price scheme is in operation. • Impact on other countries e.g. dumping of food surpluses. • Impact of higher food prices on the distribution of income. • Discussion on perishability and costs of storing food surpluses. • Discussion of how farmers may use their extra revenue e.g.
investment. • Opportunity cost to government spending on minimum price
scheme. • Discussion on quality of produce falling as farmers concentrate on
maximising output. • Discussion of government failure / misallocation of resources. NB: Do not accept argument on buffer stocks, unless the focus is on the minimum price rather than the maximum price.
12)
(
S x y
Minimum price
P2 Pe
D 0 Q1 Qe Q2 Quantity

Question Number
Answer Mark
9(e)(i) • Maximum of 2 marks available for private costs • Definition of private costs: (1+1) Costs internal to an exchange or a transaction / costs which the price
mechanism take into account / costs to the consumer or producer directly for a good or service / financial cost or monetary cost to consumers or producer.
Identification of an example of private cost e.g. wages, raw materials, rent and purchase of machinery (1).
NB: ‘cost to the individual or firm’ is not enough for awarding a mark. Maximum of 2 marks available for external costs • Definition of external costs (1+1) • Costs external to an exchange or transaction / costs which the price
mechanism fail to take into account / negative third party effects / difference between social costs and private costs.
• Identification of an example of external costs e.g. pollution, congestion (1)
• Diagram showing private, external and social costs (1).
(4)
Question Number
Answer Mark
9(e)(ii) Award up to 6 marks for KAA NB: No marks for definitions of private costs and external costs as these have already been awarded in Q9e(i) • Application of private costs of intensive farming / GM farming e.g.
research and development costs / labour costs / raw materials / machinery costs (1+1).
• Application of external costs e.g. worse quality of food / public health
issues / reduction in bio diversity / animal welfare / pesticides in rivers (1+1 marks).

Diagram up to 4 marks:
Original MB and MPC curves (1) MSC curve (accept a parallel shift of the MSC curve) (1) Identification of market equilibrium and socially efficient quantity (1) Identification of triangle of welfare loss (1)
NB: 1 mark available if a demand and supply diagram is shown with supply shifting to the right, or written explanation to this effect. NB: If no relevant diagram, award up to 4 out of 6 marks in this section.
Evaluation (3+3 or 2+2+2) NB: if candidates refer to both positive or negative effects then accept one side for KAA and the other for evaluation. • Discussions of short run versus long run; GM farming may endanger food
production in long run if smaller gene pool / intensive farming may damage soil fertility in long run.
• Discussion of loss of rare varieties of food products. • Discussion of magnitude of intensive / GM farming. The UK is only half
self-sufficient in food production and has acute shortage of farmland / perhaps GM farming has to be on a massive scale to have much impact.
• Discussion of the welfare loss triangle e.g. social costs outweighs social
benefits for the marginal output QeQ1. • Discussion of various benefits from intensive farming and genetically
modified crops. These include: Increase food production and so reduce danger of shortage / help protect against climate change / lower prices / increase consumer
(12)
Price MSC
MPC
Triangle of welfare loss
P1 Pe
MPB=MSB
0 Q1 Qe Quantity of GM food
surplus and help low income groups / provide surpluses for people in developing countries / increase farm revenues and stabilise food prices / less pressure on grazing land in developing world.
• Discussion of imperfect market knowledge / uncertainty over long-term
impact of GM farming. • Discussion on whether costs outweigh benefits / cost-benefit analysis
may be needed. • Discussion of government regulations on GM farming to protect
consumers. • UK only produces 48% of its food so intensive / GM farming may be a
necessary evil. • Intensive / GM farming may not have to be undertaken if people are
more careful on consuming food they buy rather than throw so much away as mentioned in extract (lines 22 & 23); one-third of all food is thrown away.
Question Number
Answer Mark
10(a)(i) Explanation of a decrease in sales up to 6 marks KAA:
• Total revenue likely to decrease (do not award for stating decrease in demand)(1)
• Data reference to Figure 1 e.g. fall in car sales from 2.4 million (2007)
to 2.26 million (2008) or 2.16 million (2009). Be prepared to accept reference to falling car sales of 21.8% in the first 3 months of 2009. (1)
• This is because price decreases and quantity decreases (1) • Definition of total revenue (total revenue gained by selling a given
quantity of cars or price × quantity) (1)

Diagram up to 4 marks:
Original demand and supply curves with equilibrium price(1) Decrease in demand curve (1) Original revenue (PeXQe0) OR (Pe x Qe)(1) New total revenue (P1YQ10) OR (P1 x Q1)(1)
Note: If no diagram, award up to 4 marks in this section. Note: If the supply curve as well as demand curve is shifted, award a maximum of 2 marks.
(6)
Price
S
x Pe
Y P1 D
D1 0 Q1 Qe Quantity
Question Number
Answer Mark
10(a)(ii) Explanation KAA up to 4 marks • Demand for car workers will decrease (1) • Decrease in employment of car workers (1) • Decrease in wage rate of car workers or pay freeze (1)
NB: Alternatively this may be shown by diagrammatic analysis of the labour market depicting an inward shift in the demand for labour / lower wages and employment (award 3 marks). Do not double award for both explanation and diagram.
NB: If two diagrams are shown – one for the car market and one for the car worker labour market which shows a decrease in demand for both (award 4 marks).
• Labour is a derived demand / demanded not for its own sake but for the
goods it produces (1+1). • Data reference e.g. Nissan announced 1200 redundancies / Toyota has
halved production shifts / Honda has reduced wages / GM may close its plants (1).
• Change in working conditions e.g. shorter working week / flexible hours
/ sabbaticals / enforced holidays through temporary closure / underemployment (1+1).
Evaluation (2 marks)
• Magnitude of decrease in demand – very significant here. It may require
retraining to provide new skills for car workers so they can move into different occupations.
• Short run and long run implications e.g. Vauxhall may be seeking to hold
on to its workforce by offering sabbaticals in anticipation of an upturn in sales.
• Discussion on elasticity of demand or supply of labour.
• Accept idea of an increase in demand for second hand car sales people
or car mechanics. • Accept idea that wage rates may not fall too much due to the national
minimum wage / strength of trade unions. Government grants / loans may reduce impact of job losses.
(6)
Question Number
Answer Mark
10(b) Explanation of KAA up to 6 marks Candidates may refer to both geographical and occupational mobility / immobility of labour.

• Explanation / understanding of geographical immobility / mobility of
labour (difficulty in relocating to other regions to take available work) (1)
• Geographical mobility of labour will depend on individual e.g. age /
family circumstances / knowledge of available jobs in other localities / house price differentials and rental differentials / removal costs (1+1+1).
• Data reference e.g. Magna motor vehicle plants at Luton and Ellesmere
Port – areas of high unemployment and so a labour immobility problem (1).
• Explanation / understanding of occupational immobility / mobility of
labour (difficulty in car workers taking available work in different occupations) (1)
• Occupational mobility may be quite low as car work is highly specialised
/ occupational mobility is low and so retraining courses may be required for car workers / lack of government funds available for retraining / discussion on transferable skills (1+1+1).
• Discussion on temporary plant closures – which may have little effect on
mobility of labour if they reopen (1). Use of real life example (1)
(6)

Question Number
Answer Mark
10(c) Explanation KAA up to 4 marks: • Definition or formula of income elasticity of demand (responsiveness of
demand for a good due to a change in income). (1) • Demand for new cars appear income elastic since proportionate change
in demand is greater than the proportionate change in income / OR YED is greater than 1 / OR use of figures (1)
• Reference to the data: 1% fall in income has lead to a 21.8% fall in
demand (1). • Calculation of income elasticity of demand is 21.8 (1).
NB Do not award if answer states 21.8% • Cars are a normal good (accept luxury) / they have a positive income
elasticity of demand (1). • Diagram depicting income elastic demand for new cars (1)
Evaluation (2) • Depends on type of car e.g. luxury cars may have a different income
elasticity of demand than smaller cars. • Discussion of second hand cars which may be less income elastic in
demand. They may even be inferior goods. • YED for cars may change over time. • People unlikely to purchase new car if uncertainty over future
employment prospects and lack of consumer confidence (income elastic).
• Other factors e.g. the availability of finance might also be significant in
determining changes in demand.
(6)
Question Number
Answer Mark
10(d) Explanation KAA of positive economic effects up to 6 marks (2+2+2 or 3+3): NB Candidates may present either positive or negative effects of the car scrappage scheme for KAA marks. Accept presentation of the alternative view as evaluation. • Benefits to motor vehicle firms include increase in sales, revenue and
profits. Prevention of closure of factories. • Benefits to motor vehicle scrap dealers. • Benefits to motor vehicle workers include saving jobs or reducing the
amount of redundancies. • Benefits to consumers include cheaper prices and more consumer
surplus. • Benefits to government or macroeconomic arguments e.g. include less
expenditure on unemployment-related benefits if redundancies reduced / possible fiscal neutral scheme as car sales bring in tax revenue.
• Benefits to environment shown in Figure 2 in reduced CO2 emissions /
less external costs. Evaluation (2+2+2 or 3+3) This may refer to the costs of the scheme or reasons why the positive effects are not so significant / limitations of the car scrappage scheme.
• Benefits not so significant since motor vehicle firms have to pay half of
the grant to consumers / this could reduce profit margins and future investment.
• Domestic car manufacturers may not benefit much since eight out of ten
cars purchased are imported / however, UK car component suppliers may benefit more.
• The more expensive car models are unlikely to benefit much from
increased demand e.g. Jaguar and Land Rover, compared to the smaller, cheaper models of Ford Fiesta and Toyota Yaris.
• Limited funding of scheme (just £300 million compared to the German

government’s £4.49 billion) / limited time span / job losses still being announced in motor vehicle industry.
• Consumers are already receiving price discounts / so these could be
simply transferred to the scrappage scheme. Some consumers may have bought new cars without the scheme / danger that firms raise prices and then lower them again so no real change in car prices.
• Opportunity cost to government: taxpayers may lose out in form of
higher taxes. • There are significant CO2 emissions in the production of motor vehicles /
it may be more environmentally friendly to use existing cars rather than scrap for new ones.
(12)
Question Number
Answer Mark
10(e) Explanation KAA up to 6 marks • Definition of fuel duty / indirect tax (tax on expenditure of fuel) (1) • Explanation of diagram, e.g. decrease in motoring costs /encourage
more consumption and production (1)
• Diagram (Up to 4 marks)
Original demand & supply curve with equilibrium price and quantity (1)
Outward shift of supply curve (1) New equilibrium price and quantity (1) Demand is price inelastic (1) Total expenditure on fuel is reduced (1) Identify the tax per unit (1)
Note: If no diagram, or one which does not implicitly refer to fuel market then award up to 4 marks in this section. Note: If MPC, MSC and MB diagram used with tax being shown, award up to 4 marks.
Price
S
S1 Pe
D
P1
0 QeQ1 Quantity

• Reference to public transport, where there may be an increase or
decrease in demand (1) • Fuel and cars are complementary goods / a fall in price of fuel will
increase demand for cars (1+1) • Benefit to the motor vehicle industry, e.g. more revenue and profits
(1) • Lower fuel prices may increase mobility of labour (1) • Benefit to low income motorists (1) • Accept macroeconomic argument, e.g. increased employment and
incomes via the multiplier, impact on inflation (up to 2 marks) Evaluation (2+2+2 or 3+3) Candidates may refer to positive and negative effects of the fuel tax decrease for evaluation. • Magnitude of tax decrease. Tax still comprises the majority of fuel price
at the pump. • Discussion of price elasticity of demand for fuel; it may be price inelastic
and so have little impact for motorists. • Discussion of a reduction in possibility of fuel tax protests. Less
disruption to economy. • Impact on economic recovery. It could increase investment in motoring
industry / road transport industry. • Other factors may affect the impact of falling fuel prices, e.g.
availability of loans to purchase cars. • Increase road traffic congestion. This could lead to higher transport
costs in long run / increased negative externalities such as air and noise pollution.
• Impact on government finances, e.g. it may worsen since demand for
fuel is price inelastic.
(12)

Further copies of this publication are available from Edexcel Publications, Adamsway, Mansfield, Notts, NG18 4FN Telephone 01623 467467 Fax 01623 450481 Email [email protected] Order Code US023768 Summer 2010 For more information on Edexcel qualifications, please visit www.edexcel.com/quals Edexcel Limited. Registered in England and Wales no.4496750 Registered Office: One90 High Holborn, London, WC1V 7BH