Embed Size (px)
Citation preview

Market and Regional Segmentation and Risk Premia
in the First Era of Financial Globalization
David Chambers Cambridge University
Sergei Sarkissian McGill University
Michael J. Schill *
University of Virginia
June 11, 2015
__________________ * Chambers is from the Judge Business School, Cambridge University, Cambridge, CB2 1AG, UK. Sarkissian is
from the McGill University Faculty of Management, Montreal, QC H3A 1G5, Canada, and Yerevan State
University, 0025 Yerevan, Armenia (visiting). Schill is from the Darden Graduate School of Business
Administration, University of Virginia, Charlottesville, VA 22906, USA. Chambers may be reached at
[email protected], Sarkissian may be reached at [email protected], and Schill may be reached at
[email protected]. We appreciate the comments of Olivier Accominotti, Effi Benmelech, Nicholas Crafts, Elroy
Dimson, Marc Flandreau, Andrew Karolyi, Piotr Korczak, Naomi Lamoreaux, Larry Neal, Raghu Rau, Peter
Rousseau, Oleg Rytchkov, Pedro Saffi, Marc Weidenmier, Eugene White, and Mira Wilkins as well as participants
at the Edinburgh Corporate Finance Conference, Northern Finance Association meeting, Quebec City, Western
Economic Association meeting, San Francisco, the Economic History Association meeting, Vancouver, the FMA
Napa Conference, the Cambridge-Princeton Annual Finance Workshop, and a workshop at the University of
Virginia. Special thanks go to Lauren Bost, John Garcia, Michael Hiltrop, Olga Ivinskaya, Yunki Kim, Erin Marsh,
Danila Pankov, Florence Pei, Giorgio Vintani, and Matthew Zalar for excellent research assistance. Chambers
acknowledges financial support from the Newton Centre for Endowment Asset Management and the Cambridge
Endowment for Research in Finance, Sarkissian acknowledges financial support from SSHRC, and Schill
acknowledges financial support from the Darden School Foundation.

1
Market and Regional Segmentation and Risk Premia
in the First Era of Financial Globalization
Abstract
This paper studies the financing effects of U.S. railroad investments through active issuance of
London listed bonds in 1870-1913. The selected industry and time period provide a natural
experiment to analyze foreign listing benefits due to the unique geography-specific nature of
railroad assets and the precision of cost of capital gains attributable to bond yields. The
segmentation premium, which is over 80bps in the early 1870s, declines to almost zero by 1910s,
consistent with diminishing through time foreign listing gains as information costs fell and
markets became more integrated. The cross-listing significance for both borrowing costs and
financing constraints is lower for U.S. railroads from remote areas. These results offer novel
evidence on the importance of geography and information costs for global financial
opportunities.
JEL Classification: F36; G15; G30; O16
Keywords: Global risk sharing; Market barriers; Investment-cash-flow sensitivity; Stock
exchanges

2
1. Introduction
In 1913, stock markets were at least as well developed, relative to the size of their
respective national economies, as they were at the end of the 20th
century (Rajan and Zingales,
2003). This reflected the tremendous growth in international capital flows and early moves
toward Transatlantic market integration during the first era of financial globalization over the
half century to 1913. Railroads, the leading industry in the United States during this period, were
a major beneficiary from international capital flows, and railroad services grew at three times the
national income over the seven decades up to World War 1 (WW1, Fishlow, 1966: 626-628).
In this paper, using a hand-collected sample of U.S. railroad companies from 1870 to
1913, and their foreign bond and stock listings on the London Stock Exchange, we examine the
role of foreign markets in reducing the cost of capital and in relaxing the financing constraints of
domestic firms. Specifically, we focus on variation in the degree of market integration across
U.S. regions with the London financial market during our sample period.
Geography has long been characterized as playing an important role in capital market
development. Distance can create frictions in connecting market participants including, but not
limited to, explicit institutional barriers, physical exchange costs, as well as information and
monitoring costs (John, Knyazeva, and Knyazeva, 2011). These frictions can substantially
segment markets and, therefore, have significant effects on the price of capital (e.g., see Solnik,
1974; Errunza and Losq, 1985). The foreign listing decision is a particularly interesting
laboratory to explore the relation between geography and finance as it represents a conscious
choice by firm management to position the securities of the firm outside the local market for
some benefit. A fundamental motive for foreign listing is the overcoming of market
segmentation by “home-delivering” the securities to a segmented market’s clientele. In this way,
investors, who previously were excluded from holding foreign securities, become able to invest

3
in them and share global risk, thus reducing the cost of capital for the home firm (e.g., see
Alexander, Eun, and Janakiramanan, 1988; Foerster and Karolyi, 1999).1
Models of market segmentation predict a super risk premium on the cost of capital for
firms with rationed investors (Errunza and Losq, 1985; Merton, 1987). The magnitude of such
effects, however, has been difficult to assess. Foreign listing is an important instrument that has
been used to estimate the impact of market segmentation since it effectively allows a firm to span
potentially segmented markets. However, empirical tests conducted using current samples of
foreign stock listings (Miller, 1999; Foerster and Karolyi, 1999; and Hail and Leuz, 2009) have
been criticized for being confounded with other effects of cross-listing such as gains in legal or
information disclosure (e.g., Doidge, Karolyi, and Stulz, 2004, 2007) and being contaminated
with transitory price reactions (Gozzi, Levine, and Schmukler, 2005; Sarkissian and Schill, 2009,
2014). Furthermore, there is substantial evidence of a reduction in cross-market frictions in
recent years making the detection of the benefits of cross-listing even more difficult. Declines in
capital market barriers and information costs since the 1980s have facilitated a profound
globalization of financial markets.
Similar to the recent past, a dramatic reduction in global information transmission costs
from the 1860s with the advent of the telegraph provided the impetus for the creation of the first
global financial marketplace.2 This communication technology shock coincided with a period of
massive railroad investment in the United States after the end of the American Civil War. This
expansion enabled the development of its Southern and Western regions and the creation of an
integrated American product market. Figure 1 shows maps of the United States railroad network
1Other motives for cross-listing include enhancing product visibility (Mittoo, 1992; Pagano, Roell, and Zechner,
2002; Saudagaran, 1988), improving liquidity (Domowitz, Glen, and Madhavan, 1998; Tinic and West, 1974;
Werner and Kleidon, 1996), easing foreign firm acquisitions (Gangon and Karolyi, 2009), improving investor
protection (Coffee, 1999, 2002; Doidge, 2004; Doidge, Karolyi, and Stulz, 2004, 2007, 2009; Doidge, et al., 2009;
Dyck and Zingales, 2004; Hail and Leuz, 2009; Reese and Weisbach, 2002), and familiarity links (Sarkissian and
Schill, 2004). Sarkissian and Schill (2009) and King and Segal (2009) show that often cost of capital gains to a
foreign listing are transitory. 2 On August 16, 1858, the first telegraphic message was sent from the Old World to the New World. The message,
“Glory to God in the highest; on earth, peace and good will toward men” took 17 hours to transmit. Within a decade,
a second, superior cable improved transmission speeds to eight words per minute.

4
in 1870, 1880, and 1890, illustrating a dramatic increase in the U.S. railroad investment after the
end of the Civil War in 1865. According to Davis and Galman (2001), “…in terms of economic
development, the construction of the national railway network was probably the most important
event of the last half of the nineteenth century” and required “a massive infusion of capital” on a
scale which far outstripped the domestic sources of funding. Among foreign investors, British
were the most important and held two-thirds of U.S. railroad securities by 1900, far surpassing
the next most important investor groups – the Dutch, the Germans, and the French each
accounting for only one-tenth.3 The importance of British investors in turn made the London
Stock Exchange a major foreign listing venue for U.S. railroads.4
We use a railroad sample containing 198 publicly listed U.S. railroad companies with 117
maintaining listings on the New York Stock Exchange and 115 maintaining listings on the
London Stock Exchange between 1870 and 1913. We allocate each U.S. railroad to one of the
four regions within the United States: NORTH, CENTRAL, SOUTH, and WEST. Table 1
provides the details of this classification. We show that the foreign listing activity among U.S.
railroads in London was very high especially towards the end of our sample period. The foreign
listing penetration rate by the end of the period exceeded 60% across all four U.S. regions, and
was close to 100% for firms from the NORTH region. This illustrates that in relative terms the
tendency to list abroad at that time was much greater in this period than for the much more
studied samples from the late 20th
and early 21st centuries.
5 The London-listed firms carried out a
total of 114 bond and 41 ordinary stock listings. Hence, unlike today, the security of choice in
3 Total foreign investment in U.S. railroads reached $4.2 billion by 1913 based on par values and represented over
one-fifth of all U.S. railroad securities outstanding (Lewis, 1938, figures quoted in Wilkins, 1989: 191-193). 4 The first public issue of a U.S. railroad in London was in early 1850s, and only six railroads were listed there by
the end of the decade (Adler, 1970: 53, 153). The number of London listings grew rapidly after 1870 so that, by
1913, U.S. railroads accounted for half of the optimal portfolio of a British investor in London-listed securities
compared to a 37% index weight (Goetzmann and Ukhov, 2006: Table XI). Consistent with this aggregate evidence,
Foreign and Colonial Investment Trust, the flagship London-listed closed-end fund, made its largest allocation to
U.S. railroad bonds to the benefit of its investment performance (Chambers and Esteves, 2013). 5 The proportion of foreign to domestic listings in our sample is almost unity, while the same ratio for all developed
and emerging markets nowadays is much less than unity.

5
foreign listings of the late 19th
and early 20th
centuries was the corporate bond.6 Our bond yield
data covers 62 and 104 of U.S. railroad companies with bonds listed in New York and London,
respectively, during the same time period.
Our novel dataset provides a unique natural experiment for the precise identification of
the effects of mild market segmentation in financial markets, while avoiding the problems
associated with their evaluation in the recent studies stated above. First, since bonds specify the
contracted cash payments, bond yields provide more straightforward estimates of implied capital
costs than equity returns. Cost of debt estimates are substantially easier to estimate than cost of
equity as they are not so dependent on model specification error and risk premium estimation
error. Moreover as railroads were highly leveraged, bond finance represented the most important
component of the cost of capital. Second, cross-border differences in listing regulations can
generate a contaminating effect on the signal value achieved by a cross-listing (Miller and
Puthenpurackal, 2002, 2005). Variation in cross-country reporting and legal liability can create
important variation in bonding effects to cross listing (Doidge, Karolyi, and Stulz, 2004).
However, during our historical period investor protection laws for creditors and shareholders
alike were extremely weak on both sides of the Atlantic and listing regulations set down by the
London and New York Stock Exchanges were minimal (Coffee, 2001).7 As such, it is unlikely
that any confounding bonding effect arises from a U.S. railroad listing in London during our
sample period. Third, product market effects can have important implications for foreign listing
(Pagano, Roell, and Zechner, 2002). As a unique feature to our sample, our railroad assets are
geographically defined by nature such that there is no export-driven value from listing abroad.
Hence, there is little chance that a listing in London creates any contaminating product market
effect. A similar argument neutralizes the acquisition facilitation motive (Gangon and Karolyi,
6 This is consistent with the fact that U.S. railroad funded long-term debt totaled $11.2 billion by 1913 compared to
only $7.2 billion in outstanding common stock at par values (Baskin and Miranti, 1996: 146-150) and that between
70% and 90% of the portfolios of foreign investors were allocated to bonds (Wilkins, 1989: 191). 7 If anything, New York was tougher in screening listing applications than was London (Michie, 1987: 256-257).
Similarly, U.S. investment banks in New York were far more active than their British counterparts in London
playing the honest broker between U.S. railroads and British investors (Coffee, 2001).

6
2009). Lastly, the available evidence suggests that differences in liquidity across the two markets
cannot affect our analysis. Bid-ask spreads in both New York and London showed no increases
in our sample period.8 Furthermore, spreads were if anything higher in London than New York.
In addition, our experiment provides a clear setting for analyzing the specific effects of
market segmentation not only at the aggregate but also regional levels. The United States was
still a developing economy in the second half of the nineteenth century and displayed substantial
cross-regional variation driven by (i) the country’s vast size, (ii) the economic legacy of the Civil
War on the South where personal income per capita was around half the national average over
the period of our study (Mitchener and McLean, 1999: Table 1) and (iii) the huge importance of
the manufacturing belt within the U.S. economy. The manufacturing belt in 1900 accounted for
four-fifths of the U.S. industrial output with only one-sixth of the land area and covered 18 states
in total (Klein and Crafts, 2012). All but two states were in the NORTH and CENTRAL regions.
Hence, it is in this sense that we refer in the rest of the paper to the NORTH and CENTRAL
regions being more developed than SOUTH and WEST. These regional differences within one
country may result in a certain degree of within-country segmentation of capital markets and,
thus, help in estimating the cost of capital and financing opportunities specific to each region.
Merton (1987) discusses the effect of information segmentation in creating a super risk
premium in capital costs. Since bonds were the quoted security of choice among railroads and
their investors, we proxy the cost of capital by bond yields. Consistent with Merton’s premise,
we observe strong time-series and cross-regional effects in the super premium among U.S.
railroads and are able to identify precise magnitudes for this premium. We observe that the bond
yields of U.S. railroads listed in New York compared to those of U.S. railroads listed in London
displayed a super premium which averaged over 15-22 basis points (bps) during our sample
8 We collected the bid-ask spreads, where available, of U.S. railroads traded in New York and London in our sample
for years 1890 and 1913 from the Commercial and Financial Chronicle and the Stock Exchange Daily Official List
respectively. Bid-ask spreads were not quoted for all stocks. Whilst New York spreads were published throughout
our sample period for New York, London spreads were not published before the late 1880s. The average spread on
U.S. railroads in London was 2.4% in 1890 and 2.8% in 1913. The bid-ask spreads in New York were around 2% in
the same two years.

7
period controlling for railroad and bond characteristics. This premium is economically
meaningful in the context of U.S. railroad bond yields averaging around 5%. Moreover, as the
New York and London capital markets became less segmented, the premium declined from at
least 89bps at the beginning of our sample period to almost zero by the end of the sample period.
Although there is strong time-series variation in the gains to listing abroad, we find, however,
that while a listing of U.S. railroads in London lowers their bond yields, it does not offset the
borrowing cost risk during economic and financial crises in the United States.
We use a control sample of British railroads to measure the magnitude of the gain to
British investors. We observe that in the early 1870s U.S. railroads traded in London at an
average premium of at least 155bps above that of British railroads, suggesting that British
investors were able to gain 1.55% by investing in cross-listed U.S. bonds. The magnitude of this
premium also implies that the total difference between bond yields on British railroads in
London and U.S. railroads in New York was at that time 244bps (155bps + 89bps). By 1910s,
the yield differential had largely disappeared. In fact, at the end of the sample period U.S.
railroads listed in London traded at lower yields than their British counterparts.
In cross-sectional tests we show that the bond yield premium reduction associated with
cross-listing exhibits significant regional variation. The cost of capital reduction is smaller for
railroads located in the more remote regions of the United States. For a matched sample of firms
that are traded in both New York and London, a London listing, relative to that in New York,
provides a reduction in average bond yield for NORTH and CENTRAL railroads that is 15bps
larger than for SOUTH and WEST companies. This cross-regional difference remains the same
if not even larger in panel tests when controlling for various firm and bond characteristics.
Finally, we find significant regional differences in the investment to cash flow sensitivity
of cross-listed firms. Foreign listings of railroads from the NORTH and CENTRAL regions of
the United States decrease their firms’ investment to cash flow sensitivity, implying that the
presence of these firms in London reduces their financing constraints (see Fazzari, Hubbard, and
Peterson, 1988; Lins, Strickland, and Zenner, 2005). This stands in stark contrast to foreign

8
listings of firms from the SOUTH and WEST regions. Thus, we conclude that foreign listings for
NORTH and CENTRAL railroads helped reduce not only their borrowing costs but also their
overall financing constraints. By contrast, such benefits were either more modest or non-existent
in the case of SOUTH and WEST railroads. Proxying information costs by telegraph rates
between major U.S. regional centers and London, we suggest that this finding is related to the
greater information costs faced by London investors in assessing and monitoring railroads in the
more remote regions of the United States. In addition, the cultural ties between these regions and
Britain, as proxied by the relative importance of British immigration to the United States in this
period, could have contributed to investors obtaining better information and monitoring their
investments in a less costly manner.
Our study, similar to Foerster and Karolyi (1999), makes two broad contributions. First,
it extends the literature on market segmentation, whilst using a novel setting, which alleviates the
influence of various confounding effects present in other studies on cost of capital estimation.
Second, it adds to the literature on Merton's (1987) investor recognition hypothesis, but it shows
directly how information asymmetries between otherwise similar firms and different pools of
investors affect their cost of capital and financing opportunities in the cross-section.
The rest of the paper is organized as follows. Section 2 describes the data. Section 3
estimates the impact of U.S. railroad bond listings in London on the cost of capital. Section 4
examines the relation between U.S. bond listings in London and financial constraints. Section 5
offers explanations for the observed time-series and cross-regional patterns in financial
opportunities of U.S. railroads. Section 6 concludes.
2. Data and Summary Statistics
2.1. Cross-Listing Data
Our data set of 198 U.S. railroad firms is constructed from a variety of sources. To make
data collection tractable, we concentrate on the large and medium sized railroads publicly listed
9
on the New York Stock Exchange or London Stock Exchange between 1870 and 1913 and
described in Henry V. Poor’s Manual of the Railroads of the United States.9 These volumes were
published annually from 1870 to 1914. Our sample therefore excludes small U.S. railroads for
which the Poor’s Manuals had no entry or missing financial information or which were listed on
a regional exchange. Our sample is somewhat larger than that used by Benmelech (2009) to
exploit differences in U.S. railroad track gauges in order to study asset salability and debt
maturity over a comparable but shorter time period, 1868-1882.10
Table 2 provides the frequency distribution of U.S. railroad bond and common stock
listings in New York and London by geographic region. With the development of the United
States, the regional definitions in the Poor’s Manuals change over our sample period. Regional
definitions used in 1913 don’t apply well to the early part of the sample period when the western
United States was undeveloped. The regional designations we establish in Table 1 are derived by
aggregating the eight regions used by the Poor’s Manuals at the end of the sample period into
four broader regional classifications. For example, the New England and Middle states are
combined to form the NORTH region. We assign each railroad to one of our four regions based
on the location of the mass of its track assets. Out of the 198 railroads, WEST provides the
greatest number of companies, 68, while SOUTH provides the fewest, 36.
We observe that bonds were the most popular type of security for railroads across all U.S.
regions when listing in London. Among the 117 railroads quoted on the New York Stock
Exchange, 106 firms chose to list at least one bond compared to only 72 listing their common
stock. Similarly, among the 115 U.S. railroads quoted on the London Stock Exchange, 114 firms
elected for at least one bond listing and only 41 listed their common stock. To further illustrate
9 The New York Stock Exchange was the dominant venue in the United States for all publicly listed companies,
including transportation stocks, and the transportation industry became the dominant industry on the exchange since
the early 1850s (e.g., Fietkiewicz and Proffitt, 2010). 10
Note that during this period some U.S. railroads also listed their bonds and stocks in Amsterdam and, to a lesser
extent, their bonds in Frankfurt. We focus in this paper on listings on the London Stock Exchange given that it was
the dominant overseas foreign listing market in our sample period.

10
the point, in the last column of the table for each stock exchange venue, we give the ratio of
firms that list a bond before a stock in each market.
Figure 2 charts the total number of U.S. railroads listed in New York, U.S. railroads
cross-listed in London, and British railroads listed in London over our sample period. Both the
number of U.S. railroads listed in New York and British railroads listed in London increase
steadily from the 1870s to the 1890s before flattening out around 45-50 listings and then
decreasing marginally toward 40 by 1913. As for U.S. railroads cross-listed in London, their
number continues to increase until 1900 passing the 70 mark, and then drops sharply to around
40 by 1913. These end-of-sample decreases in the number of railroads on both exchanges were
due largely to consolidating mergers within the industry.
Figure 3 presents the annual penetration of U.S. railroads with a London listing by region
over the whole sample period. We define annual penetration as the proportion of U.S. railroads
in a given region with a bond listing in London in a given year. As expected, due to their earlier
emergence, the railroads from the NORTH region were the undisputed leaders in the pursuit of a
London listing for most of the 1870s and 1880s, and retained their lead in the second part of the
sample period. In contrast, the penetration rate of railroads from SOUTH remained below 20%
up until the late 1880s, probably reflecting the economic legacy of the Civil War for this region.
Their penetration rate only caught up with that of other regions in the 1890s but then rose to
almost 100% by 1913, similar to NORTH. Finally, the penetration rates of railroads from the
CENTRAL and WEST regions of the United States ranged between those of NORTH and
SOUTH before 1890 and remained below NORTH thereafter. The strong upward trend in
London listings among railroads from all U.S. regions seem to sugget substantial benetits to them
resulting from their presence on the world’s preeminent stock exchange before WW1.
2.2. Firm and Bond Yield Data
For each railroad and year in our sample period, we also collect from the Poor’s Manuals
data on the mileage of track owned and leased and five firm characteristics: revenue (Revenue),

11
total assets (Assets), revenue growth (Revenue growth), asset growth (Asset growth), and the
return on assets (ROA). Revenue growth (Asset growth) is the current total revenue (assets)
divided by the lagged revenue (assets) less unity. ROA is the difference between total revenue
and operating costs divided by the total assets. In total, we collect 4,730 firm-year observations.
The bond yield data covers 104 U.S. railroad companies with bonds listed in London
during the same sample period. Our two control samples consist of bond yield data for those U.S.
railroads with bonds listed only in New York and for British railroads with bonds listed in
London. The latter sample includes all British railroads with a bond listed on the London Stock
Exchange over our sample period according to the Investors Monthly Manual.11
The bond yield
(Yield) is defined as the coupon payment divided by the prevailing end of year bond price. To
minimize the impact of financial distress effects, yields are only calculated on bonds with prices
of 75 and above. U.S. railroad bond prices listed in New York are taken from the Commercial
and Financial Chronicle and those in London from the Investors Monthly Manual and the Stock
Exchange Daily Official List. British railroad bond prices listed in London are taken from the
Investors Monthly Manual. Where a railroad has more than one bond listed, we select the bond
with the longest maturity. We also estimate the bond yield spread (Spread), which equals the
bond yield less the prevailing yield on the long-dated British government bond.
We consider several control variables in modeling the behavior of bond yield spreads.
Some investors preferred the security of bonds paying interest and principal in gold or sterling,
rather than in U.S. dollars, despite the dollar being on the gold standard other than during and
shortly after the Civil War.12
Hence, we employ two indicator variables. The first indicator
(Gold) equals unity if the principal and the coupons on the bond were payable in gold, and zero
otherwise; the second (Sterling) equals unity if the principal and the coupons on the bond were
11
Exclusions for comparability are confined to seven very small railroads. 12
Although the U.S. had adopted a bimetallic standard for its currency in 1792, the mint ratio overvalued gold such
that by 1849 the United States was on a de facto gold standard. Convertibility was suspended during the Civil War.
The dollar de facto returned to the gold standard in 1879 and was exchangeable at a fixed exchange rate of $4.86/£1
(Bordo and Rockoff, 1996: 401). In some specifications we control for this change in regimes by adding a pre-1879
fixed effect, OffGold, and an interaction variable between the OffGold and the Sterling variables.

12
payable in pounds sterling, and zero otherwise. The third variable is the Default dummy, which
is equal to unity in any year that a railroad is in default on its bonds, and zero otherwise. A fourth
variable is the time left to bond maturity (Years-to-Maturity). Since the bonds in our sample are
effectively all secured bonds, we do not include a variable to capture variation in borrowing costs
for secured versus unsecured debt. The data on the Gold, Sterling, and Years-to-Maturity
variables are drawn from the price lists, the (London) Stock Exchange Year Books and the Poor’s
Manuals.13
We also collect data on control variables for British railroads listed in London. The
assets of each British railroad are defined as the total of book debt and equity capital as reported
in the Investors Monthly Manual and the Stock Exchange Year Book and converted to U.S.
dollars at an exchange rate of USD4.86 = GBP1. The Years-to-Maturity is defined as 100 years
for all British bonds as virtually all were issued as perpetual bonds (Coyle and Turner, 2013).
Table 3 summarizes the statistics of railroad company characteristics and their corporate
bond data. Panel A shows the number of observations and average firm and bond characteristics
across U.S. regions. First, we observe wide cross-regional differences in firm characteristics. The
railroads from NORTH are the leaders in revenue and ROA, while those from WEST – in
revenue growth. Most notable is that railroads from SOUTH and WEST post the lowest ROA
and the lowest asset turnover (Revenue/Assets). Railroads in these relatively remote U.S. regions
appear to be operated less efficiently than in the more developed NORTH and CENTRAL
regions. Railroads in the WEST region have the largest asset base since, given the region’s size,
they require more track. Second, we also see cross-regional variation in bond characteristics.
Railroads from NORTH have the lowest average bond yields and, as a result, the lowest spreads
over British Government bonds. Companies from SOUTH and WEST have a larger proportion
of their bonds granting investors the right to be paid in gold than those from NORTH and
13
We also considered a dummy if a railroad had its bonds underwritten by J.P. Morgan since such a connection was
thought to have both lowered the cost of capital (Simon, 1998) and mitigated financial constraints during this period
(Ramirez, 1995). These results are not reported since we found no evidence of any benefit from a Morgan
connection.

13
CENTRAL (0.57 and 0.62 versus 0.39 and 0.28). This implies that other things equal securities
from SOUTH and WEST were possibly viewed as more risky and this was a way of making their
bonds more attractive to investors. This is substantiated in the case of railroads in the WEST that
experienced a higher rate of defaults (0.016) than did those from the other regions.
Panel B of Table 3 provides the number of observations and the average firm and bond
characteristics for U.S. railroads listed in New York and London, as well as for British railroads
listed in London. First, railroads cross-listed in London are much larger than their counterparts
listed solely in New York. This difference is similar to more recent patterns in cross-listing
placements (see Sarkissian and Schill, 2012). Not surprisingly given the vast distances travelled
in the United States, the size of U.S. railroads listed in London was considerably larger than that
of British railroads.
Second, we observe wide differences in bond characteristics by listing venue. The
proportion of U.S. railroad bonds redeemable for gold was much larger among those listed in
London (0.65) than among railroads listed only in New York (0.21). This suggests that British
investors were more concerned than their American counterparts about holding stakes in
companies operated on American soil, possibly due to informational or monitoring
disadvantages. Currency hedging has been identified as a reason for the issuing of foreign
currency-denominated debt (see Kedia and Mozumdar, 2003; Henderson et al., 2006). However,
in our sample, none of the New York listed bonds and only 17% of the London listed U.S. bonds
were sterling-denominated. This suggests that only a few railroads were looking to hedge any
currency exposure arising from the importation of British track or rolling stock. In the case of
defaults, there is no difference between bonds listed in New York and London. The average
maturity of U.S. railroad bonds listed in London was more than 20% higher than those listed in
New York.
Finally, the bond yield spreads of U.S. railroads listed in New York (219bps) are higher
than those cross-listed in London (191bps), and both are higher than the corresponding yields of
British railroads on the London Stock Exchange (54bps). This finding is similar to that of Massa

14
and Zadora (2014) that yield spreads on international bonds issued by companies from the
United States and other countries in the recent past are lower than those on their domestic
offerings. In the next section, we examine whether differences in yield spreads are robust to
controlling for firm and bond characteristics.
3. Financial Effects of Bond Listings in London
3.1. Preliminary Evidence
We start by examining the time-series and cross-regional dynamics of yields on U.S.
railroad bonds that are traded in the United States and Britain, as well as bond yields of British
railroads in London. Table 4 shows the results. Panel A presents bond yields for U.S. railroads
listed in New York and London as well as British railroads listed in London, both for each year
in the sample period and for each calendar decade. It also shows the annual difference in yield
spreads between New York and London listed U.S. bonds (New York – London), between
London listed U.S. bonds and British bonds (London – British), as well as the statistical
significance of these differences. We observe a decrease in bond yields for all U.S. railroad
listings. In the 1870s, the borrowing costs for U.S. railroads listed in New York displayed an
average premium of 56bps over U.S. railroads listed in London. By the 1890s, this average
premium declined to 12bps, before rising modestly in 1910-1913 to 28bps. The premium relative
to British railroads dropped 211bps from 278bps (56 + 222bps) in the 1870s by to 67bps (28bps
+ 39bps) by the end of our sample period.
In Panel A of Table 4, the membership of the sub-samples of railroads with listings in
New York and London are time-varying. Therefore, the observed decrease in the New York –
London yield spread over time could be due to any changes in the composition of each sub-
sample. To alleviate this concern, we examine the behavior of bond yield spreads for a sub-
sample of 27 railroads where we find a bond listed in both New York and London at the same
time. Note that in most cases this is not the same bond. Figure 4 graphs the frequency

15
distribution of the number of such railroads over time (Panel A) and then the average New York
– London bond yield spread for this sub-sample at the end of each year (Panel B). Given the very
small number of observations in the early years, we begin charting the bond yield spread in Panel
B from 1879 when the number of railroads listed on both exchanges reached four. The main take
away from this figure is that the New York – London spread for this matched sub-sample of
bond listings confirms the existence of a super risk premium for U.S. railroad bonds without a
London listing.
Panel B of Table 4 summarizes the average bond yield spreads across exchanges for U.S.
railroads from each of the four regions. Recall that where a railroad has more than one bond
listed, we select only the bond with the longest maturity. The CENTRAL region has the largest
number of railroads with New York bond listings (25), while the WEST region has the greatest
number of London bond listings (35). There are only nine SOUTH railroads listed in New York
and 22 listed in London. The panel also shows the difference in spreads between New York and
London listed U.S. railroad bonds. Across all U.S. regions, bond yields in London are
significantly lower than those in New York. Moreover, we also observe cross-regional
differences in average yield spreads between New York and London traded bonds. The spreads
for NORTH and CENTRAL (44bps and 37bps, respectively) are three-to-four times large than
those for SOUTH and WEST (13bps and 9bps, respectively). This pattern suggests that the value
of a foreign bond listing in reducing borrowing costs varies across U.S. regions: Railroads from
developed NORTH and CENTRAL regions benefit more than those from remote SOUTH and
WEST.
Of course, the regional sub-samples of railroads with listings in New York and London in
Panel B of Table 4 are also subject to compositional changes over time. These changes may,
therefore, account for the observed cross-regional differences in bond yield spreads between the
two stock exchanges. We address this concern by analyzing the same sub-sample of 27 railroads
with bonds listed in both markets and conducting matched-pair tests of the difference in the
mean of New York – London bond yield spreads by region. Given the small sample size, we

16
aggregate our four U.S. regions into two: NORTH and CENTRAL (NORTH/CENTRAL) and
SOUTH and WEST (SOUTH/WEST).
Table 5 reports the number of firms that maintain bond listings in both New York and
London for each of the two combined regions and their respective bond yields in percentage
points. It also shows the number of matched pair observations, where our dataset includes yields
for bonds in both markets in the same year, as well as the test for the difference in matched pair
means with the corresponding t-statistic. New York listed bonds of railroads from
NORTH/CENTRAL exhibit a 17bps risk premium compared to their simultaneously listed
London listed bonds, whereas this risk premium is absent in the case of railroads from
SOUTH/WEST. The matched pairs test reveals that this average difference in the New York –
London spread of 15bps is, in spite of the small sample size, significant at almost the 5% level.
Hence, controlling for firm-specific effects, the value of cross-listing in London in terms of the
reduction in risk premia is larger for NORTH and CENTRAL railroads than for those from
SOUTH and WEST. In the next sub-section, we further test this relation for our entire sample of
railroads in the presence of various controls.
3.2. Regression Results
In our first set of regressions, we test for the impact of a London bond listing on bond
yield spreads (Spread) after accounting for both firm and bond characteristics.14
Therefore, we
construct an indicator variable, FBond, which is equal to unity if a firm has a bond foreign listing
in London, and zero otherwise. Other independent variables include all railroad characteristics
from Table 3.
Table 6 reports our test results using the full sample of U.S. railroads over the whole
sample period for various sets of control variables. It also reports the number of observations and
the adjusted R-squared for each regression. Panel A provides the estimation output for U.S.
14
We also tested for the impact of a stock listing on yield spreads, but it did not materially change our results.
17
railroads only. Regression (1) contains FBond, Gold, Sterling and Default, dummies, as well as
year fixed effects. First of all, the coefficient on FBond is negative and very significant, which
confirms our earlier observation that a bond listing of U.S. railroads in London markedly reduces
their bond yield spreads. Regressions (2-6) replace year fixed effects with a time trend, Time. Its
coefficient is strongly negative confirming the finding of Table 4 that the average yield spread of
New York listed U.S. railroad bonds is decreasing during our sample period. The coefficient on
the Gold dummy in Regressions (1) and (2) indicates that investors are prepared to accept a
lower yield on the bonds of those railroads that commit to pay in gold. In contrast, the Default
dummy in Regressions (1-4) suggests that bonds have suffered prior defaults were forced to offer
investors a higher yield. Regression (3) includes two additional controls: Years-to-Maturity and
Assets. The coefficients on both these variables are negative and significant implying that
companies with longer maturity bonds and larger companies, which are probably perceived as
representing better quality firms, enjoy lower borrowing costs. Their inclusion draws statistical
significance away from the Gold variable. In Regression (4), replacing Assets with Revenue does
not materially affect any of our other estimates. Regression (5) additionally controls for ROA
and Revenue growth. As might be expected, firms with higher ROA and growth in revenues
experience lower bond yields and spreads. In this specification, the Default variable becomes
insignificant.
In spite of the addition of various controls, the FBond coefficient loses neither statistical
nor economic significance in any of the remaining specifications in Table 6. On average, a
foreign bond listing decreases the bond yield spread by 15-22bps. In Regression (6), we estimate
the level of New York – London bond yield spreads at the beginning of our sample period as
well as the time trend in this spread by including the interaction term, FBond × Time. The
negative FBond coefficient indicates that the New York – London bond spread starts at 41bps,
and the positive coefficient on the interaction term suggests that this spread declines by 0.8bps
per year over the next 43 years of the sample. Both coefficients are highly significant.

18
In Regression (7) we further refine this analysis by including yearly effects interacted
with FBond to estimate the foreign listing gain in each year of our sample. We report these
coefficients only for the first three and last three years of the sample. We find that the interaction
coefficient for FBond in the early 1870s is below -0.89. In contrast, this coefficient for the 1910s
is substantially reduced in magnitude with values effectively close to zero. In Figure 5, we report
all 44 coefficients on the annual interaction terms from Regression (7), taken with the negative
sign, to illustrate the magnitude of the listing gain across the whole sample period. Despite some
large swings in annual estimates, the figure suggests that the gains to listing in London declined
consistently over time. These results document and highlight the significant reduction which
took place in the cost of capital benefit of a London listing as the New York and London markets
became less segmented.
In Panel B of Table 6, we repeat our estimation of bond yield spreads this time
comparing London listed U.S. railroads to London listed British railroads. We use a sample of
British railroads to measure the magnitude of the extra yield available to British investors from
investing in U.S. railroads traded in London. We denote British railroads with a dummy
variable. The set of controls now is limited to that available for British railroads reported in
Table 3. Consistent with the results of Table 4, British railroads have significantly lower average
bond yields in the first two regressions, and this discount diminishes over time, as shown in
Regression (3). Bonds denominated in pounds sterling enjoy lower spreads. Furthermore, longer
bond maturity and larger firm size are also important for lowering bond yield spreads of U.S.
railroads issuing bonds in London. In Regression (4) we capture the British railroad discount
over time. Similar to Regression (7) in Panel A, we add yearly effects interacted with the British
railroads variable, and again report these estimates for the first and last three years of the sample
period. We observe that in the early 1870s U.S. railroads traded in London at an average
premium of at least 155bps above that of British railroads. Hence, at the beginning of our sample
period British investors were being compensated with a substantial yield premium for investing
19
in London listed U.S. railroad bonds.15
By 1910s, that premium had declined sharply such that
U.S. railroads in London traded at lower yields than their British counterparts.
Next, we consider whether foreign listings, besides helping reduce borrowing costs to
U.S. railroads, are also able to provide them with some diversification gains in weak economic
and financial conditions. Table 7 shows the results of such tests for two Crisis proxies: economic
and financial. The first two regressions are estimated for the economic crisis variable, Recession,
which is an indicator variable equal to unity if a given year contains at least six months defined
as contraction months according to the NBER (Business Cycle Expansions and Contractions).
The last two regressions are estimated for the financial crisis variable, Default Rate > 5%, which
is an indicator variable equal to unity if Default Rate is greater than 5% in the prevailing year.
Default Rate is taken from the annual default rates for U.S. railroads reported by Giesecke,
Longstaff, Schaefer, and Strebulaev (2011) in their Figure 1. The set of control variables across
all regressions is the same as in Regression (3) of Table 6.
All regressions in Table 7 show a positive and significant coefficient associated with the
Crisis dummy, irrespective of whether it relates to economic recession or financial distress. This
implies, as expected, that during economic and financial downturns U.S. bond yield spreads
increase. In economic terms, recessions increase bond spreads by about 11bps, while financial
distress increases them by 4bps. Regressions (2) and (4) also include an interaction term, FBond
× Crisis, but in both estimations its coefficient is insignificant. These regressions therefore
suggest that foreign bond listings in London do not help in mitigating the negative effects of
increased borrowing costs during economic and financial crises. This result is consistent with
more recent studies, which find that during crisis times there is no cost of capital benefit in their
local markets for foreign firms cross-listed in the United States (see Chandara, Patrob, and
Yezegel, 2009).
15
Furthermore, in the early 1870s the total difference between yields on British railroad bonds in London and U.S.
railroad bonds in New York was at least 244bps (155bps + 89bps).

20
Similar to Table 6, we examine further the relation between yield spreads and London
bond listing but this time at a disaggregated regional level. Table 8 reports the test results. Panel
A provides regression estimates for each of the four U.S. regions. In this panel, besides the main
variable of interest, FBond, the set of independent variables includes all other bond
characteristics, a time trend, and a firm size proxy, Assets.
We find that the coefficient on FBond is negative and significant for the NORTH and
CENTRAL regions and is positive and significant for the SOUTH. That is, the railroads from the
NORTH and CENTRAL regions enjoy on average lower bond yield spreads from a listing in
London than those from the SOUTH and WEST. We also note that the Gold dummy lowers
yield spreads in three of the four regions where railroads issuing such bonds are found. The
Default dummy indicates that those railroads in default suffered increased yield spreads,
particularly in the SOUTH. However, and most importantly, the main result of Table 8 Panel A
is consistent with the documented patterns in cross-regional yield spread differences in Panel B
of Table 4 and suggests larger borrowing cost benefits for the two U.S. regions (NORTH and
CENTRAL) that are less distant from London.
Since we were unable to quantify the regional differences in yield spreads or provide any
statistical tests of these cross-regional differences in Panel A of Table 8, we next run pooled
regressions across all regions in Panel B. The control variables are the same as in Panel A. In
Regressions (1) and (2), our benchmark region is NORTH, and the coefficients on all dummy
variables for the other three U.S. regions as well as any interaction terms are measured relative to
the corresponding variables involving NORTH. From Regression (1) we observe that the
coefficients on the interaction terms, SOUTH × FBond and WEST × FBond, are positive and
significant, implying larger yield spreads for railroads from these regions listed in London
relative to those from NORTH. In terms of economic significance, they are larger by 36bps and
46bps, respectively. Bonds from the CENTRAL region command even smaller foreign listing
premium (17bps) than those from NORTH. Thus, we again see that the geographic distance

21
between London and the SOUTH and WEST regions of the United States reduces substantially
any positive impact that foreign listings in London may have on borrowing rates.
In Regression (2) of Panel B, we make treat the combined NORTH/CENTRAL region as
the benchmark region. We do this because of the importance of the U.S. manufacturing belt
within the U.S. economy during our sample period. Concepts in economic geography have been
employed to understand how it is that industrial activity can become heavily concentrated and
flourish in a single region (Krugman, 1991; Dougal, Parsons, and Titman, 2014). The
manufacturing belt is a prime example of such a regional concentration and all but two of the 18
states fell into the NORTH and CENTRAL regions. The other two states were in the SOUTH
(Virginia and West Virginia) and none were in the WEST regions (Klein and Crafts, 2012).
Therefore, the coefficients on all terms involving the other two U.S. regions, SOUTH and
WEST, are in relation to the combined NORTH/CENTRAL region. Our results are qualitatively
the same as in regression (1); however, the point estimates on SOUTH × FBond and WEST ×
FBond are now larger in magnitude and even more significant.
We note that the distribution of railroads in terms of company size is uneven across U.S.
regions (Table 3, Panel A). It could be that instead of picking up differences related to
geographic distance between each region and London, our estimates reflect differences in the
familiarity of U.K. investors with railroads proxied by their size. To account for this possibility
in Regression (3) we add a size control, Large, which is a dummy equal to unity if the firm’s
assets are larger than the median for each year and region, and is zero otherwise. It appears that
large railroads experience a greater reduction in bond yields from cross-listing than their smaller
counterparts by about 24bps. In addition, the estimated coefficients on the regional interaction
terms here are similar to those in Regression (2). Thus, Table 8 highlights the large differences in
borrowing costs across U.S. regions.
22
4. Cross-Listings and Financing Constraints
In the previous section, we found that firms from the less developed SOUTH and WEST
regions of the United States enjoyed less of a benefit in terms of borrowing costs from a London
bond listing than did firms from its NORTH and CENTRAL regions. In this section, we examine
whether the cross-listing decision of U.S. railroads impacts their financing constraints in general,
and whether there are any cross-regional differences. In order to do so, we employ the model of
investment-cash flow sensitivity following Fazzari, Hubbard, and Peterson (1988). We
hypothesize that if firms are financially constrained then there will be a positive relation between
internally generated cash flow, as proxied by ROA, and total asset growth, TA. Employing our
sample of firm-year observations, our regression specification is as follows:
tttt eROAaαTA 1110 δX , (1)
where is a coefficient vector for a set of control variables X that includes: Revenue, Revenue
growth, Asset turnover, which equals the total annual revenue divided by the total assets,
Default, which measures time-varying financial conditions for each railroad, and the Default
Rate from Giesecke et al. (2011).16
We assess how overseas listings may change investment sensitivity to cash flow by
following Lins, Strickland, and Zenner (2005) and augment equation (2) with our foreign bond
listing dummy variable, FBond, and an interaction term, FBond × ROA, as follows:
ttttttt eROAFBondaFBondaROAaαTA 111312110 δX , (2)
The coefficient on the interaction variable, FBond × ROA, tests the ability of a foreign listing to
reduce the sensitivity of asset growth to firm cash flow. We should mention that Kaplan and
Zingales (1997) have questioned the finding that greater investment to cash flow sensitivity of a
16
We are unable to include an estimate of Tobin’s Q as one of our control variables since over one-third of our U.S.
railroad sample did not have a publically listed common stock.

23
firm suggests a more binding financing constraint. However, the time-series nature of our tests
which compares investment sensitivities of U.S. railroads pre- and post-listing in London makes
their critique less of a concern in this setting.17
Table 9 reports the investment-cash flow sensitivity results by U.S. region. The intercepts
in all panels of this table are not reported. Panel A gives the determinants of total assets growth
of U.S. railroads across the four regions based on model (1). First, we observe that the coefficient
on the main variable of interest, ROA, is consistently of the same correct sign and statistically
significant across all regions. Second, ROA appears to be two-to-three times larger for SOUTH
and WEST railroads than for those from NORTH and CENTRAL. Among the control variables,
only Revenue growth and Asset turnover are statistically significant for all or most of the
regions, while the other three controls appear unimportant.
In Panel B of Table 9 we analyze how a foreign bond listing in London affects a
railroad’s total asset growth using model (2). The control variables are the same as in Panel A,
but we do not report their estimates. We observe that foreign listing placements are positively
related to changes in the asset growth of CENTRAL and WEST railroads. More importantly, for
only two regions, NORTH and CENTRAL, the coefficient on the interaction term, FBond ×
ROA, is negative and significant at the 5% and 1% levels respectively. This result implies that a
foreign listing in London reduces investment to cash flow sensitivity for NORTH and
CENTRAL railroads but does not affect much that for SOUTH and WEST railroads. In the
former two regions, the coefficients on the interaction term suggest that, compared to the case of
not having a foreign listing, railroad asset growth in the NORTH and CENTRAL regions is,
respectively, 0.3 and 0.5 percentage points higher when ROA falls by one standard deviation. In
the context of asset growth rates averaging less than five percentage points, such a reduction in
investment growth is economically important. Thus, Table 9 highlights substantial differences in
17
See Lins, Strickland, and Zenner (2005, p. 121).
24
the reduction of financing constraints across U.S. regions from placing their respective railroad
bonds in London.
5. Explaining Regional Patterns
In our tests we observe two distinct patterns in the financial benefits accruing to U.S.
railroads from a cross-listing in London during the 1870-1913 period. The first is the time-series
trend that shows a decrease in bond yield spreads across all exchanges and a substantial
reduction in the super risk premium associated with a listing in New York as opposed to London.
The second is the cross-regional difference in borrowing costs and financing constraints. How
might we explain these patterns?
British investors in U.S. railroads in the second half of the nineteenth century experienced
considerable asymmetric information problems in the absence of any meaningful investor
protection. Three out of ten London listed U.S. railroads in our sample fell into default during the
1873-75 and 1893-95 crises periods.18
Following Merton (1987), changes in the information and
monitoring costs borne by investors over time and the differences in such costs across U.S.
regions can help us understand the observed patterns. These costs can be proxied by the
telegraph communication rates, depicted in Figure 6, from London to the centers of our four U.S.
regions: New York (NORTH), Chicago (CENTRAL), Atlanta/New Orleans (SOUTH), and San
Francisco (WEST), between 1870 and 1913.19
The rates are the cost of transmitting the first 10
words of any message. The source data for London to New York is published in the Historical
Statistics of the United States: Colonial Times to 1970 Part 2, U.S. Department of Commerce,
1975, based on documents from the U.S. Federal Communications Commission and other
sources specified in the report. The rates from New York to Chicago and San Francisco, as well
18 Anthony Trollope’s famous novel, The Way We Live Now, published in 1875 and based on such experiences,
described the great fraud inflicted upon London investors by the promotion of a fictitious western railroad. 19
While the main centers for NORTH, CENTRAL, and WEST can be easily defined, there is no clearly defined
center for the SOUTH region. Therefore, SOUTH is represented by both Atlanta and New Orleans.

25
as the equally-weighted average of the rates from New York to Atlanta and New Orleans are
from Honsowetz (2014). The rates from London to Chicago, San Francisco, and Atlanta/New
Orleans are estimated by adding the London – New York rate to the rate between the destination
city and New York. The data points for missing observations are interpolated.
First, the decline in telegraph rates across the period graphed in Figure 6 is dramatic and
highlights the extent of the communication technology shock. This decline coincides with the
reduction in the super risk premium of New York listed railroads as measured by the bond yield
spread differential compared to London listed railroads from above 80bps in 1870 down to zero
by 1913. In fact, the majority of the decline in both bond yield spreads and telegraph rates occurs
in the first half of our sample period. This relationship between risk premia and communication
costs is clearly suggestive of the increasing market integration between the United States and the
United Kingdom during this time period.
Second, Figure 6 also shows a clear ordering of the relative costs of information
transmission to and from London across the four U.S. regions reflecting both geographic and
economic distance from Britain. The cheapest rate is to New York, while the most expensive is
to San Francisco. Furthermore, the ordering of these differences in communication costs across
the four U.S. regions is preserved through time, notwithstanding the overall downward trend in
rates. The implication is that it was cheaper for British investors to access information regarding
their investments in railroads from the more proximate NORTH and CENTRAL regions than
from the relatively distant SOUTH and WEST. Moreover, the NORTH and CENTRAL regions
were synonymous with the manufacturing belt, as discussed in Section 3, and thereby possessed
an enormous economic power in that period. This power in turn had a direct effect on the
strength of NORTH-CENTRAL trade relations with the United Kingdom. Sarkissian and Schill
(2004) argue that in an international setting economic distance between markets may play a
larger role in investments than geographic distance. Overall, this is consistent with evidence in
Coval and Moskowitz (1999, 2001) who show that investors prefer investing in more proximate
securities where they enjoy some information advantage.
26
Third, it is also possible that the regional variation in information costs reflects variation
in cultural factors across the regions. Cultural factors have been found to be related to financial
and economic outcomes. For instance, Grinblatt, and Keloharju (2001) find the existence of
cultural and language preferences in investors’ portfolio holdings. Moreover, Algan and Cahuc
(2010) show a causal effect of trust on economic growth using the inherited trust of descendants
of U.S. immigrants as a measure of inherited trust in their country of origin. Consequently, those
U.S. regions with a larger number of British immigrants are more likely to enjoy stronger ties to
their home country, other things equal. Figure 7 shows British immigration into each of the four
U.S. regions normalized by the total regional population for each decade between 1870 and
1910. The immigration data are taken from the census data of the Integrated Public Use
Microdata Series (IPUMS) at the University of Minnesota. We extract data on the numbers of
British immigrants into the United States by individual state for the years 1870, 1880, 1890,
1900, and 1910 and aggregate them into our four defined regions. We can see that NORTH was
most settled by British immigrants. The CENTRAL region was the second most important U.S.
destination for British immigrants. The suggestion is then that the stronger cultural linkages of
the NORTH and CENTRAL regions with the United Kingdom could help British investors in
U.S. railroad securities from these regions minimize any information gaps.
In sum, the economic attractions of the NORTH and CENTRAL regions may have
reinforced the relatively lower information costs and stronger cultural ties between these regions
and the United Kingdom. As a result, each of these factors may have contributed to the decision
by British investors to pay up for London listed railroad bonds from those regions.
6. Conclusions
The period from 1870 to 1913 represents the first era of financial globalization. During
this period, the world of finance exhibited two distinctive features. First, communication costs
fell dramatically between the major regional centers across the United States, on the one hand,

27
and Britain, on the other. Second, capital markets became more integrated as British investors
made investments in the capital-hungry United States on a scale not previously seen. The
railroad industry during this time period offers a unique natural experiment to understand the
potential benefits accruing to U.S. firms pursuing an overseas listing in London in terms of both
lower costs of capital and reduced financing constraints. In this paper, we examine the extent of
both of these cross-listing benefits using firm-level data on U.S. railroads listed in New York and
London during this period.
We find significant time-series and cross-regional differences in the impact of foreign
bond listing activity on railroad borrowing costs. Our main test results are consistent with
Merton (1987). We observe substantial foreign listing activity in London among U.S. railroads
from all regions that peaked by 1900, with bonds being the preferred security for foreign
placements. New York listed U.S. railroads exhibited a super risk premium compared to London
listed U.S. railroads of above 80bps in the beginning of 1870s. Over the next 40 years this
premium declined to practically a zero level. Over our sample period, U.S. railroads listed in
London also migrate from yields of about 155bps above comparable British railroads to trading
at yields below their British counterparts. These declines reflect a substantial reduction in market
segmentation between the United States and the United Kingdom over this period. We find,
however, that a London cross-listing was of little help to U.S. railroads in mitigating the impact
of either type of crisis on their cost of capital.
Importantly, we observe that the impact of a London listing on borrowing costs of U.S.
railroads varied across regions. London listed railroads from the SOUTH and WEST regions
exhibited higher yield spreads than those from the more developed NORTH and CENTRAL
regions. The SOUTH and WEST regions also delivered a more modest decline in yield spreads
compared to the NORTH and CENTRAL regions, when their railroads cross-listed overseas.
Last, we examine whether the decision to cross-list relieved any financing constraints on
investments experienced by U.S. railroads during our sample period. We find that whilst all
railroads had some financial constraints, railroads from the SOUTH and WEST regions of the

28
United States displayed the greatest sensitivity of asset growth to cash flow implying less
profitability. Moreover, among U.S. railroad listings in London, those from the NORTH and
CENTRAL regions became substantially less sensitive to cash flow, but those from SOUTH and
WEST received no such benefit.
Thus, our findings show in a novel historical setting how the integration of two of the
major capital markets in the world over a century ago provided financial opportunities to U.S.
industry faced with a shortage of savings and eager to finance its huge capital investment
program. Yet, we find that gains arising from a foreign listing in terms of a lower cost of capital
or a relief of financing constraints differ across regions. We suggest that these regional
differences in the gains from cross-listing were inversely related to differences in information
costs proxied by regional differences in telegraph communication rates and cultural links with
Britain. Hence, the benefits of a foreign listing are negatively related to information costs
between the firms and their investors.
References:
Adler, D.R., 1970, British Investment in American Railways 1834-98, University of Virginia
Press.
Algan, Y., and P. Cahuc, 2010, Inherited trust and growth, American Economic Review, 100,
2060-2092.
Alexander, G., C. Eun, and S. Janakiramanan, 1988, International listings and stock returns:
some empirical evidence, Journal of Financial and Quantitative Analysis 23, 135-151.
Baskin, J., and P. Miranti, 1996, History of Corporate Finance, Cambridge: Cambridge
University Press.
Benmelech, E., 2009, Asset salability and debt maturity: Evidence from nineteenth-century
American railroads, Review of Financial Studies 22, 1545-1584.
Bordo M.D. and H. Rockoff, 1996, The gold standard as a “Good housekeeping seal of
approval” Journal of Economic History, 56, 389-428.
Chambers, D., and R. Esteves, 2013, The first global emerging markets investor: Foreign and
Colonial Investment Trust 1880-1913, Working paper, Cambridge University.

29
Chandara, N., D. Patrob, and A. Yezegel, 2009, Crises, contagion and cross-listings, Journal of
Banking & Finance 33, 1709-1729.
Coffee, J.C., 1999, The future as history: the prospects for global convergence in corporate
governance and its implications, Northwestern Law Review 93, 641-708.
Coffee, J.C., 2001, The rise of dispersed ownership: The role of law in the separation of
ownership and control, The Yale Law Journal 111, 1-82.
Coffee, J.C., 2002, Racing towards the top? The impact of cross-listings and stock market
competition on international corporate governance, Working paper, Columbia University.
Coval, J., and T. Moskowitz, 1999, Home bias at home: Local equity preference in domestic
portfolios, Journal of Finance 54, 2045-2073.
Coval, J., and T. Moskowitz, 2001, The geography of investment: Informed trading and asset
prices, Journal of Political Economy 109, 811-841.
Coyle, C., and J. Turner, 2013, Law, politics and financial development: The great reversal of the
U.K. corporate debt market, Journal of Economic History 73, 810-846.
Davis, L., and R. Gallman, 2001, Evolving Financial Markets and International Capital Flows:
Britain, the Americas, and Australia, 1865-1914, London: Routledge.
Doidge, C., 2004, U.S. cross-listings and the private benefits of control: Evidence from dual
class firms, Journal of Financial Economics 72, 519-553.
Doidge, C., G.A. Karolyi, and R. Stulz, 2004, Why are foreign firms listed in the U.S. worth
more?, Journal of Financial Economics 71, 205-238.
Doidge, C., G.A. Karolyi, and R. Stulz, 2007, Why do countries matter so much for corporate
governance?, Journal of Financial Economics 86, 1-39.
Doidge, C., G.A. Karolyi, and R. Stulz, 2009, Why has New York become less competitive than
London in global markets? Evaluating foreign listing choices over time, Journal of Financial
Economics 91, 253-277.
Doidge, C., G.A. Karolyi, K. Lins, D. Miller, and R. Stulz, 2009, Private benefits of control,
ownership, and the cross-listing decision, Journal of Finance 64, 425-466.
Domowitz, I., J. Glen, and A. Madhavan, 1998, International cross-listing and order flow
migration: Evidence from an emerging market, Journal of Finance 53, 2001-2027.
Dougal, C., C.A. Parsons, and S. Titman, 2014, Urban vibrancy and corporate growth, Journal of
Finance, forthcoming.
Dyck, A., L. Zingales, 2004, Private benefits of control: An international comparison, Journal of
Finance 59, 533-596.
Errunza, V., and E. Losq, 1985, International asset pricing under mild segmentation: Theory and
tests, Journal of Finance 40, 105-124.
Fazzari, S.; R. Hubbard, and B. Petersen. "Financing Constraints and Corporate Investment."
Brookings Papers on Economic Activity, 1 (1988), 141-195.
30
Fishlow, A., 1966, Productivity and technological change in the railroad sector, 1840-1910, in
Output, Employment, and Productivity in the United States after 1800, NBER and Columbia
University Press, 583-646.
Fietkiewicz, K. and W.T. Proffitt, 2010, Local stock exchanges and their effect on regional
economic development, 1790 to 1930, Working paper, Franklin & Marshall College.
Foerster, S., and G.A. Karolyi, 1999, The effects of market segmentation and investor
recognition on asset prices: Evidence from foreign stocks listing in the United States, Journal
of Finance 54, 981-1013.
Gagnon, L., and G.A. Karolyi, 2009, Information, trading volume, and international stock Return
comovements: Evidence from cross-listed stocks, Journal of Financial and Quantitative
Analysis 44, 953-986.
Giesecke, K., F. Longstaff, S. Schaefer, and I. Strebulaev, 2011, Corporate default risk: a 150-
year perspective, Journal of Financial Economics 102, 233-250.
Grinblatt, M., and M. Keloharju, 2001, Distance, language, and culture bias: The role of investor
sophistication, Journal of Finance, 56, 1053-1073.
Goetzmann, W.N., and A.D. Ukhov, 2006, British investment overseas, 1870-1913: A modern
portfolio theory approach, Review of Finance 10, 261-200.
Gozzi, J., R. Levine, and S. Schmukler, 2008, Internationalization and the evolution of corporate
valuation, Journal of Financial Economics 88, 607-632.
Hail, L., and C. Leuz, 2009, International differences in cost of capital: Do legal institutions and
securities regulation matter?, Journal of Accounting Research 44, 485-531.
Henderson, B., N. Jegadeesh, and M. Weisbach, 2006, World markets for raising new capital,
Journal of Financial Economics, 82: 63-101.
Honsowetz, A., 2014, Federal preemption and competition in the post-1866 United States
telegraph market, Working paper, Cambridge University.
John, K., A. Knyazeva, and D. Knyazeva, 2011, Does geography matter? Firm location and
corporate payout policy, Journal of Financial Economics 101, 533-551.
Kaplan, S., and L. Zingales, 1997, Do investment cash-flow sensitivities provide useful measures
of financing constraints?, Quarterly Journal of Economics 112, 169-215.
Kedia, S., and A. Mozumdar, 2003, Foreign currency–denominated Debt: An empirical
examination, Journal of Business 76, 521-546.
King, M., and D. Segal, 2009, The long-term effects of cross-listing, investor recognition, and
ownership structure on valuation, Review of Financial Studies 22, 2393-2422.
Klein, A., and N. Crafts, 2012, Making sense of the manufacturing belt: determinants of U.S.
industrial location, 1880-1920, Journal of Economic Geography 12, 775-807.
Krugman, P., 1991, Increasing returns and economic geography, Journal of Political Economy
99, 483-499.
Lewis, C., 1938, America’s Stake in International Investments, Washington D.C.: Brookings
Institute.

31
Lins, K.V., D. Strickland and M. Zenner, 2005. Do non-U.S. firms issue equity on U.S. stock
exchanges to relax capital constraints?, Journal of Financial and Quantitative Analysis 40,
109-133.
Massa, M., and A. Zaldokas, 2014, Investor base and corporate borrowing: Evidence from
international bonds, Journal of International Economics 92, 95-110.
Merton, R., 1987, Presidential address: A simple model of capital market equilibrium with
incomplete information, Journal of Finance 42, 483-510.
Michie, R., 1987, The London and New York Stock Exchanges, 1850-1914, London: Allen &
Unwin.
Michie, R.C., 1997, Friend or foe? Information technology and the London Stock Exchange
since 1700, Journal of Historical Geography 23, 304-326.
Miller, D., 1999, The market reaction to international cross-listings: Evidence from depository
receipts, Journal of Financial Economics 51, 10-123.
Miller, D., and J. Puthenpurackal, 2002, The costs, determinants, and wealth effects of
international capital raising: Evidence from public Yankee bonds, Journal of Financial
Intermediation 11, 455-485.
Miller, D., and J. Puthenpurackal, 2005, Security fungibility and the cost of capital: Evidence
from global bonds, Journal of Financial and Quantitative Analysis 40, 849-872.
Mitchener, K., and I. McLean, 1999, U.S. regional growth and convergence, Journal of
Economic History, 59, 1016-1042.
Mittoo, U., 1992, Managerial perceptions of the net benefits of foreign listings: Canadian
evidence, Journal of International Financial Management and Accounting 4, 40–62.
Pagano, M., A. Roell, and J. Zechner, 2002, The geography of equity listing: Why do European
companies list abroad?, Journal of Finance 57, 2651-2694.
Rajan, R., and L. Zingales, 2003, The great reversals: The politics of financial development in
the twentieth century, Journal of Financial Economics 69, 5-50.
Ramirez, C.D., 1995, Did J.P. Morgan’s men ad liquidity? Corporate investment, cash flow, and
financial structure at the turn of the twentieth century, Journal of Finance 50, 661-678.
Reese, W., and M. Weisbach, 2002, Protection of minority shareholder interests, cross-listings in
the United States, and subsequent equity offerings, Journal of Financial Economics 66, 65-
104.
Sarkissian S., and M.J. Schill, 2004, The overseas listing decision: New evidence of proximity
preference, Review of Financial Studies 17, 769-809.
Sarkissian S., and M.J. Schill, 2009, Are there permanent valuation gains to overseas listing?,
Review of Financial Studies 22, 371-412.
Sarkissian, S., and M.J. Schill, 2012, The nature of the foreign listing premium: A cross-country
examination, Journal of Banking & Finance 36, 2494-2511
Sarkissian, S., and M.J. Schill, 2014, Cross-listing waves, Journal of Financial and Quantitative
Analysis, forthcoming.

32
Saudagaran, S., 1988, An empirical study of selected factors influencing the decision to list on
foreign stock exchanges, Journal of International Business Studies 19, 101-127.
Simon, M.C., 1998, The rise and fall of bank control in the United States: 1890-1920, American
Economic Review 88, 1077-1093.
Solnik, B., 1974, An equilibrium model of the international capital market, Journal of Economic
Theory 18, 365-378.
Tinic, S., and R. West, 1974, Marketability of common stocks in Canada and the USA: A
comparison of agent versus dealer dominated markets, Journal of Finance 29, 729-746.
Werner, I., and A. Kleidon, 1996, U.S. and U.K. trading of British cross-listed stocks: An
intraday analysis of market integration, Review of Financial Studies 9, 619-664.
Wilkins, M., 1989, The History of Foreign Investment in the United States to 1914, Harvard
University Press.

33
Table 1
Classification of U.S. regions
Region Name Constituent States
NORTH:
New England Connecticut, Maine, Massachusetts, New Hampshire, Rhode Island, Vermont
Middle Delaware, Maryland, New Jersey, New York, Pennsylvania
CENTRAL:
Central Northern Illinois, Indiana, Michigan, Ohio, Wisconsin
SOUTH:
South Atlantic Florida, Georgia, North Carolina, South Carolina, Virginia, West Virginia
Gulf & Mississippi Valley Alabama, Kentucky, Louisiana, Mississippi, Tennessee
WEST:
Northwestern Iowa, Minnesota, Montana, Nebraska, North Dakota, South Dakota, Wyoming
Southwestern Arkansas, Colorado, Kansas, Missouri, New Mexico, Oklahoma, Texas
Pacific Arizona , California, Idaho, Nevada, Oregon, Utah, Washington
This table classifies all U.S. states into four U.S. regions using regional designations of the Poor’s Manuals from the
1890s to 1913. Railroad companies are allocated to a region based on the location of the mass of their track.

34
Table 2
Frequency distribution of U.S. railroad listings
New York Listings London Foreign Listings
Total Firms Firms Bond Stock Bond First Firms Bond Stock Bond First
NORTH 40 26 20 18 0.42 25 24 9 0.93
CENTRAL 54 36 34 20 0.64 25 25 9 0.88
SOUTH 36 16 15 11 0.88 22 22 7 0.92
WEST 68 39 37 23 0.78 43 43 16 1.00
Total 198 117 106 72 0.67 115 114 41 0.94
This table provides a frequency distribution of the types of securities listings for a sample of 198 U.S. railroads on
the New York and London Stock Exchanges from 1870 to 1913. The sample is defined as all U.S. railroads with a
bond or ordinary stock listing in New York or London based on the Commercial and Financial Chronicle and the
Investors Monthly Manual. The regions are defined in Table 1. We assign each railroad to a region based on the
location of a significant mass of track assets furthest from New York. Bond First denotes the proportion of firms
which listed bonds in the respective market prior to equities.

35
Table 3
Summary statistics of characteristics of U.S. and British railroads
Panel A: Sample characteristics for U.S. railroads by region
Mean
Obs. All NORTH CENTRAL SOUTH WEST
Firm characteristics:
Revenue 4,483 9.97 14.36 7.28 6.16 11.61
Assets 4,145 73.3 85.2 47.5 50.1 102.1
Revenue growth 4,151 0.088 0.079 0.069 0.087 0.113
Asset growth 3,822 0.035 0.037 0.032 0.034 0.039
ROA 3,867 0.046 0.057 0.047 0.043 0.041
Bond characteristics:
Gold 3,522 0.46 0.39 0.28 0.57 0.62
Sterling 3,522 0.10 0.26 0.05 0.11 0.00
Default 3,522 0.011 0.007 0.009 0.009 0.016
Years-to-Maturity 3,347 35.1 37.8 30.6 35.2 36.7
Yield 3,522 5.04 4.87 5.10 5.21 5.05
Spread 3,522 2.03 1.85 2.09 2.21 2.04
Panel B: Sample characteristics for U.S. and British railroads by listing location
U.S. Railroads
in New York in London British Railroads in London
Obs. Mean Obs. Mean Obs. Mean
Firm characteristics:
Revenue 3,016 12.62 2,192 16.00
Assets 2,870 87.55 2,103 116.1 1,421 89.7
Revenue growth 2,884 0.073 2,089 0.080
Asset growth 2,731 0.034 1,995 0.035
ROA 2,755 0.049 2,010 0.047
Bond characteristics:
Gold 1,542 0.21 1,980 0.65
Sterling 1,542 0.00 1,980 0.17
Default 1,542 0.012 1,980 0.010
Years-to-Maturity 1,530 31.6 1,817 38.0 1,688 100
Yield 1,542 5.22 1,980 4.91 1,688 3.58
Spread 1,542 2.19 1,980 1.91 1,688 0.54

36
Table 3 (continued)
This table provides summary statistics for the sample of 198 U.S. railroads and 59 British railroads from 1870 to
1913. The U.S. sample is defined as all U.S. railroads with a bond or stock listing on the New York or London stock
exchanges over this period of time based on the Commercial and Financial Chronicle and the Investors Monthly
Manual. The British sample includes all but the smallest British railroads with a bond listed on the London Stock
Exchange over the sample period based on the Investors Monthly Manual. Panel A gives the summaries across U.S.
regions, and Panel B – across stock exchanges. The regions are defined in Table 1. The variables are defined as
follows: Revenue is the total revenue reported in the Poor’s Manuals in millions of U.S. dollars. Assets is the total
assets reported in the Poor’s Manuals in millions of U.S. dollars. ROA is the difference of total revenue and
operating expenses divided by the total assets. Revenue (Asset) growth is, respectively, the current total revenue
(assets) divided by the lagged revenue (assets) less unity. Spread is the yield less the prevailing yield on the long-
dated British government bond. Where a railroad has more than one bond listed, we select the bond with the longest
maturity. Gold is an indicator variable, which equals to unity if the bond is redeemable for gold, and zero otherwise.
Sterling is an indicator variable, which equals to unity if the bond is denominated in pounds sterling, and zero
otherwise. Default is an indicator variable which equals to unity in any year when a railroad is in default on its
bonds according to the Stock Exchange Year Book and zero otherwise. Years-to-Maturity is equal to the number of
years until the bond is stated to mature, as indicated by the price source or Poor’s Manual. Gold, Sterling, and
Years-to-Maturity are inferred from descriptions in the source documents. Assets in millions of U.S. dollars are
taken from the Poor’s manual for the previous year. For British railroads, assets are reported as the total of book
debt and equity capital and converted to U.S. dollars at an exchange rate of USD4.86 = GBP1. British railroads
typically issued perpetual bonds, so following Coyle and Turner (2013) Years-to-Maturity is defined as 100 years
for all British bonds.

37
Table 4
Characteristics of U.S. and British railroad bond yields across listing exchanges
Panel A: Time-series comparison
U.S. Railroads
New York London British Railroads
Obs. Mean Obs. Mean New York – London Obs. Mean London – British
1870# 5 3.73 3 2.98 0.76* 26 0.90 2.08**
1871 8 3.85 8 3.36 0.49 26 0.89 2.47**
1872 18 3.92 9 3.75 0.17 27 0.87 2.88**
1873 13 4.49 11 3.29 1.20** 26 0.89 2.40**
1874# 15 3.79 14 3.17 0.62 26 0.90 2.27**
1875# 15 3.62 19 3.22 0.41 27 0.99 2.23**
1876# 17 3.76 19 3.28 0.48 26 1.04 2.25**
1877# 19 3.88 18 3.20 0.69 26 1.04 2.15**
1878# 18 3.42 21 3.07 0.34 26 1.05 2.03**
1879 24 3.22 24 2.77 0.45 27 0.88 1.89**
1870-1879 152 3.72 146 3.17 0.56** 263 0.94 2.22**
1880 26 2.93 28 2.46 0.48* 27 0.79 1.67**
1881 32 2.97 35 2.47 0.49* 30 0.76 1.71**
1882# 32 2.91 36 2.65 0.26 33 0.80 1.85**
1883# 38 2.90 39 2.55 0.35 37 0.82 1.73**
1884# 35 2.98 39 2.46 0.52* 39 0.71 1.74**
1885 41 2.65 41 2.31 0.34 39 0.72 1.59**
1886 39 2.44 46 2.12 0.33 39 0.70 1.42**
1887# 40 2.53 47 2.18 0.34* 39 0.69 1.49**
1888 45 2.30 58 2.14 0.16 39 0.47 1.67**
1889 48 2.32 58 2.19 0.13 35 0.44 1.75**
1880-1889 376 2.66 427 2.32 0.33** 357 0.69 1.64**
1890# 48 2.44 64 2.28 0.16 41 0.43 1.85**
1891 48 2.35 68 2.33 0.03 42 0.43 1.90**
1892 47 2.35 67 2.24 0.11 44 0.40 1.84**
1893# 46 2.41 65 2.32 0.10 43 0.34 1.98**
1894# 42 2.33 68 2.18 0.16 42 0.20 1.98**
1895 42 2.41 71 2.19 0.22 43 0.12 2.08**
1896# 40 2.51 73 2.34 0.16 45 0.09 2.26**
1897# 39 2.26 75 2.21 0.05 48 0.15 2.06**
1898 36 1.93 74 1.87 0.06 48 0.24 1.63**
1899# 43 1.60 70 1.50 0.10 48 0.11 1.38**
1890-1899 431 2.27 695 2.14 0.12* 444 0.25 1.90**
1900# 44 1.41 67 1.31 0.09 48 0.22 1.10**
1901 44 1.44 66 1.33 0.10 51 0.39 0.94**
1902 44 1.54 62 1.31 0.24 51 0.40 0.91**
1903# 43 1.59 54 1.29 0.30 49 0.43 0.86**
1904# 43 1.40 51 1.18 0.22 48 0.41 0.77**
1905 43 1.41 50 1.14 0.27 46 0.47 0.66**
1906 41 1.43 50 1.16 0.28 45 0.48 0.67**
1907# 41 1.72 49 1.33 0.39* 44 0.58 0.75**
1908# 42 1.55 50 1.25 0.30* 43 0.69 0.56**
1909 43 1.46 45 1.15 0.31 42 0.66 0.49**
1900-1909 428 1.49 551 1.25 0.24** 467 0.47 0.78**
1910# 40 1.38 42 1.09 0.29 41 0.66 0.43**
1911# 39 1.24 40 0.99 0.25 41 0.57 0.42**
1912 39 1.21 38 0.93 0.28 39 0.56 0.36**
1913# 37 1.18 37 0.89 0.29 36 0.56 0.33**
1910-1913 155 1.25 161 0.98 0.28** 157 0.59 0.39**

38
Table 4 (continued)
Panel B: Cross-regional comparison
New York London
Firms Obs. Mean Firms Obs. Mean New York – London
NORTH 11 310 2.14 25 589 1.71 0.44**
CENTRAL 25 567 2.25 24 391 1.88 0.37**
SOUTH 9 210 2.29 22 357 2.16 0.13
WEST 17 455 2.10 35 648 2.01 0.09
Total 62 1,542 2.19 106 1,985 1.92 0.27**
This table gives bond yields for U.S. and British railroads for each year between 1870 and 1913. Yield refers to the
current yield defined as the coupon payment divided by the prevailing end of year bond price. In order to minimize
the impact of financial distress considerations, yields are only calculated on bonds with prices of 75 and above. U.S.
Railroad bond prices listed in New York and London are taken from the Commercial and Financial Chronicle and
the Investors Monthly Manual respectively. British railroad bond prices listed in London are taken from the
Investors Monthly Manual. Where a railroad has more than one bond listed, we select the bond with the longest
maturity. Spread the yield less the prevailing yield on the long-dated British government bond. The U.S. regions are
defined in Table 1. Panel A shows bond yields for every year in our sample and for each decade, while Panel B –
bond yield characteristics across U.S. regions. # indicates a recession year if a given year contains at least six
months defined as a contraction months according to the NBER (Business Cycle Expansions and Contractions). *
and **
denote statistical significance at the 5% and 1% level, respectively.

39
Table 5
Matched-pairs tests
Full Sample NORTH/CENTRAL SOUTH/WEST Diff: N/C – S/W
Firms 27 16 11
New York
Obs. 496 353 143
Mean bond yield 4.80 4.81 4.78
London
Obs. 380 253 127
Mean bond yield 4.79 4.58 5.21
New York – London (matched)
Obs. 283 193 90
Mean bond yield difference 0.12 0.17 0.01 0.15
(2.02) (2.41) (0.14) (2.88)
This table provides matched-pair tests for the sample of bond yields for U.S. railroads from 1870 to 1913. The U.S.
regions are defined in Table 1 and aggregated into two groups: NORTH and CENTRAL as NORTH/CENTRAL
(N/C) and SOUTH and WEST as SOUTH/WEST (S/W). The table reports the number of firms that maintain bond
listings in both New York and London and the respective bond yields in percentage points. The New York – London
(matched) heading indicates statistics for the instances when we can estimate a yield spread for a railroad with bonds
traded in both markets in the same year. The “Diff: N/C– S/W” indicates a test of the difference in matched pair
means across the two combined regions. The t-statistics are reported in parentheses.

40
Table 6 Aggregate regression estimates
Panel A: All U.S. railroads
(1) (2) (3) (4) (5) (6) (7)
FBond -0.215 -0.210 -0.189 -0.179 -0.154 -0.405
(-7.45) (-7.05) (-5.76) (-5.60) (-4.94) (-4.86)
FBond_1870 -1.042
(-1.35)
FBond_1871 -1.026
(-2.01)
FBond_1872 -0.893
(-2.29)
FBond_1911 0.012
(0.06)
FBond_1912 0.057
(0.30)
FBond_1913 0.057
(0.27)
Time -0.060 -0.051 -0.051 -0.048 -0.052
(-47.76) (-35.70) (-36.45) (-31.63) (-25.31)
FBond × Time 0.008
(3.25)
Gold -0.083 -0.084 0.007 -0.030 -0.025 -0.024 -0.068
(-2.90) (-2.84) (0.20) (-0.93) (-0.78) (-0.77) (-1.96)
Sterling 0.008 0.016 -0.062 -0.036 0.116 0.123 0.031
(0.19) (0.35) (-1.32) (-0.78) (2.45) (2.58) (0.60)
Default 0.432 0.405 0.270 0.264 0.124 0.115 0.210
(3.67) (3.35) (2.22) (2.31) (1.10) (1.01) (1.68)
Years-to-Maturity -0.008 -0.008 -0.008 -0.008
(-12.86) (-13.37) (-13.60) (-13.80)
Log (Assets) -0.136 -0.110 -0.110 -0.131
(-11.53) (-9.46) (-9.47) (-10.08)
Log (Revenue) -0.154
(-15.66)
ROA -8.758 -8.764 -9.536
(-15.34) (-15.38) (-14.08)
Revenue growth -0.481 -0.487 -0.477
(-3.98) (-4.03) (-2.83)
Intercept 3.529 3.986 5.369 5.263 5.396 5.535 6.243
(14.00) (97.80) (44.74) (63.42) (45.77) (44.23) (9.17)
Fixed effects Year No No No OffGold OffGold Year
Obs. 3,522 3,522 2,338 2,388 2,232 2,232 2,294
Adj. R2 0.486 0.446 0.543 0.579 0.611 0.612 0.536

41
Table 6 (continued)
Panel B: London-listed U.S. and British railroads
(1) (2) (3) (4)
British Railroads -0.781 -0.749 -2.161
(-14.14) (-13.28) (-29.56)
British Railroads_1870 -1.556
(-4.88)
British Railroads_1871 -1.670
(-6.95)
British Railroads_1872 -2.230
(-12.46)
British Railroads_1911 0.138
(1.17)
British Railroads_1912 0.200
(1.66)
British Railroads_1913 0.205
(1.61)
Time -0.032 -0.054
(-34.87) (-46.19)
British Railroads × Time 0.045
(27.30)
Sterling -0.113 -0.103 -0.176 -0.178
(-2.75) (-2.46) (-4.54) (-4.91)
Years-to-Maturity -0.011 -0.011 -0.009 -0.008
(-19.88) (-20.70) (-17.50) (-17.99)
Log (Assets) -0.081 -0.074 -0.060 -0.066
(-14.42) (-12.93) (-11.46) (-13.30)
Intercept 3.602 4.139 4.591 4.010
(27.61) (62.25) (72.72) (13.19)
Fixed effects Year No No Year
Obs. 3,901 3,901 3,901 3,901
Adj. R2 0.685 0.669 0.722 0.760
This table provides regressions results for the sample of bond yields for U.S. and British railroads from 1870 to
1913. Panel A gives the estimates for U.S. railroads listed in New York and London; Panel B – results for London
listed U.S. and British railroads. The dependent variable Spread is the yield less the prevailing yield on British
government bonds. Time is equal to the year less 1870. FBond is an indicator variable which equals to unity if the
firm has a bond foreign listing in London and zero otherwise. British Railroad is an indicator variable which equals
to unity if the firm is British railroad and zero otherwise. The fixed effect variables are defined as Year (annual fixed
effects) and OffGold (fixed effect for the pre-1879 period and interaction of pre-1879 period with Sterling). The last
regression in both panels contains interaction variables for all years 1870 to 1913, but only the coefficients for the
first three and last three years are reported. Other variables are defined in Table 3. The t-statistics are in parentheses.
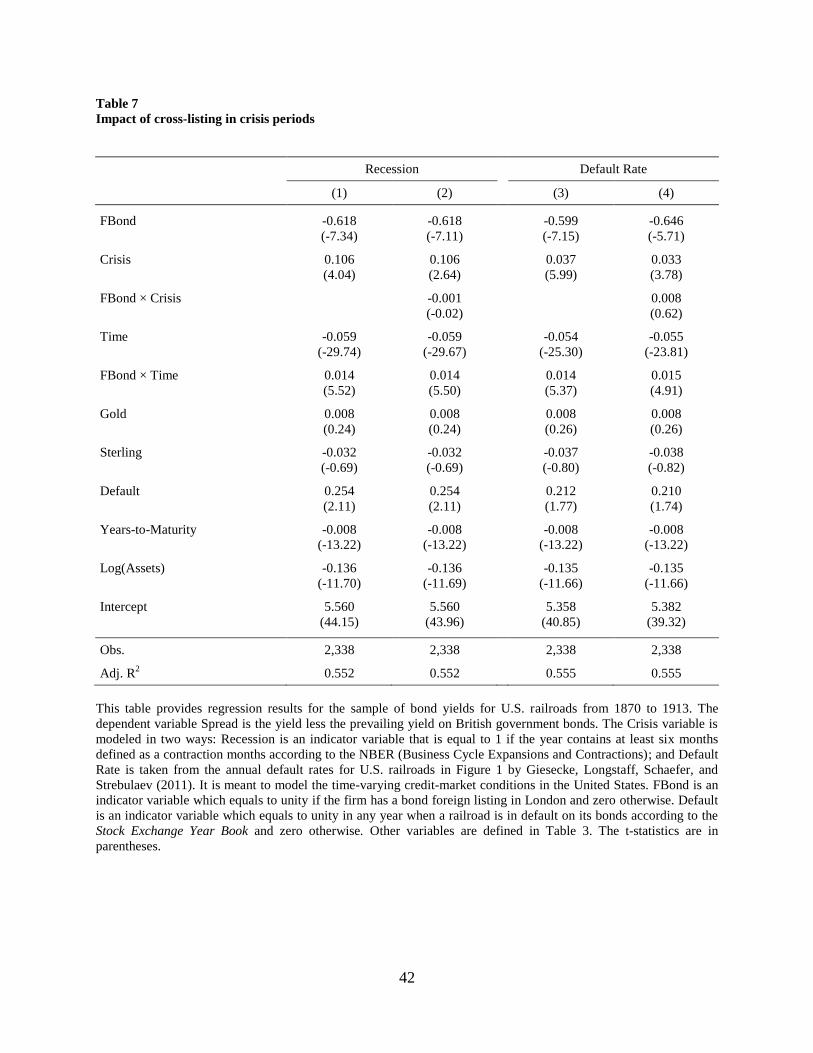
42
Table 7
Impact of cross-listing in crisis periods
Recession Default Rate
(1) (2) (3) (4)
FBond -0.618 -0.618 -0.599 -0.646
(-7.34) (-7.11) (-7.15) (-5.71)
Crisis 0.106 0.106 0.037 0.033
(4.04) (2.64) (5.99) (3.78)
FBond × Crisis -0.001 0.008
(-0.02) (0.62)
Time -0.059 -0.059 -0.054 -0.055
(-29.74) (-29.67) (-25.30) (-23.81)
FBond × Time 0.014 0.014 0.014 0.015
(5.52) (5.50) (5.37) (4.91)
Gold 0.008 0.008 0.008 0.008
(0.24) (0.24) (0.26) (0.26)
Sterling -0.032 -0.032 -0.037 -0.038
(-0.69) (-0.69) (-0.80) (-0.82)
Default 0.254 0.254 0.212 0.210
(2.11) (2.11) (1.77) (1.74)
Years-to-Maturity -0.008 -0.008 -0.008 -0.008
(-13.22) (-13.22) (-13.22) (-13.22)
Log(Assets) -0.136 -0.136 -0.135 -0.135
(-11.70) (-11.69) (-11.66) (-11.66)
Intercept 5.560 5.560 5.358 5.382
(44.15) (43.96) (40.85) (39.32)
Obs. 2,338 2,338 2,338 2,338
Adj. R2 0.552 0.552 0.555 0.555
This table provides regression results for the sample of bond yields for U.S. railroads from 1870 to 1913. The
dependent variable Spread is the yield less the prevailing yield on British government bonds. The Crisis variable is
modeled in two ways: Recession is an indicator variable that is equal to 1 if the year contains at least six months
defined as a contraction months according to the NBER (Business Cycle Expansions and Contractions); and Default
Rate is taken from the annual default rates for U.S. railroads in Figure 1 by Giesecke, Longstaff, Schaefer, and
Strebulaev (2011). It is meant to model the time-varying credit-market conditions in the United States. FBond is an
indicator variable which equals to unity if the firm has a bond foreign listing in London and zero otherwise. Default
is an indicator variable which equals to unity in any year when a railroad is in default on its bonds according to the
Stock Exchange Year Book and zero otherwise. Other variables are defined in Table 3. The t-statistics are in
parentheses.
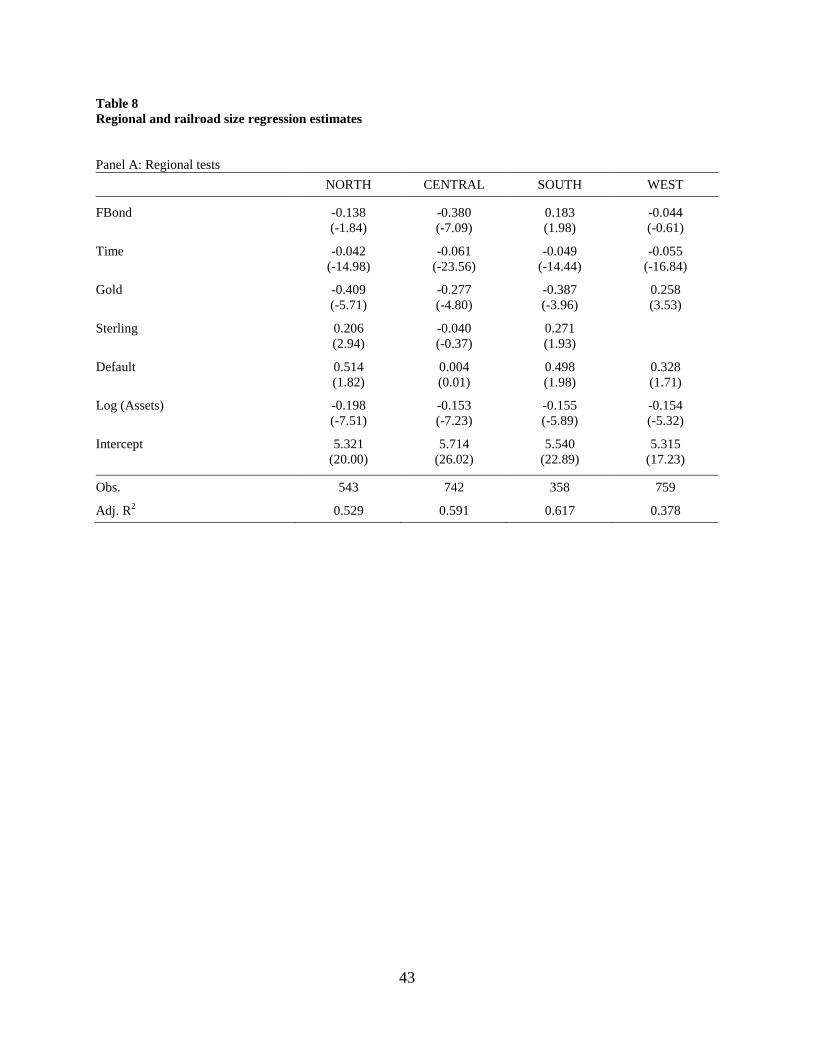
43
Table 8
Regional and railroad size regression estimates
Panel A: Regional tests
NORTH CENTRAL SOUTH WEST
FBond -0.138 -0.380 0.183 -0.044
(-1.84) (-7.09) (1.98) (-0.61)
Time -0.042 -0.061 -0.049 -0.055
(-14.98) (-23.56) (-14.44) (-16.84)
Gold -0.409 -0.277 -0.387 0.258
(-5.71) (-4.80) (-3.96) (3.53)
Sterling 0.206 -0.040 0.271
(2.94) (-0.37) (1.93)
Default 0.514 0.004 0.498 0.328
(1.82) (0.01) (1.98) (1.71)
Log (Assets) -0.198 -0.153 -0.155 -0.154
(-7.51) (-7.23) (-5.89) (-5.32)
Intercept 5.321 5.714 5.540 5.315
(20.00) (26.02) (22.89) (17.23)
Obs. 543 742 358 759
Adj. R2 0.529 0.591 0.617 0.378

44
Table 8 (continued)
Panel B: Pooled tests
(1) (2) (3)
FBond -0.275 -0.399 -0.288
(-3.95) (-9.02) (-5.44)
Time -0.053 -0.053 -0.052
(-34.65) (-34.39) (-32.47)
Gold -0.163 -0.157 -0.160
(-4.61) (-4.48) (-4.57)
Sterling 0.193 0.155 0.163
(3.42) (2.88) (3.04)
Default 0.329 0.341 0.346
(2.65) (2.73) (2.78)
Log (Assets) -0.163 -0.167 -0.169
(-12.52) (-12.85) (-8.24)
CENTRAL 0.294
(5.04)
SOUTH 0.438 0.240 0.236
(5.65) (3.56) (3.49)
WEST 0.203 0.009 -0.000
(3.09) (0.17) (-0.00)
Large 0.164
(3.09)
CENTRAL × FBond -0.171
(-2.09)
SOUTH × FBond 0.361 0.489 0.490
(3.67) (5.69) (5.70)
WEST × FBond 0.456 0.578 0.584
(5.39) (8.54) (8.63)
Large × FBond -0.241
(-4.09)
Intercept 5.250 5.479 5.434
(37.71) (41.01) (28.17)
Obs. 2,402 2,402 2,402
Adj. R2 0.508 0.502 0.506
This table provides regression results for the sample of bond yields for U.S. railroads from 1870 to 1913. The U.S.
regions are defined in Table 1. The dependent variable Spread is the yield less the prevailing yield on British
government bonds. Time is the number of years since 1870. FBond is an indicator variable which equals to unity if
the firm has a bond foreign listing in London and zero otherwise. Large is an indicator that equals unity if the firm’s
assets are larger than the year and region median, and zero otherwise. Other variables are defined in Table 3. These
regressions do not include year fixed effects. The t-statistics are in parentheses.
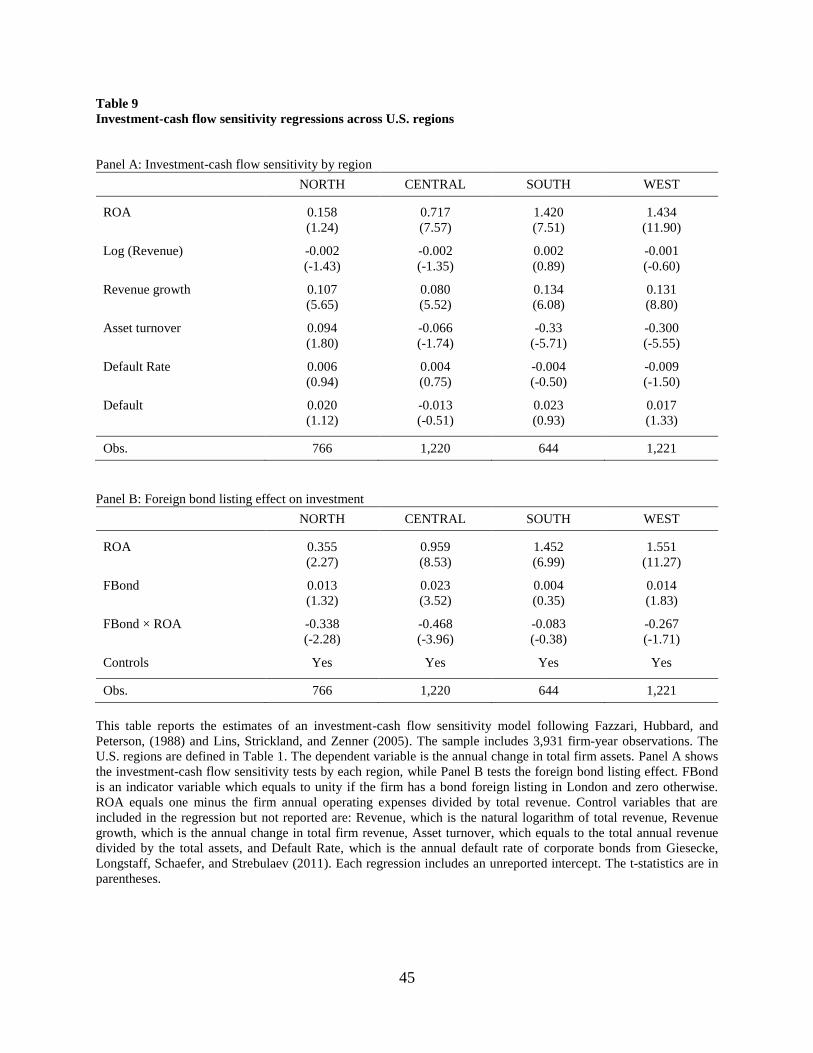
45
Table 9
Investment-cash flow sensitivity regressions across U.S. regions
Panel A: Investment-cash flow sensitivity by region
NORTH CENTRAL SOUTH WEST
ROA 0.158 0.717 1.420 1.434
(1.24) (7.57) (7.51) (11.90)
Log (Revenue) -0.002 -0.002 0.002 -0.001
(-1.43) (-1.35) (0.89) (-0.60)
Revenue growth 0.107 0.080 0.134 0.131
(5.65) (5.52) (6.08) (8.80)
Asset turnover 0.094 -0.066 -0.33 -0.300
(1.80) (-1.74) (-5.71) (-5.55)
Default Rate 0.006 0.004 -0.004 -0.009
(0.94) (0.75) (-0.50) (-1.50)
Default 0.020 -0.013 0.023 0.017
(1.12) (-0.51) (0.93) (1.33)
Obs. 766 1,220 644 1,221
Panel B: Foreign bond listing effect on investment
NORTH CENTRAL SOUTH WEST
ROA 0.355 0.959 1.452 1.551
(2.27) (8.53) (6.99) (11.27)
FBond 0.013 0.023 0.004 0.014
(1.32) (3.52) (0.35) (1.83)
FBond × ROA -0.338 -0.468 -0.083 -0.267
(-2.28) (-3.96) (-0.38) (-1.71)
Controls Yes Yes Yes Yes
Obs. 766 1,220 644 1,221
This table reports the estimates of an investment-cash flow sensitivity model following Fazzari, Hubbard, and
Peterson, (1988) and Lins, Strickland, and Zenner (2005). The sample includes 3,931 firm-year observations. The
U.S. regions are defined in Table 1. The dependent variable is the annual change in total firm assets. Panel A shows
the investment-cash flow sensitivity tests by each region, while Panel B tests the foreign bond listing effect. FBond
is an indicator variable which equals to unity if the firm has a bond foreign listing in London and zero otherwise.
ROA equals one minus the firm annual operating expenses divided by total revenue. Control variables that are
included in the regression but not reported are: Revenue, which is the natural logarithm of total revenue, Revenue
growth, which is the annual change in total firm revenue, Asset turnover, which equals to the total annual revenue
divided by the total assets, and Default Rate, which is the annual default rate of corporate bonds from Giesecke,
Longstaff, Schaefer, and Strebulaev (2011). Each regression includes an unreported intercept. The t-statistics are in
parentheses.

46
Plot A: 1870
Plot B: 1880
Plot C: 1890
Figure 1. Historical railroad maps of the United States. This figure shows the U.S. railroad maps in 1870 (Plot
A), 1880 (Plot B), and 1890 (Plot C). The source: “American Railroads: Their Growth and Development,” The
Association of American Railroads, 1951. http://www.cprr.org/Museum/RR_Development.html.

47
Figure 2. Frequency of railroads with bonds listed in London and New York. This figure shows the total
number of U.S. railroads listed in each of New York and London, and the number of British railroads listed in
London between 1870 and 1913.
0
10
20
30
40
50
60
70
80
18
70
18
73
18
76
18
79
18
82
18
85
18
88
18
91
18
94
18
97
19
00
19
03
19
06
19
09
19
12
Num
ber
of
railr
oads w
ith b
onds lis
ted
U.S. railroads in New York U.S. railroads in London British railroads in London

48
Figure 3. Annual penetration of U.S. railroads by region listed in London. This figure shows the average annual percentage of U.S. railroads by region with bond listings in London over the period from 1870 to 1913. Regional definitions are provided in Table 1.
0%
20%
40%
60%
80%
100%
18
70
18
73
18
76
18
79
18
82
18
85
18
88
18
91
18
94
18
97
19
00
19
03
19
06
19
09
19
12
NORTH CENTRAL SOUTH WEST

49
Plot A: Frequency distribution of the number of bonds traded in both New York and London
Plot B: New York – London spread in bond yields traded in both New York and London
Figure 4. Matched bond pairs listed in both New York and London. This figure shows the number of bonds and
the yield spread for the sample of 27 railroads with bonds traded in both New York and London in the same year
between 1870 and 1913. Plot A gives the yearly frequency distribution of the number of such bonds traded in both
cities. Plot B shows the corresponding New York – London spread in bond yields over the sample period covering
more than two bond yield observations.
0
2
4
6
8
10
12
14
18
70
18
73
18
76
18
79
18
82
18
85
18
88
18
91
18
94
18
97
19
00
19
03
19
06
19
09
19
12
Num
ber
of
bonds
-0.1
0.0
0.1
0.2
0.3
0.4
18
70
18
73
18
76
18
79
18
82
18
85
18
88
18
91
18
94
18
97
19
00
19
03
19
06
19
09
19
12
New
York
-London b
ond y
ield
spre
ad (
%)

50
Figure 5. Foreign listing gain by year. This figure plots the coefficients on the interaction terms of FBond with
dummies for each year between 1870 and 1913, where we substitute the decade dummy variables with year
dummies in Regression (7) in Panel A of Table 6. We flip the negative sign of the coefficients to illustrate the
decline in the premium resulting from listing in London.
-0.2
0.0
0.2
0.4
0.6
0.8
1.0
1.2
18
70
18
73
18
76
18
79
18
82
18
85
18
88
18
91
18
94
18
97
19
00
19
03
19
06
19
09
19
12

51
Figure 6. Telegraph communication rates from London by destination city. This figure shows the telegraph
communication rates from London to the centers of four U.S. regions. Rates are the cost of transmitting the first 10
words of any message. The source data for London to New York is published in the Historical Statistics of the
United States: Colonial Times to 1970 Part 2, U.S. Department of Commerce, 1975, based on documents from the
U.S. Federal Communications Commission and other sources specified in the report. The rates from New York to
Chicago, San Francisco, and the average of the rates from New York to Atlanta and New Orleans are from
Honsowetz (2014). The rates from London to Chicago and to San Francisco and the average of the rates from
London to Atlanta and New Orleans are estimated by adding the London – New York rate to the rate between the
destination city and New York. Data points between some observations are interpolated.
$0
$2
$4
$6
$8
$10
1870 1872 1874 1884 1888 1900 1906 1913
London - New York London - Chicago
London - Atlanta/New Orleans London - San Francisco

52
Figure 7. Regional shares of total British immigration to the United States. This figure shows the percentage of
British immigrants in each of the four U.S. regions normalized by the total regional population for each decade
between 1870 and 1910. Immigration data are taken from the Integrated Public Use Microdata Series (IPUMS) at
the University of Michigan.
0%
1%
2%
3%
4%
1870 1880 1890 1900 1910
NORTH CENTRAL SOUTH WEST