Embed Size (px)
Citation preview
MARKET-BASED ENVIRONMENTAL POLICIES
Robert N. StavinsJohn F. Kennedy School of Government, Harvard University
Resources for the Future
Prepared forPublic Policies for Environmental Protection
edited byPaul R. Portney and Robert N. Stavins
Revised: September 22, 1998
ABSTRACT
Some eighty years ago, economists first proposed the use of corrective taxes to internalizeenvironmental and other externalities. Fifty years later, the portfolio of potential economic-incentiveinstruments was expanded to include quantity-based mechanisms — tradeable permits. Thus, economic-incentive approaches to environmental protection are clearly not a new policy idea, and over the past twodecades, they have held varying degrees of prominence in environmental policy discussions. This papersummarizes U.S. experiences with such market-based policy instruments, including: pollution charges;deposit-refund systems; tradeable permits; market barrier reductions; and government subsidy reductions.
No particular form of government intervention, no individual policy instrument — whether market-based or conventional — is appropriate for all environmental problems. Which instrument is best in anygiven situation depends upon a variety of characteristics of the environmental problem, and the social,political, and economic context in which it is being regulated. There is no policy panacea. Indeed, the realchallenge for bureaucrats, elected officials, and other participants in the environmental policy process comesin analyzing and then selecting the best instrument for each situation that arises.
*Albert Pratt Professor of Business and Government, and Faculty Chair, Environment and Natural Resources Program,John F. Kennedy School of Government, Harvard University, and University Fellow, Resources for the Future. QuindiFranco provided excellent research assistance, and helpful comments on a previous version of the chapter were providedby Dallas Burtraw, Don Fullerton, Robert Hahn, Richard Morgenstern, Richard Porter, Paul Portney, Lynn Scarlett, andTom Tietenberg. But the author alone is responsible for any errors.
1While discussion of goals typically precedes examination of alternative means for achieving goals, this is notnecessarily the case. For example, both the Bush and Clinton administrations endorsed market-based methods foraddressing global climate change before either had committed itself to specific greenhouse policy goals.
2This section draws, in part, on: Hockenstein, Jeremy B., Robert N. Stavins, and Bradley W. Whitehead. “Creating theNext Generation of Market-Based Environmental Tools.” Environment 39, number 4 (1997), pp. 12-20, 30-33.
3See, for example: Stavins, Robert N., ed. Project 88 - Round II Incentives for Action: Designing Market-BasedEnvironmental Strategies. Sponsored by Senator Timothy E. Wirth, Colorado, and Senator John Heinz, Pennsylvania.Washington, D.C., May 1991; Stavins, Robert N., ed. Project 88: Harnessing Market Forces to Protect OurEnvironment. Sponsored by Senator Timothy E. Wirth, Colorado, and Senator John Heinz, Pennsylvania. Washington,D.C., December 1988; U.S. Environmental Protection Agency. Economic Incentives, Options for EnvironmentalProtection. Document P-2001. EPA, Washington, D.C. ,1991; Organization for Economic Cooperation and Development.Economic Instruments for Environmental Protection. Paris, 1989; and Organization for Economic Cooperation andDevelopment. Environmental Policy: How to Apply Economic Instruments. Paris, 1991. Another strain of literature— known as “free market environmentalism” — focuses on the role of private property rights in achieving environmentalprotection. See, for example: Anderson, Terry L. and Donald R. Leal. Free Market Environmentalism. Boulder:Westview Press, 1991.
1
MARKET-BASED ENVIRONMENTAL POLICIES
Robert Stavins*
1. WHAT ARE MARKET-BASED POLICY INSTRUMENTS?
Nearly all environmental policies consist of two components, either explicitly or implicitly: theidentification of an overall goal (either general or specific, such as a degree of air quality or an upper limiton emission rates) and some means to achieve that goal. In practice, these two components are oftenlinked within the political process, because both the choice of a goal, and the mechanism for achieving thatgoal, have important political ramifications.1 This chapter focuses exclusively on the second component,the means — the “instruments” — of environmental policy, and considers, in particular, economic-incentiveor market-based policy instruments.
1.1 A Definition
Market-based instruments are regulations that encourage behavior through market signals ratherthan through explicit directives regarding pollution control levels or methods.2 These policy instruments,such as tradable permits or pollution charges, are often described as “harnessing market forces”3 because
4For descriptions of the use of command-and-control instruments for various environmental problems, see the otherchapters in this volume.
5But various command-and-control standards do this in different ways. See: Helfand, Gloria E. “Standards versusStandards: The Effects of Different Pollution Restrictions.” American Economic Review 81(1991):622-634.
6See Tietenberg, Tom. Emissions Trading: An Exercise in Reforming Pollution Policy. Washington, D.C.: Resourcesfor the Future, 1985.
2
if they are well designed and implemented, they encourage firms (and/or individuals) to undertake pollutioncontrol efforts that both are in those firms’ (or individuals’) interests and that collectively meet policy goals.
By way of contrast, conventional approaches to regulating the environment are often referred toas “command-and-control” regulations since they allow relatively little flexibility in the means of achievinggoals. Early environmental policies, such as the Clean Air Act of 1970 and the Clean Water Act of 1972,relied almost exclusively on these approaches.4
In general, command-and-control regulations tend to force firms to shoulder similar shares of thepollution-control burden, regardless of the relative costs to them of this burden.5 Command-and-controlregulations do this by setting uniform standards for firms, the most prevalent of which are technology-basedand performance-based standards. Technology-based standards specify the method, and sometimes theactual equipment, that firms must use to comply with a particular regulation. For example, all electricutilities might be required to employ a specific type of scrubber to remove particulates. A performancestandard sets a uniform control target for firms, while allowing some latitude in how this target is met. Forexample, a regulation might limit the number of allowable units of a pollutant released in a given time period,but might not dictate the means by which this is achieved.
Holding all firms to the same target can be expensive and, in some circumstances,counterproductive. While standards may effectively limit emissions of pollutants, they typically exactrelatively high costs in the process, by forcing some firms to resort to unduly expensive means of controllingpollution. Because the costs of controlling emissions may vary greatly among firms, and even amongsources within the same firm, the appropriate technology in one situation may be inappropriate in another.Thus, control costs can vary enormously due to a firm’s production design, physical configuration, age ofits assets, or other factors. One survey of eight empirical studies of air pollution control found that the ratioof actual, aggregate costs of the conventional, command-and-control approach to the aggregate costs ofleast-cost benchmarks ranged from 1.07 for sulfate emissions in the Los Angeles area to 22.0 forhydrocarbon emissions at all domestic DuPont plants.6
Furthermore, command-and-control regulations tend to freeze the development of technologies thatmight otherwise result in greater levels of control. Little or no financial incentive exists for businesses toexceed their control targets, and both technology-based and performance-based standards discourageadoption of new technologies. A business that adopts a new technology may be “rewarded” by being heldto a higher standard of performance, but is not given the opportunity to benefit financially from itsinvestment, except to the extent its competitors have even more difficulty reaching the new standard.
7Under certain circumstances, substituting a market-based instrument for a command-and-control instrument can lower
environmental quality, because command-and-control standards tend to lead to over-control. On this, see: Oates,Wallace E., Paul R. Portney, and Albert M. McGartland. "The Net Benefits of Incentive-Based Regulation: A CaseStudy of Environmental Standard Setting." American Economic Review 79(1989):1233-1243.
8Each source’s marginal cost of pollution control is the additional or incremental cost for that source to achieve anadditional unit of pollution reduction. If this marginal cost of control is not equal across sources, then the sameaggregate level of pollution control could be achieved at lower overall cost simply by reallocating the pollution controlburden among sources, so that low-cost controllers controlled more, and high-cost controllers controlled proportionatelyless. Additional savings could theoretically be achieved through such reallocations until marginal costs were identicalfor all sources. See: Baumol, William J. and Wallace E. Oates. The Theory of Environmental Policy. Second Edition.New York: Cambridge University Press, 1988. Reference here is to marginal abatement cost, that is, marginal cost ofemission reduction. Things become more complicated, but the general point holds with non-uniformly mixed pollutants,where the focus is on ambient concentration or exposure, not simply emissions. On this, see: Montgomery, David."Markets in Licenses and Efficient Pollution Control Programs,” Journal of Economic Theory 5(1972):395-418; andTietenberg, Tom H. “Tradeable Permits for Pollution Control When Emission Location Matters: What Have WeLearned?” Environmental and Resource Economics 5(1995):95-113.
9For a theoretical analysis of the dynamic incentives of technological change under alternative policy instruments, see,for example: Downing, Paul B. and Lawrence J. White. “Innovation in Pollution Control.” Journal of EnvironmentalEconomics and Management 13(1986):18-27; Malueg, David. “Emission Credit Trading and the Incentive to Adopt NewPollution Abatement Technology.” Journal of Environmental Economics and Management 16(1989):52-57; Milliman,Scott R., and Raymond Prince. “Firm Incentives to Promote Technological Change in Pollution Control.” Journal of
3
1.2 Characteristics of Market-Based Policy Instruments
The two most notable advantages that market-based instruments offer over traditional command-and-control approaches are cost effectiveness and dynamic incentives for technology innovation anddiffusion.
In theory, if properly designed and implemented, market-based instruments allow any desired levelof pollution cleanup to be realized at the lowest possible overall cost to society, by providing incentives forthe greatest reductions in pollution by those firms that can achieve these reductions most cheaply.7 Ratherthan equalizing pollution levels among firms (as with uniform emission standards), market-based instrumentsequalize the incremental amount that firms spend to reduce pollution (their marginal cost).8
It is important to recognize that command-and-control approaches could — theoretically —achieve this cost-effective solution, but this would require that different standards be set for each pollutionsource, and, consequently, that policy makers obtain detailed information about the compliance costs eachfirm faces. Such information is simply not available to government. By contrast, market-based instrumentsprovide for a cost-effective allocation of the pollution control burden among sources without requiring thegovernment to have this information.
In contrast to command-and-control regulations, market-based instruments have the potential toprovide powerful incentives for companies to adopt cheaper and better pollution-control technologies. Thisis because with market-based instruments, it always pays firms to clean up a bit more if a sufficiently low-cost method (technology or process) of doing so can be identified and adopted.9

Environmental Economics and Management 17(1989):247-265; and Jung, Chulho, Kerry Krutilla, and Roy Boyd.“Incentives for Advanced Pollution Abatement Technology at the Industry Level: An Evaluation of PolicyAlternatives.” Journal of Environmental Economics and Management 30(1996):95-111. The empirical literature isconsiderably thinner. See: Jaffe, Adam B. and Robert N. Stavins. “Dynamic Incentives of Environmental Regulations:The Effects of Alternative Policy Instruments on Technology Diffusion.” Journal of Environmental Economics andManagement 29 (1995): S-43-S-63.
10See, generally: Organization for Economic Cooperation and Development. Evaluating Economic Incentives forEnvironmental Policy. Paris, 1994; Organization for Economic Cooperation and Development. The Distributive Effectsof Economic Instruments for Environmental Policy. Paris, 1994; and Organization for Economic Cooperation andDevelopment. Managing the Environment — The Role of Economic Instruments. Paris, 1994.
11Pigou is generally credited with developing the idea of a corrective tax to discourage activities which generateexternalities, such as environmental pollution. See Pigou, Arthur C. The Economics of Welfare 4th Ed., 1952.
12For example, a pollution charge might take the form of a charge per unit of sulfur dioxide emissions, but not a chargeper unit of electricity generated. The choice of whether to tax pollution quantities, activities preceding discharge, inputsto those activities, or actual damages will depend upon tradeoffs between costs of abatement, mitigation, damages, andprogram administration, including monitoring and enforcement.
13See: Bohm, Peter. Deposit-Refund Systems: Theory and Applications to Environmental, Conservation, and ConsumerPolicy. Washington, D.C.: Resources for the Future, 1981; and Menell, Peter. “Beyond the Throwaway Society: AnIncentive Approach to Regulating Municipal Solid Waste.” Ecology Law Quarterly 17(1990):655-739.
4
1.3 Categories of Market-Based Instruments
Market-based instruments can be considered within four major categories: pollution charges;tradable permits; market barrier reductions; and government subsidy reductions.10
Pollution charge systems assess a fee or tax11 on the amount of pollution that a firm or sourcegenerates.12 Consequently, it is worthwhile for the firm to reduce emissions to the point where its marginalabatement cost is equal to the tax rate. Firms will thus control pollution to differing degrees, with high-costcontrollers controlling less, and low-cost controllers controlling more. A challenge with charge systems isidentifying the appropriate tax rate. Ideally, it should be set equal to the benefits of cleanup at the efficientlevel of cleanup, but policy makers are more likely to think in terms of a desired level of cleanup, and theydo not know beforehand how firms will respond to a given level of taxation.
A special case of pollution charges is a deposit refund system, where consumers pay a surchargewhen purchasing potentially polluting products, and receive a refund when returning the product to anapproved center (for recycling or disposal). A number of states have implemented this approach through“bottle bills,” to control litter from beverage containers and to reduce the flow of solid waste to landfills,and the concept has also been applied to lead-acid batteries.13
14Thirty years ago, Thomas Crocker and John Dales independently developed the idea of using transferable dischargepermits to allocate the pollution-control burden among firms or individuals. See: Crocker, Thomas D. “The Structuringof Atmospheric Pollution Control Systems,” in The Economics of Air Pollution, (Harold Wolozin, Ed.), W. W. Norton& Company, Inc., NY (1966); and Dales, John. Pollution, Property and Prices. Toronto: University Press, 1968. DavidMontgomery provided the first rigorous proof that a tradeable permit system could, in theory, provide a cost-effectivepolicy instrument for pollution control (1972). A sizeable literature on tradeable permits has followed. Early surveys ofthe literature are found in: Tietenberg, Tom. “Transferable Discharge Permits and the Control of Stationary Source AirPollution: A Survey and Synthesis.” Land Economics 56(1980):391-416; and Tietenberg (1985). Also see: Hahn, Robertand Roger Noll. “Designing a Market for Tradeable Permits.” in Reform of Environmental Regulation. W. Magat, ed,1982. Much of the literature on tradeable permits may actually be traced to Coase’s treatment of negotiated solutionsto externality problems. See generally: Coase, Ronald. “The Problem of Social Cost.” Journal of Law and Economics3(1960):1-44.
15Reference here is to so-called “cap-and-trade” programs, but — as we discuss later — some programs, such as EPA’sEmissions Trading Program, operate differently, as “credit programs,” where permits or credits are assigned only whena source reduces emissions below what is required by existing, source-specific limits.
16See: Stavins, Robert N. and Bradley W. Whitehead. "Pollution Charges for Environmental Protection: A Policy LinkBetween Energy and Environment." Annual Review of Energy and the Environment 17(1992):187-210.
5
Tradable permits can achieve the same cost-minimizing allocation of the control burden as acharge system, while avoiding the problem of uncertain responses by firms.14 Under a tradable permitsystem, an allowable overall level of pollution is established and allocated among firms in the form ofpermits.15 Firms that keep their emission levels below their allotted level may sell their surplus permits toother firms or use them to offset excess emissions in other parts of their facilities.
Market barrier reductions can also serve as market-based policy instruments. In such cases,substantial gains can be made in environmental protection simply by removing existing explicit or implicitbarriers to market activity. Three types of market barrier reductions stand out: (1) market creation, aswith measures that facilitate the voluntary exchange of water rights and thus promote more efficientallocation and use of scarce water supplies; (2) liability rules that encourage firms to consider the potentialenvironmental damages of their decisions; and (3) information programs, such as energy-efficiencyproduct labeling requirements.
Government subsidy reductions are the fourth and final category of market-based instruments.Subsidies, of course, are the mirror image of taxes and, in theory, can provide incentives to addressenvironmental problems. In practice, however, many subsidies promote economically inefficient andenvironmentally unsound practices. This market distortion received much attention in the 104th Congressunder the rubric of “corporate welfare,” an example of which is the below-cost sale of timber by the U.S.Forest Service.
In the simplest models, pollution taxes and tradeable permits are symmetric, but that symmetrybegins to break down in actual implementation.16 First, permits fix the level of pollution control whilecharges fix the costs of pollution control. Second, in the presence of technological change and withoutadditional government intervention, permits freeze the level of pollution control while charges increase it.Third, with permit systems as typically adopted, resource transfers are private-to-private, while they are
17See: Hahn, Robert W. “Market Power and Transferable Property Rights.” Quarterly Journal of Economics 99(1984):753-765; Malueg, David A. “Emission Credit Trading and the Incentive to Adopt New Pollution AbatementTechnology.” Journal of Environmental Economics and Management 16(1989):52-57; and Misolek, W. S. and H. W.Elder. “Exclusionary Manipulation of Markets for Pollution Rights.” Journal of Environmental Economics andManagement 16(1989):156-166.
18See: Stavins, Robert N. “Transaction Costs and Tradeable Permits.” Journal of Environmental Economics andManagement 29(1995):133-147.
19See: Weitzman, Martin L. “Prices vs. Quantities.” Review of Economic Studies 41(1974):477-491; Adar, Z. and J.M.Griffin, "Uncertainty and the Choice of Pollution Control Instruments," Journal of Environmental Economics andManagement 3(1976):178-188; and Tisato, P. "Pollution Standards vs Charges Under Uncertainty." Environmental andResource Economics 4(1994):295-304.
20See: Stavins, Robert N. “Correlated Uncertainty and Policy Instrument Choice.” Journal of Environmental Economicsand Management 30(1996):218-232.
21See: Jorgenson, Dale and Peter Wilcoxen. “The Economic Effects of a Carbon Tax.” Paper presented to the IPCCWorkshop on Policy Instruments and their Implications, Tsukuba, Japan, January 17–20, 1994; and Goulder, Lawrence.“Effects of Carbon Taxes in an Economy with Prior Tax Distortions: An Intertemporal General Equilibrium Analysis.”Journal of Environmental Economics and Management 29(1995):271-297.
22See: Repetto, Robert, Roger Dower, R. Jenkins, and Jackie Geoghegan. Green Fees: How a Tax Shift Can Work forthe Environment and the Economy. World Resources Institute, Washington, D.C., 1992.
23See: Bovenberg, A. Lans and R. de Mooij. “Environmental Levies and Distortionary Taxation.” American EconomicReview 84(1994):1085-1089; Bovenberg, A. Lans and Lawrence H. Goulder. “Optimal Environmental Taxation in thePresence of Other Taxes: General-Equilibrium Analyses.” American Economic Review 86(1996):985-1000; Goulder,Lawrence. “Environmental Taxation and the Double Dividend: A Reader’s Guide.” International Tax and PublicFinance 2(1995):157-183; and Parry, Ian. “Pollution, Taxes, and Revenue Recycling.” Journal of Environmental
6
private-to-public with ordinary pollution charges. Fourth, while both charges and permits increase costson industry and consumers, charge systems tend to make those costs more obvious to both groups. Fifth,permits adjust automatically for inflation, while some types of charges do not. Sixth, permit systems maybe more susceptible to strategic behavior.17 Seventh, significant transaction costs can drive up the totalcosts of compliance, having a negative effect under either system, but particularly with tradeable permits.18
Eighth and finally, in the presence of uncertainty, either permits or charges can be more efficient, dependingupon the relative slopes of the marginal benefit and marginal cost functions19 and any correlation betweenthem.20
The degree of abatement achieved by a pollution tax and the tax's effect on the economy willdepend — in part — on what is done with the tax revenue. There is widespread agreement that revenuerecycling (that is, using pollution tax revenues to lower other taxes) can significantly lower the costs of apollution tax21. Some researchers have suggested, further, that all of the abatement costs associated witha pollution tax can be eliminated through revenue recycling in the form of cuts in taxes on labor.22 Butpollution taxes can exacerbate distortions associated with remaining taxes on investment or labor. Thereis now common recognition that environmental taxes impose their own distortions that are at least as greatas those from labor taxes.23 Using revenues from an environmental tax (or from the auction of pollution
Economics and Management 29(1995):64-77.
24See: Goulder, Lawrence, Ian Parry, and Dallas Burtraw. “Revenue-Raising Versus Other Approaches to EnvironmentalProtection: The Critical Significance of Preexisting Tax Distortions.” RAND Journal of Economics 28(1997):708-731; andFullerton, Don, and Gilbert Metcalf. “Environmental Controls, Scarcity Rents, and Pre-Existing Distortions.” NationalBureau of Economic Research Working Paper No. 6091, July 1997.
25See, more broadly: Tietenberg, Tom. “Tradeable Permits and the Control of Air Pollution in the United States.” Paperprepared for the 10th Anniversary Jubilee edition of Zeitschrift Fürangewandte Umweltforschung, 1997; and U.S.Environmental Protection Agency. The United States Experience with Economic Incentives to Control EnvironmentalPollution. EPA-230-R-92-001. Washington, D.C., 1992.
26In addition, the Energy Policy and Conservation Act of 1975 established a program of Corporate Average FuelEconomy (CAFE) standards for automobiles and light trucks. The standards require manufacturers to meet a minimumsales-weighted average fuel efficiency for their fleet of cars sold in the United States. A penalty is charged per car soldper unit of average fuel efficiency below the standard. The program operates much like an internal-firm tradeable permitsystem or “bubble” scheme, since manufacturers can undertake efficiency improvements wherever they are cheapestwithin their fleets. Firms that do better than the standard can “bank” their surpluses and — in some cases — arepermitted to borrow against their future rights. For reviews of the literature on CAFE standards, with particular attentionto the program’s costs relative to “equivalent” gasoline taxes, see: Crandall, Robert W., Howard K. Gruenspecht,Theodore E. Keeler, and Lester B. Lave. Regulating the Automobile. Washington, D.C.: The Brookings Institute, 1986;and Goldberg, Penelopi K. “The Effects of the Corporate Average Fuel Efficiency Standards.” Working Paper,Department of Economics, Princeton University, 1997. Light trucks, which are defined by the Federal government toinclude “sport utility vehicles,” face significantly weaker CAFE standards. See: Bradsher, Keith. “Light Trucks IncreaseProfits But Foul Air More than Cars.” New York Times, November 30, 1997, pp. A1, A38-A39. Also, California has useda vehicle retirement program that operates much like a tradeable-permit system to reduce mobile-source air emissions byremoving the oldest and most polluting vehicles from the road. On this, see: Tietenberg (1997); Alberini, Anna, WinstonHarrington, and Virginia McConnell. “Determinants of Participation in Accelerated Vehicle Retirement Programs.” RANDJournal of Economics 26(1995):93-112; and Kling, Catherine L. “Emission Trading vs. Rigid Regulations in the Controlof Vehicle Emissions.” Land Economics 70(1994):174-188. In addition, the Northeast and Middle Atlantic states haveorganized a NOx permit trading program to control regional smog (Tietenberg 1997).
7
permits24) to reduce labor taxes can reduce the efficiency costs of the environmental tax, but — in mostcases — the substitution of an environmental tax for an investment or labor tax will reduce welfare, apartfrom the potentially beneficial environmental consequences of the tax. Thus, the primary justification forenvironmental taxes should be their environmental benefits, not reform of the tax system per se.
2. U.S. EXPERIENCE WITH TRADEABLE PERMIT SYSTEMS
The most frequently employed market-based environmental instruments in the United States havebeen tradeable permit systems.25 Among these are the following: the U.S. Environmental ProtectionAgency’s (EPA) Emissions Trading Program, the leaded gasoline phasedown, water quality permit trading,CFC trading, the SO2 allowance system for acid rain control, the RECLAIM program in the Los Angelesmetropolitan region, and tradeable development rights for land use (Table 1).26
27The “netting” and “bubbles” concept aggregates emissions from all the components of an industrial plant andconsiders them a single source for purposes of regulation. An evaluation of EPA’s Emissions Trading Program can befound in: Tietenberg, Tom. Emission Trading: An Exercise in Reforming Pollution Policy. Washington, D.C.:Resources for the Future, 1985; and Foster, Vivien and Robert W. Hahn. “Designing More Efficient Markets: Lessonsfrom Los Angeles Smog Control.” Journal of Law and Economics 38(1995):19-48. For a broader assessment of EPA’sexperience with tradeable permit policies, see Robert W. Hahn. “Economic Prescriptions for Environmental Problems:How the Patient Followed the Doctor’s Orders.” Journal of Economic Perspectives 3 (1989): 95-114.
28U.S. Environmental Protection Agency, Emissions Trading Policy Statement, 51 Fed. Reg. 43,814 (1986) (final policystatement).
29See Liroff, Richard A. Reforming Air Pollution Regulations: The Toil and Trouble of EPA’s Bubble. Washington, D.C.:Conservation Foundation, 1986.
30See Main, Jeremy. “Here Comes the Big New Cleanup.” Fortune (November 1988): p. 102-118.
31See Hahn, Robert W. and Gordon L. Hester. “Where Did All the Markets Go? An Analysis of EPA’s Emissions TradingProgram.” Yale Journal of Regulation 6 (1989): 109-153.
8
2.1 EPA’s Emissions Trading Program
Beginning in 1974, EPA experimented with “emissions trading” as part of the Clean Air Act’sprogram for improving local air quality. Firms that reduced emissions below the level required by lawreceived “credits” usable against higher emissions elsewhere. Companies could employ the concepts of“netting” or “bubbles” to trade emissions reductions among sources within the firm, so long as total,combined emissions did not exceed an aggregate limit.27
The “offset” program, which began in 1976, goes further in allowing firms to trade emission credits.Firms wishing to establish new sources in areas that are not in compliance with ambient standards mustoffset their new emissions by reducing existing emissions. This can be accomplished through internalsources or through agreements with other firms. Finally, under the “banking” program, firms may storeearned emission credits for future use. Banking allows for either future internal expansion or the sale ofcredits to other firms.
EPA codified these programs in its Emissions Trading Program in 1986,28 but the programs havenot been widely used. States are not required to use the program, and uncertainties about its future courseseem to have made firms reluctant to participate.29 Nevertheless, companies such as Armco, DuPont, USX,and 3M have traded emissions credits, and a market for transfers has long since developed.30 Even thislimited degree of participation in EPA’s trading programs may have saved between $5 billion and$12 billion over the life of the program.31
32U.S. Environmental Protection Agency. Regulation of Fuel and Fuel Additives. 38,078-90 (proposed rule). 49,322-24(final rule).
33In each year of the program, more than 60 percent of the lead added to gasoline was associated with traded lead credits.See Robert W. Hahn and Gordon L. Hester, “Marketable Permits: Lessons for Theory and Practice,” Ecology LawQuarterly 16 (1989): 361-406.
34See: Kerr, Suzi and David Maré. “Efficient Regulation Through Tradeable Permit Markets: The United States LeadPhasedown.” Department of Agricultural and Resource Economics, University of Maryland, College Park, WorkingPaper 96-06, January 1997.
35See: Nichols, Albert L. “Lead in Gasoline.” Economic Analyses at EPA: Assessing Regulatory Impact, ed. RichardD. Morgenstern, pp. 49-86. Washington, D.C.: Resources for the Future, 1997.
36The program did experience some relatively minor implementation difficulties related to imported leaded fuel. It is notclear that a comparable command-and-control approach would have done better in terms of environmental quality. SeeU.S. General Accounting Office, Vehicle Emissions: EPA Program to Assist Leaded-Gasoline Producers Needs PromptImprovement, GAO/RCED-86-182 (Washington, DC: U.S. GAO, August 1986)
37See: U.S. Environmental protection Agency, Office of Policy Analysis, Costs and Benefits of Reducing Lead inGasoline, Final Regulatory Impact Analysis. Washington, DC: February 1985.
38 See: Peskin, Henry M. “Nonpoint Pollution and National Responsibility.” Resources (Spring 1986): p. 10-11, 17.
9
2.2 Lead Trading
The purpose of the lead trading program, developed in the 1980s, was to allow gasoline refinersgreater flexibility in meeting emission standards at a time when the lead-content of gasoline was reducedto 10 percent of its previous level. In 1982, the EPA authorized inter-refinery trading of lead credits.32
If refiners produced gasoline with a lower lead content than was required, they earned lead credits. In1985, EPA initiated a program allowing refineries to bank lead credits, and subsequently firms madeextensive use of this program.33 EPA terminated the program at the end of 1987, when the leadphasedown was completed.
The lead program was clearly successful in meeting its environmental targets. And, although thebenefits of the trading scheme are more difficult to assess, the level of trading activity 34 and the rate atwhich refiners reduced their production of leaded gasoline35 suggest that the program was relatively cost-effective. The high level of trading between firms far surpassed levels observed in earlier environmentalmarkets.36 EPA estimated savings from the lead trading program of approximately twenty percent overalternative programs that did not provide for lead banking,37 a cost savings of about $250 million per year.
2.3 Water Quality Permit Trading
The United States has had very limited experience with tradable permit programs for controllingwater pollution, though nonpoint sources, particularly agricultural and urban runoff, may constitute themajor, remaining American water pollution problem.38 An “experimental program” to protect the Dillon
39See: Office of Policy Analysis, Environmental Protection Agency. “Case Studies on the Trading of Effluent Loads,Dillon Reservoir.” Final Report, 1984.
40See: Kashmanian, R. “Beyond Categorical Limits: The Case for Pollution Reduction Through Trading.” Unpublishedpaper presented at the 59th Annual Conference of the Water Pollution Control Federation, 1986.
41See: Hahn, Robert. “Economic Prescriptions for Environmental Problems: How the Patient Followed the Doctor’sOrders.” Journal of Economic Perspectives 3 (1989): p. 103.
42See: Hahn, Robert and Hester, Gordon. “Marketable Permits: Lessons for Theory and Practice.” Ecology LawQuarterly 16 (1989): 395.
43The Montreal Protocol called for a 50-percent reduction in the production of particular CFCs from 1986 levels by 1998.In addition, the Protocol froze halon production and consumption at 1986 levels beginning in 1992.
44See Hahn, Robert W. and Albert M. McGartland. “Political Economy of Instrumental Choice: An Examination of theU.S. Role in Implementing the Montreal Protocol.” Northwestern University Law Review 83(1989):592-611.
10
Reservoir in Colorado demonstrates how tradable permits could be used, in theory, to reduce nonpoint-source water pollution.
Dillon Reservoir is the major source of water for the city of Denver. Nitrogen and phosphorusloading threatened to turn the reservoir eutrophic, despite the fact that point sources from surroundingcommunities were controlled to best-available technology standards.39 Rapid population growth in Denver,and the resulting increase in urban surface water runoff, further aggravated the problem. In response, statepolicy makers developed a point-nonpoint-source control program to reduce phosphorus flows, mainlyfrom nonpoint urban and agricultural sources. The program was implemented in 1984;40 it allowed publiclyowned sewage treatment works to finance the control of nonpoint sources in lieu of upgrading their owntreated effluents to drinking water standards.41 EPA estimated that the plan could save over $1 million peryear,42 due to differences in the marginal costs of control between nonpoint sources and the sewagetreatment facilities. However, very limited trading occurred under the program, apparently because highregional precipitation diluted concentrations in the reservoir.
2.4 CFC Trading
A market in tradable permits was used in the United States to help comply with the MontrealProtocol, an international agreement aimed at slowing the rate of stratospheric ozone depletion.43 TheProtocol called for reductions in the use of CFCs and halons, the primary chemical groups thought to leadto ozone depletion. The market places limitations on both the production and consumption of CFCs byissuing allowances that limit these activities. The Montreal Protocol recognizes the fact that different typesof CFCs are likely to have different effects on ozone depletion, and so each CFC is assigned a differentweight on the basis of its depletion potential. If a firm wishes to produce a given amount of CFC, it musthave an allowance to do so,44 calculated on this basis.
45Letter from Richard D. Feldman, U.S. Environmental Protection Agency, 7 January 1991. In addition, there have beena very small number of international trades, but such trading is limited by the Montreal Protocol.
46The CFC tax was enacted principally as a “windfall-profits tax,” to prevent private industry from retaining scarcity rentscreated by the quantity restrictions. See: Merrill, Peter R., and Ada S. Rousso. “Federal Environmental Taxation.”Presented at the Eighty-third Annual Conference of the National Tax Association, San Francisco, California, November13, 1990.
47As of 1992, no firms were producing CFCs up to their maximum allowable level and permits could not be banked (carriedforward). As a result, there was an excess supply of permits. It is possible, however, that there would be an excesssupply even if there were no tax and with an effective price of zero for permits, because firms reacted to changes inregulations and new policy initiatives that called for a more rapid phaseout of CFCs and halons.
48See Clean Air Act Amendments of 1990, Public Law No. 101-549, 104 Statute 2399, 1990.
49For a description of the legislation, see Ferrall, Brian L. “The Clean Air Act Amendments of 1990 and the use of MarketForces to Control Sulfur Dioxide Emissions.“ Harvard Journal on Legislation 28 (1991): 235-252.
50Under specified conditions, utilities that had installed coal scrubbers to reduce emissions could receive two-yearextensions of the Phase I deadline plus additional allowances.
51Utilities that install scrubbers receive bonus allowances for early clean up. Also, specified utilities in Ohio, Indiana,and Illinois receive extra allowances during both phases of the program. All of these extra allowances are essentiallycompensation intended to benefit Midwestern plants which rely on high-sulfur coal. On the political origins of thisaspect of the program, see: Joskow, Paul L. and Richard Schmalensee. “The Political Economy of Market-based
11
Through mid-1991, there were 34 participants in the market and 80 trades.45 However, theoverall efficiency of the market is difficult to determine, because no studies were conducted to estimate costsavings. The timetable for the phaseout of CFCs was subsequently accelerated, and a tax on CFCs wasintroduced.46 Indeed, the tax may have become the binding (effective) instrument.47 Nevertheless,relatively low transaction costs associated with trading in the CFC market suggest that the system wasrelatively cost-effective.
2.5 SO2 Allowance System
A centerpiece of the Clean Air Act Amendments of 1990 is a tradable permit system that regulatessulfur dioxide (SO2) emissions, the primary precursor of acid rain.48 Title IV of the Act reduces sulfurdioxide and nitrous oxide emissions by 10 million tons and 2 million tons, respectively, from 1980 levels.49
The first phase of sulfur dioxide emissions reductions was achieved by 1995, with a second phase ofreduction to be accomplished by the year 2000.
In Phase I, individual emissions limits were assigned to the 263 most SO2-emissions intensivegenerating units at 110 plants operated by 61 electric utilities, and located largely at coal-fired power plantseast of the Mississippi River. After January 1, 1995, these utilities could emit sulfur dioxide only if they hadadequate allowances to cover their emissions.50 During Phase I, the EPA allocated each affected unit, onan annual basis, a specified number of allowances related to its share of heat input during the baselineperiod (1985-87), plus bonus allowances available under a variety of special provisions.51 Cost-
Environmental Policy: The U.S. Acid Rain Program.” Journal of Law and Economics 41(1998):81-135.
52Cost savings are the difference between the costs experienced with the allowance trading program and what the costswould otherwise have been. Hence, any estimate of cost savings is sensitive to the choice of counterfactual forcomparison purposes.
53See: Burtraw, Dallas. “The SO2 Emissions Trading Program: Cost Savings Without Allowance Trades.” ContemporaryEconomic Policy 14(1996):79-94.
54For an assessment of the program’s performance, see: Schmalensee, Richard, Paul L. Joskow, A. Denny Ellerman, JuanPablo Montero, and Elizabeth M. Bailey. “An Interim Evaluation of Sulfur Dioxide Emissions Trading.” Journal ofEconomic Perspectives, volume 12, number 3, summer 1998, pp. 53-68; and Stavins, Robert N. “What Have We Learnedfrom the Grand Policy Experiment: Lessons from SO2 Allowance Trading.” Journal of Economic Perspectives, volume12, number 3, summer 1998, pp. 69-88.
55See: Rose, Kenneth. “Implementing an Emissions Trading Program in an Economically Regulated Industry: Lessonsfrom the SO2 Trading Program,” in Market Based Approaches to Environmental Policy: Regulatory Innovations tothe Fore, Richard F. Kosobud and Jennifer M. Zimmerman, eds. New York: Van Nostrand Reinhold, 1997; and Bohi,Douglas. “Utilities and State Regulators Are Failing to Take Advantage of Emissions Allowance Trading.” TheElectricity Journal 7(1994):20-27.
56See: Bailey, Elizabeth M. “Allowance Trading Activity and State Regulatory Rulings: Evidence from the U.S. Acid RainProgram.” MIT-CEEPR 96-002 WP, Center for Energy and Environmental Policy Research, Massachusetts Institute ofTechnology, 1996.
12
effectiveness is promoted by permitting allowance holders to transfer their permits among one another andbank them for later use.
Under Phase II of the program, beginning January 1, 2000, almost all electric power generatingunits are brought within the system. Certain units are excepted to compensate for potential restrictions ongrowth and to reward units that are already unusually clean. If trading permits represent the carrot of thesystem, its stick is a penalty of $2,000 per ton of emissions that exceed any year’s allowances (and arequirement that such excesses be offset the following year).
A robust market of bilateral SO2 permit trading has emerged, resulting in cost savings on the orderof $1 billion annually, compared with the costs under command-and-control regulatory alternatives.52
Although the program had low levels of trading in its early years,53 trading levels increased significantly overtime.54 Concerns have been expressed that state regulatory authorities would hamper trading in order toprotect their domestic coal industries, and some research indicates that state public utility commission cost-recovery rules have provided poor guidance for compliance activities.55 Other analysis suggests that thishas not been a major problem.56 Similarly, in contrast to early assertions that the structure of EPA’s small
57See: Cason, Timothy N. “An Experimental Investigation of the Seller Incentives in EPA’s Emission Trading Auction.”American Economic Review 85(1995):905-922.
58See: Joskow, Paul L., Richard Schmalensee, and Elizabeth M. Bailey. “Auction Design and the Market for SulfurDioxide Emissions.” American Economic Review, forthcoming, 1998.
59For a detailed case study of the evolution of the use of economic incentives in the SCAQMD, see chapter 2 in TheEnvironment Goes to Market: The Implementation of Economic Incentives for Pollution Control. National Academyof Public Administration, July 1994. See also: Thompson, Dale B. “The Political Economy of the RECLAIM EmissionsMarket for Southern California.” Working paper, University of Virginia, March 1997; and Harrison, David Jr. “TurningTheory into Practice for Emissions Trading in the Los Angeles Air Basin,” in Pollution as Property: Tradable Permits,Tradable Quotas, and Joint Implementation, S. Sorrell and J. Skea (Eds.). London: Edward Elgar, forthcoming.
60See: Anderson, Robert. The U.S. Experience with Economic Incentives in Environmental Pollution Control Policy.Washington, D.C.: Environmental Law Institute, 1997.
61See Brotzman, Thomas. “Opening the Floor to Emissions Trading.” Chemical Marketing Reporter (May 27, 1996): p.SR8. For an early assessment of the program, see: Johnson, Scott Lee and David M. Pekelney. “Economic Assessmentof the Regional Clean Air Incentives Market: A New Emissions Trading Program for Los Angeles.” Land Economics72(1996):277-297. A prospective critique was provided by: Johnston, James L. “Pollution Trading in La La Land.”Regulation, 1994, number 3, pp. 44-54. Additional analyses are by: Lents, James. “The RECLAIM Program at ThreeYears.” Working Paper, April 28 (1998); and Klier, Thomas H., Richard H. Mattoon, and Michael A. Prager. “A MixedBag: Assessment of Market Performance and Firm Trading Behaviour in the NOx RECLAIM Programme.” Journal ofEnvironmental Planning and Management, 40(6):751-774, 1997.
62Some sources, such as equipment rental facilities and essential public services (including landfills and wastewatertreatment facilities), are excluded.
63See Fulton, William. “The Big Green Bazaar.” Governing Magazine (June 1996): page 38.
13
permit auction market would cause problems,57 the evidence now indicates that this has had little or noeffect on the vastly more important bilateral trading market.58
2.6 The RECLAIM Program
The South Coast Air Quality Management District (SCAQMD), which is responsible for controllingemissions in a four-county area of southern California, launched a tradable permit program in January,1994, to reduce nitrogen dioxide and sulfur oxide emissions in the Los Angeles area.59 One prospectiveanalysis predicted 42% cost savings, amounting to $58 million annually. 60 As of June 1996, 353participants in this Regional Clean Air Incentives Market (RECLAIM) program, had traded more than100,000 tons of nitrogen oxide (NOx) and SO2 emissions, at a value of over $10 million.61 The RECLAIMprogram, which operates through the issuance of permits that authorize specified decreasing levels ofpollution over time, governs stationary sources that have emitted more than four tons of NOx and SO2
annually since 1990.62 The SCAQMD has considered expanding the program to allow trading betweenstationary and mobile sources.63
2.7 Transferable Development Rights
64See, for example: Field, B. C. and J. M. Conrad. “Economic Issues in Programs of Transferable Development Rights.”Land Economics 51(1975):331-340; Bellandi, R. L. and R. B. Hennigan. “The Why and How of Transferable DevelopmentRights.” Real Estate Review 7(1977):60-64; and Mills, D. E. “Transferable Development Rights Markets.” Journal ofUrban Economics 7(1980):63-74.
65See: Tripp, James T. B. and Daniel J. Dudek. “Institutional Guidelines for Designing Successful Transferable RightsPrograms.” Yale Journal of Regulation 6(1989):369-391; Voigt, Paul C., and Leon E. Danielson. “Wetlands MitigationBanking Systems: A Means of Compensating for Wetlands Impacts.” Applied Resource Economics and Policy GroupWorking Paper AREP96-2, Department of Agricultural and Resource Economics, North Carolina State University, 1996;and Scodari, Paul, Leonard Shabman, and D. White. “Commercial Wetland Mitigation Credit Markets: Theory andPractice.” IWR Report 95-WMB-7. Institute for Water Resources, Water Resources Support Center. Alexandria,Virginia: U.S. Army Corps of Engineers, 1995.
14
There is a considerable history of local governments in the United States using transferabledevelopment rights to balance some of the attributes and amenities ordinarily addressed by zoningprovisions with the demands of economic growth and change.64 A relatively recent application of the samegeneral instrument with an environmental focus has been for the protection of wetlands.
Certain development activities in wetlands are regulated in the United States by Section 404 of theClean Water Act, which establishes conditions and procedures under which such activities can occur.Firms or individuals must apply for permits for activities that will have negative impacts on wetlands. Insome cases, compensating mitigation is required of potential developers, and applicants are allowed topurchase mitigation credits from land banks to meet these obligations.65 These mitigation banks have beenestablished in a number of states, including: California, Florida, Minnesota, New Jersey, and NorthCarolina.
3. U.S. EXPERIENCE WITH CHARGE SYSTEMS
The conventional wisdom is that U.S. environmental policy has made increasing use of tradeablepermit systems, while essentially ignoring the option of taxes or charges. This is not strictly correct, andif one defines charge systems broadly, a significant number of applications can be identified. Theseapplications can be categorized as: effluent charges; deposit-refund systems; user charges; insurancepremia; sales taxes; administrative charges; and tax differentiation.
Most applications of charge systems in the United States have probably not had the incentiveeffects associated with a Pigovian tax, either because of the structure of the systems or because of the low
66Effluent charges have been used more extensively in Europe than in the United States, although it is questionablewhether the levels have been sufficient to affect behavior in significant ways. For a discussion of the economics andpolitics surrounding taxation of sulfur dioxide, nitrous oxide, and carbon dioxide in the Scandinavian nations, theNetherlands, France, and Germany, see: Cansier, D., and R. Krumm. “Air Pollution Taxation: An Empirical Survey.”Ecological Economics. Forthcoming, 1998. Also see: Organization for Economic Cooperation and Development.Taxation and the Environment, Complementary Policies. Paris, 1993; and Organization for Economic Cooperation andDevelopment. Environmental Taxation in OECD Countries. Paris, 1995.
67See the chapter on solid waste policy in this volume.
68See: U.S. Congress, Office of Technology Assessment. Environmental Policy Tools: A Users Guide. Washington,D.C., 1995.
69See: Efaw, Fritz and William N. Lanen. “Impact of User Charges on Management of Household Solid Waste.” Reportprepared for the U.S. Environmental Protection Agency under Contract No. 68-3-2634. Princeton, NJ: Mathtech, Inc.,1979; McFarland, J. M. “Economics of Solid Waste Management.” In Comprehensive Studies of Solid WasteManagement, Final Report. Sanitary Engineering Research Laboratory, College of Engineering and School of PublicHealth, Report no. 72-3:41-106, University of California, Berkeley, CA, 1972; Skumatz, Lisa A. “Volume-Based Rates inSolid Waste: Seattle’s Experience.” Report for the Seattle Solid Waste Utility. Seattle: Seattle Solid Waste Utility, 1990;Stevens, B. J. “Scale, Market Structure, and the Cost of Refuse Collection.” The Review of Economics and Statistics40(1978):438-448; Wertz, Kenneth L. “Economic Factors Influencing Households’ Production of Refuse.” Journal ofEnvironmental Economics and Management 2(1976):263-72; Lave, Lester and Howard Gruenspecht. “Increasing theEfficiency and Effectiveness of Environmental Decisions: Benefit-Cost Analysis and Effluent Fees” Journal of Air andWaste Management 41:680-690 (May 1991); Repetto, Robert, Roger C. Dower, Robin Jenkins, and Jacqueline Geoghegan.Green Fees: How a Tax Shift Can Work for the Environment and the Economy. World Resources Institute: WashingtonD.C., 1992; Fullerton, Don and Thomas C. Kinnaman. “Household Responses to Pricing Garbage by the Bag.” AmericanEconomic Review 86(1996):971-984; and Miranda, Marie Lynn, Jess W. Everett, Daniel Blume, and Barbeau A. Roy Jr.“Market-Based Incentives and Residential Municipal Solid Waste.” Journal of Policy Analysis and Management13(1994):681-698.
15
levels at which charges have been set.66 Nevertheless, it appears that a limited number of these systemsmay have affected behavior.
3.1 Effluent Charges
The closest that any charge system comes in the United States to operating as a Pigovian tax maybe the unit-charge approach to financing municipal solid waste collection, where households (andbusinesses) are charged the incremental costs of collection and disposal.67 So called “pay-as-you-throw”policies, where users pay in proportion to the volume of their waste, are now used in well over one hundredjurisdictions.68 This collective experience provides evidence that unit charges have been somewhatsuccessful in reducing the volume of household waste generated.69
3.2 Deposit-Refund Systems
As the costs of legal disposal increase, incentives for improper (illegal) disposal also increase.Hence, waste-end fees designed to cover the costs of disposal, such as unit curbside charges, can lead to
70See: Fullerton, Don and Thomas C. Kinnaman. “Garbage, Recycling and Illicit Burning or Dumping.” Journal ofEnvironmental Economics and Management 29(1995):78-92.
71See: Bohm, Peter. Deposit-Refund Systems: Theory and Applications to Environmental, Conservation, and ConsumerPolicy. Baltimore: Resources for the Future, Johns Hopkins University Press, 1981.
72See: Macauley, Molly K., Michael D. Bowes, and Karen L. Palmer. Using Economic Incentives to Regulate ToxicSubstances. Washington, D.C.: Resources for the Future, 1992.
73For further discussion of this point, see: Russell, Clifford S. "Economic Incentives in the Management of HazardousWastes." Columbia Journal of Environmental Law 13(1988):257-274.
16
increased incidence of illegal dumping.70 For waste that poses significant health or ecological impacts, expost clean up is an especially unattractive option. For these waste products, the prevention of improperdisposal is particularly important. One alternative might seem to be a front-end tax on waste precursors,since such a tax would give manufacturers incentives to find safer substitutes and to recover and recycletaxed materials. But substitutes may not be available at reasonable costs, and once wastes are generated,incentives that affect choices of disposal methods are still problematic.
This dilemma can be resolved with a special front-end charge (deposit) combined with a refundpayable when quantities of the substance in question are turned in for recycling or disposal. This refundcan provide an incentive to follow rules for proper disposal (and to prevent losses in the process in whichthe substance is used). The mechanics of the system vary by product, but the general framework is thatproducers or initial users of regulated materials pay a deposit when those materials enter the productionprocess. In principle, the size of the deposit is based upon the social cost of the product being disposedof illegally. As the product changes hands in the production and consumption process (through wholesalersand distributors to consumers), the purchaser of the product pays a deposit to the seller. Thus, once theproducer sells the product, responsibility for proper disposal is passed to the next party, this processcontinuing until the ultimate consumer of the good turns the product in to a certified collection centerresponsible for recycling or proper disposal.
Deposit-refund systems71 are most likely to be appropriate when the incidence and theconsequences of improper disposal are great,72 but these systems have frequently been portrayed asmechanisms to foster greater levels of recycling. In general, properly scaled deposit-refund systems canbe attractive for three reasons. First, government's monitoring problem is converted from the nearlyimpossible one of preventing illegal dumping of small quantities of waste at diverse sites in the environmentto what may be the more manageable problem of assuring that products being returned for refund are whatthey are purported to be. Second, the system can provide firms with incentives to prevent losses of thematerial in the industrial process in which it is used. Third, because of inevitable net losses in the productionand consumption processes, incentives exist for firms to look for less environmentally damaging substances— that is, substances to which the deposit-refund system does not apply.73 For some products, anationwide approach may be appropriate if: firms face national markets and products are easilytransportable; toxicity problems associated with improper disposal do not vary greatly by geographic area;
74See: Porter, Richard. "Michigan's Experience with Mandatory Deposits on Beverage Containers." Land Economics59(1983):177-194.
75U.S. General Accounting Office. Solid Waste: Trade-offs Involved in Beverage Container Deposit Legislation. Report#GAO/RCED-91-25. Washington, D.C., 1990.
76See, for example: Porter, Richard. "A Social Benefit-Cost Analysis of Mandatory Deposits on Beverage Containers."Journal of Environmental Economics and Management 5(1978):351-375.
17
and the national approach is likely to be less costly for manufacturers and recyclers than a diversity of stateor local programs.
The major application of this approach in the United States has been in the form of state-level"bottle bills" for beverage containers (Table 2). A brief examination of these systems provides some insightsinto the merits and the limitations of the approach. Deposit-refund systems on beverage containers havebeen implemented in ten states to reduce littering and reduce the flow of solid waste to landfills, but sincethe initial enthusiasm in the late 1970's and early 1980's, no other states have taken action.
In most programs, consumers pay a deposit at the time of purchase which can be recovered byreturning the empty container to a redemption center. Typically, the deposit is the same regardless of thetype of container. In some respects, these bills seem to have accomplished their objectives; in Michigan,for example, the return rate of containers one year after the program was implemented was 95%;74 and inOregon, littering was reduced and long-run savings in waste management costs were achieved.75
By charging the same amount for each type of container material, however, these programs do notencourage consumers to choose containers with the lowest product life-cycle costs (including those ofdisposal). In particular, if bottle bills do not include deposits and refunds for metal, plastic, and glasscontainers, they may encourage a shift of consumer purchases from easily-recyclable to less-recyclablecontainers. Furthermore, by requiring consumers to separate containers and deliver them to redemptioncenters, deposit-refund systems can foster net welfare losses, rather than gains. Additionally, by removingsome of the most profitable elements from the waste stream, bottle bills may undermine the viability of morecomprehensive alternatives, such as curbside programs.
Analysis of the effectiveness, let alone the cost-effectiveness or efficiency, of beverage containerdeposit-refund systems has been limited. A major cost of bottle bills is associated with labor andcapital required for implementation, including, for example, the area set aside and labor employed atgrocery stores for collection purposes. Also of economic significance are the personal inconvenience costsof returning containers to retail outlets. These inconvenience costs may be quite significant, and the fewrigorous studies that have been carried out of the benefits and costs of bottle bills have found that the socialdesirability of deposit law depends critically on the value of the time it takes consumers to return emptycontainers and the willingness to pay for reduced liter.76
Deposit-refund systems are most likely to be appropriate where: (1) the objective is one ofreducing illegal disposal, as opposed to such objectives as general reductions in the waste stream or
77See: Sigman, Hilary A.. “A Comparison of Public Policies for Lead Recycling,” RAND Journal of Economics. Vol. 26,No. 3, Autumn (1995):452-478.
78Minnesota was the first state to implement deposit refund legislation for car batteries in 1988. By 1991, there were tenstates with such legislation: Arizona, Arkansas, Connecticut, Idaho, Maine, Michigan, Minnesota, New York, RhodeIsland, and Washington. Deposits range from $5 to $10.
79Requiring a sales receipt for a refund removes the incentive for the return of batteries that have already been purchased.Further, given the extended life of most batteries, it may be unrealistic to expect consumers to maintain a receipt for manyyears.
80See: U.S. Congress, 1951. Independent Offices Appropriations Act of 1951, August 31, 1951, ch 375, §501, 654 Stat.290. 31 U.S.C. §9701.
18
increased recycling; and (2) there is a significant asymmetry between ex ante (legal) and ex post (illegalor post-littering) clean-up costs. For these reasons, deposit refund systems may be among the best policyoptions to address disposal problems associated with containerizable hazardous waste, such as lead.77
As a means of reducing the quantity of lead entering unsecured landfills and other potentiallysensitive sites, several states have enacted deposit-refund programs for lead acid motor vehicle batteries(Table 2).78 Under these systems, a deposit is collected when manufacturers sell batteries to distributors,retailers, or original equipment manufacturers; likewise, retailers collect deposits from consumers at the timeof battery purchase. Consumers can collect their deposits by returning their used batteries to redemptioncenters; these redemption centers, in turn, redeem their deposits from battery manufacturers.
The programs are largely self-enforcing, since participants have incentives to collect deposits onnew batteries and obtain refunds on used ones, but a potential problem inherent in the approach is anincrease in incentives for battery theft. The higher the deposit, the greater the incentive for theft, particularlyif one only needs to show up at a redemption center with a battery to claim a refund. An alternative is torequire a sales receipt upon redemption or to permit refunds only for those exchanging an old battery fora new one. Either of these alternatives, however, will reduce the comprehensiveness of the program.79 Inany event, a deposit of $5 to $10 per battery exceeds the typical market value of used batteries. Thus, itmay be small enough to avoid much of the theft problem, but large enough to encourage a substantial levelof return.
3.3 User Charges
User charges raise funds for the management and maintenance of resources. Charges of themagnitude necessary to fully cover costs have not been implemented at the Federal level, with the possibleexception of an experimental fee program for the National Parks, initiated in 1996. A variety of Federalrecreation and transportation taxes can be considered user charges, however, because their revenues arededicated to support usage (Table 3).
Recreation and entrance fees in the National Park System and other Federally managedrecreational areas have been legally mandated since 1951,80 but the revenues from these fees have
81Two states, New Hampshire and Vermont, have created nearly “self-financing” park systems. See: Reiling, StephenD. and M. J. Kotchen. “Lessons Learned from Past Research on Recreation Fees” In Recreation Fees in the NationalPark Service: Issues, Policies and Guidelines for Future Action, ed A. L. Lundgren. Minnesota Extension Service Pub.No. BU-6767. Cooperative Park Studies Unit, Department of Forest Resources, University of Minnesota, St. Paul, 1996.
82See: Barthold, Thomas A. “Issues in the Design of Environmental Excise Taxes.” Journal of Economic Perspectives8(1994), number 1, pp. 133-151.
83See: Public Law 99-499, Sec. 522(a), 1986.
84See: Public Law 101-239, Revenue Reconciliation Act of 1989.
85See: Sect. 9501 of Internal Revenue Code of 1954.
19
historically gone to the U.S. Treasury, to be reappropriated to the park system as a whole. In 1996,Congress approved a three-year experimental program, the Recreation Fee Demonstration Program, whichpermits 50 specified parks to raise entrance fees and keep up to 80 percent of incremental revenues. Someof the fee increases have been quite substantial; fees in Yosemite, Grand Canyon, and YellowstoneNational Parks, for example, doubled from $10 to $20.81
3.4 Insurance Premium Taxes
A number of Federal taxes are levied on industries or groups to fund insurance pools againstpotential environmental risks associated with the production or use of taxed products (Table 4). Such taxescan have the effect of encouraging firms to internalize environmental risks in their decision making, but, inpractice, these taxes have frequently not been targeted at respective risk-creating activities. For example,to support the Oil Spill Liability Trust Fund, all petroleum products are taxed, regardless of how they aretransported, possibly creating small incentives to use less petroleum, but not to use safer ships or othermeans of transport.
An excise tax on specified hazardous chemicals is used to fund (partially) the clean-up of hazardouswaste sites through the Superfund program. The tax functions as an insurance tax to the extent that fundsare used for future clean-ups.82 The Leaking Underground Storage Trust Fund, established in 1987, isreplenished through taxes on all petroleum fuels,83 and the Oil Spill Liability Trust Fund, establishedsubsequent to the Exxon Valdez oil spill, receives revenue from a tax on petroleum and petroleum products.The fund can be used to meet unrecovered claims from oil spills.84 Finally, the Black Lung Disability TrustFund was established in 1954 to pay miners who became sick and unable to work because of prolongedexposure to coal dust in mines. Since 1977, it has been financed by excise taxes on coal from undergroundand surface mines.85
86See: Barthold, Thomas A. “Issues in the Design of Environmental Excise Taxes.” Journal of Economic Perspectives8(1994), number 1, pp. 133-151.
87See: U.S. Congress. 26 USC Sec. 4064, Gas Guzzler Tax. 1978.
88Light trucks, which include “sport utility vehicles,” are fully exempt from the tax. See: Bradsher, Keith. “Light TrucksIncrease Profits But Foul Air More than Cars.” New York Times, November 30, 1997, pp. A1, A38-A39.
89See: Hahn, Robert W. and Albert M. McGartland. “Political Economy of Instrumental Choice: An Examination of theU.S. Role in Implementing the Montreal Protocol.” Northwestern University Law Review 83(1989):592-611; U.S.Congress. The Omnibus Budget Reconciliation Act of 1989 Sect. 7506: Excise Tax on the Sale of Chemicals WhichDeplete the Ozone Layer and of Products Containing Such Chemicals. Washington, DC., 1989; and U.S. Congress, Officeof Technology Assessment. Environmental Policy Tools: A Users Guide. Washington, D.C., 1995.
90See: Morandi, Larry. “An Outside Perspective on Iowa’s 1987 Groundwater Protection Act,” National Conference ofState Legislatures, 1992; and International Institute for Sustainable Development. Green Budget Reform: AnInternational Casebook on Leading Practices. London: EarthScan, 1995.
20
3.5 Sales Taxes
It has been argued that only two Federal sales taxes have affected behavior in the manner of aPigouvian tax: the “gas guzzler tax” on new cars, and the excise tax on ozone-depleting chemicals,86
although it is far from clear that the CFC tax actually affected business decisions (Table 5).
The Energy Tax Act of 1978 established a “gas guzzler” tax on the sale of new vehicles that fail tomeet statutory fuel efficiency levels, set at 22.5 miles per gallon. The tax ranges from $1,000 to $7,700per vehicle, based on fuel efficiency; but the tax does not depend on actual performance or on mileagedriven. The tax is intended to discourage the production and purchase of fuel inefficient vehicles,87 but itapplies to a relatively small set of luxury cars, and so has had limited effects.88
To meet international obligations established under the Montreal Protocol to limit the release ofchemicals that deplete stratospheric ozone, the Federal government set up a tradable permit system andlevied an excise tax on specific chlorflourocarbons in 1989. Producers are required to have adequateallowances, and users pay a fee (set proportional to a chemical-specific ozone depleting factor). There isconsiderable debate regarding which mechanism should be credited with the successful reduction in the useof these substances.89
Additionally, several states impose taxes on fertilizers and pesticides, but at levels below thatrequired to affect behavior significantly. The taxes generate revenues that are used to finance environmentalprograms. For example, the Iowa Groundwater Protection Act of 1987 imposes taxes on fertilizers andpesticides (0.1% on pesticide sales at the retail level, 0.2% of manufacturer sales, and $.75 per ton ofnitrogen fertilizer). Revenues fund statewide programs for sustainable agriculture and for testing andresearch on public water supplies.90
91See: U.S. Congress, Office of Technology Assessment. Environmental Policy Tools: A Users Guide. Washington,D.C., 1995.
92See: Jaffe, Adam B., and Robert N. Stavins. "Dynamic Incentives of Environmental Regulation: The Effects ofAlternative Policy Instruments on Technology Diffusion." Journal of Environmental Economics and Management29(1995):S43-S63.
93See the chapter on solid waste policy in this volume.
21
3.6 Administrative Charges
These charges raise revenues to help cover the administrative costs of environmental programs(Table 6). Although the charges are not intended to change behavior, this method of raising public fundsis broadly consistent with the so-called “polluter-pays principle.” For example, under the National PollutionDischarge Elimination System of the Clean Water Act, charges for discharge permits are based on thequantity and type of pollutant discharged. Likewise, the Clean Air Act Amendments of 1990 allow statesto tax regulated air pollutants to recover administrative costs of state programs, and allow areas in extremenon-compliance to charge higher rates. Under this structure, the South Coast Air Quality ManagementDistrict (SCAQMD) in Los Angeles has the highest permit fees in the country.91
3.7 Tax Differentiation
We use the phrase, “tax differentiation,” to refer to credits, tax cuts, and subsidies forenvironmentally desirable behavior (Table 7). These serve as implicit taxes on environmentally undesirablebehavior. A number of Federal and state taxes have been implemented in attempts to encourage the useof renewable energy sources, implicitly taking into account externalities associated with fossil fuel energygeneration and use. In the Energy Policy Act of 1992, for example, electricity produced from wind andbiomass fuels receives a 1.5 cent per kWh credit, and solar and geothermal investments can receive up toa 10 percent tax credit. Although economists’ natural response to energy-related externalities is to advisethat fuels or energy use be taxed, there is econometric evidence that energy-efficiency technology adoptionsubsidies may be more effective — in some circumstances — than proportional energy taxes.92
From 1979 to 1985, employers could provide implicit subsidies to employees for certaincommuting expenses, such as free van pools and mass transit passes on a tax-free basis. Likewise,subsidies from utilities for energy conservation investments have been excludable from individual incometaxes. On the state and local level, many jurisdictions offer subsidies and various kinds of tax relief toencourage investments in technologies that use recycled products.93
94See: Anderson, Terry L. Water Crisis: Ending the Policy Drought. Washington, D.C.: Cato Institute, 1983; Frederick,Kenneth D., ed. Scarce Water and Institutional Change. Washington, D.C.: Resources for the Future, 1986; El-Ashry,Mohamed T. and Diana C. Gibbons. Troubled Waters: New Policies for Managing Water in the American West.Washington, D.C.: World Resources Institute, 1986; and Wahl, Richard W. Markets for Federal Water: Subsidies,Property Rights, and the Bureau of Reclamation. Washington, D.C.: Resources for the Future, 1989.
95In March of 1983, the Environmental Defense Fund (EDF) published a proposal calling for MWD to finance themodernization of IID's water system in exchange for use of conserved water. See: Stavins, Robert N. TradingConservation Investments for Water. Berkeley, California: Environmental Defense Fund, March, 1983. In November,1988, after five years of negotiation, the two water giants agreed on a $230 million water conservation and transferarrangement, much like EDF's original proposal to trade conservation investments for water. See: Morris, Willy. "IIDApproves State's First Water Swap with MWD." Imperial Valley Press, November 9, 1988.
22
4. U.S. EXPERIENCE WITH REDUCING MARKET BARRIERS
In some situations, environmental protection can be fostered by reducing explicit or implicit barriersto market activity. We consider three types of such market barrier reductions: (1) market creation, aswith measures that facilitate the voluntary exchange of water rights and thus promote more efficientallocation and use of scarce water supplies; (2) liability rules that encourage firms to consider the potentialenvironmental damages of their decisions; and (3) information programs, such as energy-efficiencyproduct labeling requirements.
4.1 Market Creation
Two examples of using market creation as an instrument of environmental policy stand out:measures that facilitate the voluntary exchange of water rights and thus promote more efficient allocationand use of scarce water supplies; and particular policies that facilitate the restructuring of electricitygeneration and transmission. We consider both in this section of the chapter.
First, the western United States has long been plagued by inefficient use and allocation of its scarcewater supplies, largely because users do not have incentives to take actions consistent with economic andenvironmental values. Voluntary market-oriented transfers of water rights have begun to address thisproblem by encouraging rational conservation measures, better allocation of supplies among competingusers, and improvement in water quality.
For more than a decade, economists have noted that Federal and state water policies have beenaggravating, not abating, these problems.94 For example, as recently as 1990, in the Central Valley ofCalifornia, some farmers were paying as little as $10 for water to irrigate an acre of cotton, while just a fewhundred miles away in Los Angeles, local authorities were paying up to $600 for the same quantity ofwater. This dramatic disparity provided evidence that increasing urban demands for water could be metat relatively low cost to agriculture or the environment (i.e., without constructing new, environmentally-disruptive dams and reservoirs). Subsequent reforms allowed markets in water to develop, so thatvoluntary exchanges could take place that made both parties better off. For example, an agreement wasreached to transfer 100,000 acre-feet of water per year from the farmers of the Imperial Irrigation District(IID) in southern California to the Metropolitan Water District (MWD) in the Los Angeles area.95
96See: MacDonnell, Lawrence J. The Water Transfer Process As a Management Option For Meeting Changing WaterDemands, Volume I. Submitted to the U.S. Geological Survey, Washington, D.C., April, 1990.
97The primary arguments for restructuring are: (1) the electricity industry is no longer a natural monopoly, since smallgeneration technologies are now competitive with large centralized production; (2) consumers will benefit from buyingcheaper electricity from more efficient producers, who currently face significant barriers to entry; and (3) the old systemwith cost-of-service pricing provides poor incentives for utilities to reduce costs. For background on the history ofelectricity restructuring, see: Brennan, Timothy J., Karen L. Palmer, Raymond J. Kopp, Alan J. Krupnick, Vito Stagliano,and Dallas Burtraw. A Shock to the System: Restructuring America’s Electricity Industry. Washington, DC. Resourcesfor the Future, 1996.
98Federal Energy Regulatory Commission. Order 888. April 1996.
99The Electric Consumers’ Power to Choose Act (104 H.R. 3790 and 105 H.R. 655) is one example of such legislation. Fora brief overview of the politics of electricity restructuring, see: Kriz, Margaret. “A Jolt to the System” National Journal.August 3, 1996, pp. 1631-1636.
100There is considerable debate on this point, since — in the short run — more electricity may be generated from oldsurplus capacity coal plants in the Midwest, increasing pollutant emissions. In any event, in the long run, competitionwill encourage a more rapid turnover of the capital stock. See: Palmer, Karen and Dallas Burtraw. “Electricity
23
Subsequently, policy reforms spread throughout the west, and transactions emerged elsewhere inCalifornia, and in Colorado, New Mexico, Arizona, Nevada, and Utah.96
A second example of “market creation” is the current revolution in electricity restructuring that ismotivated by economic concerns97 but may have significant environmental impacts. For many years, utilities— closely overseen by state public utility commissions (PUCs) — have provided electricity within exclusiveservice areas. The utilities were granted these monopoly markets and guaranteed a rate of return on theirinvestments, conditional upon their setting reasonable rates and meeting various social objectives, such asuniversal access. The Energy Policy Act of 1992 took a major step toward opening the industry up tocompetition by allowing independent electricity generating companies to sell power directly to utilities, andin 1996, the Federal Energy Regulatory Commission (FERC) moved things further by issuing regulationsthat require utilities with transmission lines to transmit power for other parties at reasonable rates.98
The purpose of these regulatory changes was to encourage competition at the wholesale (electricitygeneration) level, but several states — including California, Illinois, Massachusetts, and New Hampshire— have taken this further by facilitating competition at the retail level, so that consumers can contractdirectly for their electricity supplies. Legislation has been introduced in the U.S. Congress to establishguidelines for retail competition throughout the nation.99
These changes have environmental implications. First, as electricity prices fall in the newcompetitive environment, electricity consumption is expected to increase. This might be expected toincrease pollutant emissions, but to whatever degree electricity substitutes for other, more polluting formsof energy, the overall effect may be environmentally beneficial. Second, deregulation will unquestionablymake it easier for new firms and sources to enter markets. Since new power plants tend to be both moreefficient and less polluting (relying more on natural gas), environmental impacts may decrease.100 Third,
Restructuring and Regional Air Pollution.” Resource and Energy Economics 19(1997):139-174.
101Environmental advocates, however, are very concerned that state PUCs will have much less influence than previouslyover the industry. In the past, PUCs encouraged “demand side management” and supported the use of renewable formsof electricity generation through the investment approval process or by requiring full-cost pricing for generation. Severalpolicies have been proposed to provide these functions in the new, more competitive environment: for example, a systemof tradable “renewable energy credits,” wherein each generator would need to hold credits for a certain percentage oftheir generation; and a tax on the transmission of electricity, used to subsidize renewable generation.
102These incentives are frequently neither simple nor direct, because firms and individuals may choose to reduce theirexposure to liability by taking out insurance. In this regard, see the earlier discussion in this chapter of “InsurancePremium Taxes.”
103See: Revesz, Richard L. Foundations in Environmental Law and Policy. New York: Oxford University Press, 1997.
104See chapter on hazardous wastes and toxic substances in this volume.
24
more flexible and robust markets for electricity can be expected to increase the effectiveness of variousmarket-based incentives for pollution control, such as the SO2 allowance trading system.101
4.2 Liability Rules
Liability rules can have the effect of providing strong incentives to firms to consider the potentialenvironmental damages of their decisions, and thereby can have the effect of changing those decisions.102
In theory, a liability rule can be cost effective as a policy instrument because technologies or practices arenot specified. For example, taxing hazardous materials or their disposal creates incentives for firms toreduce their use of those materials, but does not provide overall incentives for firm to reduce societal risksfrom those materials. An appropriately designed liability rule can do just this.103 On the other hand,transaction costs associated with litigation may make liability rules most appropriate only for acute hazards.It is in these situations, in fact, that this approach has been employed at the Federal level: liability for toxicwaste sites and for the spill of hazardous materials.104
The Comprehensive Environmental Response, Compensation, and Liability Act (CERCLA) of1980 established retroactive liability for companies that are found responsible for the existence of a siterequiring clean up. Governments can collect cleanup costs and damages from waste producers, wastetransporters, handlers, and current and past owners and operators of a site. Similarly, the Oil Pollution Actmakes firms liable for cleanup costs, natural resource damages, and third party damages caused by oil spillsonto surface waters; and the Clean Water Act makes responsible parties liable for cleanup costs for a spillof hazardous substances.
105For a comprehensive review of information programs and their apparent efficacy, see: Tietenberg, Tom. “InformationStrategies for Pollution Control.” Paper presented at the Eighth Annual Conference, European Association ofEnvironmental and Resource Economists, Tilburg, The Netherlands, June 26-28, 1997. For an overview of internationalexperience with “eco-labels,” see: Morris, Julian and Lynn Scarlett. “Buying Green: Consumers, Product Labels andthe Environment.” Policy Study No. 202. Los Angeles: The Reason Foundation, August 1996.
106See: United States Code of Federal Regulations. 16 C.F.R., Chapter 1, Federal Trade Commission, Part 305 –Appliance Labeling Rule. Washington, D.C., 1995; and U.S. Congress, Office of Technology Assessment. BuildingEnergy Efficiency. Washington, D.C., 1992.
107See: U.S. Department of State. US Climate Action Report. Publication 10496. Washington, D.C., 1997.
108See: Newell, Richard G., Adam B. Jaffe, and Robert N. Stavins. “The Induced Innovation Hypothesis and Energy-Saving Technological Change.” Working paper, John F. Kennedy School of Government, Harvard University,Cambridge, Massachusetts, October 18, 1997.
109See chapter on hazardous wastes and toxic substances in this volume.
25
4.3 Information Programs
Since well functioning markets depend, in part, on the existence of well-informed producers andconsumers, information programs can — in theory — help foster market-oriented solutions toenvironmental problems.105 One approach to government improving the available set of informationavailable to consumers is a product labeling requirement (Table 8). The Energy Policy and ConservationAct of 1975 specifies that certain appliances and equipment (including air conditioners, washing machines,and water heaters) carry labels with information on products’ energy efficiency and estimated annual energycosts.106 More recently, EPA and the U.S. Department of Energy (DOE) developed the Energy Starprogram, in which energy efficient products can display an EnergyStar label. The label does not providespecific information on the product, but signals to consumers that the product is, in general, “energyefficient.” This program is much broader in its coverage than the appliance labeling program; by 1997, over13,000 product models carried the Energy Star label.107 There has been little rigorous economic analysisof the efficacy of such programs, but limited econometric evidence suggests that product labeling(specifically appliance efficiency labels) can have significant impacts on efficiency improvements, essentiallyby making consumers (and therefore producers) more sensitive to energy price changes.108
A second type of government information program is a reporting requirement. The country’s firstsuch program was New Jersey’s Community Right-to-Know Act, passed in 1984. Two years later, asimilar program was established at the national level. The Toxics Release Inventory (TRI) was initiatedunder the Emergency Planning and Community Right-to-Know Act (EPCRA).109 The TRI requires firmsto report (to local emergency planning agencies) information on use, storage, and release of hazardouschemicals. Such information reporting serves compliance and enforcement purposes, but may also increasepublic awareness of firms’ actions, which may be linked with environmental risks. This public scrutiny canencourage firms to alter their behavior.
The Safe Drinking Water Act and Toxic Enforcement Act were adopted in California as a ballotinitiative (“Proposition 65") in 1986. The law covers consumer products and facility discharges, and
110See: U.S. Congressional Budget Office. Reducing the Deficit: Spending and Revenue Options. Washington, D.C.,February 1990.
111See: Bowes, Michael D. and John V. Krutilla. Multiple-Use Management: The Economics of Public Forestlands.Washington, D.C.: Resources for the Future, 1989.
26
requires firms to provide a “clear and reasonable warning” if they expose populations to certain chemicals.In 1987, California enacted its Air Toxics Hot Spots Information and Assessment Act, which sets up anemissions reporting system to track emissions of over 700 toxic substances. The law requires theidentification and assessment of localized risks of air contaminants and provides information to the publicabout the possible impact of those emissions on public health.
5. U.S. EXPERIENCE WITH REDUCING GOVERNMENT SUBSIDIES
A final category of market-based instruments is government subsidy reduction. Since subsidies arethe mirror image of taxes, they can — in theory — provide incentives to address environmental problems.But, in practice, a variety of subsidies are believed to promote economically inefficient and environmentallyunsound practices. Here, we consider two examples: the below-cost sale of timber by the U.S. ForestService; and explicit and implicit subsidies that are conveyed to suppliers of energy.
5.1 Below-Cost Timber Sales
The public lands of the United States, which encompass more than 25 percent of the nation's entireland base, contain valuable natural resources, such as timber, minerals, coal, oil, and natural gas, all ofwhich are valued (and priced) in the market place. These lands also provide a variety of public goods,which tend not to be fully valued and priced in the market: wilderness, fish and wildlife habitats,watersheds, and recreational opportunities. Because it is difficult for individual landowners to provide thesepublic goods profitably, the burden for providing such environmental amenities tends to fall on the publiclands.
Subsidies that benefit selected extractive industries may impede the provision of such amenities onpublic lands. Below-cost timber sales — where the U.S. Forest Service does not recover the full cost ofmaking timber available — constitute an important case in point. It has been estimated that removal ofthese subsidies would foster environmental protection and could save taxpayers up to $1.2 billion over fiveyears.110
Congress has mandated that the Forest Service pursue a policy of multiple-use management fortimber, recreation, wildlife habitat, and watershed purposes.111 But the Forest Service is not under legalor regulatory requirements to sell its timber at a price that will recover the government's costs of growingand marketing that timber, and a substantial amount of publicly-owned timber is sold below cost. That is,the commercial activity of moving timber from public lands into the marketplace frequently costs the Federal
112See: Senator Richard Bryan, Statements before Senate, Oct. 28, 1997; Conference Report on Interior AppropriationsAct.
113See: Repetto, Robert and Malcolm Gillis, eds. Public Policies and the Misuse of Forest Resources. New York:Cambridge University Press, 1988; and Hyde, William F. "Timber Economics in the Rockies: Efficiency and ManagementOptions." Land Economics 57(1981):630-37.
114On November 11, 1997, after a prolonged debate on below-cost timber sales, President Clinton signed a spending billthat included provisions to continue subsidies for the construction of logging roads in national forests.
115See: Shelby, Mike, Robert Shackleton, Malcolm Shealy, and Alex Cristofaro. The Climate Change Implications ofEliminating U.S. Energy (and Related) Subsidies. Washington, D.C.: U.S. Environmental Protection Agency, October1997.
116See: Alliance to Save Energy. Federal Energy Subsidies: Energy, Environmental and Fiscal Impacts. Lexington,Massachusetts, 1993.
27
government more than it gets in return. This implicit subsidy has most frequently been in the form of creditsto private lumber companies for road building.
There are approximately 380,000 miles of roads in National Forests, roughly eight times the lengthof the Interstate highway system. While they do have recreational and other uses, these roads primarilyserve as access for logging companies. They have been constructed either directly by the Forest Serviceor through a “purchaser road credit” system. The road credit system began with the 1964 Forest Roadsand Trails Act which allows the Forest Service to credit logging companies for their expenses inconstructing the logging roads they need to access timber. Under this system, companies deduct roadconstruction expenses directly from the amount they pay the Forest Service for the timber they extract.In 1996, direct outlays totaled $84 million and purchaser credits were valued at nearly $50 million.112
Claims have been made that the Forest Service's disregard of timber-production costs has led toexcessive logging in unproductive National Forests.113 In response to such concerns, severaladministrations and Congresses have considered various initiatives to deal with the problem, each of whichwould essentially direct that more attention be given to economic considerations when managing and sellingFederal timber. But, through 1997, no significant action had been taken.114
5.2 Fossil-Fuel Energy Subsidies
Because of concerns about global climate change, increased attention has been given to Federalsubsidies and other programs that promote the use of fossil fuels. One EPA study indicates that eliminatingthese subsidies would have a significant effect on reducing carbon dioxide (CO2) emissions.115 The Federalgovernment is involved in the energy sector through the tax system and through a range of individual agencyprograms. One other study indicates that these activities together cost the government $17 billionannually.116
117The Alliance to Save Energy study claims that end-use efficiency receives $1 for every $35 received by energy supply.
118See: Easterbrook, Gregg. “Greenhouse Common Sense: Why Global-Warming Economics Matters More thanScience.” U.S. News and World Report, December 1, 1997, pp. 58-62.
28
A substantial share of these subsidies and programs were enacted during the “oil crises” toencourage the development of domestic energy sources and reduce reliance on imported petroleum. Theyfavor energy supply over energy efficiency.117 Although there is an economic argument for governmentpolicies that encourage new technologies that have particularly high risk or long term payoffs, mature andconventional technologies currently receive nearly 90% of the subsidies. Furthermore, within fossil fuels,the most environmentally benign fuel — natural gas — receives only about 20% of the subsidies.
On the other hand, it should also be recognized that Federal user charges (Table 3) and insurancepremium taxes (Table 4) include significant levies on fossil fuels, and that Federal tax differentiation hastended to favor renewable energy sources and non-conventional fossil fuels (Table 7). In any event, theClinton Administration’s 1997 proposal to address global climate change includes a program of $5 billion(over five years) worth of government-funded research and development and private-industry tax creditsfor renewable energy sources and energy efficiency.118
6. WHY HAVE THERE BEEN RELATIVELY FEW APPLICATIONSOF MARKET-BASED INSTRUMENTS?
Despite the great interest given to market-based instruments by politicians in recent years and thegreat progress that has been made, market-based instruments have yet to transform fundamentally thelandscape of U.S. environmental policy. For the most part, these instruments still exist only at the fringesof regulation.
6.1 A Stock-Flow Problem
Market-based instruments represent only a trivial portion of existing regulation. The reasons forthis are many. Perhaps the most obvious is that there has not been a great deal of new environmentalregulation. Since 1990, the Clean Air Act and Safe Drinking Water Act are the only major environmentalregulations to be reauthorized. Given that Title 40 of the Code of Federal Regulations, titled “Protectionof the Environment,” contains over 14,310 pages of environmental regulations, it could take a very long timeindeed for market instruments to become the core of environmental policy, unless Congress is willing to usethem for “old” problems as well as new ones.
119Hahn, Robert W. And Robert N. Stavins. “Incentive-based Environmental Regulation: a New Era from an Old Idea?”Ecology Law Quarterly 18(1991): 1-42.
120During the mid-1980’s, the Environmental Defense Fund (EDF) was the first environmental advocacy organization toaggressively welcome the use of market-based instruments. See: Krupp, Frederic. “New Environmentalism Factors inEconomic Needs.” Wall Street Journal, November 20, 1986: p. 34.
29
6.2 Resistance from Interest Groups
Within the government environmental bureaucracy there exists a desire to see effectiveenvironmental regulation adopted, but traditional regulatory programs require regulators with a technicalor legal-based skill-set, while market-based instruments require market-trained thinkers, including MBAs,economists, and others. Members of the government bureaucracy may rationally be resisting the dissipationof their human capital.119
Although some environmental groups have increasingly welcomed the selective use of market-based instruments,120 others are concerned that increased flexibility in environmental regulation will resultin the reduction of the overall degree of environmental protection. And in parts of the environmentalcommunity, the sentiment remains that environmental quality is an inalienable right and that market-programsinappropriately condone the “right to pollute.” Lastly, some environmental professionals, like theirgovernment counterparts, may be resisting the dissipation of their human capital.
The ambivalence of the regulated community itself has also served to retard the use of market-based instruments. Many industries and companies have applauded market-based instruments in theabstract, because of the promise of flexibility and cost effectiveness. But few businesses have actuallysupported the adoption of new applications. One factor is reluctance to promote any regulation, no matterhow flexible or cost effective. Businesses may believe that political forces beyond their control mightunfavorably distort the design and implementation of these instruments. First, cost savings might be takenaway from them by an increase in the stringency of standards. Second, the design of instruments may limittheir flexibility. Third, the rules may be changed over time. For businesses to optimize environmentalinvestments, regulations not only have to be flexible, but predictable. Fourth, some firms remain concernedthat “buying the right to pollute” could lead to negative publicity. Fifth and finally, private industryrepresentatives may resist these reforms to prevent the dissipation of their human capital.
6.4 Public Resistance
The slow penetration of market-based instruments into environmental policies may also be due tothese instruments not being well understood by the general public. The benefits to consumers of marketinstruments are typically not visible, while the perceived costs can be transparent. Under traditionalcommand-and-control policies, consumers may see prices go up, but they clearly find it difficult to associatethose price increases with environmental regulations. For example, it is not readily apparent to consumersthat gasoline and electricity prices are lower than they otherwise would have been because of the use ofmarket-based programs to phase out lead or reduce SO2 emissions. At the same time, market-basedinstruments – especially charges – may suffer from making environmental costs more transparent. While
121See: Tietenberg, Tom. Emissions Trading: An Exercise in Reforming Pollution Policy. Washington, D.C.: Resourcesfor the Future, 1985.
122See: Hahn, Robert and Robert Stavins. “Economic Incentives for Environmental Protection: Integrating Theory andPractice.” American Economic Review 82 (May 1992): 464-468
123See: Hahn, Robert W. “Regulatory Constraints on Environmental Markets.” Journal of Public Economics 42(1990):149-175.
30
encouraging individuals to consciously link environmental costs and benefits may be a good thing, it cancertainly undermine the enthusiasm with which market-based instruments are embraced.
7. WHY HAS THE PERFORMANCE RECORD BEEN MIXED?
When market-based environmental policy instruments have been used, they have not alwaysperformed as predicted. Why?
7.1 Inaccurate Predictions
One reason market-based instruments have sometimes fallen short in delivering predicted costsavings is that the predictions themselves have often been unrealistic: premised on perfect performanceunder ideal conditions. That is, these predictions have assumed that the cost-minimizing allocation of thepollution-control burden among sources would be achieved, and that marginal abatement costs would beequated across all sources. In a frequently cited table, Tietenberg calculated the ratio of the cost of anactual command-and-control program to a least-cost benchmark,121 but others have mistakenly used thisratio as an indicator of the potential gains of adopting specific market-based instruments. The moreappropriate comparison would be between actual command-and-control programs and either actual orreasonably constrained theoretical market-based programs.122
In addition, predictions made during policy debates have typically ignored factors that can adverselyaffect performance: transaction costs involved in implementing market-based programs; uncertainty as tothe property rights bestowed under programs; uncompetitive market conditions; a pre-existing regulatoryenvironment that does not give firms incentives to participate; and the inability of firms’ internal decision-making capabilities to fully utilize program opportunities.
7.2 Design Problems
Many of the factors cited suggest the need for changes in the design of future market-basedinstruments. While some program design elements reflect miscalculations of market reactions, others wereknown to be problematic at the time the programs were enacted, but nevertheless were incorporated intoprograms to ensure adoption by the political process. One striking example is the “20% rule” under EPA’sEmission Trading Program.123 This rule, adopted at the insistence of the environmental community,
124There are some exceptions. Enron, for example, has attempted to use market-based instruments for its strategic benefitby becoming a leader in creating new markets for trading acid rain permits. Other firms have appointed environmental,health, and safety leaders who are familiar with a wide range of policy instruments, not solely command-and-controlapproaches, and who bring a strategic focus to their company’s pollution-control efforts. See: Hockenstein, Jeremy B.,Robert N. Stavins, and Bradley W. Whitehead. “Creating the Next Generation of Market-Based Environmental Tools.”Environment 39, number 4 (1997), pp. 12-20, 30-33.
125For a more thorough exploration of the answers to this question, see: Keohane, Nathaniel O., Richard L. Revesz, andRobert N. Stavins. “The Positive Political Economy of Instrument Choice in Environmental Policy.” EnvironmentalEconomics and Public Policy, eds. Paul Portney and Robert Schwab. London: Edward Elgar, Ltd., forthcoming 1998;and Stavins, Robert N. “What Can We Learn from the Grand Policy Experiment? Lessons from SO2 Allowance Trading.”Journal of Economic Perspectives, volume 12, number 3, summer 1998, pp. 69-88.
31
stipulates that each time a permit is traded, the amount of pollution authorized thereunder must be reducedby 20%. Since permits that are not traded retain their full quantity value, this regulation discourages permittrading and thereby increases regulatory costs.
7.3 Limitations in Firms’ Structure
A third explanation for the mixed performance of implemented market-based instruments is thatfirms are simply not well equipped internally to make the decisions necessary to fully utilize theseinstruments. Since market-based instruments have been used on a limited basis only, and firms are notcertain that these instruments will be a lasting component on the regulatory landscape, most companies havechosen not to reorganize their internal structure to fully exploit the cost savings these instruments offer.Rather, most firms continue to have organizations that are experienced in minimizing the costs of complyingwith command-and-control regulations, not in making the strategic decisions allowed by market-basedinstruments.124
The focus of environmental, health, and safety departments in private firms has been primarily onproblem avoidance and risk management, rather than on the creation of opportunities made possible bymarket-based instruments. This focus has developed because of the strict rules companies have facedunder command-and-control regulation, in response to which companies have built skills and developedprocesses that comply with regulations, but do not help them benefit competitively from environmentaldecisions. Absent significant changes in structure and personnel, the full potential of market-basedinstruments will not be realized.
8. THE CHANGING POLITICS OF MARKET-BASED INSTRUMENTS
Given the historical lack of receptiveness by the political process to market-based approaches toenvironmental protection, why has there been a recent rise in the use of market-based approaches?125 Itwould be gratifying to believe that increased understanding of market-based instruments had played a largepart in fostering their increased political acceptance, but how important has this really been? In 1981,political scientist Steven Kelman surveyed Congressional staff members, and found that support andopposition to market-based environmental policy instruments was based largely on ideological grounds:
126See: Kelman, Steven. What Price Incentives?: Economists and the Environment. Boston: Auburn House, 1981.
127But there has been some increased understanding of market-based approaches among policy makers. This has partlybeen due to increased understanding by their staffs, a function — to some degree — of the economics training that isnow common in law schools, and of the proliferation of schools of public policy. See: Hahn, Robert W. and Robert N.Stavins. “Incentive-based Environmental Regulation: a New Era from an Old Idea?” Ecology Law Quarterly 18(1991):1-42.
128See: U.S. Environmental Protection Agency, Environmental Investments: The Cost of a Clean Environment, reportof the administrator to Congress. Washington, D.C.: U.S. EPA, December 1990; and Jaffe, Adam B., Steven R. Peterson,Paul R. Portney, and Robert N. Stavins. "Environmental Regulation and the Competitiveness of U.S. Manufacturing:What Does the Evidence Tells Us?" Journal of Economic Literature 33(1995):132-163.
129But the environmental advocacy community is by no means unanimous in its support for market-based instruments.See, for example: Seligman, Daniel A. Air Pollution Emissions Trading: Opportunity or Scam? A Guide for Activists.San Francisco: Sierra Club, 1994.
130When the memberships (and financial resources) of other environmental advocacy groups subsequently declined withthe election of the environmentally-friendly Clinton-Gore Administration, EDF continued to prosper and grow. See:Lowry, Robert C. “The Political Economy of Environmental Citizen Groups.” Unpublished Ph.D. thesis, HarvardUniversity, 1993.
32
Republicans who supported the concept of economic-incentive approaches offered as a reason theassertion that “the free market works,” or “less government intervention” is desirable, without any realawareness or understanding of the economic arguments for market-based programs. Likewise, Democraticopposition was largely based upon analogously ideological factors, with little or no apparent understandingof the real advantages or disadvantages of the various instruments.126 What would happen if we were toreplicate Kelman’s survey today? My refutable hypothesis is that we would find increased support fromRepublicans, greatly increased support from Democrats, but insufficient improvements in understanding toexplain these changes.127 So what else has mattered?
First, one factor has surely been increased pollution control costs, which have led to greaterdemand for cost-effective instruments. By the late 1980's, even political liberals and environmentalists werebeginning to question whether CAC regulations could produce further gains in environmental quality.During the previous twenty years, pollution abatement costs had continually increased, as stricter standardsmoved the private sector up the marginal cost-of-control function. By 1990, U.S. pollution control costshad reached $125 billion annually, nearly a 300% increase in real terms from 1972 levels.128
Second, a factor that became important in the late 1980's was strong and vocal support from somesegments of the environmental community.129 By supporting tradeable permits for acid rain control, theEnvironmental Defense Fund (EDF) seized a market niche in the environmental movement, and successfullydistinguished itself from other groups.130 Related to this, a third factor was that the SO2 allowance tradingprogram, the leaded gasoline phasedown, and the CFC phaseout were all designed to reduce emissions,not simply to reallocate them cost-effectively among sources. Market-based instruments are most likelyto be politically acceptable when proposed to achieve environmental improvements that would nototherwise be feasible (politically or economically).
131The Reagan Administration enthusiastically embraced a market-oriented ideology, but demonstrated no interest inemploying actual market-based policies in the environmental area.
132Within the White House, among the most active and influential enthusiasts of market-based environmentalinstruments were: Counsel Boyden Gray and his Deputy John Schmitz, Domestic Policy Adviser Roger Porter, Councilof Economic Advisers (CEA) Member Richard Schmalensee, CEA Senior Staff Economist Robert Hahn, and Office ofManagement and Budget Associate Director Robert Grady. At EPA, Administrator William Reilly — a “card-carryingenvironmentalist” — enjoyed valuable credibility with environmental advocacy groups; and Deputy Administrator HenryHabicht was a key, early supporter of market-based instruments. In the Congress, Senators Timothy Wirth and JohnHeinz provided high-profile, bi-partisan support for the SO2 allowance trading system and, more broadly, for a widevariety of market-based instruments for various environmental problems through their “Project 88” (Stavins 1988). And,finally, in the environmental community, EDF Executive Director Fred Krupp, Senior Economist Daniel Dudek, and StaffAttorney Joseph Goffman worked closely with the White House to develop the initial allowance trading proposal.Moreover, a number of individuals within the government supported market-based instruments as far back as the Carter
33
Fourth, deliberations regarding the SO2 allowance system, the lead system, and CFC tradingdiffered from previous attempts by economists to influence environmental policy in an important way: theseparation of ends from means, i.e. the separation of consideration of goals and targets from the policyinstruments used to achieve those targets. By accepting — implicitly or otherwise — the politicallyidentified (and potentially inefficient) goal, the ten-million ton reduction of SO2 emissions, for example,economists were able to focus successfully on the importance of adopting a cost-effective means ofachieving that goal. The risk, of course, was “designing a fast train to the wrong station.”
Fifth, acid rain was an unregulated problem until the SO2 allowance trading program of 1990; andthe same can be said for leaded gasoline and CFC’s. Hence, there were no existing constituencies — inthe private sector, the environmental advocacy community, or government — for the status quo approach,because there was no status quo approach. We should be more optimistic about introducing market-based instruments for "new" problems, such as global climate change, than for existing, highly regulatedproblems, such as abandoned hazardous waste sites.
Sixth, by the late 1980's, there had already been a perceptible shift of the political center towarda more favorable view of using markets to solve social problems. The Bush Administration, whichproposed the SO2 allowance trading program and then championed it through an initially resistantDemocratic Congress, was (at least in its first two years) “moderate Republican;” and phrases such as“fiscally responsible environmental protection” and “harnessing market forces to protect the environment”do have the sound of quintessential moderate Republican issues.131 But, beyond this, support for market-oriented solutions to various social problems had been increasing across the political spectrum for theprevious fifteen years, as was evidenced by deliberations on deregulation of the airline, telecommunications,trucking, railroad, and banking industries. Indeed, by 1990, the concept (or at least the phrase), “market-based environmental policy,” had evolved from being politically problematic to politically attractive.
Seventh, the adoption of the SO2 allowance trading program for acid rain control — like any majorinnovation in public policy — can partly be attributed to a healthy dose of chance that placed specificpersons in key positions, in this case at the White House, EPA, the Congress, and environmentalorganizations.132 The result was what remains the golden era for market-based environmental strategies.
Administration, helping to lay the groundwork for what was to come.
133See, for example: Goldstein, Jon B. “The Prospects for Using Market Incentives to Conserve Biological Diversity.”Environmental Law 21(1991), Northwestern School of Law, Portland, Oregon; and Bean, Michael J. “Shelter from theStorm: Endangered Species and Landownders Alike Deserve a Safe Harbor.” The New Democrat, March/April 1997,pp. 20-21.
134See: U.S. Environmental Protection Agency. “EPA Proposes Emissions Trading Program to Help Protect Eastern U.S.from Smog.” Press Release, April 29, 1998.
135See the chapter in this volume on global climate policy. Also see: Fisher, B., S. Barrett, P. Bohm, B. Fisher, M. Kuroda,J. Mubazi, A. Shah, and R. Stavins. “Policy Instruments to Combat Climate Change.” Climate Change 1995: Economicand Social Dimensions of Climate Change, eds. J.P. Bruce, H. Lee, and E.F. Haites, pp. 397-439. Intergovernmental Panelon Climate Change, Working Group III. Cambridge, England: Cambridge University Press, 1996; Hahn, Robert and RobertStavins. “Trading in Greenhouse Permits: A Critical Examination of Design and Implementation Issues.” ShapingNational Responses to Climate Change: A Post-Rio Policy Guide, ed. Henry Lee, pp. 177-217. Cambridge: Island Press,1995; Schmalensee, Richard. Greenhouse Policy Architecture and Institutions. Paper prepared for National Bureau ofEconomic Research conference, “Economics and Policy Issues in Global Warming: An Assessment of theIntergovernmental Panel Report,” Snowmass, Colorado, July 23-24, 1996; and Stavins, Robert N. “Policy Instrumentsfor Climate Change: How Can National Governments Address a Global Problem?” The University of Chicago LegalForum, volume 1997, pp. 293-329.
34
9. CONCLUSION
Some eighty years ago, economists first proposed the use of corrective taxes to internalizeenvironmental and other externalities. Fifty years later, the portfolio of potential economic-incentiveinstruments was expanded to include quantity-based mechanisms — tradeable permits. Thus, economic-incentive approaches to environmental protection are clearly not a new policy idea. Over the past twodecades, they have held varying degrees of prominence in environmental policy discussions.
Market-based instruments have now moved center stage, and policy debates look very differentfrom the time when these ideas were characterized as “licenses to pollute” or dismissed as completelyimpractical. Market-based instruments are considered seriously for each and every environmental problemthat is tackled, ranging from endangered species preservation133 to regional smog134 and what may be thegreatest of environmental problems, the greenhouse effect and global climate change.135 It seems clear thatmarket-based instruments — and, in particular, tradeable permit systems — will enjoy increasingacceptance in the years ahead.
No particular form of government intervention, no individual policy instrument — whether market-based or conventional — is appropriate for all environmental problems. Which instrument is best in anygiven situation depends upon a variety of characteristics of the environmental problem, and the social,political, and economic context in which it is being regulated. There is no policy panacea. Indeed, the realchallenge for bureaucrats, elected officials, and other participants in the environmental policy process comesin analyzing and then selecting the best instrument for each situation that arises.
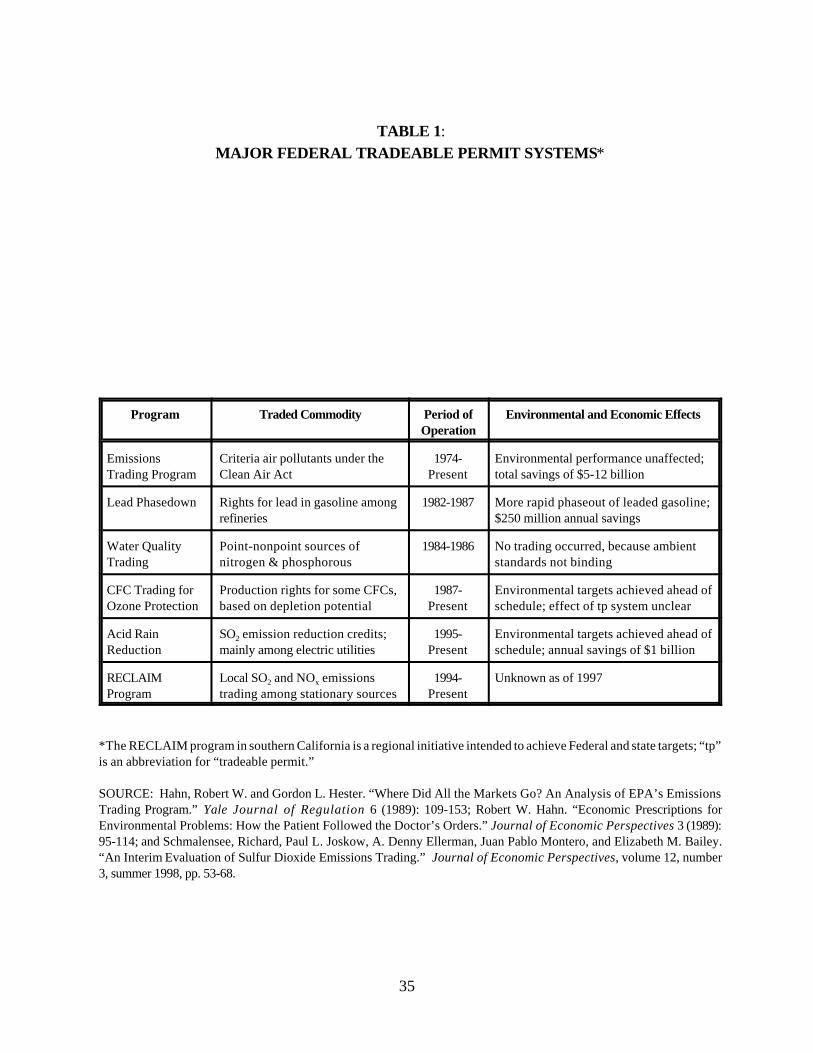
35
MAJOR FEDERAL TRADEABLE PERMIT SYSTEMS*
Program Traded Commodity Period ofOperation
Environmental and Economic Effects
EmissionsTrading Program
Criteria air pollutants under theClean Air Act
1974-Present
Environmental performance unaffected;total savings of $5-12 billion
Lead Phasedown Rights for lead in gasoline amongrefineries
1982-1987 More rapid phaseout of leaded gasoline;$250 million annual savings
Water QualityTrading
Point-nonpoint sources ofnitrogen & phosphorous
1984-1986 No trading occurred, because ambientstandards not binding
CFC Trading forOzone Protection
Production rights for some CFCs,based on depletion potential
1987-Present
Environmental targets achieved ahead ofschedule; effect of tp system unclear
Acid RainReduction
SO2 emission reduction credits;mainly among electric utilities
1995-Present
Environmental targets achieved ahead ofschedule; annual savings of $1 billion
RECLAIMProgram
Local SO2 and NOx emissionstrading among stationary sources
1994-Present
Unknown as of 1997
*The RECLAIM program in southern California is a regional initiative intended to achieve Federal and state targets; “tp”is an abbreviation for “tradeable permit.”
SOURCE: Hahn, Robert W. and Gordon L. Hester. “Where Did All the Markets Go? An Analysis of EPA’s EmissionsTrading Program.” Yale Journal of Regulation 6 (1989): 109-153; Robert W. Hahn. “Economic Prescriptions forEnvironmental Problems: How the Patient Followed the Doctor’s Orders.” Journal of Economic Perspectives 3 (1989):95-114; and Schmalensee, Richard, Paul L. Joskow, A. Denny Ellerman, Juan Pablo Montero, and Elizabeth M. Bailey.“An Interim Evaluation of Sulfur Dioxide Emissions Trading.” Journal of Economic Perspectives, volume 12, number3, summer 1998, pp. 53-68.
TABLE 1:
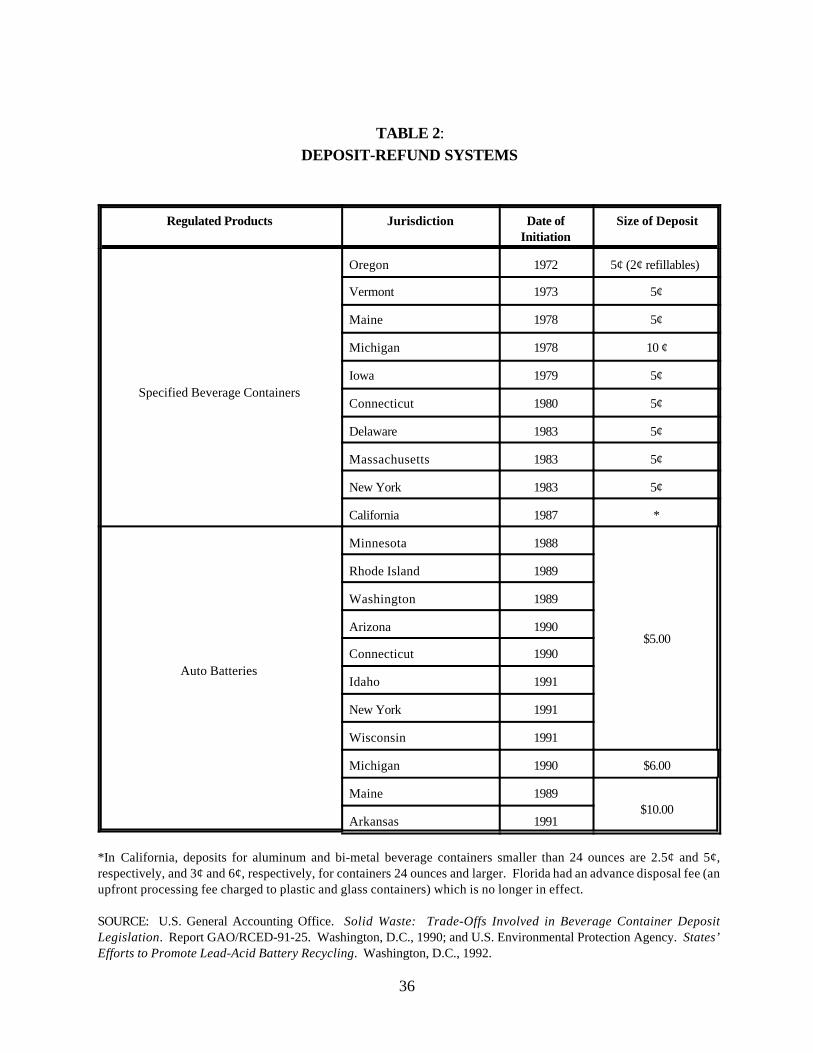
36
DEPOSIT-REFUND SYSTEMS
Regulated Products Jurisdiction Date ofInitiation
Size of Deposit
Specified Beverage Containers
Oregon 1972 5¢ (2¢ refillables)
Vermont 1973 5¢
Maine 1978 5¢
Michigan 1978 10 ¢
Iowa 1979 5¢
Connecticut 1980 5¢
Delaware 1983 5¢
Massachusetts 1983 5¢
New York 1983 5¢
California 1987 *
Auto Batteries
Minnesota 1988
$5.00
Rhode Island 1989
Washington 1989
Arizona 1990
Connecticut 1990
Idaho 1991
New York 1991
Wisconsin 1991
Michigan 1990 $6.00
Maine 1989$10.00
Arkansas 1991
*In California, deposits for aluminum and bi-metal beverage containers smaller than 24 ounces are 2.5¢ and 5¢,respectively, and 3¢ and 6¢, respectively, for containers 24 ounces and larger. Florida had an advance disposal fee (anupfront processing fee charged to plastic and glass containers) which is no longer in effect.
SOURCE: U.S. General Accounting Office. Solid Waste: Trade-Offs Involved in Beverage Container DepositLegislation. Report GAO/RCED-91-25. Washington, D.C., 1990; and U.S. Environmental Protection Agency. States’Efforts to Promote Lead-Acid Battery Recycling. Washington, D.C., 1992.
TABLE 2:
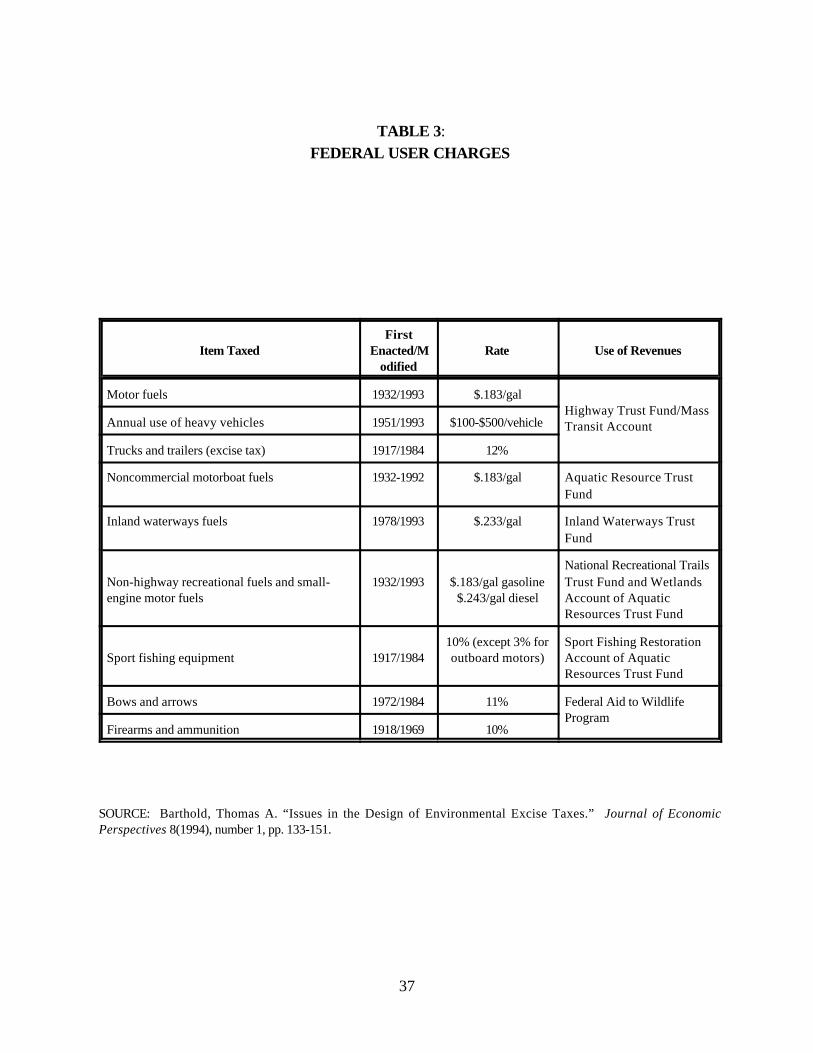
37
FEDERAL USER CHARGES
Item TaxedFirst
Enacted/Modified
Rate Use of Revenues
Motor fuels 1932/1993 $.183/galHighway Trust Fund/MassTransit AccountAnnual use of heavy vehicles 1951/1993 $100-$500/vehicle
Trucks and trailers (excise tax) 1917/1984 12%
Noncommercial motorboat fuels 1932-1992 $.183/gal Aquatic Resource TrustFund
Inland waterways fuels 1978/1993 $.233/gal Inland Waterways TrustFund
Non-highway recreational fuels and small-engine motor fuels
1932/1993 $.183/gal gasoline$.243/gal diesel
National Recreational TrailsTrust Fund and WetlandsAccount of AquaticResources Trust Fund
Sport fishing equipment 1917/198410% (except 3% foroutboard motors)
Sport Fishing RestorationAccount of AquaticResources Trust Fund
Bows and arrows 1972/1984 11% Federal Aid to WildlifeProgram
Firearms and ammunition 1918/1969 10%
SOURCE: Barthold, Thomas A. “Issues in the Design of Environmental Excise Taxes.” Journal of EconomicPerspectives 8(1994), number 1, pp. 133-151.
TABLE 3:
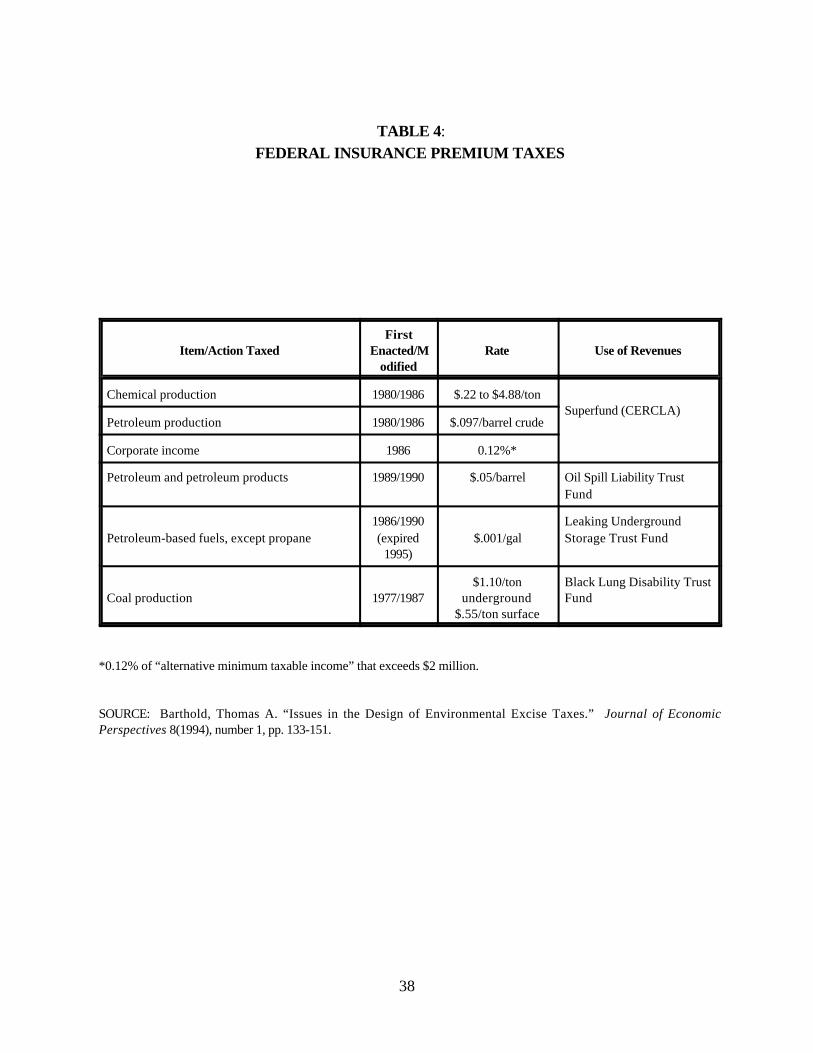
38
FEDERAL INSURANCE PREMIUM TAXES
Item/Action TaxedFirst
Enacted/Modified
Rate Use of Revenues
Chemical production 1980/1986 $.22 to $4.88/tonSuperfund (CERCLA)
Petroleum production 1980/1986 $.097/barrel crude
Corporate income 1986 0.12%*
Petroleum and petroleum products 1989/1990 $.05/barrel Oil Spill Liability TrustFund
Petroleum-based fuels, except propane1986/1990(expired
1995)$.001/gal
Leaking UndergroundStorage Trust Fund
Coal production 1977/1987$1.10/ton
underground$.55/ton surface
Black Lung Disability TrustFund
*0.12% of “alternative minimum taxable income” that exceeds $2 million.
SOURCE: Barthold, Thomas A. “Issues in the Design of Environmental Excise Taxes.” Journal of EconomicPerspectives 8(1994), number 1, pp. 133-151.
TABLE 4:
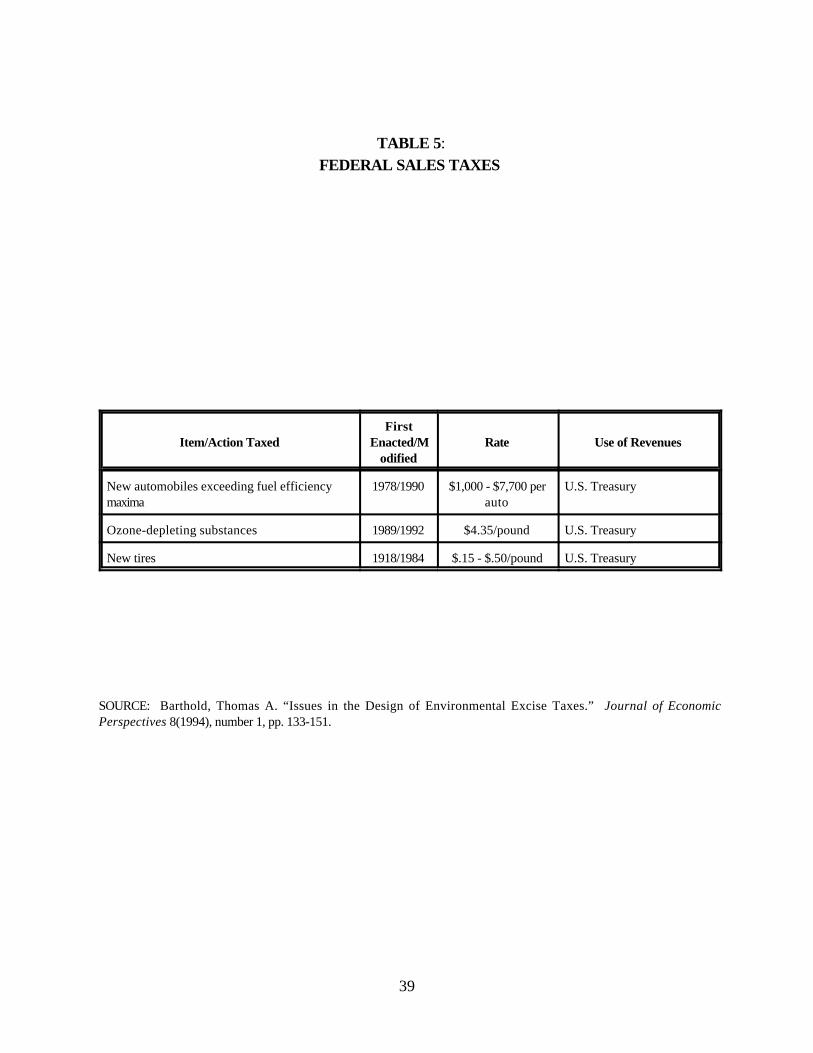
39
FEDERAL SALES TAXES
Item/Action TaxedFirst
Enacted/Modified
Rate Use of Revenues
New automobiles exceeding fuel efficiencymaxima
1978/1990 $1,000 - $7,700 perauto
U.S. Treasury
Ozone-depleting substances 1989/1992 $4.35/pound U.S. Treasury
New tires 1918/1984 $.15 - $.50/pound U.S. Treasury
SOURCE: Barthold, Thomas A. “Issues in the Design of Environmental Excise Taxes.” Journal of EconomicPerspectives 8(1994), number 1, pp. 133-151.
TABLE 5:
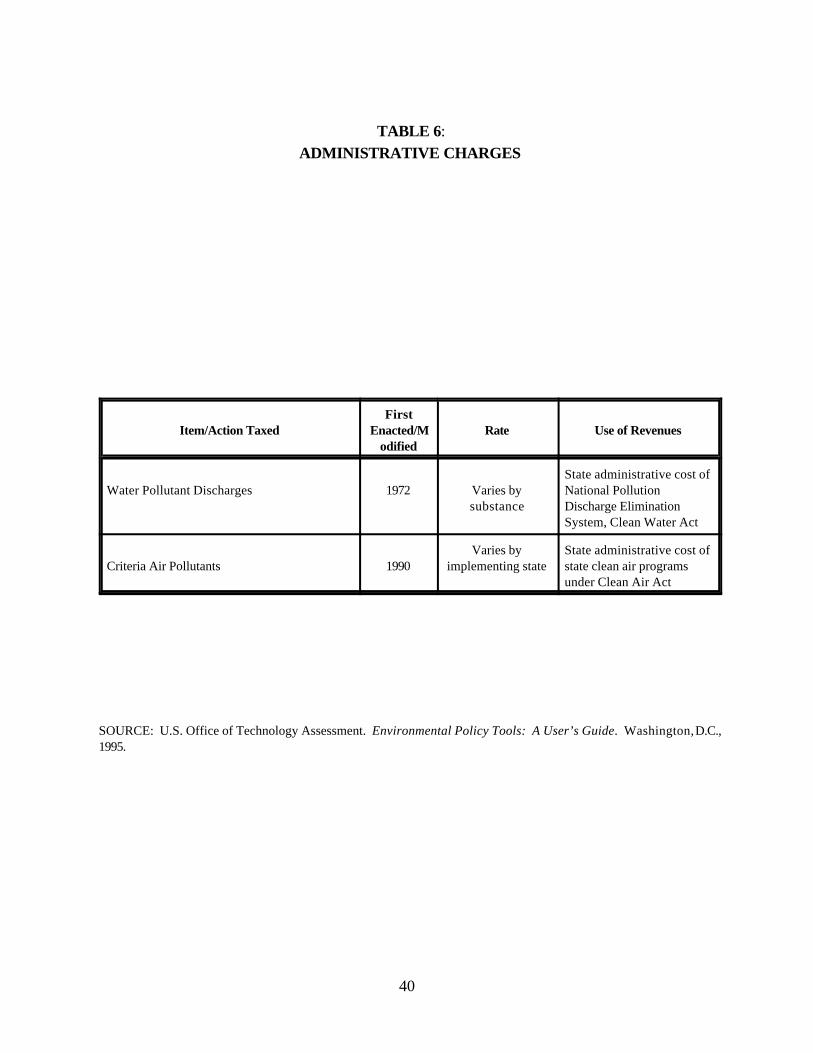
40
ADMINISTRATIVE CHARGES
Item/Action TaxedFirst
Enacted/Modified
Rate Use of Revenues
Water Pollutant Discharges 1972 Varies bysubstance
State administrative cost ofNational PollutionDischarge EliminationSystem, Clean Water Act
Criteria Air Pollutants 1990Varies by
implementing stateState administrative cost ofstate clean air programsunder Clean Air Act
SOURCE: U.S. Office of Technology Assessment. Environmental Policy Tools: A User’s Guide. Washington, D.C.,1995.
TABLE 6:
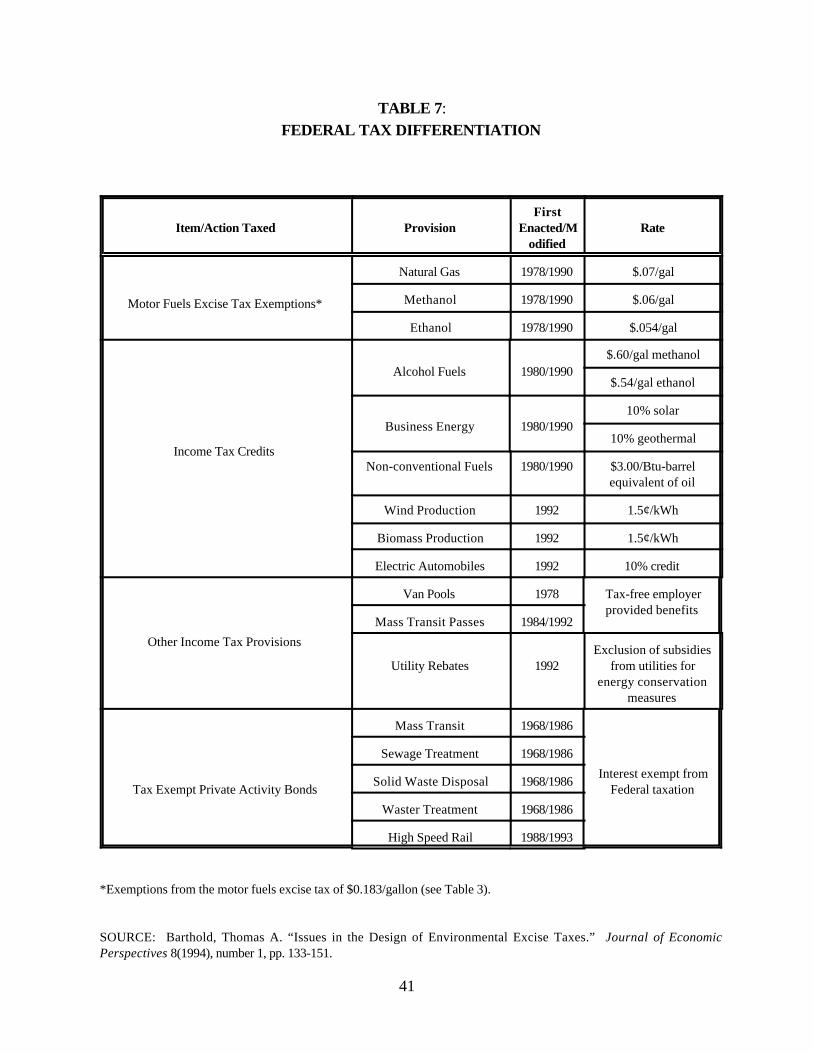
41
FEDERAL TAX DIFFERENTIATION
Item/Action Taxed ProvisionFirst
Enacted/Modified
Rate
Motor Fuels Excise Tax Exemptions*
Natural Gas 1978/1990 $.07/gal
Methanol 1978/1990 $.06/gal
Ethanol 1978/1990 $.054/gal
Income Tax Credits
Alcohol Fuels 1980/1990$.60/gal methanol
$.54/gal ethanol
Business Energy 1980/199010% solar
10% geothermal
Non-conventional Fuels 1980/1990 $3.00/Btu-barrelequivalent of oil
Wind Production 1992 1.5¢/kWh
Biomass Production 1992 1.5¢/kWh
Electric Automobiles 1992 10% credit
Other Income Tax Provisions
Van Pools 1978 Tax-free employerprovided benefits
Mass Transit Passes 1984/1992
Utility Rebates 1992Exclusion of subsidies
from utilities forenergy conservation
measures
Tax Exempt Private Activity Bonds
Mass Transit 1968/1986
Interest exempt fromFederal taxation
Sewage Treatment 1968/1986
Solid Waste Disposal 1968/1986
Waster Treatment 1968/1986
High Speed Rail 1988/1993
*Exemptions from the motor fuels excise tax of $0.183/gallon (see Table 3).
SOURCE: Barthold, Thomas A. “Issues in the Design of Environmental Excise Taxes.” Journal of EconomicPerspectives 8(1994), number 1, pp. 133-151.
TABLE 7:
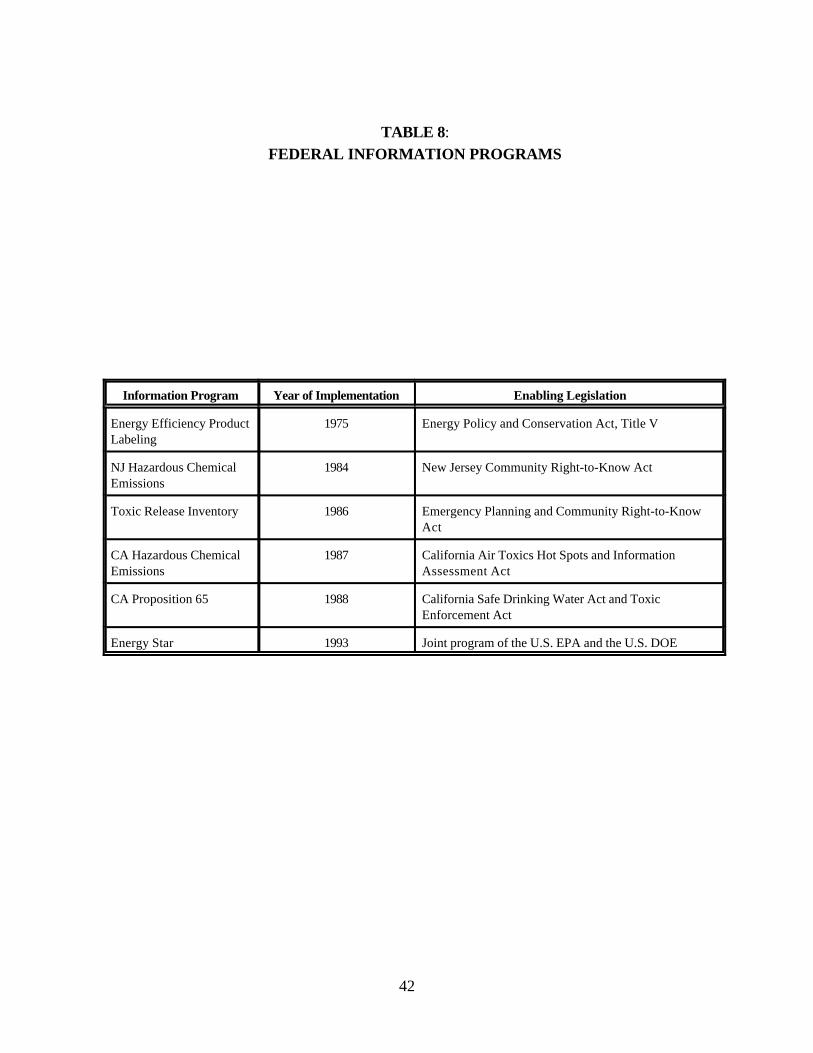
42
FEDERAL INFORMATION PROGRAMS
Information Program Year of Implementation Enabling Legislation
Energy Efficiency ProductLabeling
1975 Energy Policy and Conservation Act, Title V
NJ Hazardous ChemicalEmissions
1984 New Jersey Community Right-to-Know Act
Toxic Release Inventory 1986 Emergency Planning and Community Right-to-KnowAct
CA Hazardous ChemicalEmissions
1987 California Air Toxics Hot Spots and InformationAssessment Act
CA Proposition 65 1988 California Safe Drinking Water Act and ToxicEnforcement Act
Energy Star 1993 Joint program of the U.S. EPA and the U.S. DOE
TABLE 8: